SoResilere—A Social Resilience Index Applied to Portuguese Flood Disaster-Affected Municipalities
Abstract
:1. Introduction
2. State of the Art
2.1. Social Resilience Assessments and Indexes: International Context
2.2. Resilience Assessments and Indexes: The Portuguese Context
2.3. Flood-Related Indexes: The Portuguese Context
3. Materials and Methods
3.1. Case Study Selection
3.2. Data Collection—Sources and Data Required versus Data Available
3.3. Reducing the Number of Indicators
3.4. Data Analysis
4. Results
4.1. Results for PCA of the Quantitative Data
| Condition | KMO | KMO Classification According to [38] | Explained Variance (Cumulative %—Extraction of Squared Loadings) |
|---|---|---|---|
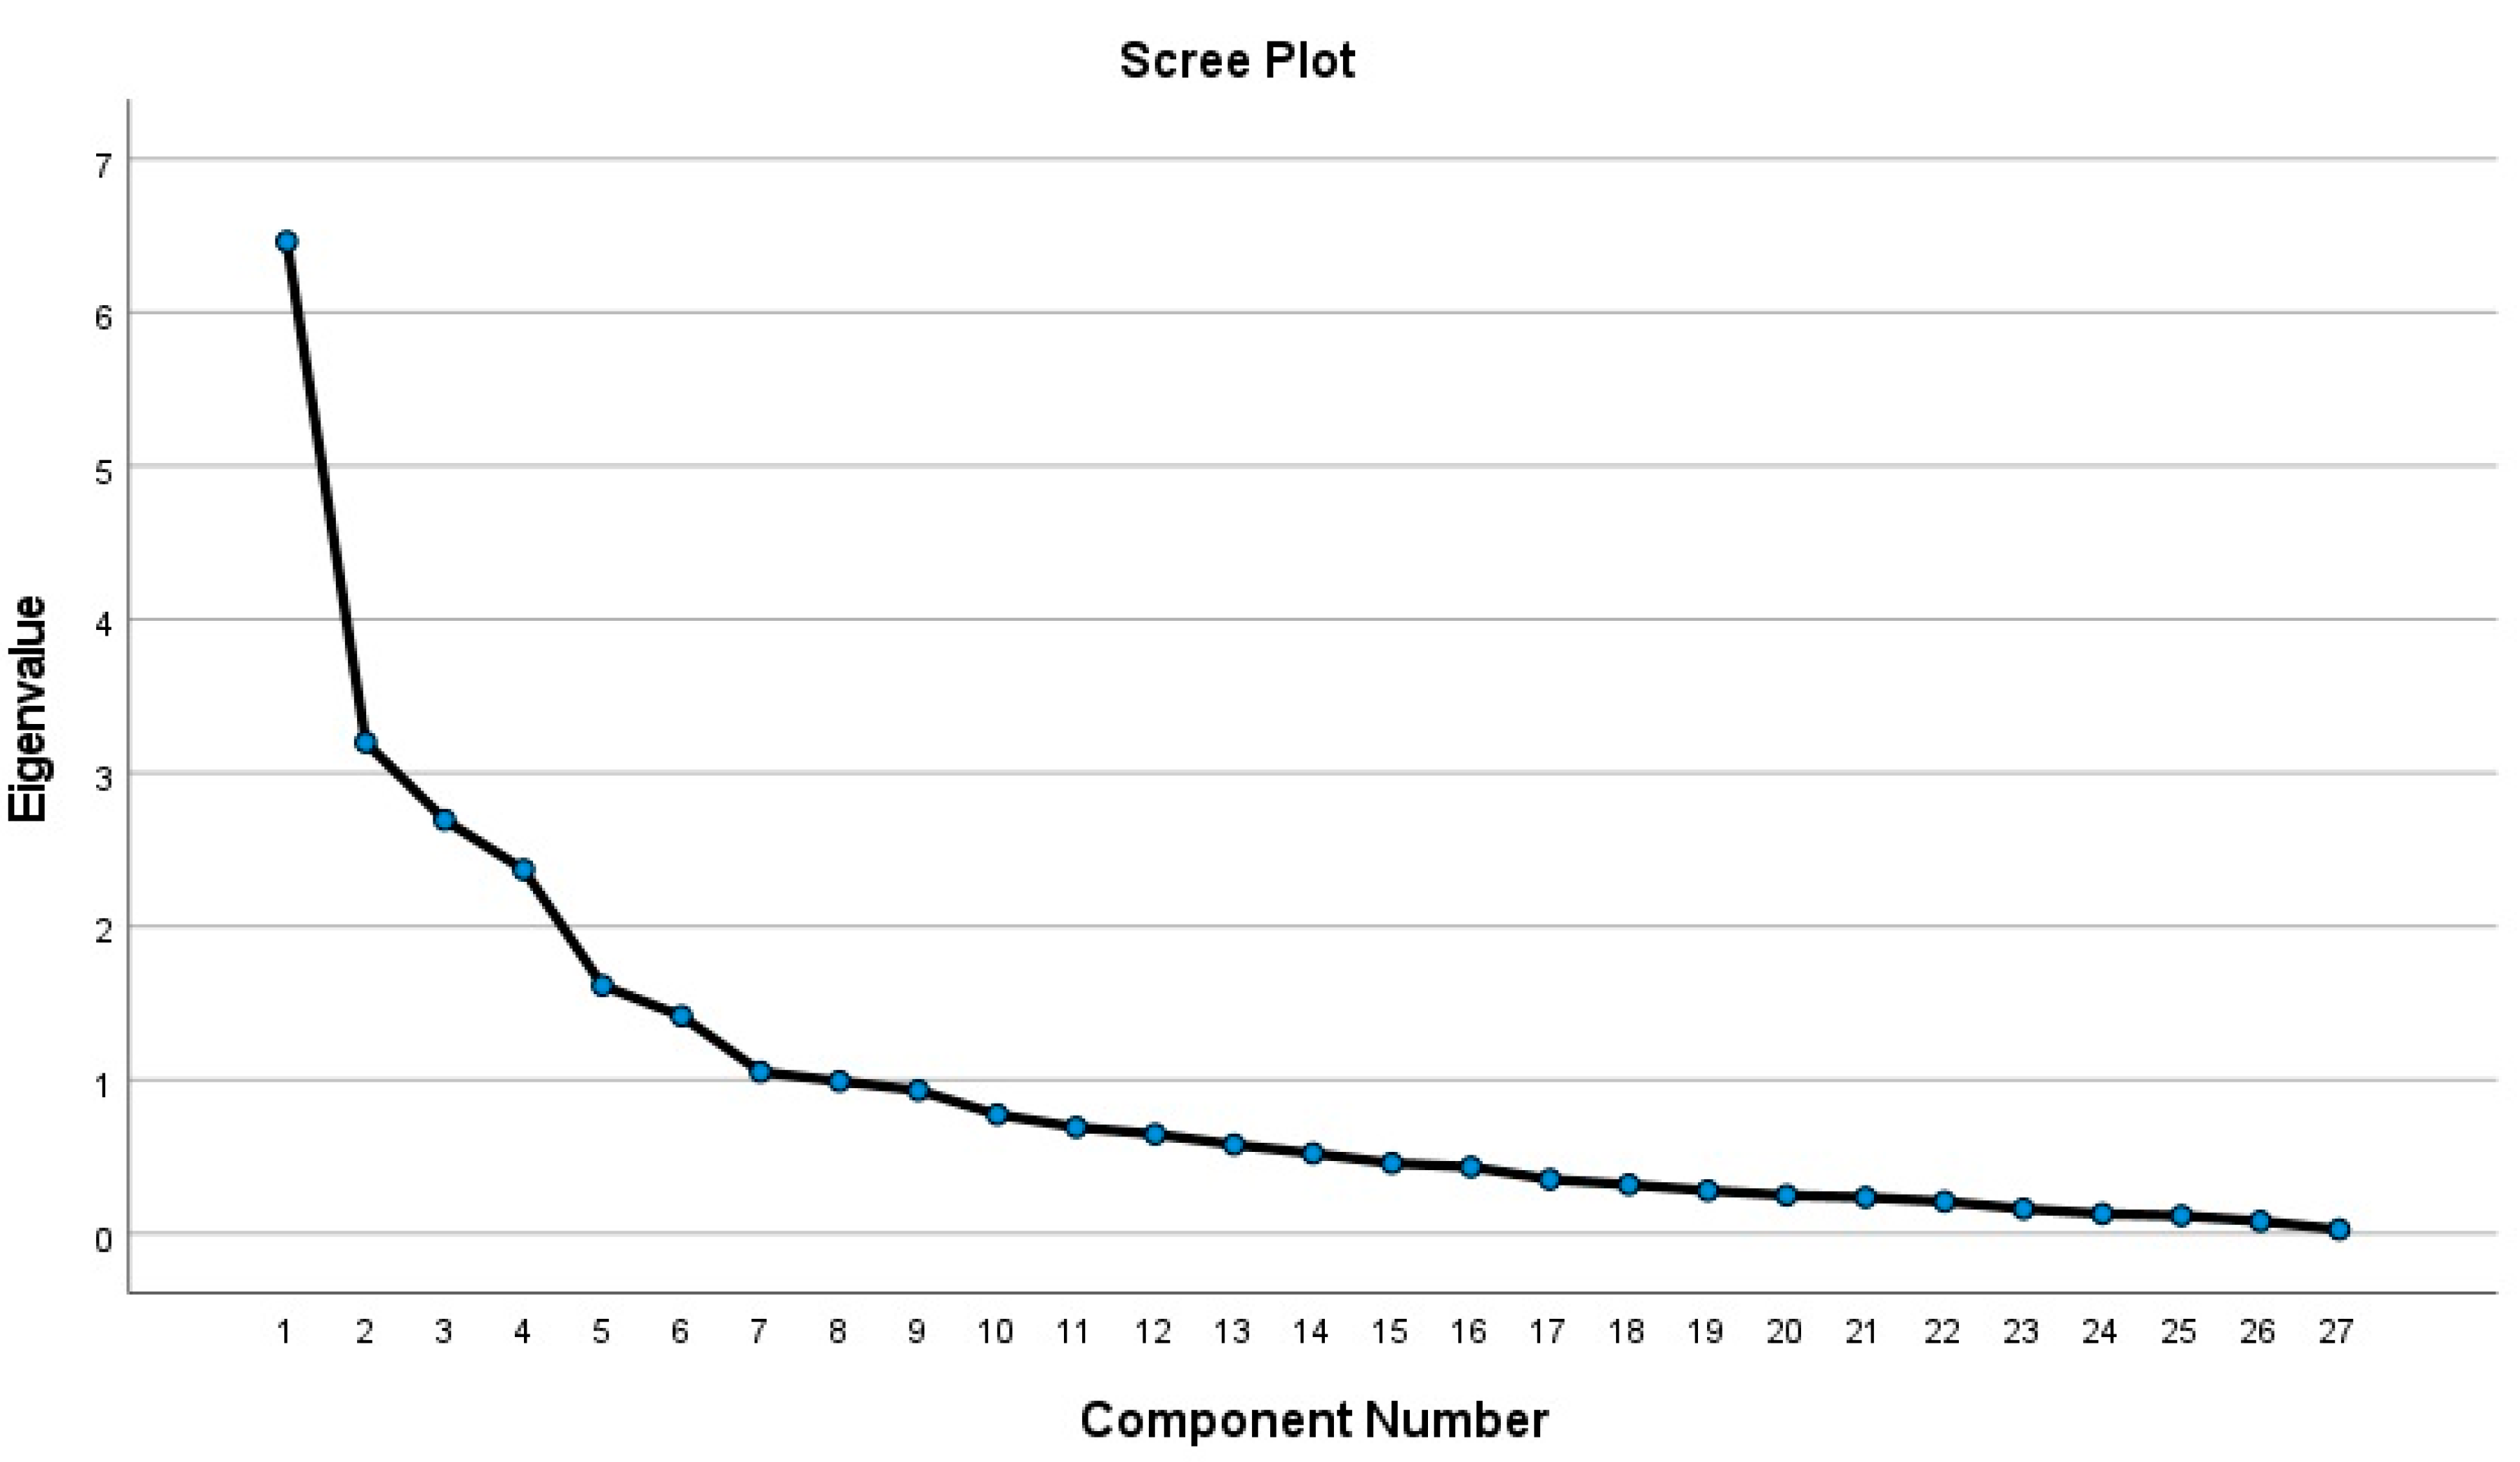
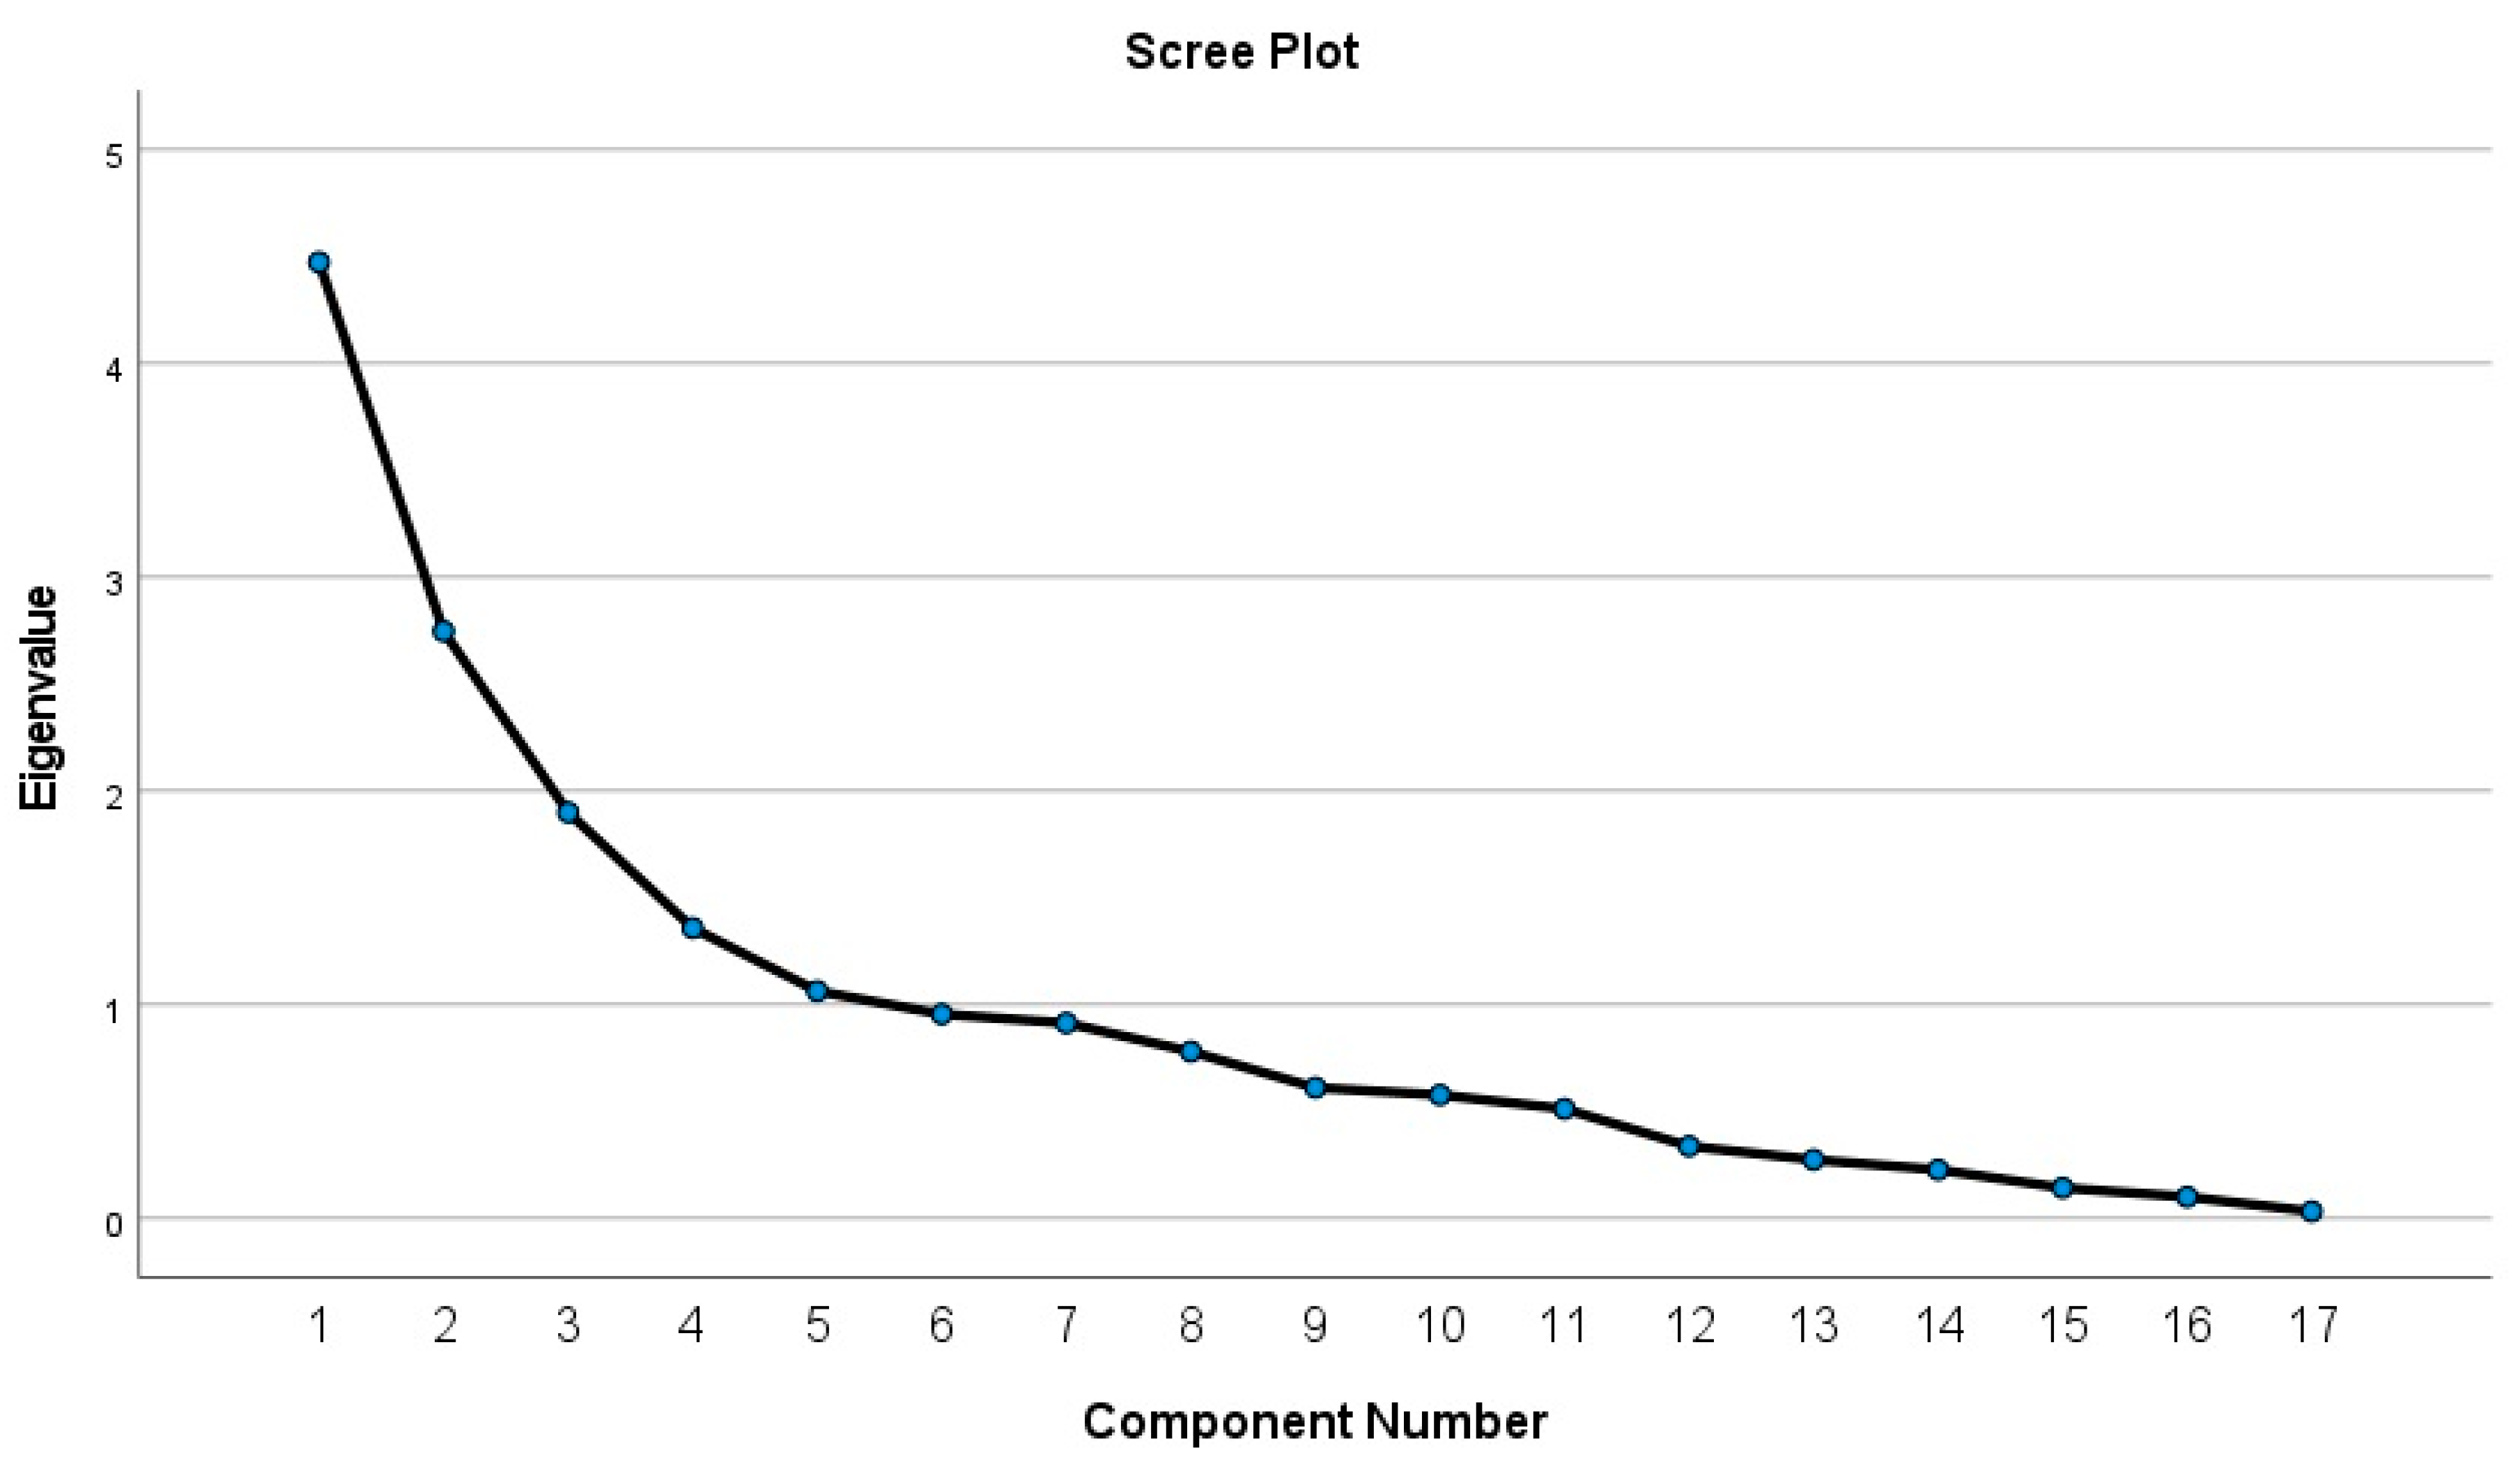
| 27 Variables and 255 municipalities. | 0.774 | Average | Seven factors explain 69.672% of the variance (with an eigenvalue higher than 1). From those, the first six explain 65.771% of the variance. Validating with the scree plot, only the first 6 factors should be considered since there’s a clear change in the inflexion of the scree plot (see Figure 2) and also the eigenvalue of the 6th factor is above 1 (1.417—see Table A4), the 7th was excluded as the eigenvalue is very close to 1 (1.053—see Table A4). |
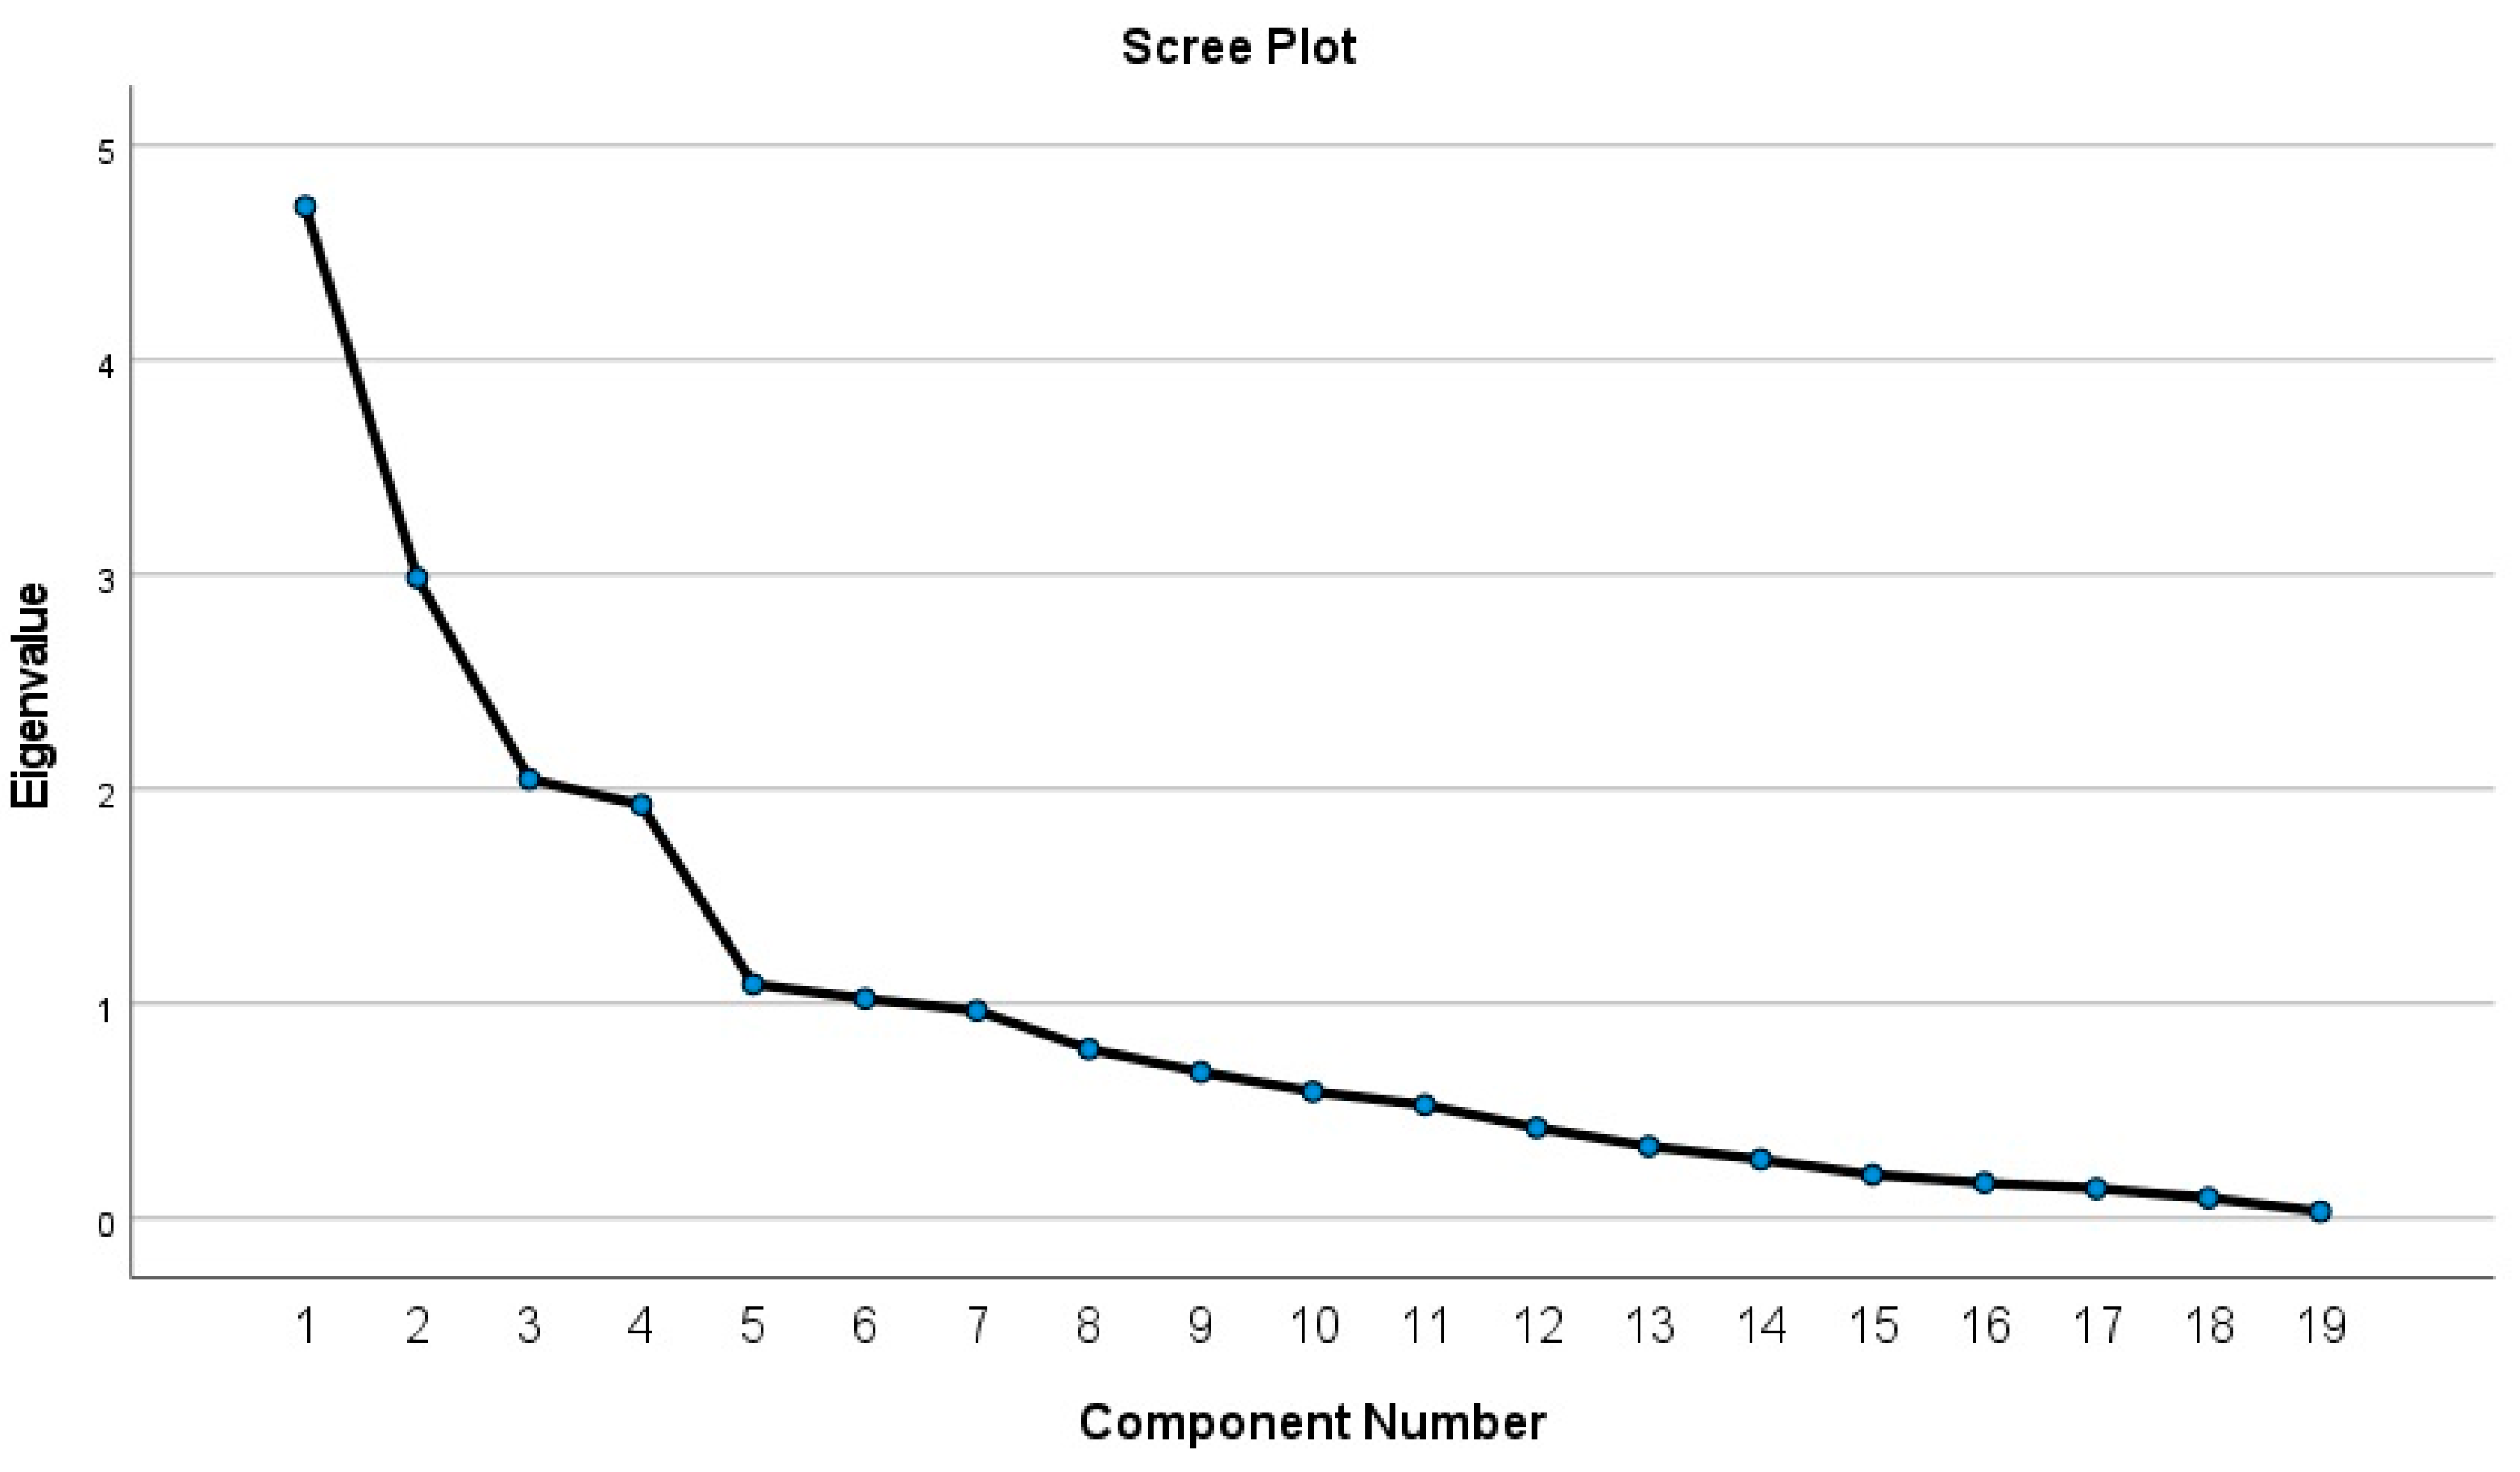
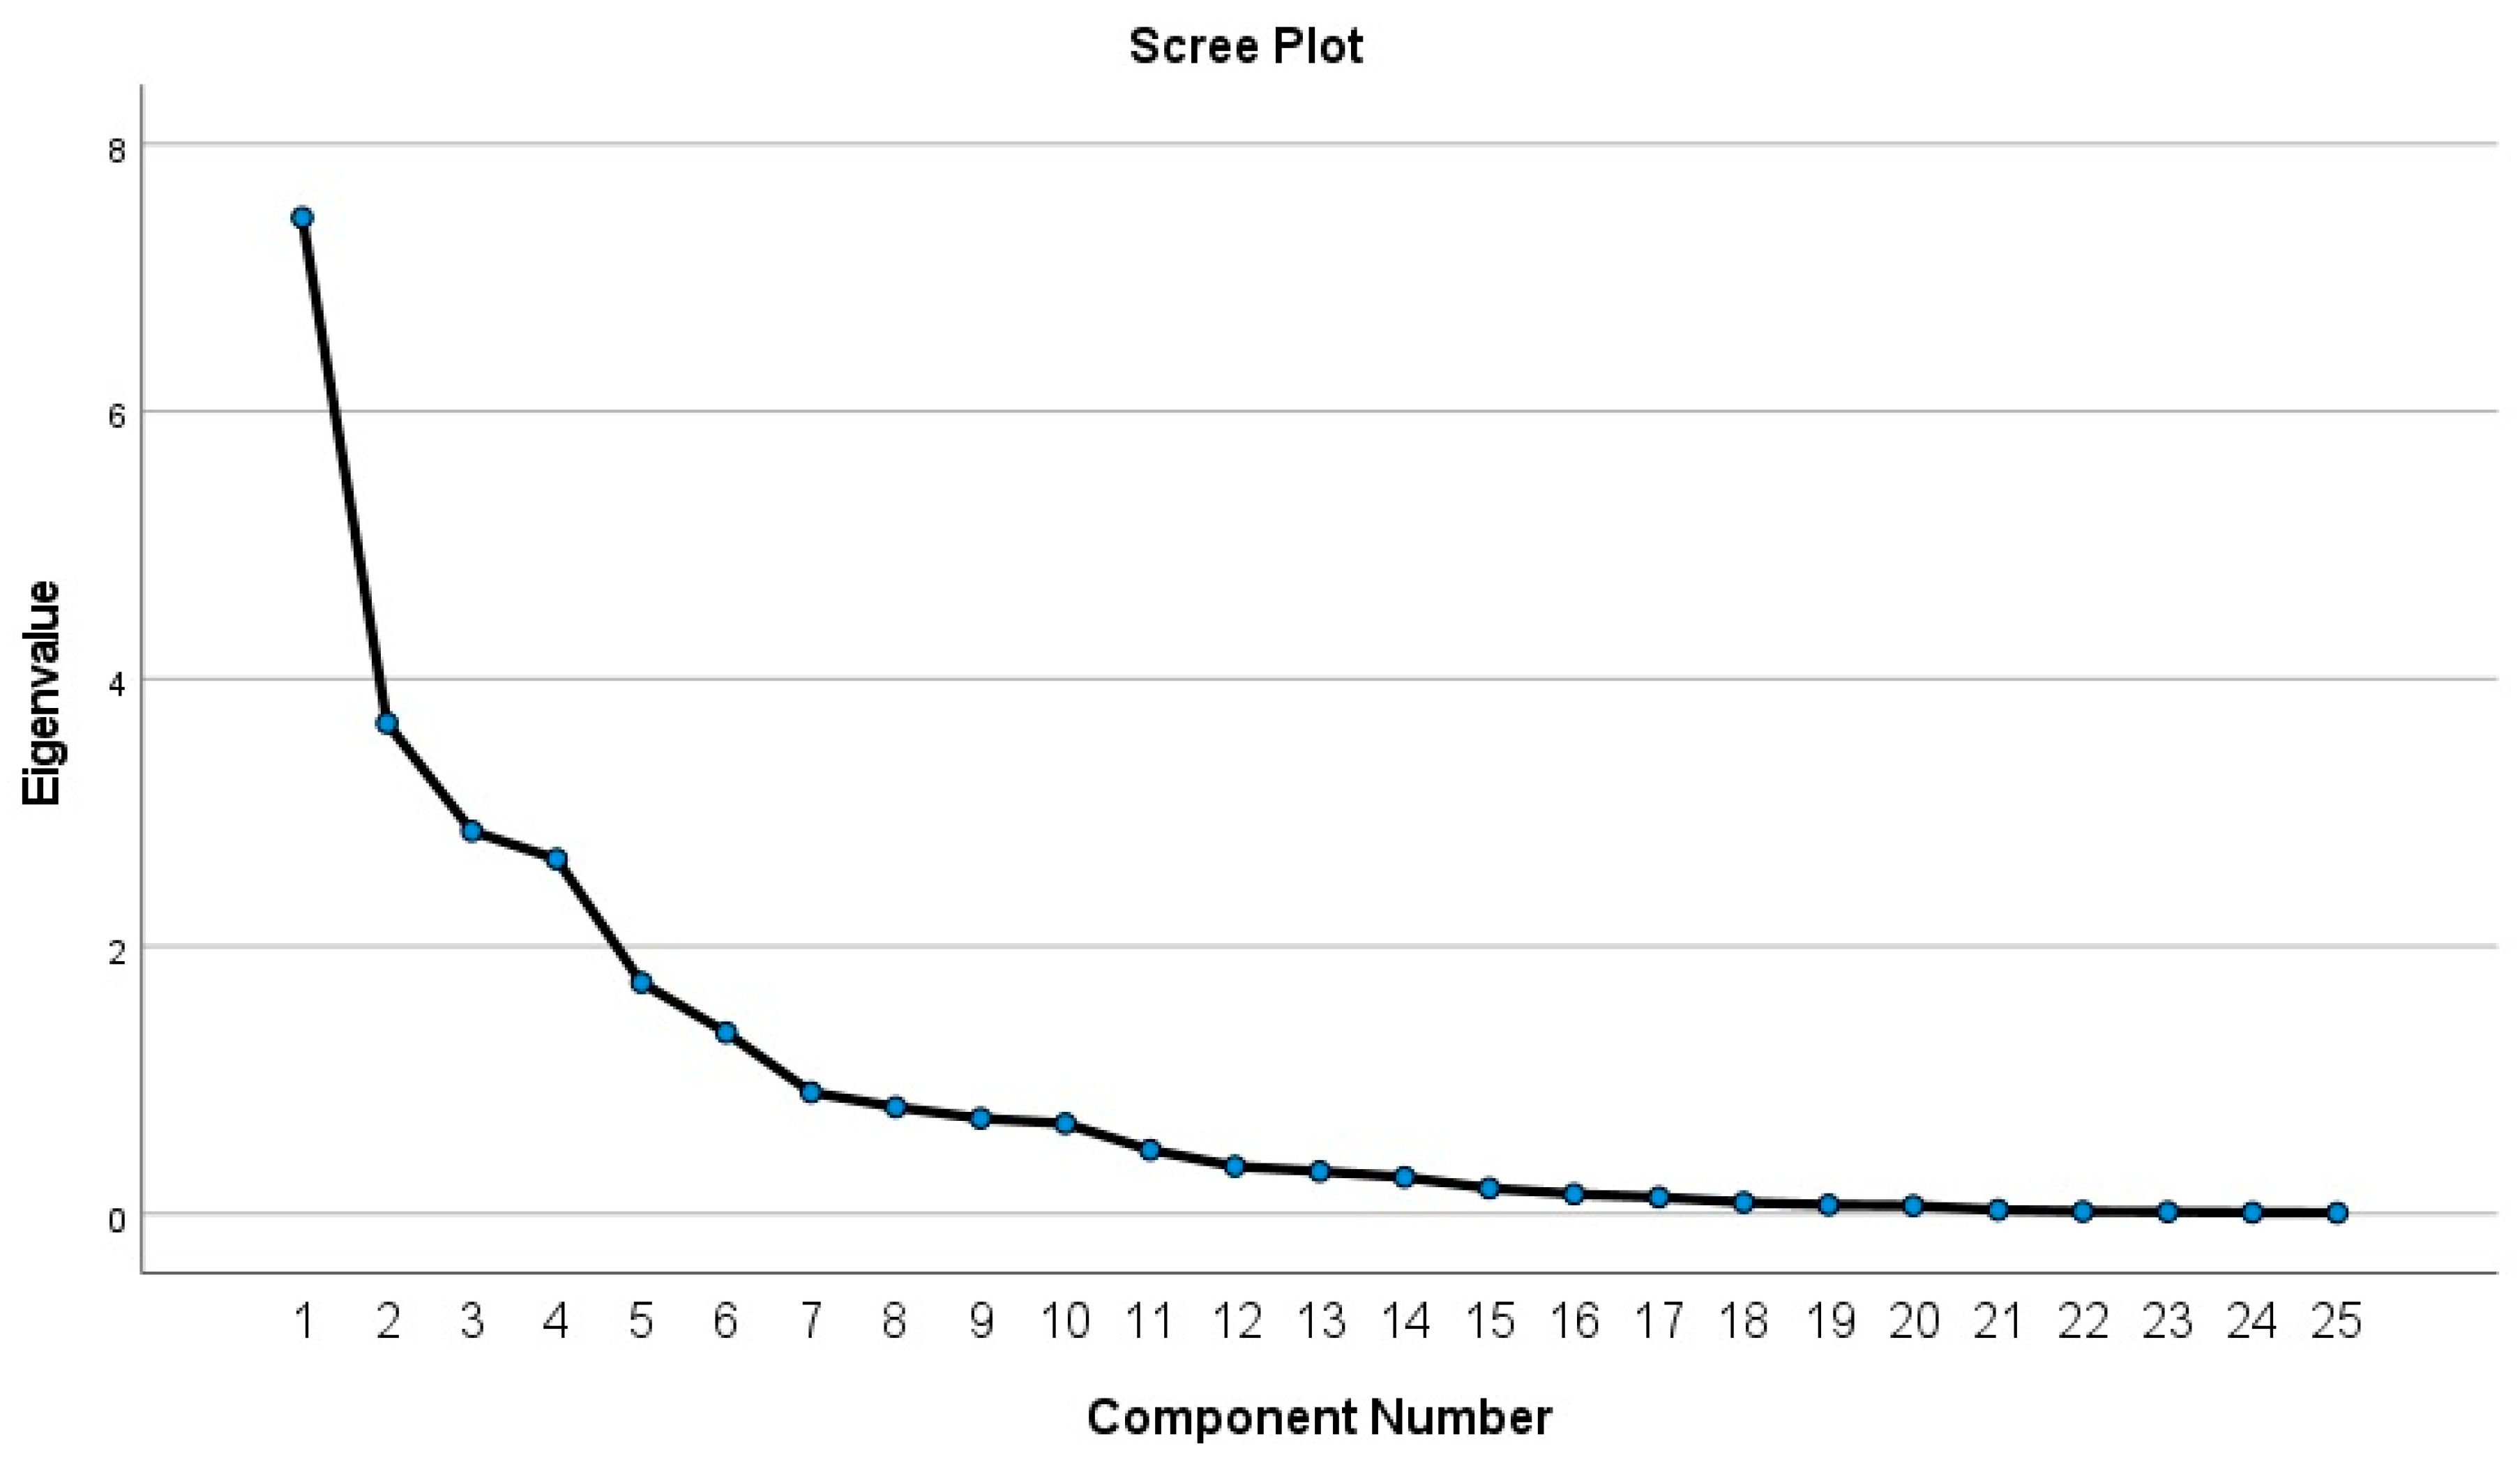
| (ii) 24 variables (excluding NUTS II and District level indicators) and 255 municipalities. | 0.779 | Average | Six factors explain 67.197% of the variance (with eigenvalue higher than 1). Checking with the scree plot, the 6 factors should be considered since there’s a clear change in the inflexion of the curve in the scree plot (see Figure 3) and also the eigenvalue of the 6th factor is clearly above 1 (1.127—see Table A6). |
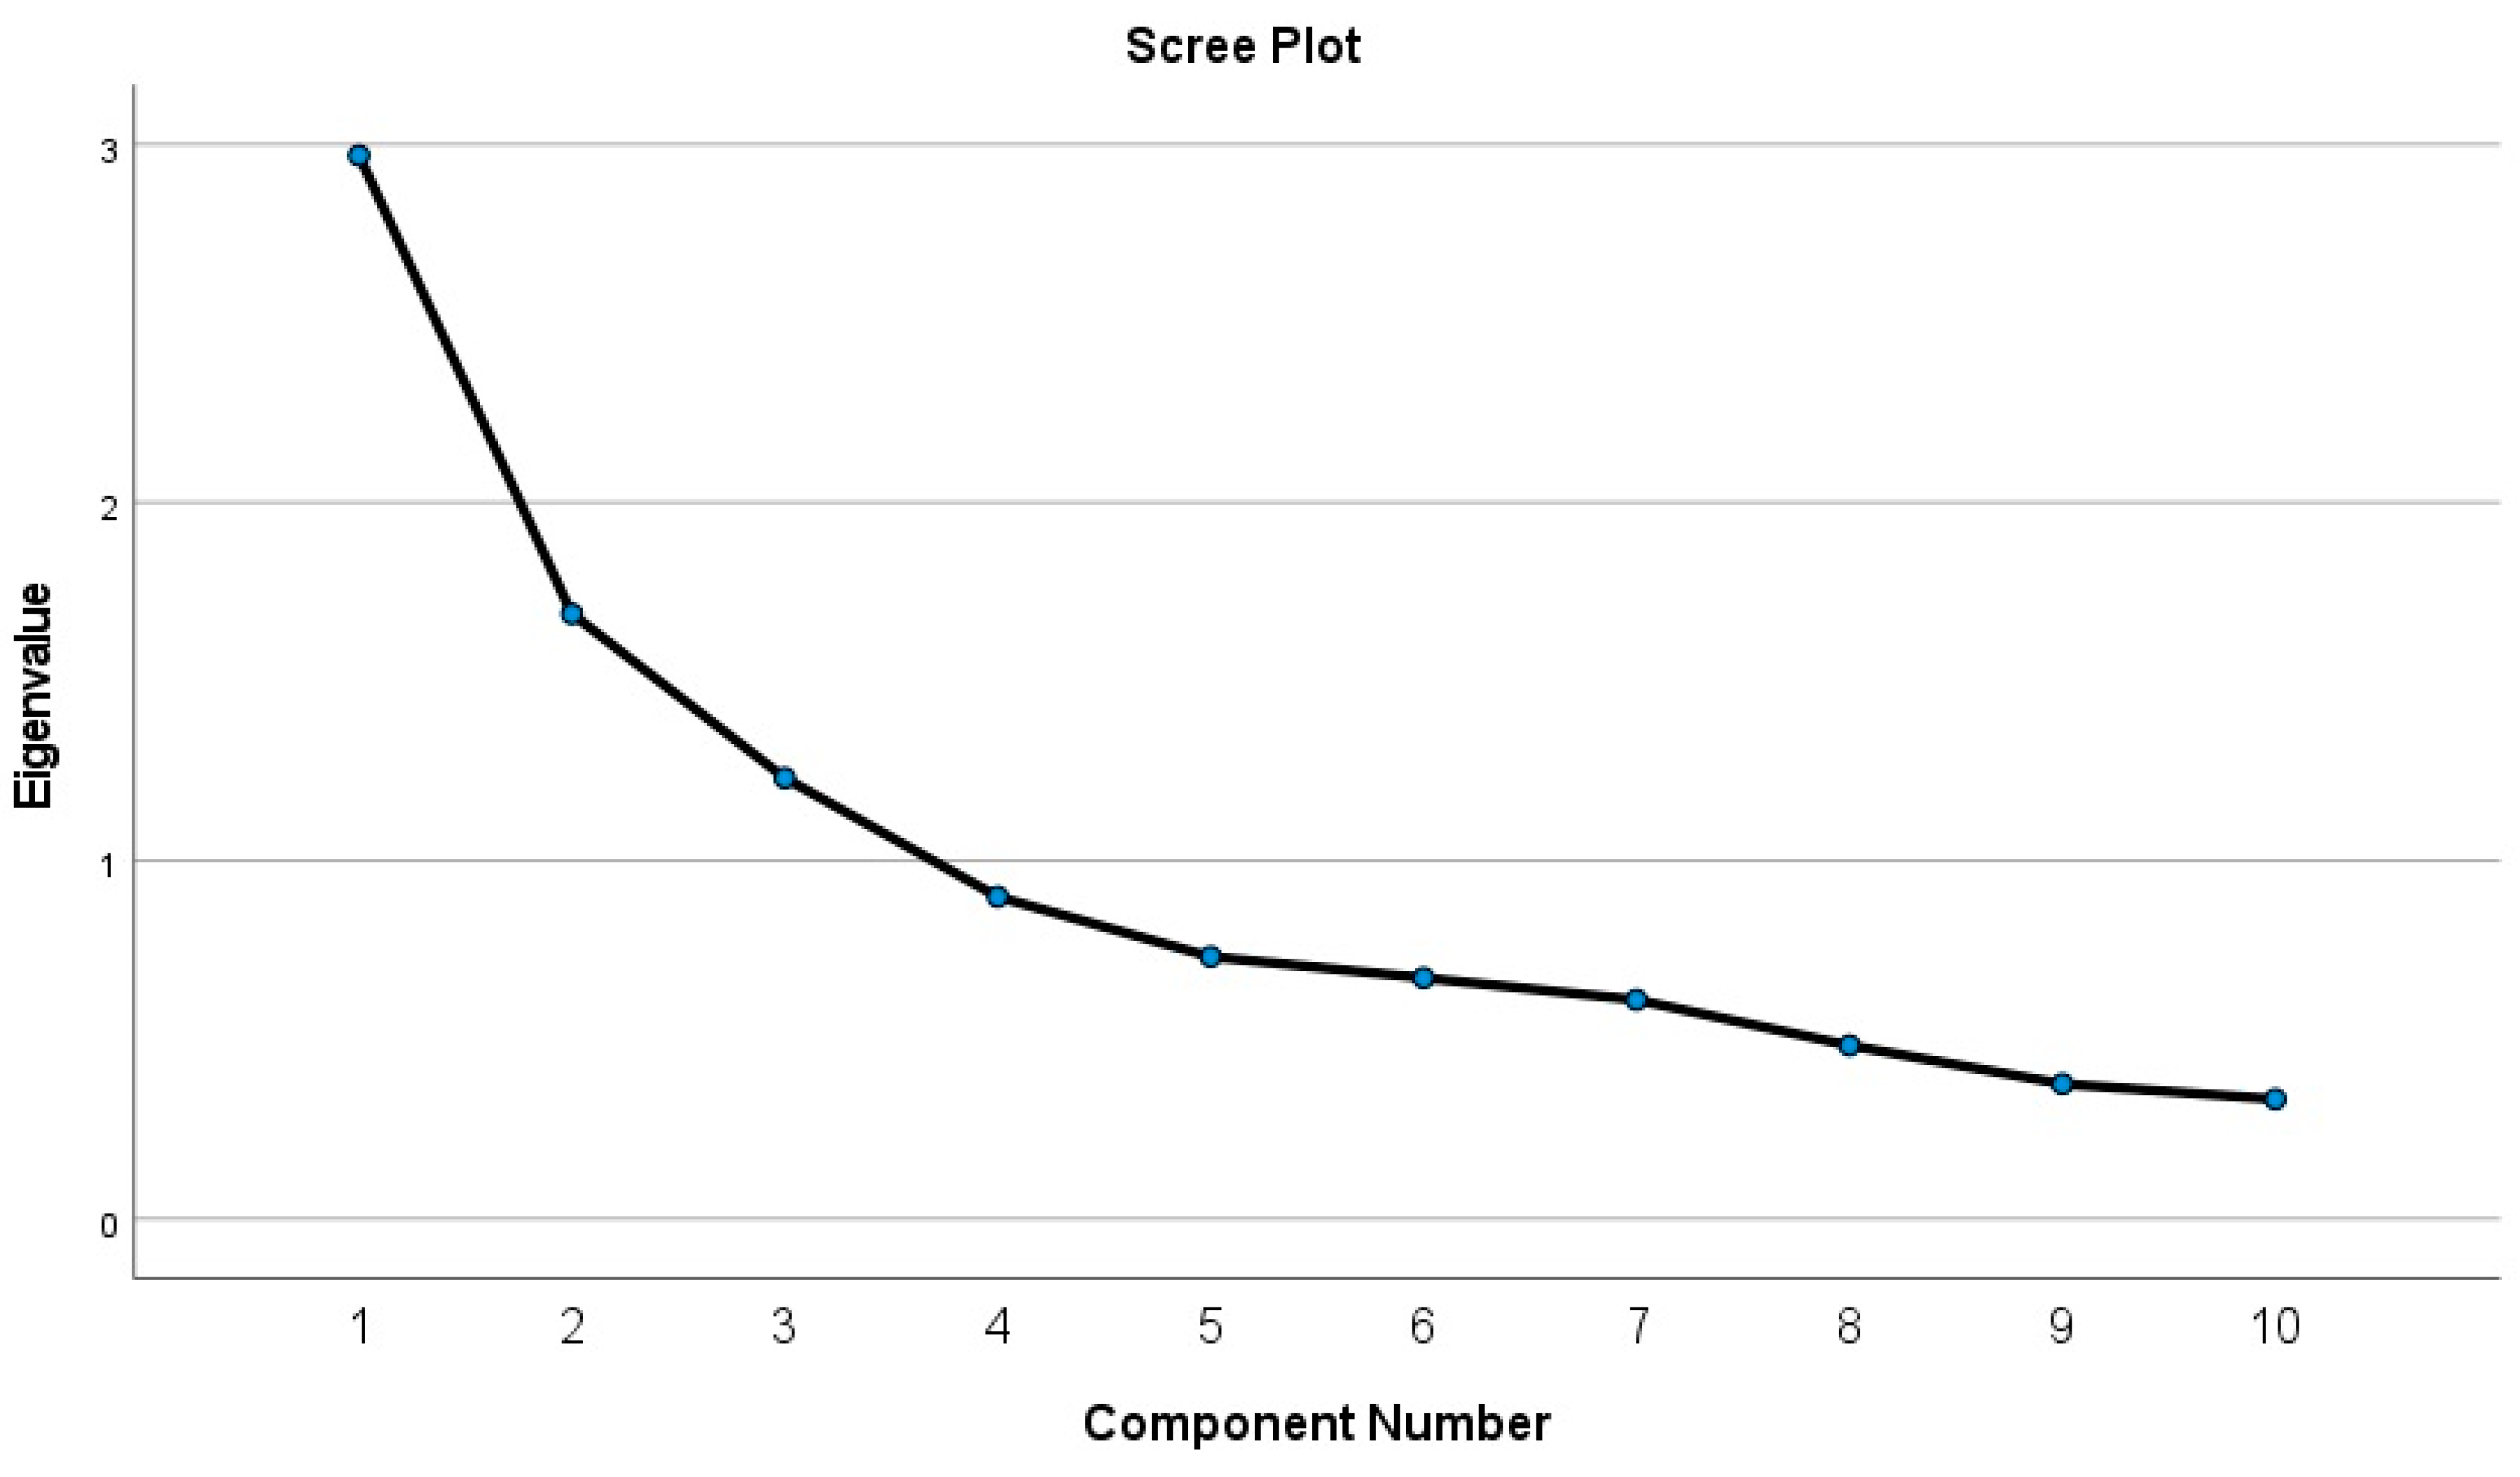
| 19 variables (Dimension 1, 19 from the 27 variables), and 255 municipalities. | 0.719 | Average | Six factors explain 72.550% (Cumulative) of the variance. Confirming with the scree plot, only the 5 factors should be considered since there’s a clear change in the inflexion of the curve in the scree plot (see Figure 4). |
| 10 variables (Dimension 2, 10 from the 27 variables), and 255 municipalities. Note that 2 of the original indicators are the same for Dimensions 1 and 2, therefore there are 8 variables in Dimension 2. | 0.683 | Poor | Three factors explain 58.891% of the variance. Confirming with the scree plot, if this Factor Analysis is used, the 3 factors have eigenvalues above 1 (see Figure 5), nevertheless they explain less than 60% of the total variance which would not be suitable [23]. |
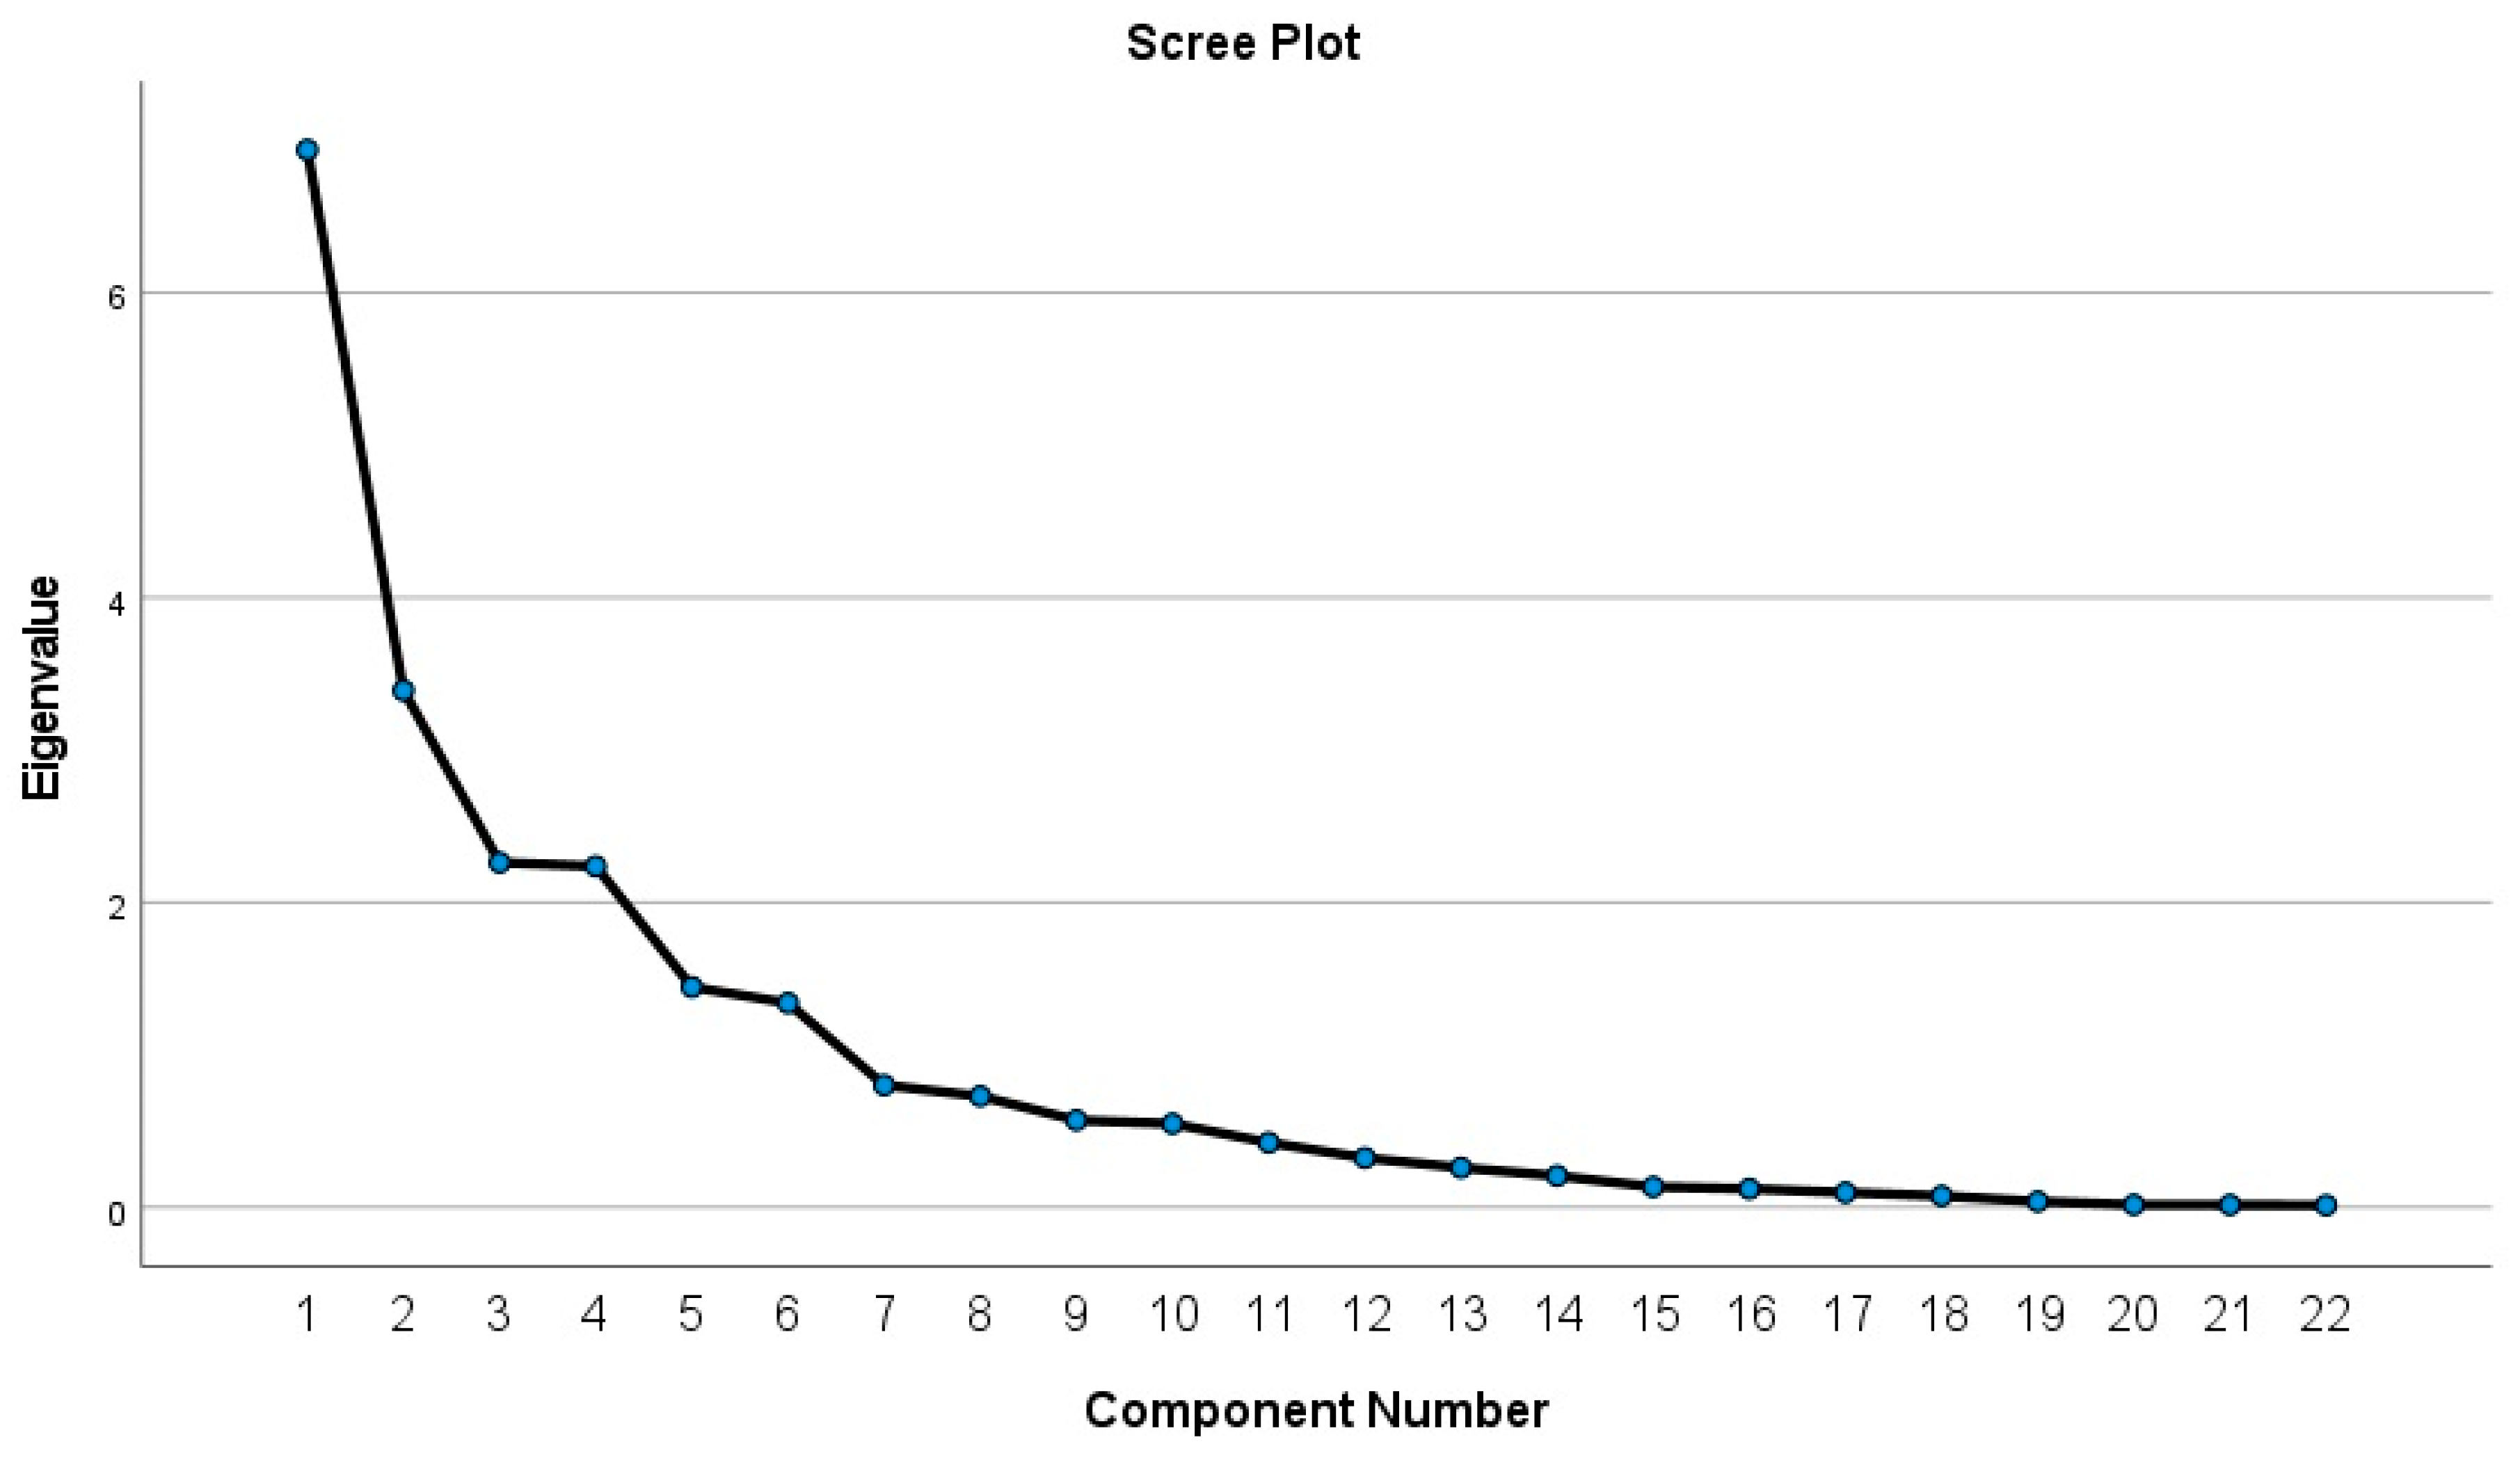
| 17 Variables Dimension 1 (excluding indicators at NUTS II), 255 municipalities. | 0.716 | Average | Five factors explain 67.881% of the variance. Confirming with the scree plot, all the 5 factors should be considered since all have eigenvalues higher than 1 (see Figure 6). |
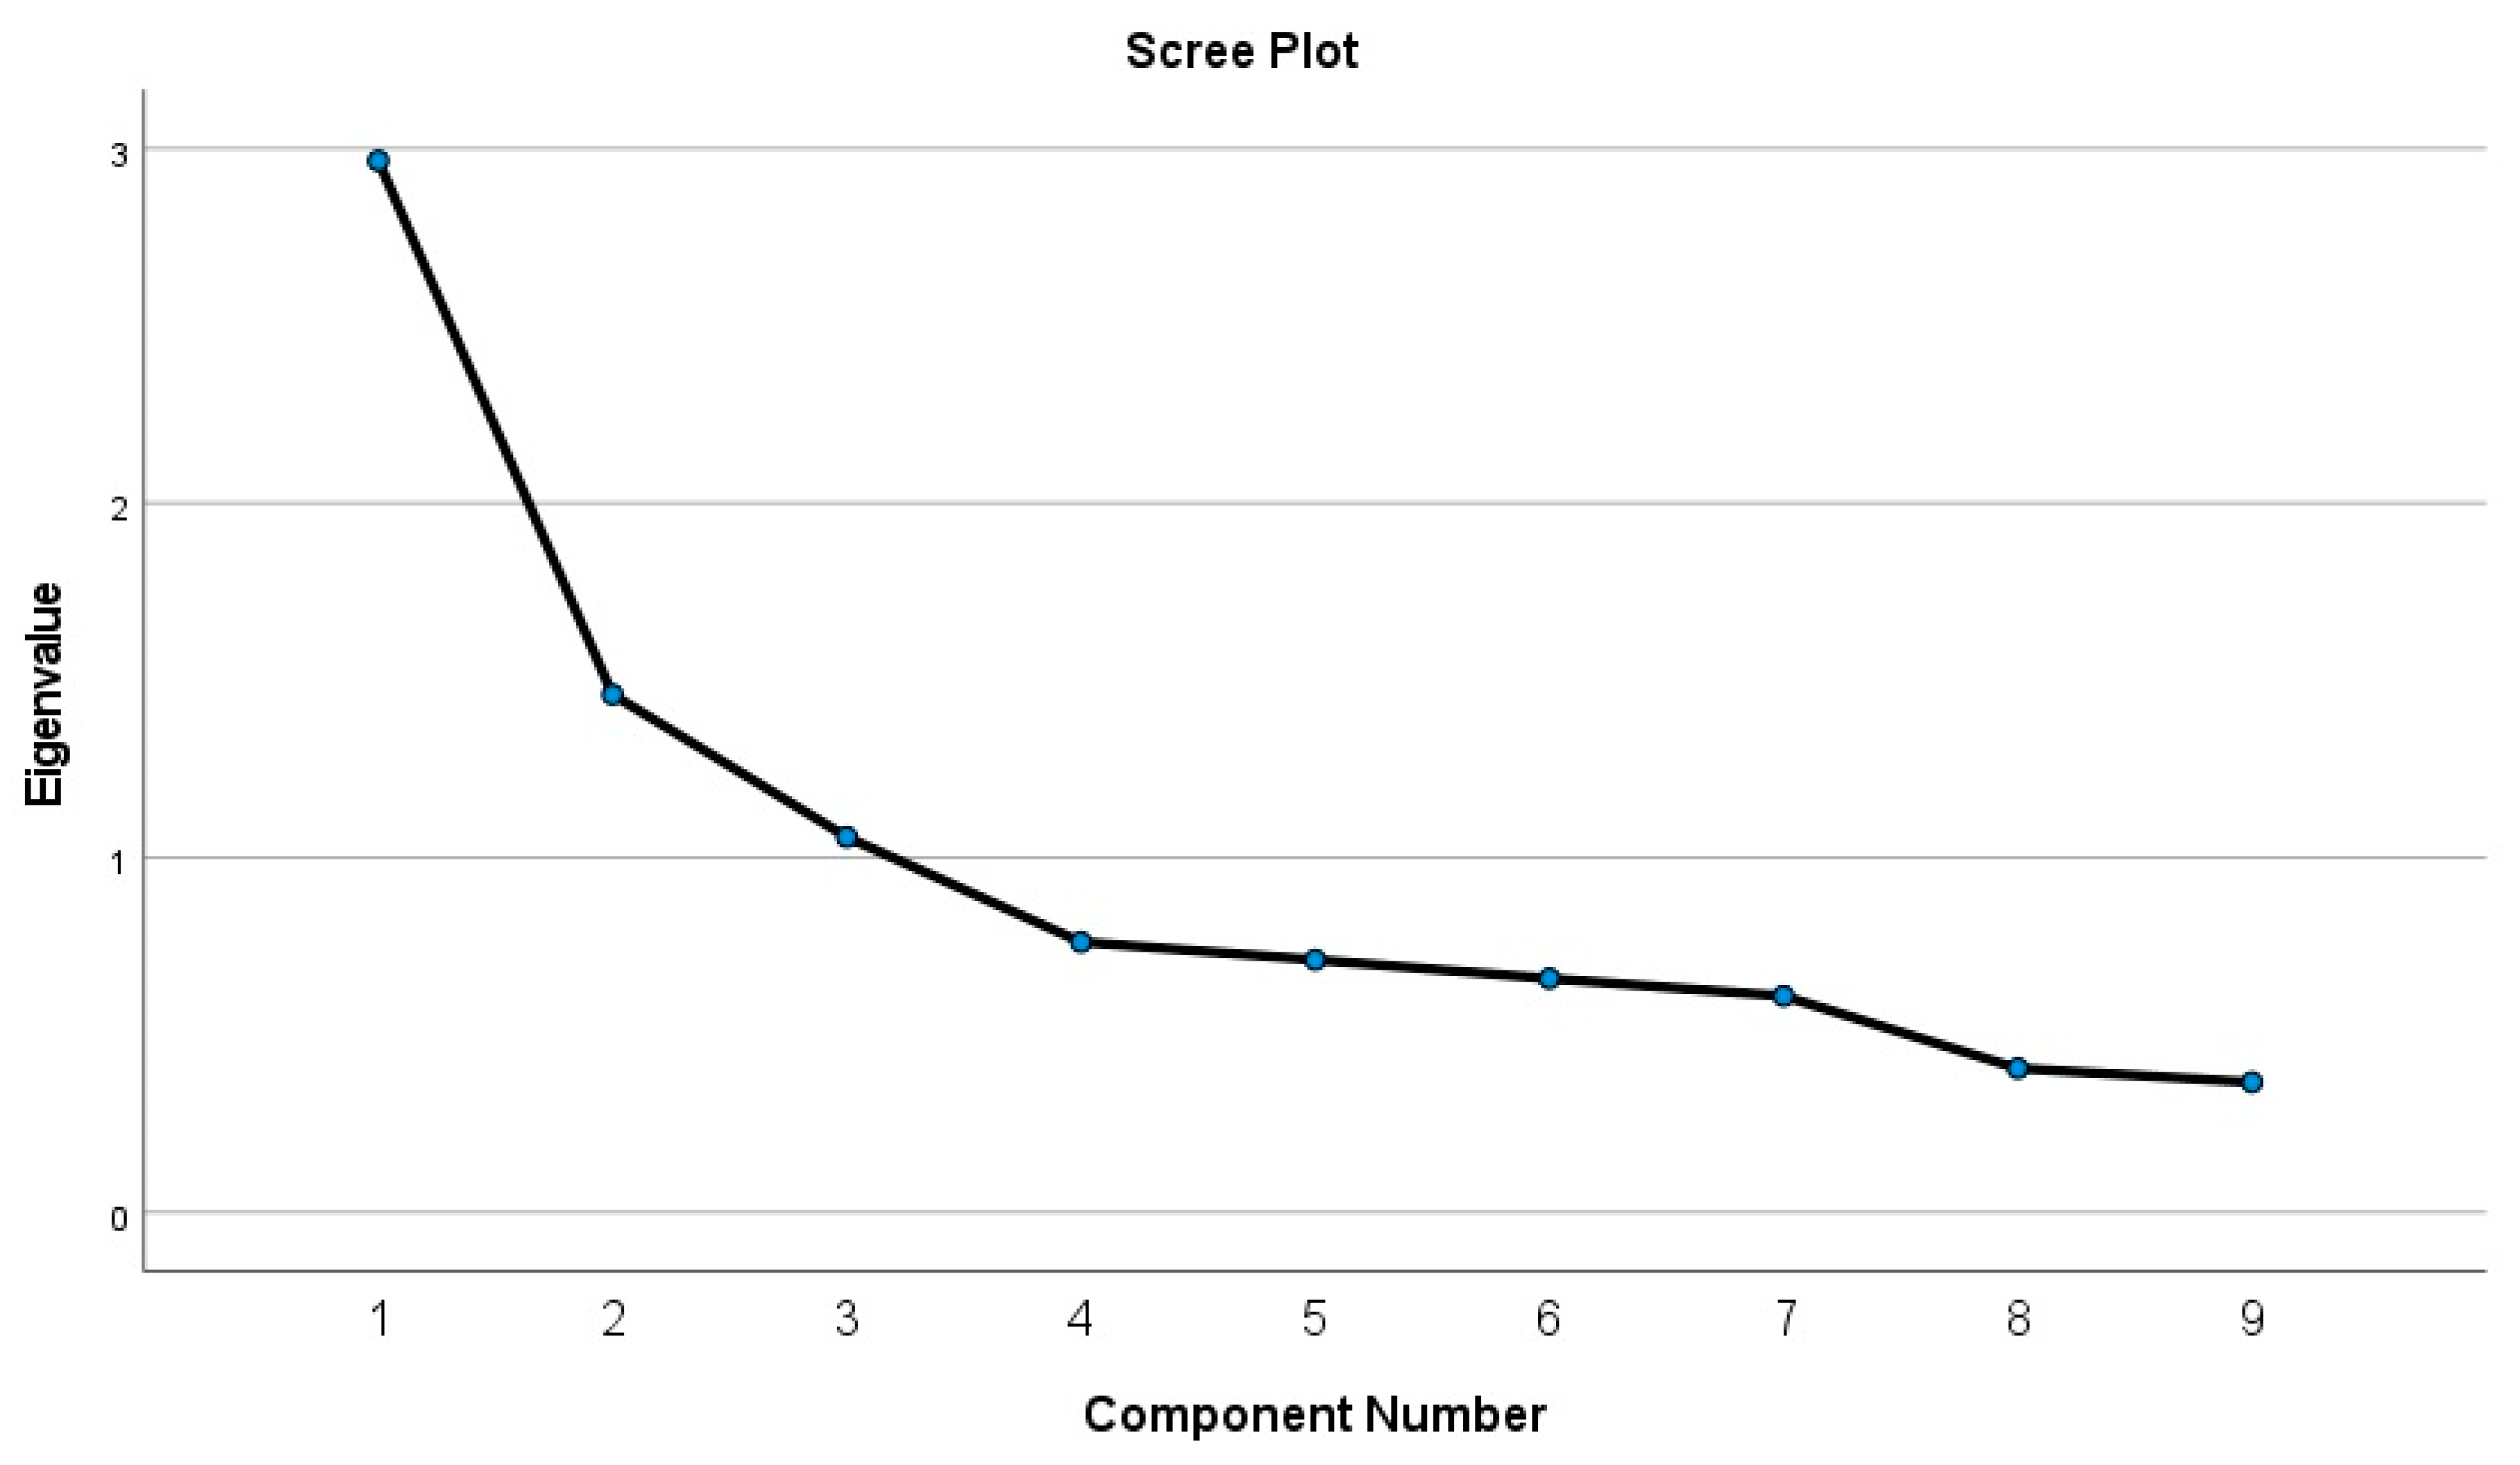
| 9 Variables Dimension 2 (excluding indicators at the District level), 255 municipalities. | 0.731 | Average | Three factors explain the 60.934% of the variance. Confirming with the scree plot the three factors must be considered (see Figure 7). |
| 27 Variables, 255 municipalities with Varimax Rotation. | Same as condition (i) (the entry data is the same, the only change is the output Varimax Rotated Matrix). | ||
| 24 Variables (excluding NUTS II and District level variables) 255 municipalities with Varimax Rotation. | Same as condition (ii) (the entry data is the same, the only change is the output Varimax Rotated Matrix). | ||
| 27 Variables, 36 municipalities. | 0.539 | Poor | Six factors explain 78.890% of the variance. From those, the first five explain 73.468% of the variance. Confirming with the scree plot, only the first 6 factors should be considered since there is a clear change in the inflexion of the curve in the scree plot (see Figure 8). |
| 24 Variables (excluding NUTS II and District level variables) 36 municipalities. | 0.628 | Average | Six factors explain 80.081% of the variance. From those, the first five explain 73.985% of the variance. Confirming with the Scree Plot, only the first 6 factors should be considered since there’s a clear change in the inflexion of the curve in the scree plot (see Figure 9). |
4.2. Results from the Optimal Scaling (CATPCA)
4.3. Social Resilience Index—SoResilere
4.3.1. SoResilere Index Calculation—Part 1: The Quantitative Data
4.3.2. SoResilere Index Calculation—Categorical Data Subindex
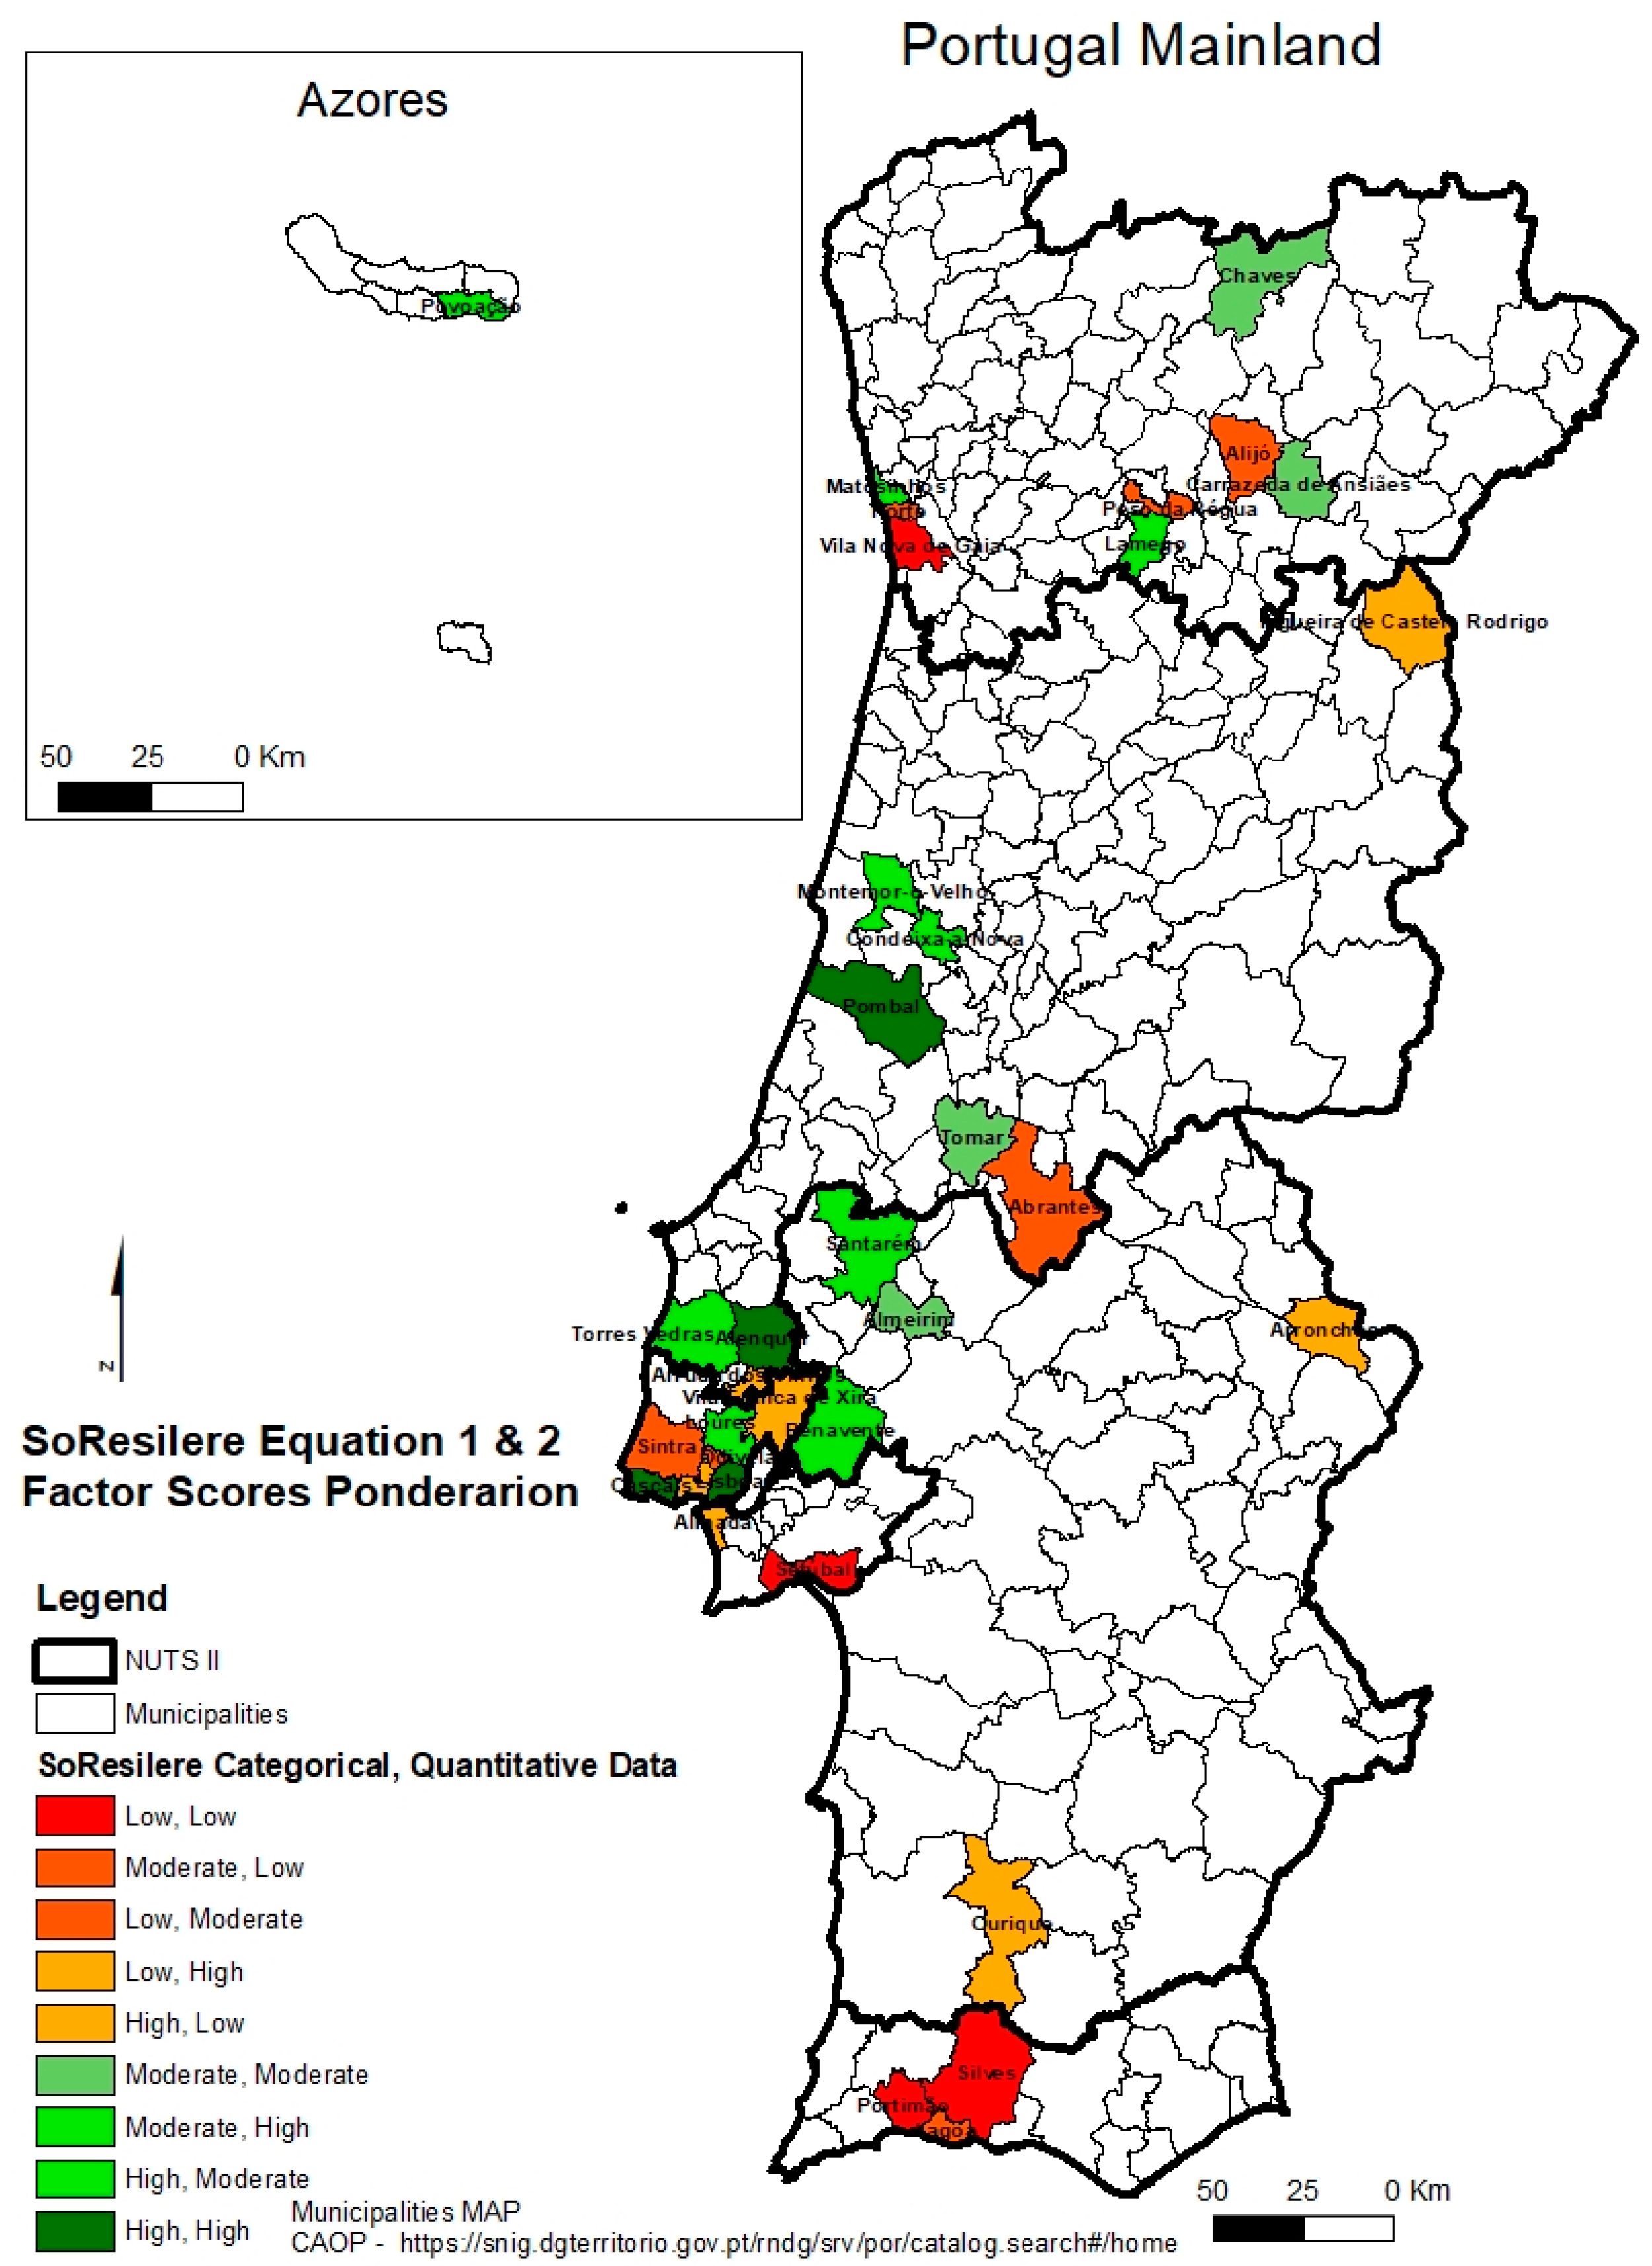
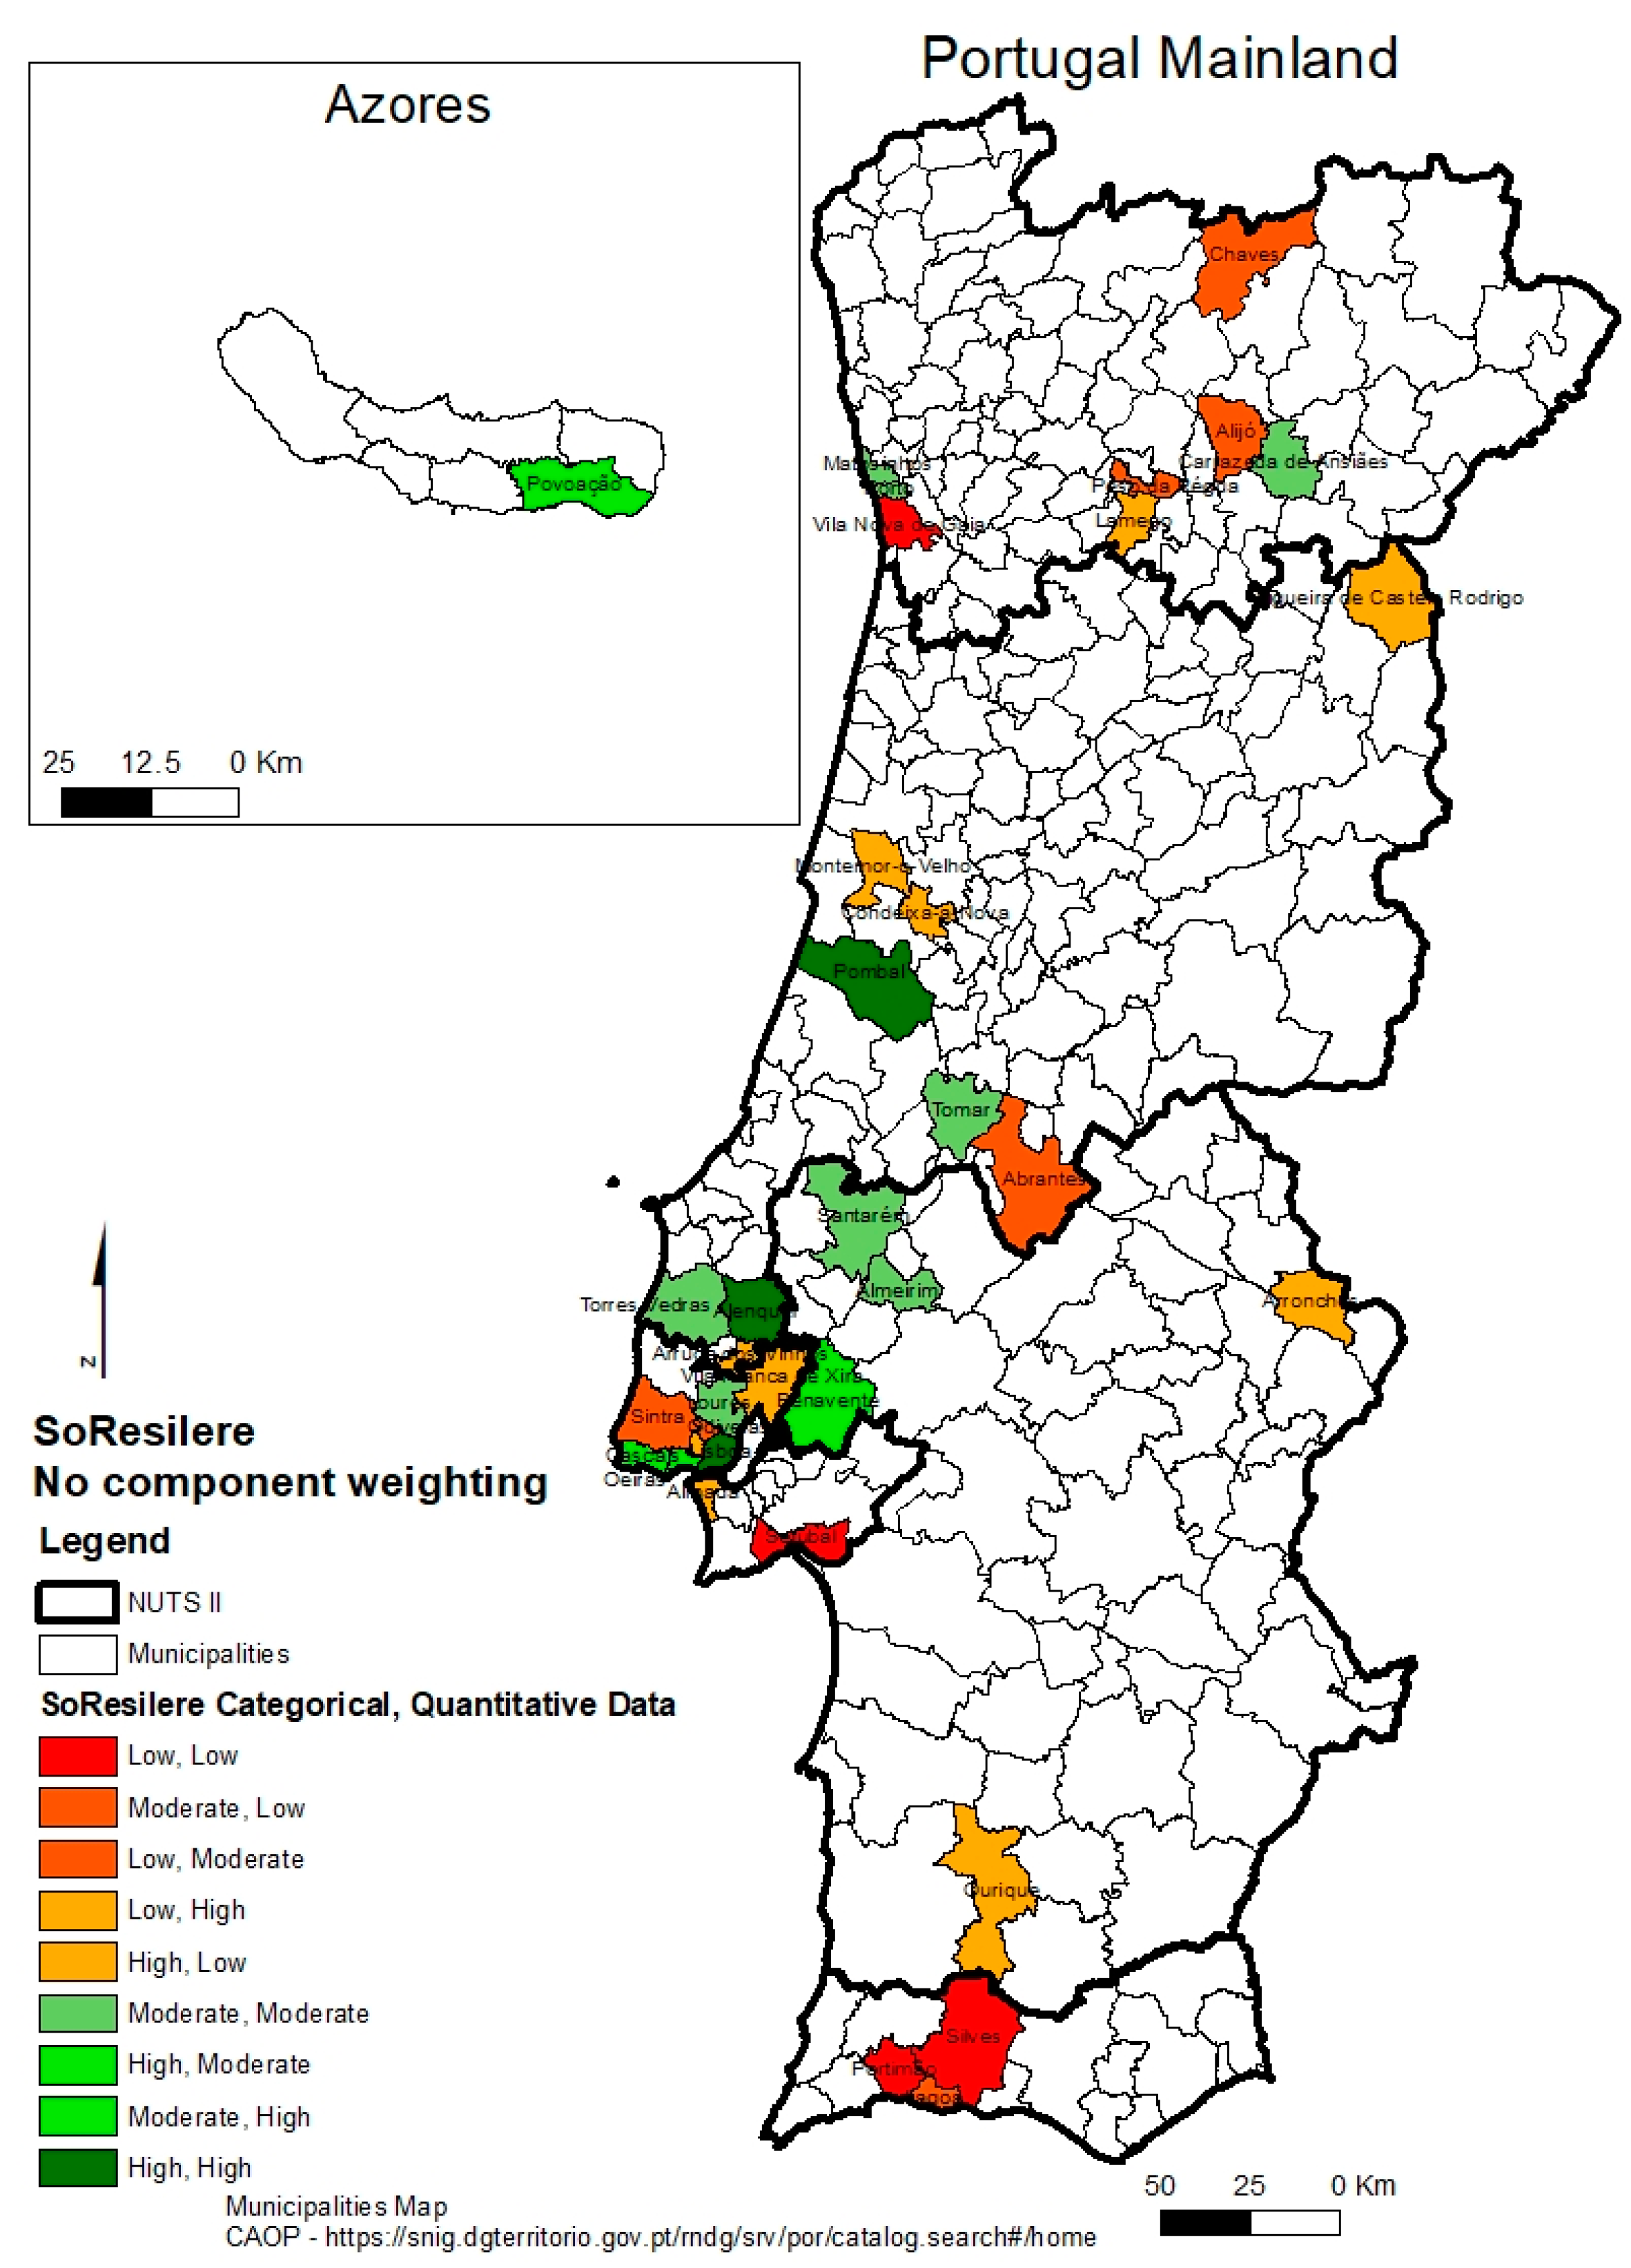
4.3.3. SoResilere—Mapping
5. Discussion
5.1. SoResilere—Mapping
5.2. Principal Component Analysis
5.3. Optimal Scaling
5.4. SoResilere Spatial Distribution Analysis
5.5. SoResilere Discussion
5.5.1. SoResilere Spatial Patterns and Tendencies Analysis
5.5.2. SoResilere Validation
6. Conclusions
Author Contributions
Funding
Institutional Review Board Statement
Informed Consent Statement
Data Availability Statement
Conflicts of Interest
Appendix A

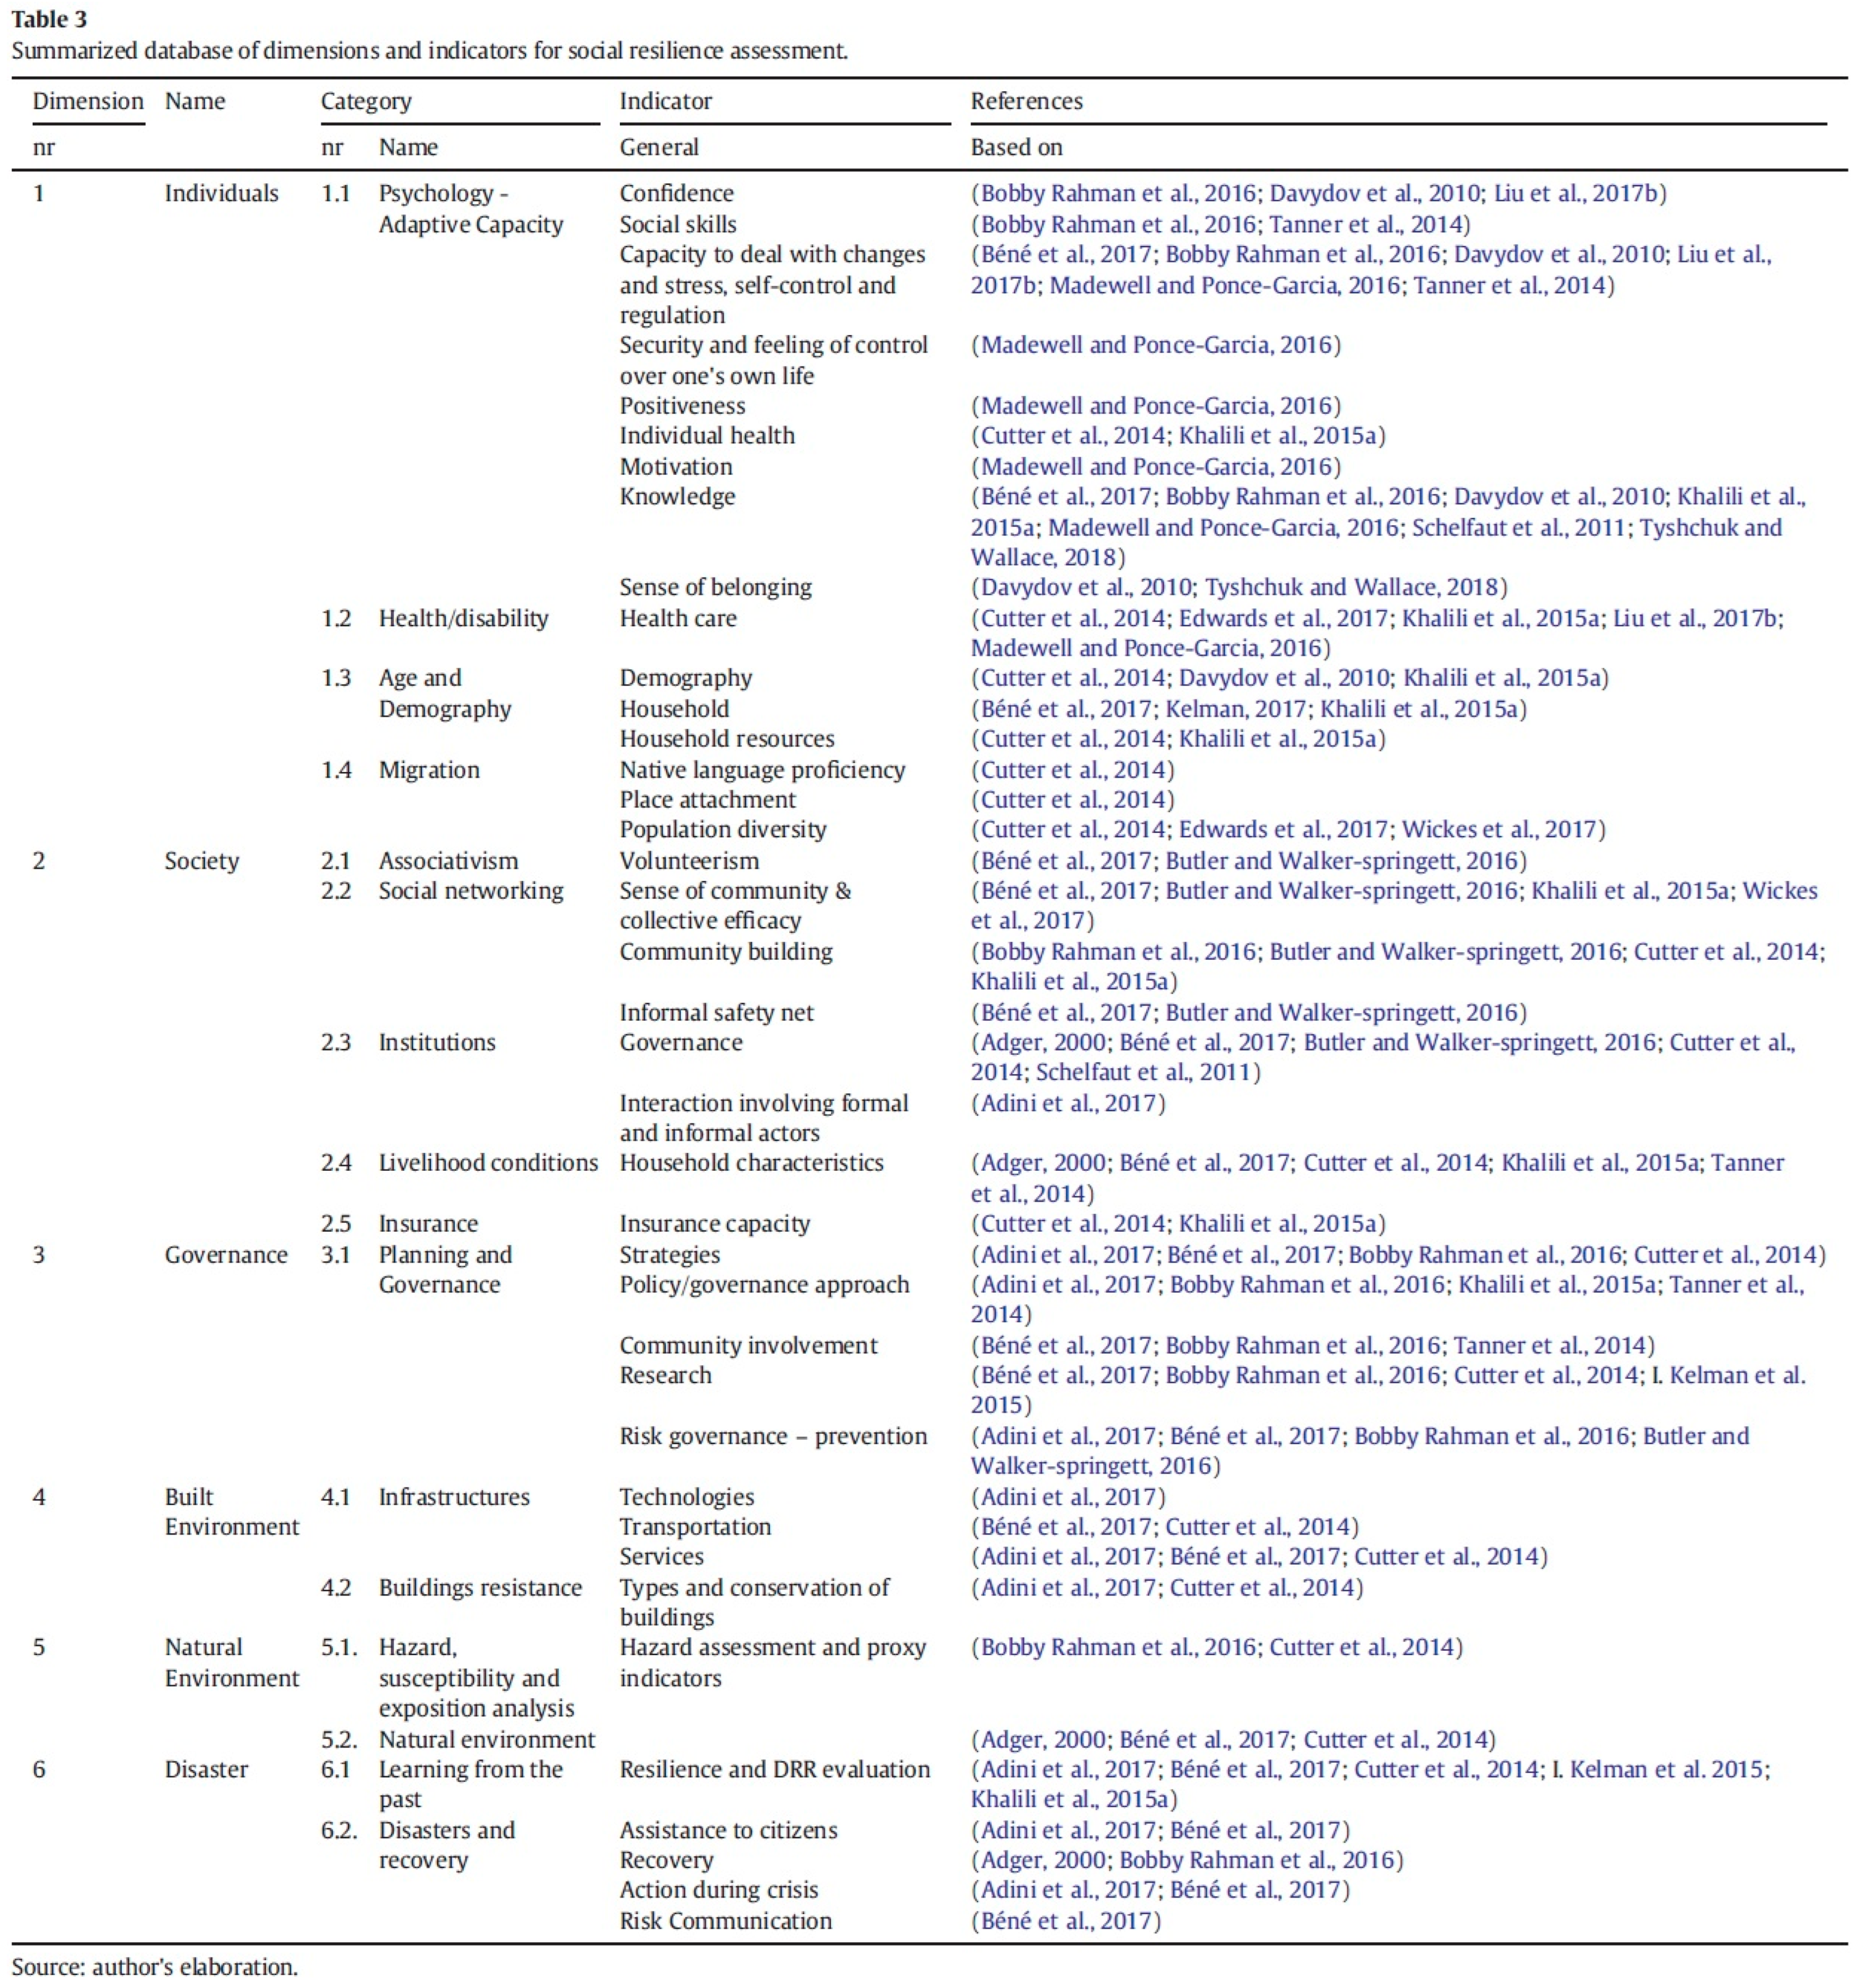
Appendix B. Quantitative Data—Metadata
| Dimension, Component, and Indicators According to Jacinto, Reis & Ferrão (2020) [5] | Code for PCA and | Spatial Scale | Year | Downloaded from | English Translation | Original Units | Calculations Made | Units | Contribution to the Index | Bibliography |
| Individuals, Psychology, Confidence | V111 | NUTS II | 2019 | INE | Resident population over 15 years of age (No.) by Place of residence (NUTS—2013), Sex, Age group and Type of chronic disease; Quinquennial—Statistics Portugal, National health survey (series 2014)—Depression | No | % of the population suffering from depression and the % of the population who does not suffer from depression were calculated. Since the indicator reflects a vulnerability and we are calculating resilience we focus on the population that does not suffer from depression as an approximation or sign of confidence. | % | - | [40] |
| Individuals, Psychology, Social Skills | V112 | Municipality | 2011 | INE | Resident population with at least one disability (No.) by Place of residence (at the date of Census 2011), Sex, Age group and Dimension (persons with special needs); Decennial | No | % of total Pop in the area | % | - | [36] |
| Individuals, Psychology, Capacity to deal with Changes and Stress, Self-control and regulation | V113 | Municipality | 2019 | INE | Deaths (No.) by Place of residence (NUTS—2013), Sex, Age group and Death cause (European short-list); Annual | No | Percentage of suicide plus Mental and behavioural disorders among the causes of death | % | - | [41] |
| Individuals, Psychology, Positiveness | V115 | NUTS II | 2019 | INE | No | % of the people per region that are Satisfied or Very Satisfied with their life (level of satisfaction with their life) | % | + | [36] | |
| Individuals, Psychology, Motivation, Strong sense of purpose, work to attain goals, best effort no matter what | V117 | Municipality | 2018 | INE | Births (No.) of Enterprises by Geographic localization (NUTS—2013) and Legal form; Annual—Statistics Portugal, Business demography | No | % of new companies between 2011 and 2018 | % | + | [42] |
| Individuals, Psychology, Knowledge, Know where to turn for help, know how to plan and prioritize, have historical knowledge, level of education | V1181 | Municipality | 2011 | INE | Resident population (No.) by Place of residence (at the date of Census 2011), Sex and Highest completed level of education; Decennial | No | % of the population with a 3rd cycle, secondary, higher and bachelor’s degree | % | + | [43] |
| Individuals, Psychology, Knowledge, Access to information and seeking additional information/confirmation. Obtain, propagate and understands warnings | V1182 | Municipality | 2019 | INE | Members of non-governmental organizations for environment per 1000 inhabitants (No.) by Geographic localization (NUTS—2013); Annual | No/1000 inhabitants | None | No/1000 inhabitants | + | [20] |
| Individuals, Psychology, Sense of Belonging, Religion/spirituality and Normative beliefs (such as perceived expectations of important referent | V1191 | Municipality | 2011 | INE | Resident population over 15 years old (No.) by Place of residence (at the date of Census 2011), Sex, Age group and Marital status; Decennial4 | No of population | % of the population with religious beliefs per municipality | % | + | [44] |
| Individuals, Psychology, Sense of Belonging, Exposure of social media users to normative beliefs (calculated using the co-affiliation network of social media) | V1192 | Municipality | 2019 | INE | Fixed broadband Internet accesses per 100 inhabitants (No.) by Type of access technology to fixed broadband service; Annual—Statistics Portugal, Telecommunications survey | No/100 | None | No/100 | + | [40] |
| Individuals, Health/disability, Access to health care and mental health care | V1211 | Municipality | 2019 | INE | Specialized medical doctors (No.) by Place of residence (NUTS—2013), Sex and Medical speciality, subspecialty or competence; Annual—Statistics Portugal, Health personnel statistics | No | % of the resident population that has a medical degree | % | + | [41] |
| Individuals, Age & Demography, Demography, Age | V1311 | Municipality | 2019 | Pordata | Resident population: total and by major age groups | No | % of the population under 15 and over 65 years old per municipality | % | - | [42] |
| Individuals, Age & Demography, Demography, Gender | V1312 | Municipality | 2019 | INE | Sex ratio (Males per 100 females) (No.) by Place of residence (NUTS—2013); Annual (2) | No | None | No | - | [4] |
| Individuals, Age & Demography, Demography, Marital Status | V1313 | Municipality | 2011 | INE | Resident population (No.) by Place of residence (at the date of Census 2011), Sex, Age group, Marital status and Conjugal relationship; Decennial—Statistics Portugal, Population and housing census—2011 | No | % of the resident population that is married | % | + | [43] |
| Individuals, Age & Demography, Household, Household size and income | V1321 | Municipality | 2018 | INE | Tax household (No.) by Geographic location (NUTS—2013) and Gross reported income less personal income paid class; Annual (2) | No | % above at-risk-of-poverty threshold. Hence the income is presented in breaks of 5k euros, and the threshold is above 6k euros, the option was made to consider the % of the population in each municipality that has an income above 10k as not living at risk of poverty. | % | + | [14] |
| Individuals, Age & Demography, Household, Household size and income | V1322 | Municipality | 2011 | INE | Private households (No.) by Place of residence (at the date of Census 2011), Sex (reference person of private household), Activity status (reference person of private household) and Type of private household (Based on family nuclei—Census 2011); Decennial | No | % of the active population that is employed per municipality | % | + | [14] |
| Individuals, Age & Demography, Household Resources, Transportation and communications capacity | V1331 | Municipality | 2019 | INE | Sales of new vehicles per 1000 inhabitants (No.) by Place of residence (NUTS—2013) and Type of vehicle; Annual | No/1000 | None | N0/1000 | + | [15] |
| Individuals, Migration, Native Language Proficiency | V1411 | Municipality | 2019 | INE | Foreign population with the legal status of residence (No.) by Place of residence (NUTS—2013), Sex and Nationality (Groups of countries); Annual | No | Subtraction of the foreign population from the total resident population. This result was added to the foreign population originating from countries with Portuguese as an official language and this result was used to calculate the percentage of the total population that is proficient in the Portuguese language. | % | + | [36] |
| Individuals, Migration, Place attachment, Percentage of residents who are not recent immigrants | V1423 | Municipality | 2019 | INE | Foreign population with the legal status of residence (No.) by Place of residence (NUTS—2013), Sex and Nationality (Groups of countries); Annual | No | % of the total population that requested the status of resident | % | - | [29] |
| Individuals, Migration, Population diversity, Races and ethnicity | V143 | Municipality | 2011 | INE | (Difference between) The proportion of the resident population that 1 year before inhabited another territorial unit (%) by Place of residence (at the date of Census 2011); Decennial; and Proportion of the resident population that 5 years before inhabited outside of the municipality (%) by Place of residence (at the date of Census 2011); Decennial | % | Subtract the % of the 5 years before from the % of the 1 year before. The smaller or negative, the more resilient. | % | - | [42] |
| Society, Associative, Volunteers | V212 | Municipality | 2019 | INE | Firemen (No.) by Geographic localization (NUTS—2013); Annual (2) | No | We opted for the Inhabitants per firefighter indicator, as it reflects better the proportion of the population that volunteers in order to compare between municipalities. In Pordata we can find this indicator “Where are there more and fewer people, on average, per professional or volunteer firefighter?” | No | - | [20] |
| Society, Social Networking, Sense of community & Collective efficacy | V221 | Municipality | 2017 | SIGMAI/Pordata | Abstention rate in the elections for the Local Authorities | % | None | % | - | [15] |
| Society, Social Networking, Community Building | V222 | Municipality | 2012 | Pordata | Unemployment registered at the public employment office in a total of the resident population aged 15 to 64 years (%) | % | None | % | - | [36] |
| Society, Social Networking, Informal Safety Net, informal safety net (non-governmental organizations, associations, institutions) | V2231 | District | 2018 | INE | Practitioners affiliated (No.) to sports federations by Geographic localization (Distrito) and Sex; Annual (1): Resident population (No.) by Place of residence (NUTS—2013), Sex and Age group; Annual | No | % of the total population that is subscribed to sports federations | % | + | [15] |
| Society, Social Networking, Informal Safety Net, women empowerment | V2232 | Municipality | 2018 | Pordata | Employees in Local Government: total and by sex | No | % of women working in public administration | % | + | [20] |
| Society, Livelihood conditions, Household Characteristics, Promotion of economic vitality: employment and homeownership/right to housing and property; non-reliance on a narrow range of resources; equality of income distribution among the population (across races/ethnicities and genders). | 2413 | Municipality | 2019 | INE | New recipients of unemployment benefits of social security (No.) by Place of residence (NUTS—2013) and Sex; Annual (1) | No | % of the resident population who are new beneficiaries of Social Security | % | - | [23] |
| Society, Livelihood conditions, Social/Human Rights: Access/right to medical care; Right to housing and property; Food Security/Right to food; Access to social services | 2.4.1.4 | Municipality | 2011 | Pordata | Conventional dwellings of usual residence, according to the Census: total, by homeowner-occupier and tenants | No | % of homeowners | % | + | [21] |
| Society, Livelihood conditions, Recorded Crime Rates | 2.4.1.5 | Municipality | 2019 | INE | Registered crimes (No.) by the police authorities by Geographic localization (NUTS—2013) and Category of crime; Annual (3) | No | None | No | - | [36] |
Appendix C. Metadata for the Categorical Data
| Dimension, Component, and Indicators According to Jacinto, Reis & Ferrão (2020) [5] | Variable Code | Generated Indicators (Data Sources: Adapt PT Project—https://www.adapt-local.pt/ (accessed on 7 December 2022), Municipal Emergency and Civil Protection Plans, Municipal Director Plans, Special Flood Plans, Local Governments Websites) | Hypothesis (Current Hypothesis Were Created According to the Reality with the Information in Plans and Websites Available Online in the Period between:)—All Hypothesis Have Been Posed so that 0 Is the Less Resilient and 1 the Most Resilient, Therefore | Bibliographic Reference |
| Governance, Planning and Governance, Strategies, Positive coping strategies | V3111 | Carrying out Flood Exercises (the carrying out of exercises is the district’s responsibility) | 0—No exercises in the past and no exercises planned for the future, or the information is not available; 0.25—There were exercises but the local government was not responsible, and/or there are plans for future exercises in a Flood Special plan but no mention in the Municipal Emergency and Civil Protection Plan; 0.5—The Municipal Emergency and Civil Protection Plan refers a date for an exercise related to flood or meteorological adverse situations but there is no way to confirm if the exercise took place 0.75—Yes, exercises of simulation of floods or adverse meteorological situations occurred although there are no reports of lessons learnt registered; 1—There are regular exercises concerning floods or adverse meteorological situations organized by the local government or in coordination between the local government and other entities with connection with the Municipal Emergency and Civil Protection Plan. | [11,12,34,45] |
| Governance, Planning and Governance, Strategies, Sustainable adaptive and/or transformative strategies | V3112 | Does planning include long-term scenarios? | 0—Planning does not comprise long term scenarios, there are no climate change strategies and/or climate change scenarios and/or adaptation measures for the municipality; 0.25—Municipal Climate Change Adaptation Plan under development in cooperation with a research team of a company or under development of flood risk maps or there is already a Climate Change plan that includes the municipality, but it is not at municipal level; 0.5—A Plan at regional/or other scale which comprises the municipality and includes adaptation measures although does not specify scenarios or return periods or there are no specific measures for floods or the Municipal Emergency and Civil Protection Plan presents a flood plain map with no indication of the return period; 0.75—There is a Regional or other scale Adaptation Plan that is referred in the Municipal Emergency and Civil Protection Plan (there’s coordination between two levels of planning), or there’s an Municipal Adaptation Plan (more recent than the municipal Emergency and Civil Protection Plan) with no connection with the Emergency and Civil Protection Plan or the Emergency and Civil Protection Plan mentions that the floodable areas have a 100 y-return period; 1—Has a robust planning: the plans comprise scenario (flooding scenarios) and climate change scenarios and/or how the climate will evolve in long term with more than 100y-return periods (e.g., 1000 years) or The Municipal Adaptation and/or Emergency and Civil Protection Plans comprise climate change scenarios. | [11,12,34,45] |
| Governance, Planning and Governance, Strategies, Set plans: flood management plans; emergency response plans; plan for reinforcement of resources in resilience management | V3113bi | Does planning include resilience? | 0—No references to resilience or to promote it amongst the information found online; 1—The Municipal Emergency and Civil Protection Plan and/or the Adaptation Plans which comprise the Municipality do mention actions to promote resilience focusing on Flood; or a specific project of resilience (e.g., RESCUE) includes floods and the municipality. | [11,12,34,45] |
| Governance, Planning and Governance, Strategies, and Flexible resilience management systems to handle different types of situations | V3114bi | Does planning include different damage scenarios? | 0—No references to damages or losses in the municipal level plans or the information is not available; 1—Planning (Municipal Emergency and Civil Protection Plan and/or the Adaptation Plans are Regional or other scales) include real or modelled flood scenarios, or the Municipality has a specific Resilience project. | [11,12,34,45] |
| Governance, Planning and Governance, Strategies, Set an adaptive capacity developing strategy | V3117 | There is a specific flood planning? | 0—No reference/no planning to prepare/face floods or meteorological adverse conditions or the information is not available; 0.25—There is no specific flood plan but the Municipal Director Plan had different articles that mention flooding area; 0.5—There is a flood plan which comprises the municipality, but is not at municipal lever; 0.75—The Municipal Emergency and Civil Protection and/or The Municipal Climate Change Adaptation contain specific articles/measures or mention floods; 1—Has a Municipal Flood Plan or Averse Meteorological Situations Plan or includes a full section dedicated to flood in the Municipal Emergency and Civil Protection Plan. | [11,12,34,45] |
| Governance, Planning and Governance, Strategies, Community involvement, Promoting integrated approaches to livelihoods, disasters and climate change | V313bi | Municipal participatory budget? | 0—No reference to the Municipal Participatory Budget was found or the last reference was previous to 2019; 1—There is a specific updated website dedicated to the Participatory Budget or there is evidence of a current or 2020/21 Participatory Budget | [11,33,34] |
| Governance, Planning and Governance, Research, Evaluate readiness to cope with crisis | V3141 | Social media are included as a way of communication/tool in the planning instruments. | Note: In this indicator, all internet-based communications. 0—No references found about internet-based communication in the Municipal Plans or Local Government website; 0.25—There are references but not at the municipal level (regional, district etc.) that refer to the municipality (for instance in Special Floods Plans and—Climate Change Strategies at other geographic scales); 0.5—There are references on the local government website; 0.75—There are references to internet-based communications (websites, Facebook etc.) in Municipal Plans such as Director Municipal Plan, or Local Government website but not found on the Municipal Emergency and Civil Protection Plan; 1—There are references on the Municipal Emergency and Civil Protection Plan of the usage of the website ADN other internet-based means (Facebook, Instagram, etc.). | [7,33,34,46] |
| Governance, Planning and Governance, Risk Governance, Early Warning | V3151 | Municipal warning system? Usage of regional or national warning systems? | 0—Municipal Emergency and Civil Protection Plan and Special Floods Plan and Local Government Website don’t mention warning systems for the municipality; 0.25—A reference to a warning system was found but not in the municipal level plan (e.g., a Special Floods Plan at the regional level, website, etc.); 0.5—The Municipal Emergency and Civil Protection Plan refer the use of a national level warning system; 0.75—The Municipal Emergency and Civil Protection Plan refers the use of a national level warning system and the intension to invest in a regional/municipal level warning system the evidence of such intention might be found in the local government website or local newspaper websites or online sources related to the municipality participation in regional projects; 1—The Local Government has invested and has a local/municipal floods warning system. | [33,34,45,47] |
| Governance, Planning and Governance, Risk Governance, Hazard prevention and protection capacity | V3152 | Planning and/or website refer prevention strategies? | 0—There are no references to prevention strategies or actions; 0.25—There are prevention actions/measures and strategies but are not specific for floods; 0.5—There are references to prevention actions/measures and strategies to floods but not specifically in Risk/Floods or in the Municipal Emergency and Civil Protection Plan; 0.75—There are clear and specific prevention actions/measures and strategies to floods in the local Government plans (e.g., Municipal Emergency and Civil Protection Plan, Municipal Director Plan etc) but those measures have no timeline; 1—There are clear and specific prevention actions/measures and strategies and Programmes to floods prevention in the local Government website or other documents with timeline, target groups specification and/or there are guidelines that are available for the population but might not be part of Municipal Emergency and Civil Protection Plan or Special Floods Plan; and/or Municipal Emergency and Civil Protection Plan/Special Floods Plan does have the timeline plan with actions for flood prevention. | [33,34,45,47] |
| Built Environment, Infrastructures, Transportation. | V4121 | Plans and/or website refer to evacuation routes? | 0—The information is not available or was not present on the Municipal Emergency and Civil Protection Plan nor on the local government website or the only reference is that the evacuation is a police/military task; 0.25—Some routes are referred or mapped but they are not specifically for floods; 0.5—There are evacuation routes and population agglomeration places and that are referred and mapped but they are not specifically for floods; 0.75—There are evacuation routes or population agglomeration places and that are referred and mapped; 1—There are evacuation routes and population agglomeration places and that are referred and mapped. | [7,33] |
| Natural Environment, Hazard, susceptibility and exposition analysis, Hazard assessment and proxy indicators | V511 | The regulation prohibiting building inside flooding areas | 0—There was a land use status change and/or authorization for construction in an Area Threatened by Floods after the definition of the National Ecological Network (REN) without any intervention to defend against the floods; 0.25—There was a land use status change for Construction and/or approval of new constructions as a result of being considered safe after regularization or to legalize previously existing constructions; 0.5—There was land use status change for regularization; 0.75—There was land use status change of areas threatened by floods for agricultural practice or landscape requalification; 1—There was no land use status change of an area threatened by floods in the last or two last REN updates. | [7,34] |
| Disaster, Learning from the past, Resilience and DRR evaluation, Learning from previous disaster aid experience | V6112 | Existence and/or reference of a historical database of events. | 0—No reference; 0.25—Refers to the date of the biggest flood or the last flood episode but without details; 0.5—Has reference to the biggest floods for years but no details; 0.75—Describes in detail at least 1 full episode; 1—Has an inventory with floods for periods/decades/years over time and details of affected locations and/or water height and/or affected population, etc. | [7,12,33,45,46] |
Appendix D. Total Variance Explained and Component Matrix from Conditions: (i), (ii) and (vii)
| Total Variance Explained | ||||||
|---|---|---|---|---|---|---|
| Component | Initial Eigenvalues | Extraction Sums of Squared Loadings | ||||
| Total | % of Variance | Cumulative % | Total | % of Variance | Cumulative % | |
| 1 | 6.462 | 23.934 | 23.934 | 6.462 | 23.934 | 23.934 |
| 2 | 3.200 | 11.850 | 35.784 | 3.200 | 11.850 | 35.784 |
| 3 | 2.694 | 9.978 | 45.762 | 2.694 | 9.978 | 45.762 |
| 4 | 2.370 | 8.779 | 54.541 | 2.370 | 8.779 | 54.541 |
| 5 | 1.615 | 5.983 | 60.524 | 1.615 | 5.983 | 60.524 |
| 6 | 1.417 | 5.247 | 65.771 | 1.417 | 5.247 | 65.771 |
| 7 | 1.053 | 3.900 | 69.672 | 1.053 | 3.900 | 69.672 |
| 8 | 0.992 | 3.675 | 73.347 | |||
| 9 | 0.932 | 3.454 | 76.800 | |||
| Extraction Method: Principal Component Analysis. | ||||||
| Component Matrix a | |||||||
|---|---|---|---|---|---|---|---|
| Component | |||||||
| 1 | 2 | 3 | 4 | 5 | 6 | 7 | |
| Zscore(V111NUTS II) | −0.453 | 0.554 | 0.342 | −0.285 | −0.063 | −0.183 | −0.099 |
| Zscore(V112) | 0.621 | 0.187 | 0.214 | 0.434 | 0.182 | −0.178 | 0.256 |
| Zscore(V113) | 0.057 | 0.118 | 0.028 | 0.548 | −0.020 | 0.233 | −0.242 |
| Zscore(V115NUTS II) | −0.124 | 0.177 | −0.540 | 0.431 | 0.444 | 0.218 | 0.264 |
| Zscore(V117) | −0.244 | −0.578 | −0.041 | 0.355 | 0.151 | 0.164 | −0.104 |
| Zscore(V1181) | 0.868 | 0.146 | 0.294 | 0.014 | 0.028 | 0.087 | −0.065 |
| Zscore(V1182) | 0.040 | −0.104 | 0.324 | 0.232 | 0.262 | −0.387 | 0.448 |
| Zscore(V1191) | −0.721 | 0.144 | −0.198 | 0.286 | 0.280 | 0.021 | 0.053 |
| Zscore(V1192) | 0.850 | −0.270 | 0.044 | −0.213 | 0.145 | −0.027 | −0.074 |
| Zscore(V1211) | 0.542 | 0.153 | 0.293 | 0.285 | 0.368 | −0.312 | −0.082 |
| Zscore(V1311) | −0.273 | −0.478 | 0.588 | 0.201 | −0.188 | −0.221 | −0.027 |
| Zscore(V1312) | −0.006 | 0.114 | −0.109 | −0.633 | −0.073 | 0.068 | 0.368 |
| Zscore(V1313) | 0.245 | 0.693 | −0.344 | −0.102 | 0.011 | 0.232 | 0.077 |
| Zscore(V1321) | 0.582 | 0.377 | 0.494 | −0.229 | −0.043 | 0.029 | −0.147 |
| Zscore(V1322) | −0.395 | 0.063 | 0.563 | −0.236 | 0.412 | 0.327 | 0.043 |
| Zscore(V1331) | 0.435 | −0.108 | 0.028 | −0.059 | 0.460 | 0.082 | −0.213 |
| Zscore(V1411) | −0.483 | 0.769 | 0.093 | 0.189 | 0.013 | −0.055 | −0.102 |
| Zscore(V1423) | 0.599 | −0.685 | 0.000 | −0.058 | −0.005 | 0.066 | 0.117 |
| Zscore(V143) | 0.223 | 0.378 | −0.235 | −0.139 | 0.166 | −0.428 | −0.302 |
| Zscore(V212) | 0.618 | 0.292 | 0.009 | 0.301 | −0.122 | 0.176 | 0.036 |
| Zscore(V221) | 0.627 | 0.038 | 0.089 | 0.154 | 0.022 | 0.329 | −0.257 |
| Zscore(V222) | 0.192 | 0.002 | −0.586 | 0.422 | −0.364 | −0.343 | −0.066 |
| Zscore(V2231Dist) | −0.011 | −0.216 | −0.437 | −0.307 | 0.510 | 0.053 | −0.228 |
| Zscore(V2232) | 0.408 | 0.150 | 0.130 | 0.247 | −0.381 | 0.466 | 0.171 |
| Zscore(V2413) | 0.569 | −0.156 | −0.485 | −0.341 | −0.149 | −0.082 | −0.036 |
| Zscore(V2414) | −0.762 | −0.180 | 0.125 | −0.033 | −0.017 | 0.259 | −0.102 |
| Zscore(V2415) | 0.400 | 0.181 | −0.089 | −0.198 | 0.162 | 0.058 | 0.358 |
| Extraction Method: Principal Component Analysis. | |||||||
| a. 7 components extracted. | |||||||
| Total Variance Explained | ||||||
|---|---|---|---|---|---|---|
| Component | Initial Eigenvalues | Extraction Sums of Squared Loadings | ||||
| Total | % of Variance | Cumulative % | Total | % of Variance | Cumulative % | |
| 1 | 6.273 | 26.137 | 26.137 | 6.273 | 26.137 | 26.137 |
| 2 | 2.880 | 11.999 | 38.136 | 2.880 | 11.999 | 38.136 |
| 3 | 2.376 | 9.901 | 48.037 | 2.376 | 9.901 | 48.037 |
| 4 | 2.055 | 8.563 | 56.600 | 2.055 | 8.563 | 56.600 |
| 5 | 1.417 | 5.902 | 62.503 | 1.417 | 5.902 | 62.503 |
| 6 | 1.127 | 4.694 | 67.197 | 1.127 | 4.694 | 67.197 |
| 7 | 0.959 | 3.997 | 71.194 | |||
| 8 | 0.884 | 3.685 | 74.879 | |||
| 9 | 0.868 | 3.616 | 78.495 | |||
| Extraction Method: Principal Component Analysis. | ||||||
| Component Matrix a | ||||||
|---|---|---|---|---|---|---|
| Component | ||||||
| 1 | 2 | 3 | 4 | 5 | 6 | |
| Zscore (V112) | 0.631 | 0.065 | 0.426 | 0.269 | 0.217 | −0.114 |
| Zscore (V113) | 0.060 | 0.081 | 0.275 | 0.460 | −0.251 | 0.407 |
| Zscore (V117) | −0.291 | −0.544 | 0.032 | 0.311 | −0.080 | 0.353 |
| Zscore (V1181) | 0.879 | 0.017 | 0.278 | −0.103 | −0.086 | −0.007 |
| Zscore (V1182) | 0.039 | −0.204 | 0.390 | 0.088 | 0.438 | −0.263 |
| Zscore (V1191) | −0.710 | 0.208 | 0.082 | 0.229 | 0.117 | 0.193 |
| Zscore (V1192) | 0.833 | −0.327 | −0.091 | −0.184 | 0.082 | 0.076 |
| Zscore (V1211) | 0.559 | 0.011 | 0.465 | 0.138 | 0.398 | 0.077 |
| Zscore (V1311) | −0.300 | −0.590 | 0.404 | 0.068 | 0.051 | −0.268 |
| Zscore (V1312) | 0.012 | 0.132 | −0.377 | −0.576 | −0.008 | −0.093 |
| Zscore (V1313) | 0.288 | 0.744 | −0.173 | −0.051 | −0.147 | 0.162 |
| Zscore (V1321) | 0.612 | 0.238 | 0.389 | −0.375 | −0.064 | −0.153 |
| Zscore (V1322) | −0.374 | −0.066 | 0.502 | −0.588 | −0.070 | 0.278 |
| Zscore (V1331) | 0.431 | −0.155 | 0.067 | −0.124 | 0.165 | 0.598 |
| Zscore (V1411) | −0.430 | 0.761 | 0.349 | 0.077 | 0.055 | −0.043 |
| Zscore (V1423) | 0.552 | −0.719 | −0.203 | −0.005 | −0.071 | 0.033 |
| Zscore (V143) | 0.258 | 0.378 | −0.189 | 0.008 | 0.468 | 0.255 |
| Zscore (V212) | 0.630 | 0.242 | 0.173 | 0.239 | −0.230 | −0.072 |
| Zscore (V221) | 0.627 | −0.022 | 0.179 | 0.104 | −0.338 | 0.138 |
| Zscore (V222) | 0.175 | 0.134 | −0.431 | 0.733 | 0.121 | −0.126 |
| Zscore (V2232) | 0.412 | 0.092 | 0.171 | 0.160 | −0.618 | −0.167 |
| Zscore (V2413) | 0.559 | −0.077 | −0.650 | −0.038 | 0.017 | 0.010 |
| Zscore (V2414) | −0.772 | −0.141 | 0.087 | −0.092 | −0.247 | 0.064 |
| Zscore (V2415) | 0.413 | 0.159 | −0.100 | −0.249 | 0.090 | 0.006 |
| Extraction Method: Principal Component Analysis. | ||||||
| a. 6 components extracted. | ||||||
| Total Variance Explained | |||||||||
|---|---|---|---|---|---|---|---|---|---|
| Component | Initial Eigenvalues | Extraction Sums of Squared Loadings | Rotation Sums of Squared Loadings | ||||||
| Total | % of Variance | Cumulative % | Total | % of Variance | Cumulative % | Total | % of Variance | Cumulative % | |
| 1 | 6.462 | 23.934 | 23.934 | 6.462 | 23.934 | 23.934 | 5.343 | 19.790 | 19.790 |
| 2 | 3.200 | 11.850 | 35.784 | 3.200 | 11.850 | 35.784 | 3.535 | 13.094 | 32.884 |
| 3 | 2.694 | 9.978 | 45.762 | 2.694 | 9.978 | 45.762 | 2.374 | 8.792 | 41.677 |
| 4 | 2.370 | 8.779 | 54.541 | 2.370 | 8.779 | 54.541 | 2.309 | 8.553 | 50.230 |
| 5 | 1.615 | 5.983 | 60.524 | 1.615 | 5.983 | 60.524 | 2.011 | 7.447 | 57.677 |
| 6 | 1.417 | 5.247 | 65.771 | 1.417 | 5.247 | 65.771 | 1.641 | 6.076 | 63.753 |
| 7 | 1.053 | 3.900 | 69.672 | 1.053 | 3.900 | 69.672 | 1.598 | 5.919 | 69.672 |
| 8 | 0.992 | 3.675 | 73.347 | ||||||
| 9 | 0.932 | 3.454 | 76.800 | ||||||
| Extraction Method: Principal Component Analysis. | |||||||||
| Rotated Component Matrix | |||||||
|---|---|---|---|---|---|---|---|
| Component | |||||||
| 1 | 2 | 3 | 4 | 5 | 6 | 7 | |
| Zscore (V111NUTS II) | −0.058 | −0.777 | 0.248 | −0.193 | −0.216 | −0.052 | 0.051 |
| Zscore (V112) | 0.551 | 0.065 | −0.153 | 0.184 | 0.177 | 0.607 | −0.142 |
| Zscore (V113) | 0.114 | −0.072 | −0.050 | 0.125 | 0.600 | −0.043 | −0.182 |
| Zscore (V115NUTS II) | −0.329 | 0.041 | −0.062 | 0.774 | 0.288 | 0.199 | 0.058 |
| Zscore (V117) | −0.391 | 0.431 | 0.129 | −0.126 | 0.458 | 0.018 | 0.030 |
| Zscore (V1181) | 0.903 | 0.185 | −0.024 | 0.061 | 0.013 | 0.114 | −0.094 |
| Zscore (V1182) | −0.026 | 0.044 | 0.083 | −0.116 | −0.041 | 0.752 | −0.024 |
| Zscore (V1191) | −0.672 | −0.334 | 0.153 | 0.237 | 0.280 | 0.098 | 0.110 |
| Zscore (V1192) | 0.692 | 0.561 | −0.094 | −0.012 | −0.155 | 0.054 | 0.202 |
| Zscore (V1211) | 0.591 | −0.018 | −0.046 | 0.008 | 0.242 | 0.510 | 0.229 |
| Zscore (V1311) | −0.189 | 0.099 | 0.190 | −0.743 | 0.205 | 0.256 | −0.178 |
| Zscore (V1312) | −0.038 | −0.004 | 0.117 | 0.150 | −0.717 | −0.131 | −0.041 |
| Zscore (V1313) | 0.294 | −0.348 | −0.149 | 0.653 | −0.173 | −0.196 | −0.073 |
| Zscore (V1321) | 0.837 | −0.195 | 0.158 | −0.106 | −0.150 | 0.000 | −0.064 |
| Zscore (V1322) | −0.083 | −0.187 | 0.872 | −0.064 | −0.023 | 0.043 | 0.042 |
| Zscore (V1331) | 0.411 | 0.297 | 0.165 | 0.154 | 0.126 | 0.045 | 0.378 |
| Zscore (V1411) | −0.142 | −0.889 | 0.079 | 0.179 | 0.177 | 0.012 | −0.053 |
| Zscore (V1423) | 0.284 | 0.852 | −0.083 | −0.150 | −0.082 | 0.084 | −0.026 |
| Zscore (V143) | 0.283 | −0.315 | −0.344 | 0.109 | −0.081 | 0.009 | 0.503 |
| Zscore (V212) | 0.586 | 0.034 | −0.223 | 0.291 | 0.177 | 0.065 | −0.301 |
| Zscore (V221) | 0.638 | 0.244 | 0.000 | 0.151 | 0.282 | −0.157 | −0.086 |
| Zscore (V222) | −0.088 | 0.050 | −0.866 | 0.103 | 0.199 | 0.012 | −0.045 |
| Zscore (V2231Dist) | −0.138 | 0.295 | 0.089 | 0.277 | −0.060 | −0.211 | 0.639 |
| Zscore (V2232) | 0.393 | 0.110 | −0.038 | 0.181 | 0.116 | −0.113 | −0.657 |
| Zscore (V2413) | 0.297 | 0.415 | −0.470 | 0.152 | −0.363 | −0.246 | 0.183 |
| Zscore (V2414) | −0.614 | −0.135 | 0.423 | −0.201 | 0.149 | −0.257 | −0.065 |
| Zscore (V2415) | 0.298 | 0.116 | 0.009 | 0.371 | −0.354 | 0.176 | −0.031 |
| Extraction Method: Principal Component Analysis. Rotation Method: Varimax with Kaiser Normalization. | |||||||
| Rotation converged in 12 iterations. | |||||||
References
- Parsons, M.; Reeve, I.; McGregor, J.; Hastings, P.; Marshall, G.R.; McNeill, J.; Stayner, R.; Glavac, S. Disaster Resilience in Australia: A Geographic Assessment Using an Index of Coping and Adaptive Capacity. Int. J. Disaster Risk Reduct. 2021, 62, 102422. [Google Scholar] [CrossRef]
- Kotzee, I.; Reyers, B. Piloting a Social-Ecological Index for Measuring Flood Resilience: A Composite Index Approach. Ecol. Indic. 2016, 60, 45–53. [Google Scholar] [CrossRef]
- Jacinto, R.; Grosso, N.; Reis, E.; Dias, L.; Santos, F.D.; Garrett, P. Continental Portuguese Territory Flood Susceptibility Index—Contribution to a Vulnerability Index. Nat. Hazards Earth Syst. Sci. 2015, 15, 1907–1919. [Google Scholar] [CrossRef]
- Pereira, S.; Diakakis, M.; Deligiannakis, G.; Zêzere, J.L. Comparing Flood Mortality in Portugal and Greece (Western and Eastern Mediterranean). Int. J. Disaster Risk Reduct. 2017, 22, 147–157. [Google Scholar] [CrossRef]
- Jacinto, R.; Reis, E.; Ferrão, J. Indicators for the Assessment of Social Resilience in Flood-Affected Communities—A Text Mining-Based Methodology. Sci. Total Environ. 2020, 744, 140973. [Google Scholar] [CrossRef] [PubMed]
- Santos, P.P.; Pereira, S.; Zêzere, J.L.; Tavares, A.O.; Reis, E.; Garcia, R.A.C.; Oliveira, S.C. A Comprehensive Approach to Understanding Flood Risk Drivers at the Municipal Level. J. Environ. Manag. 2020, 260, 110127. [Google Scholar] [CrossRef] [PubMed]
- Cutter, S.L.; Ash, K.D.; Emrich, C.T. The Geographies of Community Disaster Resilience. Glob. Environ. Change 2014, 29, 65–77. [Google Scholar] [CrossRef]
- Cai, H.; Lam, N.S.N.; Qiang, Y.; Zou, L.; Correll, R.M.; Mihunov, V. A Synthesis of Disaster Resilience Measurement Methods and Indices. Int. J. Disaster Risk Reduct. 2018, 31, 844–855. [Google Scholar] [CrossRef]
- Haque, M.M.; Islam, S.; Sikder, M.B.; Islam, M.S. Community Flood Resilience Assessment in Jamuna Floodplain: A Case Study in Jamalpur District Bangladesh. Int. J. Disaster Risk Reduct. 2022, 72, 102861. [Google Scholar] [CrossRef]
- Kerstholt, J.; Duijnhoven, H.; Paton, D. Flooding in The Netherlands: How People’s Interpretation of Personal, Social and Institutional Resources Influence Flooding Preparedness. Int. J. Disaster Risk Reduct. 2017, 24, 52–57. [Google Scholar] [CrossRef]
- Tanner, T.; Lewis, D.; Wrathall, D.; Bronen, R.; Cradock-Henry, N.; Huq, S.; Lawless, C.; Nawrotzki, R.; Prasad, V.; Rahman, M.A.; et al. Livelihood Resilience in the Face of Climate Change. Nat. Clim. Change 2015, 5, 23–26. [Google Scholar] [CrossRef]
- Khalili, S.; Harre, M.; Morley, P. A Temporal Framework of Social Resilience Indicators of Communities to Flood, Case Studies: Wagga Wagga and Kempsey, NSW, Australia. Int. J. Disaster Risk Reduct. 2015, 13, 248–254. [Google Scholar] [CrossRef]
- Lin, K.H.E.; Lee, H.C.; Lin, T.H. How Does Resilience Matter? An Empirical Verification of the Relationships between Resilience and Vulnerability. Nat. Hazards 2017, 88, 1229–1250. [Google Scholar] [CrossRef]
- Lwin, K.K.; Pal, I.; Shrestha, S.; Warnitchai, P. Assessing Social Resilience of Flood-Vulnerable Communities in Ayeyarwady Delta, Myanmar. Int. J. Disaster Risk Reduct. 2020, 51, 101745. [Google Scholar] [CrossRef]
- Scherzer, S.; Lujala, P.; Rød, J.K. A Community Resilience Index for Norway: An Adaptation of the Baseline Resilience Indicators for Communities (BRIC). Int. J. Disaster Risk Reduct. 2019, 36, 101107. [Google Scholar] [CrossRef]
- Assumma, V.; Bottero, M.; De Angelis, E.; Lourenço, J.M.; Monaco, R.; Soares, A.J. Scenario Building Model to Support the Resilience Planning of Wine Regions: The Case of the Douro Valley (Portugal). SSRN Electron. J. 2022, 838, 155889. [Google Scholar] [CrossRef]
- Beceiro, P.; Brito, R.S.; Galvão, A. Assessment of the Contribution of Nature-Based Solutions (NBS) to Urban Resilience: Application to the Case Study of Porto. Ecol. Eng. 2022, 175, 106489. [Google Scholar] [CrossRef]
- Leandro, J.; Chen, K.F.; Wood, R.R.; Ludwig, R. A Scalable Flood-Resilience-Index for Measuring Climate Change Adaptation: Munich City. Water Res. 2020, 173, 115502. [Google Scholar] [CrossRef]
- Summers, J.K.; Harwell, L.C.; Smith, L.M.; Buck, K.D. Measuring Community Resilience to Natural Hazards: The Natural Hazard Resilience Screening Index (NaHRSI)—Development and Application to the United States. GeoHealth 2018, 2, 372–394. [Google Scholar] [CrossRef]
- Clark-Ginsberg, A.; McCaul, B.; Bremaud, I.; Cáceres, G.; Mpanje, D.; Patel, S.; Patel, R. Practitioner Approaches to Measuring Community Resilience: The Analysis of the Resilience of Communities to Disasters Toolkit. Int. J. Disaster Risk Reduct. 2020, 50, 101714. [Google Scholar] [CrossRef]
- Cutter, S.L.; Boruff, B.J.; Shirley, W.L. Social Vulnerability to Environmental Hazards. Soc. Sci. Q. 2003, 84, 242–261. [Google Scholar] [CrossRef]
- Rana, I.A.; Bhatti, S.S.; Jamshed, A.; Ahmad, S. An Approach to Understanding the Intrinsic Complexity of Resilience against Floods: Evidences from Three Urban Communities of Pakistan. Int. J. Disaster Risk Reduct. 2021, 63, 102442. [Google Scholar] [CrossRef]
- Tavares, A.O.; Barros, J.L.; Mendes, J.M.; Santos, P.P.; Pereira, S. Decennial Comparison of Changes in Social Vulnerability: A Municipal Analysis in Support of Risk Management. Int. J. Disaster Risk Reduct. 2018, 31, 679–690. [Google Scholar] [CrossRef]
- Bonati, S. Resilientscapes: Perception and Resilience to Reduce Vulnerability in the Island of Madeira. Procedia Econ. Financ. 2014, 18, 513–520. [Google Scholar] [CrossRef]
- Ferrari, S.; Oliveira, S.; Pautasso, G.; Zêzere, J.L. Territorial Resilience and Flood Vulnerability. Case Studies at Urban Scale in Torino (Italy) and Porto/Vila Nova de Gaia (Portugal). In Resilient Cities Re-thinking Urban Transformation Urban Resilience for Risk and Adaptation Governance; Brunetta, G., Tollin, N., Morató, J., Caldarice, O., Rosas-Casals, M., Eds.; Springer International Publishing AG: Cham, Switzerland, 2019; pp. 147–174. ISBN 9783319769431. [Google Scholar]
- Carvalho, D.; Martins, H.; Marta-Almeida, M.; Rocha, A.; Borrego, C. Urban Resilience to Future Urban Heat Waves under a Climate Change Scenario: A Case Study for Porto Urban Area (Portugal). Urban Clim. 2017, 19, 1–27. [Google Scholar] [CrossRef]
- Cardoso, M.A.; do Céu Almeida, M.; Telhado, M.J.; Morais, M.; Brito, R.S. Assessing Urban Resilience to Cope with Climate Change. In Investing in Disaster Risk Reduction for Resilience; Elsevier: Amsterdam, The Netherlands, 2022; pp. 163–188. [Google Scholar] [CrossRef]
- Santos, P.P.; Reis, E.; Pereira, S.; Santos, M. A Flood Susceptibility Model at the National Scale Based on Multicriteria Analysis. Sci. Total Environ. 2019, 667, 325–337. [Google Scholar] [CrossRef]
- Grosso, N.; Dias, L.; Costa, H.P.; Santos, F.D.; Garrett, P. Continental Portuguese Territory Flood Social Susceptibility Index. Nat. Hazards Earth Syst. Sci. 2015, 15, 1921–1931. [Google Scholar] [CrossRef]
- Bakkour, D.; Enjolras, G.; Thouret, J.C.; Kast, R.; Mei, E.T.W.; Prihatminingtyas, B. The Adaptive Governance of Natural Disaster Systems: Insights from the 2010 Mount Merapi Eruption in Indonesia. Int. J. Disaster Risk Reduct. 2015, 13, 167–188. [Google Scholar] [CrossRef]
- Açores, A.L.; dos da, R.A. Decreto Legislativo Regional No 20/2016. Diário da República 2016, 1a Série. pp. 3528–3587. Available online: https://files.dre.pt/1s/2016/10/19400/0352803587.pdf (accessed on 1 March 2021).
- Caetano, C.C.T. Avaliação Do Risco de Aluviões Na Ilha Da Madeira. Universidade de Lisboa. 2011. Available online: https://www.researchgate.net/publication/244994405_Avaliacao_do_risco_de_aluvioes_na_Ilha_da_Madeira (accessed on 1 January 2020).
- Béné, C.; Al-Hassan, R.M.; Amarasinghe, O.; Fong, P.; Ocran, J.; Onumah, E.; Ratuniata, R.; Van Tuyen, T.; McGregor, J.A.; Mills, D.J. Is Resilience Socially Constructed? Empirical Evidence from Fiji, Ghana, Sri Lanka, and Vietnam. Glob. Environ. Change 2016, 38, 153–170. [Google Scholar] [CrossRef] [Green Version]
- Rahman, M.B.; Nurhasanah, I.S.; Nugroho, S.P. Community Resilience: Learning from Mt Merapi Eruption 2010. Procedia-Soc. Behav. Sci. 2016, 227, 387–394. [Google Scholar] [CrossRef]
- Boylan, J.L.; Lawrence, C. What Does It Mean to Psychologically Prepare for a Disaster? A Systematic Review. Int. J. Disaster Risk Reduct. 2020, 45, 101480. [Google Scholar] [CrossRef]
- Parsons, M.; Glavac, S.; Hastings, P.; Marshall, G.; McGregor, J.; McNeill, J.; Morley, P.; Reeve, I.; Stayner, R. Top-down Assessment of Disaster Resilience: A Conceptual Framework Using Coping and Adaptive Capacities. Int. J. Disaster Risk Reduct. 2016, 19, 1–11. [Google Scholar] [CrossRef]
- Guillard-Goncąlves, C.; Cutter, S.L.; Emrich, C.T.; Zêzere, J.L. Application of Social Vulnerability Index (SoVI) and Delineation of Natural Risk Zones in Greater Lisbon, Portugal. J. Risk Res. 2015, 18, 651–674. [Google Scholar] [CrossRef]
- Marôco, J. Análise Estatística Com o SPSS Statistics, 8th ed.; Análise e Gestão de Informação, LDA; Pêro Pinheiro: Lisboa, Portugal, 2021; ISBN 978-989-96763-4-3. [Google Scholar]
- Jonhson, D. Applied Multivariate Methods for Data Analysts; Brooks, Coole Publishing Company: Pacific Grove, CA, USA, 1998; ISBN 9780534237967. [Google Scholar]
- Szu-Ting Fu, T.; Koutstaal, W.; Poon, L.; Cleare, A.J. Confidence Judgment in Depression and Dysphoria: The Depressive Realism vs. Negativity Hypotheses. J. Behav. Ther. Exp. Psychiatry 2012, 43, 699–704. [Google Scholar] [CrossRef]
- Lee, J.; Perera, D.; Glickman, T.; Taing, L. Water-Related Disasters and Their Health Impacts: A Global Review. Prog. Disaster Sci. 2020, 8, 100123. [Google Scholar] [CrossRef]
- Xiao, Y.; van Zandt, S. Building Community Resiliency: Spatial Links between Household and Business Post-Disaster Return. Urban Stud. 2012, 49, 2523–2542. [Google Scholar] [CrossRef]
- Fantechi, F.; Urso, G.; Modica, M. Can Extreme Events Be an Opportunity? Depopulation and Resilience of Rural Communities in Central Italy after the 1997 Earthquake. J. Rural Stud. 2020, 79, 311–321. [Google Scholar] [CrossRef]
- Fitzpatrick, K.M.; Spialek, M.L. Suicide Ideation and a Post-Disaster Assessment of Risk and Protective Factors among Hurricane Harvey Survivors: Suicide Ideation Among Hurricane Harvey Survivors. J. Affect. Disord. 2020, 277, 681–687. [Google Scholar] [CrossRef] [PubMed]
- Adini, B.; Cohen, O.; Eide, A.W.; Nilsson, S.; Aharonson-Daniel, L.; Herrera, I.A. Striving to Be Resilient: What Concepts, Approaches and Practices Should Be Incorporated in Resilience Management Guidelines? Technol. Forecast. Soc. Change 2017, 121, 39–49. [Google Scholar] [CrossRef]
- Kelman, I.; Gaillard, J.C.; Lewis, J.; Mercer, J. Learning from the History of Disaster Vulnerability and Resilience Research and Practice for Climate Change. Nat. Hazards 2016, 82, 129–143. [Google Scholar] [CrossRef] [Green Version]
- Butler, C.; Walker-Springett, K.; Adger, W.N.; Evans, L.; O’Neill, S.; Adger, N. Social and Political Dynamics of Flood Risk, Recovery and Response: A Report on the Findings of the Winter Floods Project. 2016. Available online: https://geography.exeter.ac.uk/media/universityofexeter/schoolofgeography/winterfloods/documents/Butler_et_al_2016_Socia_Political_DynamicsFloods.pdf (accessed on 1 October 2017).



| Total Variance Explained | |||||||||
|---|---|---|---|---|---|---|---|---|---|
| Component | Initial Eigenvalues | Extraction Sums of Squared Loadings | Rotation Sums of Squared Loadings | ||||||
| Total | % of Variance | Cumulative % | Total | % of Variance | Cumulative % | Total | % of Variance | Cumulative % | |
| 1 | 6.273 | 26.137 | 26.137 | 6.273 | 26.137 | 26.137 | 3.848 | 16.033 | 16.033 |
| 2 | 2.880 | 11.999 | 38.136 | 2.880 | 11.999 | 38.136 | 3.129 | 13.039 | 29.072 |
| 3 | 2.376 | 9.901 | 48.037 | 2.376 | 9.901 | 48.037 | 2.709 | 11.288 | 40.360 |
| 4 | 2.055 | 8.563 | 56.600 | 2.055 | 8.563 | 56.600 | 2.678 | 11.159 | 51.519 |
| 5 | 1.417 | 5.902 | 62.503 | 1.417 | 5.902 | 62.503 | 2.107 | 8.781 | 60.299 |
| 6 | 1.127 | 4.694 | 67.197 | 1.127 | 4.694 | 67.197 | 1.655 | 6.897 | 67.197 |
| 7 | 0.959 | 3.997 | 71.194 | ||||||
| 8 | 0.884 | 3.685 | 74.879 | ||||||
| 9 | 0.868 | 3.616 | 78.495 | ||||||
| Extraction Method: Principal Component Analysis. | |||||||||
| Rotated Component Matrix a | ||||||
|---|---|---|---|---|---|---|
| Component | ||||||
| 1 | 2 | 3 | 4 | 5 | 6 | |
| Z-score(V112) (−) | 0.097 | 0.400 | 0.053 | 0.720 | −0.142 | 0.083 |
| Z-score(V113) (−) | −0.127 | 0.265 | 0.073 | 0.037 | −0.036 | 0.657 |
| Z-score(V117) | 0.204 | −0.269 | −0.358 | −0.164 | 0.020 | 0.584 |
| Z-score(V1181) | 0.413 | 0.642 | 0.222 | 0.472 | 0.097 | −0.070 |
| Z-score(V1182) | −0.041 | −0.143 | −0.329 | 0.572 | 0.007 | −0.073 |
| Z-score(V1191) | −0.584 | −0.433 | −0.055 | −0.174 | 0.018 | 0.309 |
| Z-score(V1192) | 0.786 | 0.282 | 0.187 | 0.330 | 0.015 | −0.116 |
| Z-score(V1211) | 0.143 | 0.184 | 0.129 | 0.789 | 0.042 | 0.137 |
| Z-score(V1311) (−) | 0.021 | −0.148 | −0.775 | 0.164 | 0.155 | 0.079 |
| Z-score(V1312) (−) | 0.139 | −0.104 | 0.266 | −0.288 | 0.182 | −0.532 |
| Z-score(V1313) | −0.241 | 0.338 | 0.722 | −0.086 | −0.088 | −0.096 |
| Z-score(V1321) | 0.090 | 0.568 | 0.211 | 0.410 | 0.319 | −0.326 |
| Z-score(V1322) | −0.187 | −0.125 | −0.119 | −0.051 | 0.869 | 0.032 |
| Z-score(V1331) | 0.472 | −0.018 | 0.379 | 0.249 | 0.280 | 0.327 |
| Z-score(V1411) | −0.915 | 0.012 | 0.213 | 0.070 | 0.096 | 0.004 |
| Z-score(V1423) (−) | 0.889 | 0.132 | −0.212 | 0.068 | −0.097 | 0.054 |
| Z-score(V143) (−) | 0.012 | −0.207 | 0.615 | 0.298 | −0.135 | −0.030 |
| Z-score(V212) (−) | 0.075 | 0.658 | 0.207 | 0.268 | −0.204 | 0.070 |
| Z-score(V221) (−) | 0.317 | 0.621 | 0.139 | 0.151 | 0.014 | 0.205 |
| Z-score(V222) (−) | 0.004 | −0.006 | 0.134 | 0.043 | −0.866 | 0.180 |
| Z-score(V2232) | 0.045 | 0.784 | −0.070 | −0.092 | −0.093 | 0.066 |
| Z-score(V2413) (−) | 0.617 | 0.078 | 0.379 | −0.116 | −0.385 | −0.225 |
| Z-score(V2414) | −0.352 | −0.290 | −0.387 | −0.480 | 0.292 | 0.152 |
| Z-score(V2415) (−) | 0.214 | 0.154 | 0.343 | 0.150 | 0.049 | −0.254 |
| Extraction Method: Principal Component Analysis. Rotation Method: Varimax with Kaiser Normalization. a | ||||||
| a. Rotation converged in 15 iterations. | ||||||
| Condition (a) CATPCA 36 Municipalities, 12 variables, 12 Dimensions in Solution | |||
| Model Summary | |||
| Dim | Cronbach’s Alpha | Variance Accounted For | |
| Total (Eigenvalue) | % of Variance | ||
| 1 | 0.639 | 2.413 | 20.107 |
| 2 | 0.622 | 2.329 | 19.405 |
| 3 | 0.326 | 1.427 | 11.891 |
| 4 | 0.214 | 1.245 | 10.373 |
| 5 | 0.093 | 1.094 | 9.114 |
| 6 | −0.037 | 0.967 | 8.060 |
| 7 | −0.412 | 0.726 | 6.047 |
| 8 | −0.681 | 0.616 | 5.132 |
| 9 | −1.015 | 0.518 | 4.317 |
| 10 | −2.296 | 0.322 | 2.684 |
| 11 | −4.280 | 0.203 | 1.693 |
| 12 | −6.623 | 0.141 | 1.178 |
| Total | 1.000 a | 12.000 | 100.000 |
| a. Total Cronbach’s Alpha is based on the total Eigenvalue. | |||
| Condition (b) CATPCA 36 Municipalities, 12 variables, 5 Dimensions in Solution | |||
| Model Summary | |||
| Dim | Cronbach’s Alpha | Variance Accounted For | |
| Total (Eigenvalue) | % of Variance | ||
| 1 | 0.751 | 3.214 | 26.787 |
| 2 | 0.649 | 2.466 | 20.548 |
| 3 | 0.330 | 1.434 | 11.953 |
| 4 | 0.239 | 1.281 | 10.677 |
| 5 | 0.082 | 1.081 | 9.010 |
| Total | 0.976 a | 9.477 | 78.975 |
| a. Total Cronbach’s Alpha is based on the total Eigenvalue. | |||
| Condition (c) CATPCA 36 Municipalities, 12 variables, 5 Dimensions in Solution with Varimax | |||
| Model Summary Rotation | |||
| Dim | Cronbach’s Alpha | Variance Accounted For | |
| Total (Eigenvalue) | % of Variance | ||
| 1 | 0.726 | 2.801 | 23.340 |
| 2 | 0.627 | 2.117 | 17.640 |
| 3 | 0.569 | 1.900 | 15.832 |
| 4 | 0.422 | 1.355 | 11.288 |
| 5 | 0.273 | 1.305 | 10.876 |
| Total | 0.976 b | 9.477 | 78.975 |
| Rotation Method: Varimax with Kaiser Normalization. | |||
| b. Total Cronbach’s Alpha is based on the total Eigenvalue. | |||
| Condition (b) | |||||
| Component Loadings | |||||
| Dimension | |||||
| 1 | 2 | 3 | 4 | 5 | |
| V311 | 0.544 | 0.236 | −0.093 | −0.438 | −0.304 |
| V3112 | −0.146 | 0.853 | 0.040 | 0.048 | 0.276 |
| V3117 | 0.917 | −0.052 | 0.317 | −0.025 | 0.098 |
| V3151 | 0.588 | 0.588 | −0.116 | −0.025 | −0.346 |
| V3152 | −0.352 | 0.437 | 0.620 | 0.065 | −0.213 |
| V4121 | 0.901 | −0.119 | 0.320 | −0.042 | 0.038 |
| V511 | 0.343 | 0.041 | −0.523 | 0.479 | 0.097 |
| V6112 | −0.169 | 0.617 | 0.442 | −0.148 | 0.177 |
| V3141 | −0.005 | 0.104 | 0.294 | 0.853 | −0.014 |
| V3113bi | 0.191 | 0.741 | −0.426 | 0.179 | −0.296 |
| V3114bi | 0.437 | 0.273 | −0.142 | −0.082 | 0.771 |
| V313bi | −0.633 | 0.335 | −0.258 | −0.252 | 0.117 |
| Variable Principal Normalization. | |||||
| Condition (c) | |||||
| Rotated Component Loadings a | |||||
| Dimension | |||||
| 1 | 2 | 3 | 4 | 5 | |
| V311 | 0.390 | 0.484 | 0.007 | −0.036 | −0.507 |
| V3112 | −0.288 | 0.430 | 0.556 | 0.484 | 0.135 |
| V3117 | 0.943 | 0.112 | −0.030 | 0.221 | −0.048 |
| V3151 | 0.356 | 0.823 | 0.102 | 0.041 | −0.098 |
| V3152 | −0.091 | 0.040 | 0.794 | −0.250 | 0.212 |
| V4121 | 0.946 | 0.081 | −0.059 | 0.142 | −0.071 |
| V511 | 0.049 | 0.368 | −0.549 | 0.261 | 0.351 |
| V6112 | −0.073 | 0.113 | 0.762 | 0.242 | −0.002 |
| V3141 | 0.123 | 0.050 | 0.115 | −0.067 | 0.888 |
| V3113bi | −0.159 | 0.918 | 0.025 | 0.097 | 0.096 |
| V3114bi | 0.219 | 0.064 | −0.041 | 0.911 | −0.068 |
| V313bi | −0.741 | 0.045 | 0.218 | 0.128 | −0.205 |
| Variable Principal Normalization. | |||||
| a. Rotation Method: Varimax with Kaiser Normalization. Rotation failed to converge in 6 iterations. (Convergence = 0.000). | |||||
| Quantitative | ||||
|---|---|---|---|---|
| Low | Moderate | High | ||
| Categorical | Low | Low, Low | Low, Moderate | Low, High |
| Moderate | Moderate, Low | Moderate, Moderate | Moderate, High | |
| High | High, Low | High, Moderate | High, High | |
Disclaimer/Publisher’s Note: The statements, opinions and data contained in all publications are solely those of the individual author(s) and contributor(s) and not of MDPI and/or the editor(s). MDPI and/or the editor(s) disclaim responsibility for any injury to people or property resulting from any ideas, methods, instructions or products referred to in the content. |
© 2023 by the authors. Licensee MDPI, Basel, Switzerland. This article is an open access article distributed under the terms and conditions of the Creative Commons Attribution (CC BY) license (https://creativecommons.org/licenses/by/4.0/).
Share and Cite
Jacinto, R.; Sebastião, F.; Reis, E.; Ferrão, J. SoResilere—A Social Resilience Index Applied to Portuguese Flood Disaster-Affected Municipalities. Sustainability 2023, 15, 3309. https://doi.org/10.3390/su15043309
Jacinto R, Sebastião F, Reis E, Ferrão J. SoResilere—A Social Resilience Index Applied to Portuguese Flood Disaster-Affected Municipalities. Sustainability. 2023; 15(4):3309. https://doi.org/10.3390/su15043309
Chicago/Turabian StyleJacinto, Rita, Fernando Sebastião, Eusébio Reis, and João Ferrão. 2023. "SoResilere—A Social Resilience Index Applied to Portuguese Flood Disaster-Affected Municipalities" Sustainability 15, no. 4: 3309. https://doi.org/10.3390/su15043309
APA StyleJacinto, R., Sebastião, F., Reis, E., & Ferrão, J. (2023). SoResilere—A Social Resilience Index Applied to Portuguese Flood Disaster-Affected Municipalities. Sustainability, 15(4), 3309. https://doi.org/10.3390/su15043309


