Abstract
Based on Kevin Lynch’s cognitive method of urban image and Weibo’s review data, this study constructs a research framework with three modules as the core: city image structure, city image types, and cultural service evaluation. First, the geospatial information carried by comments is analyzed by GIS to obtain the image structure of the city; second, the picture data in the comments are divided into image types and the type ratio is calculated by the image semantic segmentation method based on deep full convolution neural network. Finally, the text data in the comments are extracted from the semantic word frequency analysis to evaluate the cultural service perception index words of the city image and combined with the analysis of the city image structure and the city image type so as to obtain the integrated comprehensive perception of the city image. The research shows that the introduction of big data and deep learning methods into city image research can make up for the shortcomings of traditional research samples, expand the dimension and breadth of urban cognition, reveal the social, cultural, and functional characteristics of the city, and is an important supplement to the five-element model of city image depicting the material form of the city. In addition, the results of the empirical study, taking Zhongshan City as an example, have implications for the realistic urban spatial planning, urban landscape design, and tourism industry layout of Zhongshan.
1. Introduction
“Image” is an “abstract” feeling and perception, a psychological image of a certain region or place in people’s minds, and a comprehensive embodiment of people’s impressions, opinions, cognition, evaluation, and feelings [1]. City image is the perception of a city by an individual or a group and can be expressed through pictorial and textual means [2]. Kevin Lynch’s book The Image of the City published in 1960 is regarded as a classic theory of city image, in which the theory of five elements of a cognitive map [3] triggered a research upsurge about city image. Since then, many scholars have perfected and deepened it on the basis of Kevin Lynch’s research [4,5]. For example, Shen [6] reflected on Kevin Lynch’s five elements of urban imagery, arguing that city image should not only include the spatial elements of the city, but also content related to urban culture, expanding the connotation of urban imagery. Xu Leiqing [7] summed up the three directions of China city image research: urban structure research, local characteristics research, and evaluation research, and put forward two research paradigms, descriptive and diagnostic, to discuss and reflect on the research objectives and methods of city image. In recent years, although some scholars have attempted to propose a conceptual system of urban spatial image [8] and initially explored the spatial characteristics of image [9,10], the elements of image [11,12], the spatial patterns of image [13,14], and the sense of place of image [15,16], these studies have also contributed to the shaping of urban characteristics and spatial quality [17,18], urban planning and management [19,20,21,22], urban landscape design [23,24,25], and urban tourism development [26,27], but the current research is still mostly limited to descriptive analysis of urban spatial image [28], and is less concerned with deeper issues such as evaluative research and the interaction between different modes of image perception.
Previous studies have mostly used sociological survey methods such as questionnaires [29,30], interviews [31,32], and intention sketches [33,34] to identify the elements [35], spatial distribution [36], and qualitative characteristics [37,38] of city image. As cities have developed, their complexity has led to limitations in the classical theory of city image [39]. Firstly, the research sample size is limited, and neither the sample size of early Kevin Lynch nor that of subsequent scholars can represent millions to tens of millions of urban people, and the limited sample size will lead to subjective results or even a large deviation. Secondly, it is the limitation of the five elements of city image, which simply understands the characteristics of the objective environment from the spatial structure and ignores the cognition of the non-material aspects of city image [7].
In recent years, with the popularity of smart mobile terminals and social media, people can express their true feelings on social networks anytime and anywhere. Social network data from online social networks include impressions of citizens and tourists enjoying leisure and recreational activities in the city, and comments may include feelings, experiences, and photos [40]. The advantages of social network data are that they carry geospatial information, have a large user base, and are accessible through a variety of channels. The authors of [41] open up new ways of accessing information for city image perception studies [42], expanding the sample size, and improving scientific accuracy and precision. In the city, each person can be regarded as a “sensor” that can feel the political, economic, social, cultural, environmental, and other factors of the city, and they publish their feelings in the form of text, pictures, emoticons, labels, and so on through social media. The analysis of this data allows for the extraction of a general perception of city image. Thus, social media data provides an unprecedented new way of “social perception” for city image research, which used to be mainly based on surveys [43].
With the increasing access to big data, the types of data become more diverse, which provides a better research method for the study of urban image structure, classification, and evaluation of urban image perception [44,45]. Diverse social media data, coupled with new developments in deep learning, provide city managers around the world with the opportunity to gather cheap, detailed, and comprehensive information perceptions [46,47,48]. For example, Hospers [49] associates urban image with urban tourism, emphasizing the necessity of urban image for urban character construction, urban charm enhancement, and urban economic development. Cao Yuehao [50] comprehensively recognized city image in a quantitative way on the basis of network data and demonstrated this method by taking 24 major cities in China as research objects. Liu and Wu [51] used social media data mining and social network analysis to explore the differences in the dimensions and themes of different people’s perceptions of the city.
At present, big data has been widely used in urban research and planning. The main application fields are urban spatial structure [52], industrial layout [53], public service facilities [54], urban transportation [55], green space planning [56], and residents’ activities [57]. With the continuous optimization and development of deep learning algorithms, computer vision and natural language processing based on neural networks [58] have come to the fore in many research projects. The concept of deep learning was first put forward by Hinton et al. [59] in 2006. It is a machine learning technique used to learn and exploit “deep” artificial neural networks. The main algorithm models include convolutional neural networks, CNN) and recurrent neural networks (RNN) [60]. As the hottest direction in the field of artificial intelligence, deep learning methods have been widely concerned by related fields, but urban research using deep learning is in the trial stage. For example, Koolwal et al. [61] proposed a new deep learning method to extract the features of large trajectories and used the content and semantic mining model to predict the location of using social media platforms. Li [62] used the deep convolutional neural network model to identify different urban features and comprehensively evaluate the street spatial quality of Guiyang. Ye [63] used streetscape pictures and deep learning methods to measure the quality of street greening, realized the integrated analysis of the visibility of greening from the perspective of human eyes and street accessibility, and explored the accurate analysis framework under the new data environment by taking urban greenway planning of Suzhou Creek as a case, thus providing strong support for the people-oriented urban design practice. Based on social media data, Zhu [64] proposed a green space satisfaction evaluation framework based on deep learning and keyword matching technology and proved through case studies that self-generated online comment data has the potential to be a powerful supplement to traditional survey data in GSS (Green Space Satisfaction) evaluation. Lingua [65] used convolutional neural networks (CNN) to classify more than 91,000 images obtained from the provincial park system in British Columbia (Canada) and combined the results with image metadata to evaluate the value of recreational ecosystem services provided by the most popular parks using an innovative crowdsourcing benefit transfer method. Based on social media data, Fang [66] studied the emotional characteristics of visitors in urban parks by using text affective value calculation, word frequency technology, and other methods, and put forward suggestions in terms of creating positive emotional space, expanding functional space, and strengthening the compatibility between plant landscape and public space. Shao [67] introduced social media data into tourism research and proposed a new data-driven method for extracting urban tourism areas by mining tourists’ space-time behaviors, which can be used for long-term monitoring of the development and transformation process of urban tourism areas. Zhang [68] used geo-tagged social media data to explore urban park leisure travel in Beijing and its influencing factors. To sum up, the deep learning algorithm based on the artificial neural network is good at dealing with complex data conditions and multi-dimensional problems and can provide strong technical support for city image perception evaluation of different themes [69,70].
From the relationship between city image, big data, and deep learning, the combination of big data and city image can make up for the shortage of traditional research samples. The combination of big data and deep learning is inevitable to optimize deep learning methods. The combination of deep learning and urban image can expand the dimension and breadth of urban cognition. The three support each other and can perceive the city image in multiple dimensions and in all aspects. In view of the fact that the existing research on city image perception mostly focuses on the analysis and evaluation of urban image elements [71,72], the emotional perception of hot space [73,74], the sense of place of image [15], few have explored urban imagery from the perspective of the perception of cultural services by city residents and tourists. Therefore, based on the data from Weibo, this topic proposes to study the perception of city image from the perspectives of city image structure, city image types, and cultural service evaluation. This study provides detailed basic data for urban management and development decision-making in Zhongshan and provides the scientific basis for urban spatial planning, urban landscape design, and tourism industry layout in Zhongshan.
2. Materials and Methods
2.1. Study Area
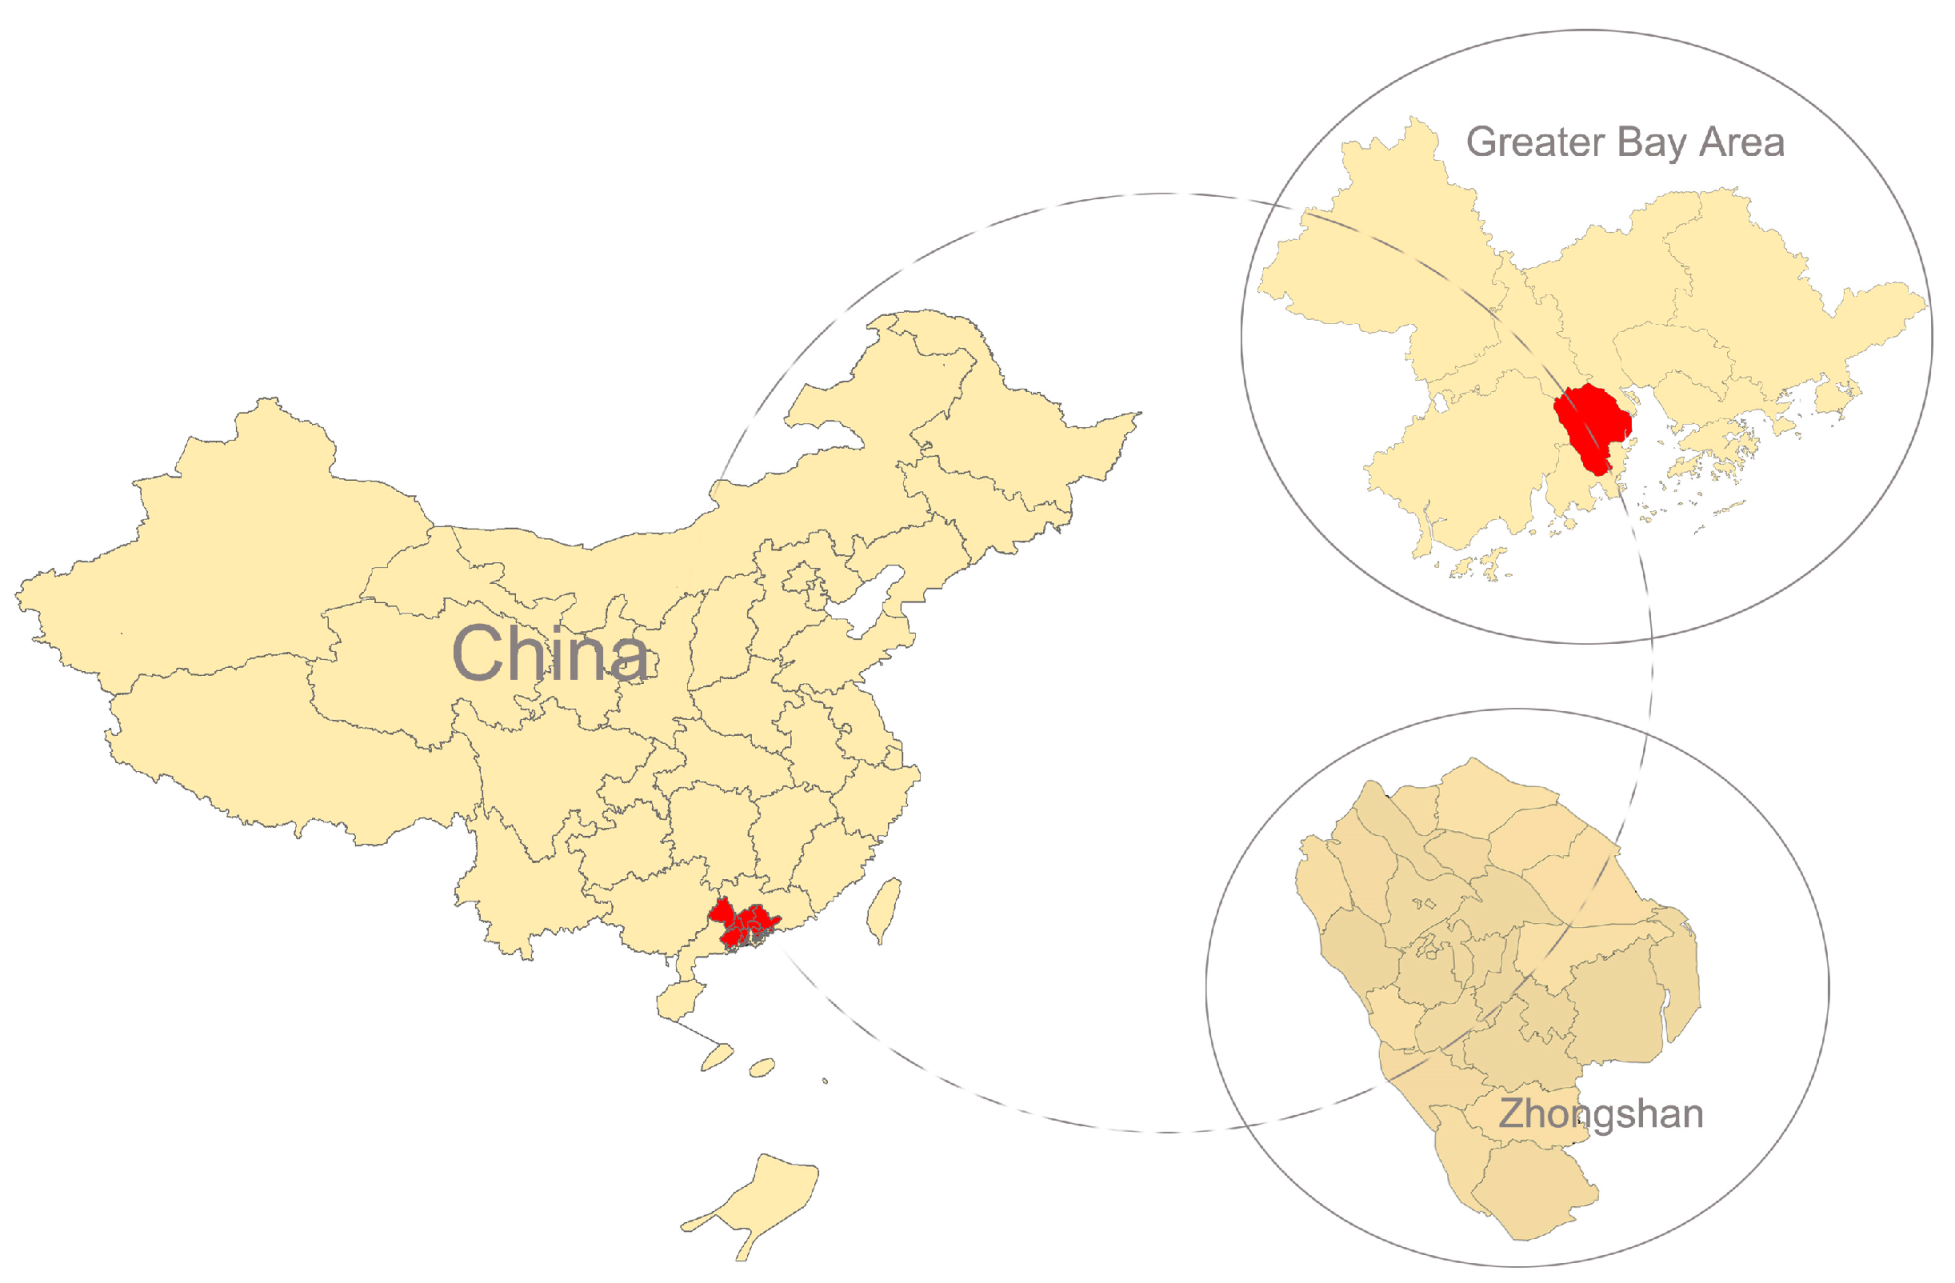
This study takes Zhongshan City as the object to study the perception of urban landscape cultural services. Zhongshan is located in the lower reaches of the Pearl River Delta, connected to Guangzhou in the north, adjacent to Hong Kong and Macao, facing Shenzhen across the sea, and located in the geometric center of Guangdong–Hong Kong–Macao Greater Bay Area, with a land area of 1784 square kilometers (Figure 1). In recent years, Zhongshan has been awarded the titles of National Sanitary City, National Garden City, National Advanced City of Science and Technology Development, National Environmental Protection Model City, China Excellent Tourism City, National Model City of Unimpeded Traffic Project, and National Historical and Cultural City. It was also awarded the “Habitat Scroll of Honour Award” by the United Nations Human Settlements Program (UN-Habitat) in 1997 [75].
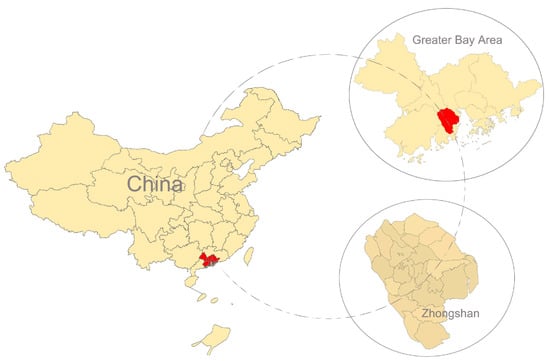
Figure 1.
Study site.
2.2. Research Framework
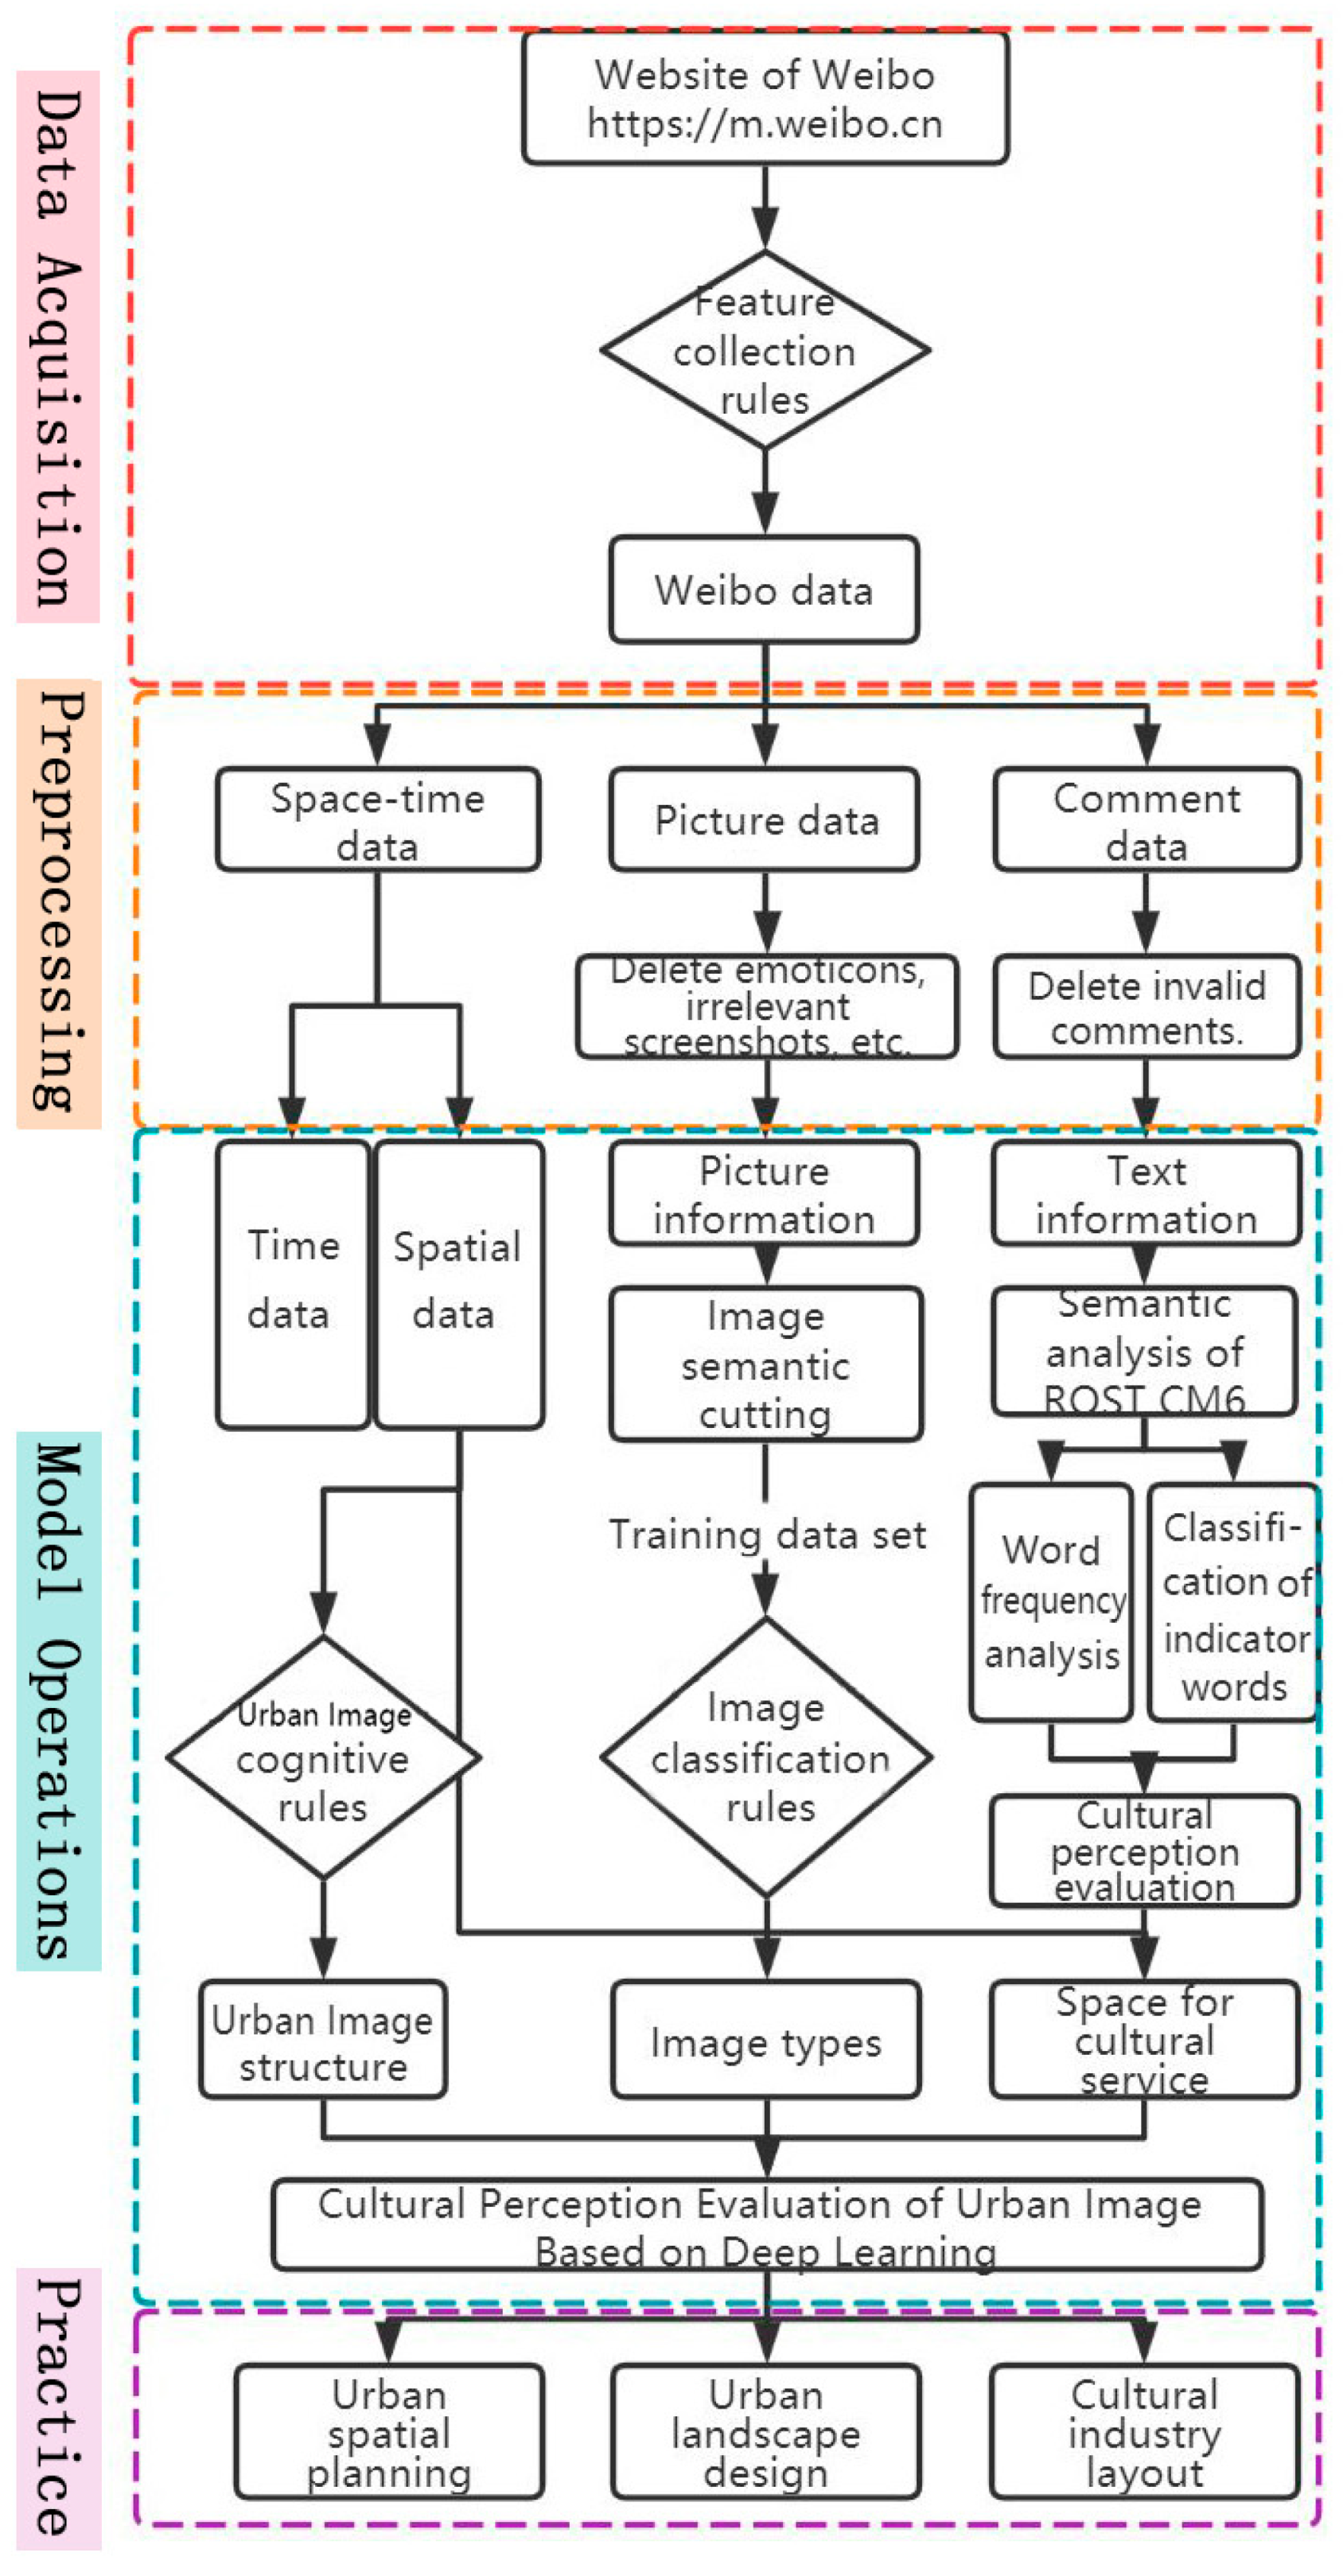
Based on Kevin Lynch’s urban image cognitive method, this study combines big data and deep learning methods to expand the traditional single dimension of spatial structure into three dimensions containing image structure, image type, and image evaluation. The research framework includes four links: data acquisition, data preprocessing, model operation, and practical application. In data acquisition, this paper obtains Weibo data through a data collector. In the data pre-processing stage, operations such as the removal of redundant and useless parts of the image data and language data are required to ensure that the model can operate correctly. In the model operation, the geospatial information carried by the comments is analyzed by GIS space to obtain the image structure of the city, the image data in the comments are divided into image types by image semantic segmentation method based on deep full convolution neural network, and the text data in the comments are evaluated by semantic word frequency analysis to obtain the cultural service of the city image. In the planning application, the perception of city image based on deep learning enhances the practicality of traditional city image and expands the application scope of city image. The analysis results of this model can be applied to the planning and research of urban design, urban style, urban characteristics, and other fields (Figure 2).
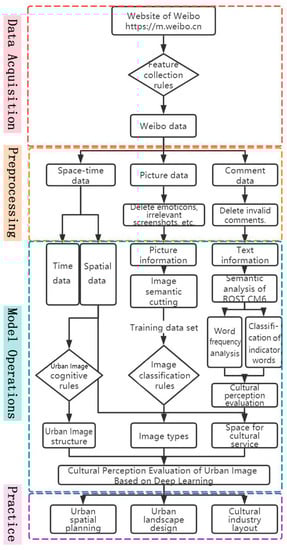
Figure 2.
Research framework.
2.3. Data Source
The data used in this study are Weibo comment data, including online text data and image data. Weibo data is event evaluation information with time and geographical location shared voluntarily by users [76]. Although a single evaluation is only a personalized perception, imitation, and reproduction of a moment, a large amount of evaluation information provides a long enough span of time and space for the research, and to some extent, it has the ability to reflect personal experience and emotion under specific geographical location and macro perspective [77].
In this study, Houyi Collector was used to obtain more than 13,000 pieces of Weibo from January 2021 to October 2022 within the research scope. After cleaning and de-duplicating the contents, 7745 pieces of Weibo data were obtained, among which 17,654 images were included, taken as the research data of this paper.
2.4. Data Preprocessing
Three software platforms, Houyi Collector, ROST CM6 semantic analysis software, and visual image semantic segmentation software were used for data preprocessing in this study. Houyi Collector is a network data collector built by the former Google team, which can use graphical programming. With excellent collection stability and efficiency, it has automatic deduplication and data screening functions, which are suitable for the data collection work of this study. ROST CM6 is the only large free social computing platform developed and coded by Professor Shenyang of Wuhan University to assist humanities and social science research in China. It can realize a series of text analyses, such as microblog analysis, chat analysis, word frequency statistics, English word frequency statistics, traffic analysis, cluster analysis, and visual display. The visual image semantic segmentation software selected in this project is a deep learning full convolutional network based on ADE_20K data set training written in C++ language [78]. It is created by Professor Guan Qingfeng’s team from the School of Information Engineering, China University of Geosciences (Wuhan). It has the characteristics of rich scene categories, which is different from cityScapes and VOC12_AUG software and is more suitable for this study.
In this study, the de-duplication function of Houyi Collector was used to remove duplicate text, too little content, and deleted Weibo comments. In order to meet the requirements of ROST CM6 semantic analysis software for data information, it is also necessary to delete expressions, special fonts, and special symbols in the comment text. Specific operations are as follows: import the comment information into Notepad (txt format) using Houyi Collector. When saving, select ANSI encoding format, which will automatically delete expressions and use “?” instead, use Notepad’s built-in find and replace function to remove the question mark at last.
There are fewer rules for dealing with images than for commenting on text. A total of 14,029 images were obtained after deleting emojis, screenshots, and other pictures that were not related to the research content. Since the GPU memory carrying capacity of the local computer is limited, in order to prevent memory overflow, this study used Photoshop software to adjust the size of the picture so that its length and width were within 1000 pixels. Based on this, a total of 5326 comments data and 14,029 pictures data were obtained after processing, which served as the research basis of this topic.
2.5. Urban Image Research Model
Urban image includes the formal characteristics of the city in the public eye. The most widely used method of urban image is the cognitive method of urban space image, which takes sign, node, path, boundary, and region as the elements, proposed by Kevin Lynch in his book The Image of the City in the 1960s. In recent years, much research on urban image has also emerged with the goal of exploring local characteristics. The purpose of such research is to reveal the unique image elements of cities, which are not limited to materiality or entity elements [60]. Urban image research attaches importance to the perception of individual or group residents in an urban environment. Therefore, network data based on online social communication, such as Weibo data, can be applied to the perception of city image because it can reflect the perception state and emotional attitude of reviewers on specific urban space [79].
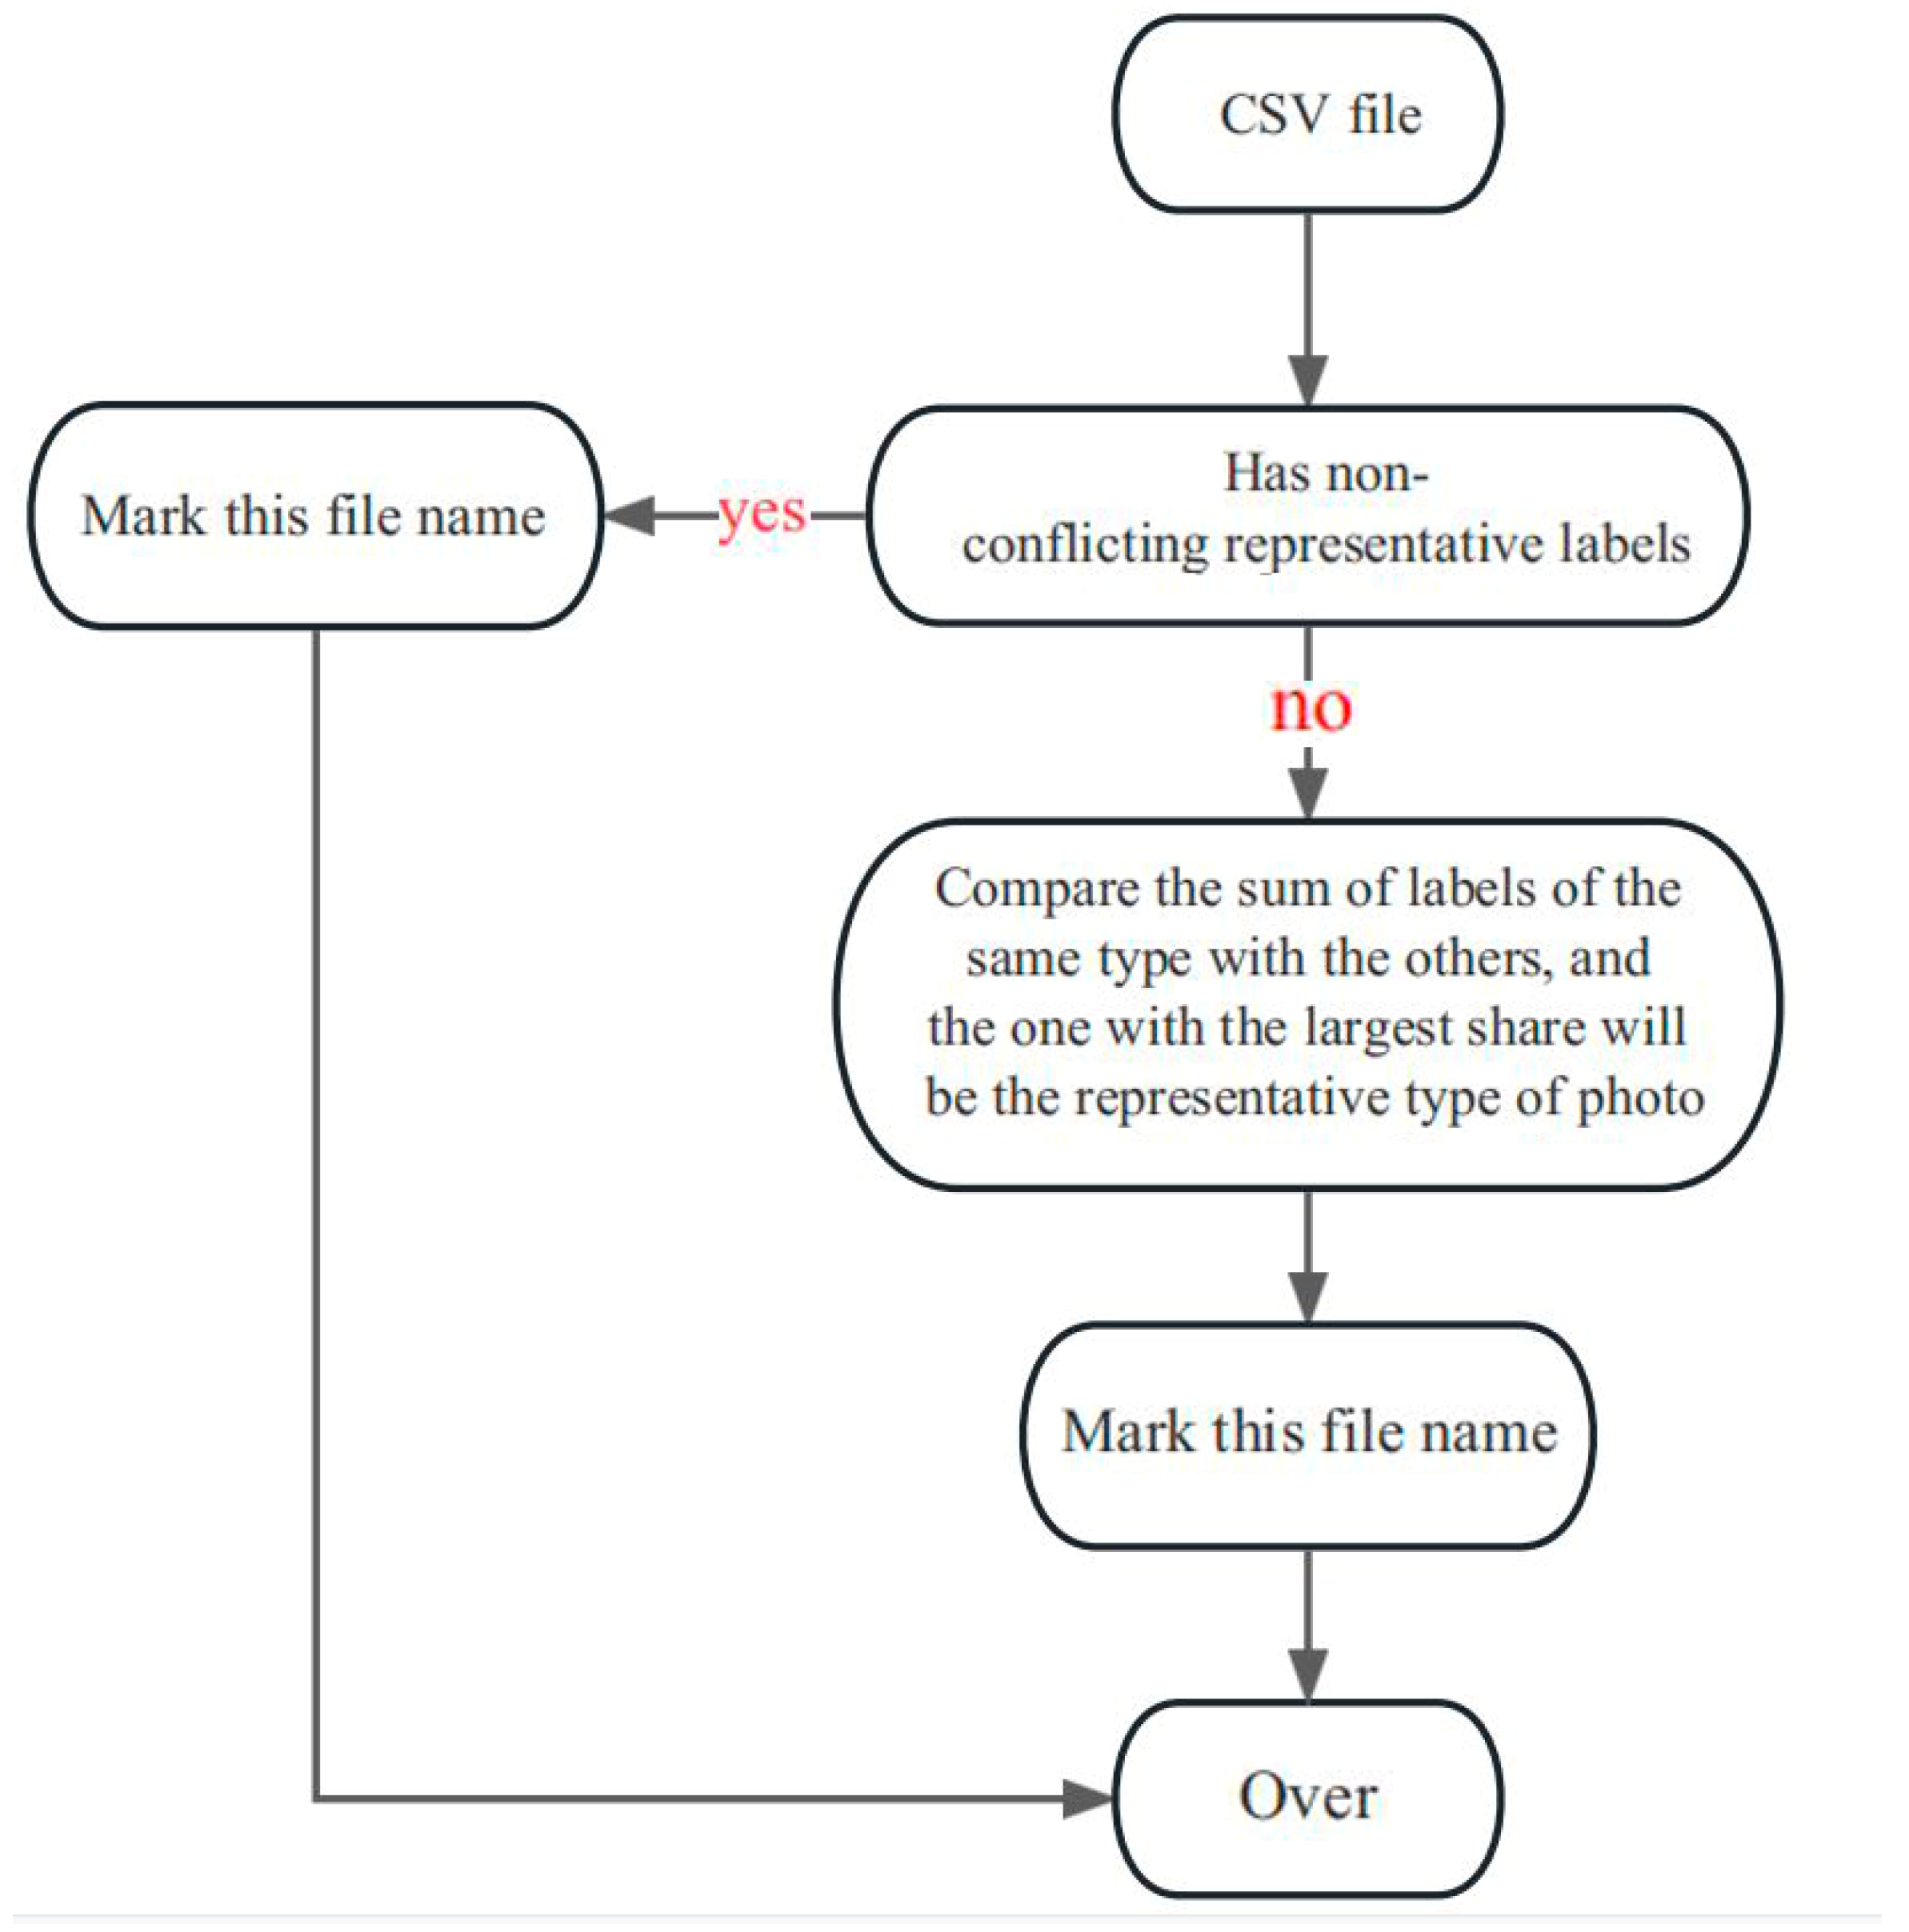
The city image types are divided into four types: landmark buildings, natural landscapes, public spaces, and cultural life. Besides streets, urban parks are usually included in the category of public space. In order to maximize the function of visual image semantic segmentation software, urban parks are divided into natural landscapes in this topic. The semantic segmentation software of visual images is used to analyze the collected Weibo image data. This software can semantically segment 150 labels (the specific labels are set in advance by the software) and obtain the proportion of the 150 labels in each image, and compare the tag proportion with the image type to obtain the image type expressed in the photograph. In this study, the rules for determining the type of photographic imagery were set through iterative trials (Figure 3): if there was a “representative label” (see Table 1 for details), the photograph was immediately categorized as long as it appeared and accounted for more than 1%, with the representative label accounting for roughly one-third of the 150 labels and hardly appearing in any other type of photograph. It is only after the presence of representative labels representing different types at the same time (e.g., overlapping representative labels in public spaces) that the computer counts the proportional size of the four types to determine which type it ultimately belongs to.
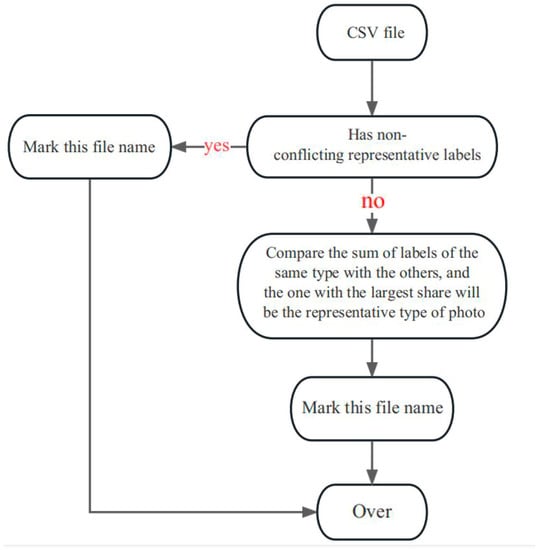
Figure 3.
Image type determination rule.

Table 1.
Urban image types and image labeling.
2.6. Image Semantic Segmentation Based on Deep Learning
Image semantic segmentation (ISS) is an interdisciplinary discipline involving the research fields of computer vision, pattern recognition, and artificial intelligence. It is more practical to derive information about the image itself based on its texture, scene, and other high-level semantic features. The ISSbDL method (image semantic segmentation based on deep learning) is divided into ISS based on regional classification (ISSbRC) and ISS based on pixel classification (ISSbPC). This study adopts the pixel classification-based image semantic segmentation method, which belongs to the fully supervised learning (ISS based on the pixel classification, ISSbFSL), which is specifically a deep fully convolutional neural network-based image semantic segmentation method.
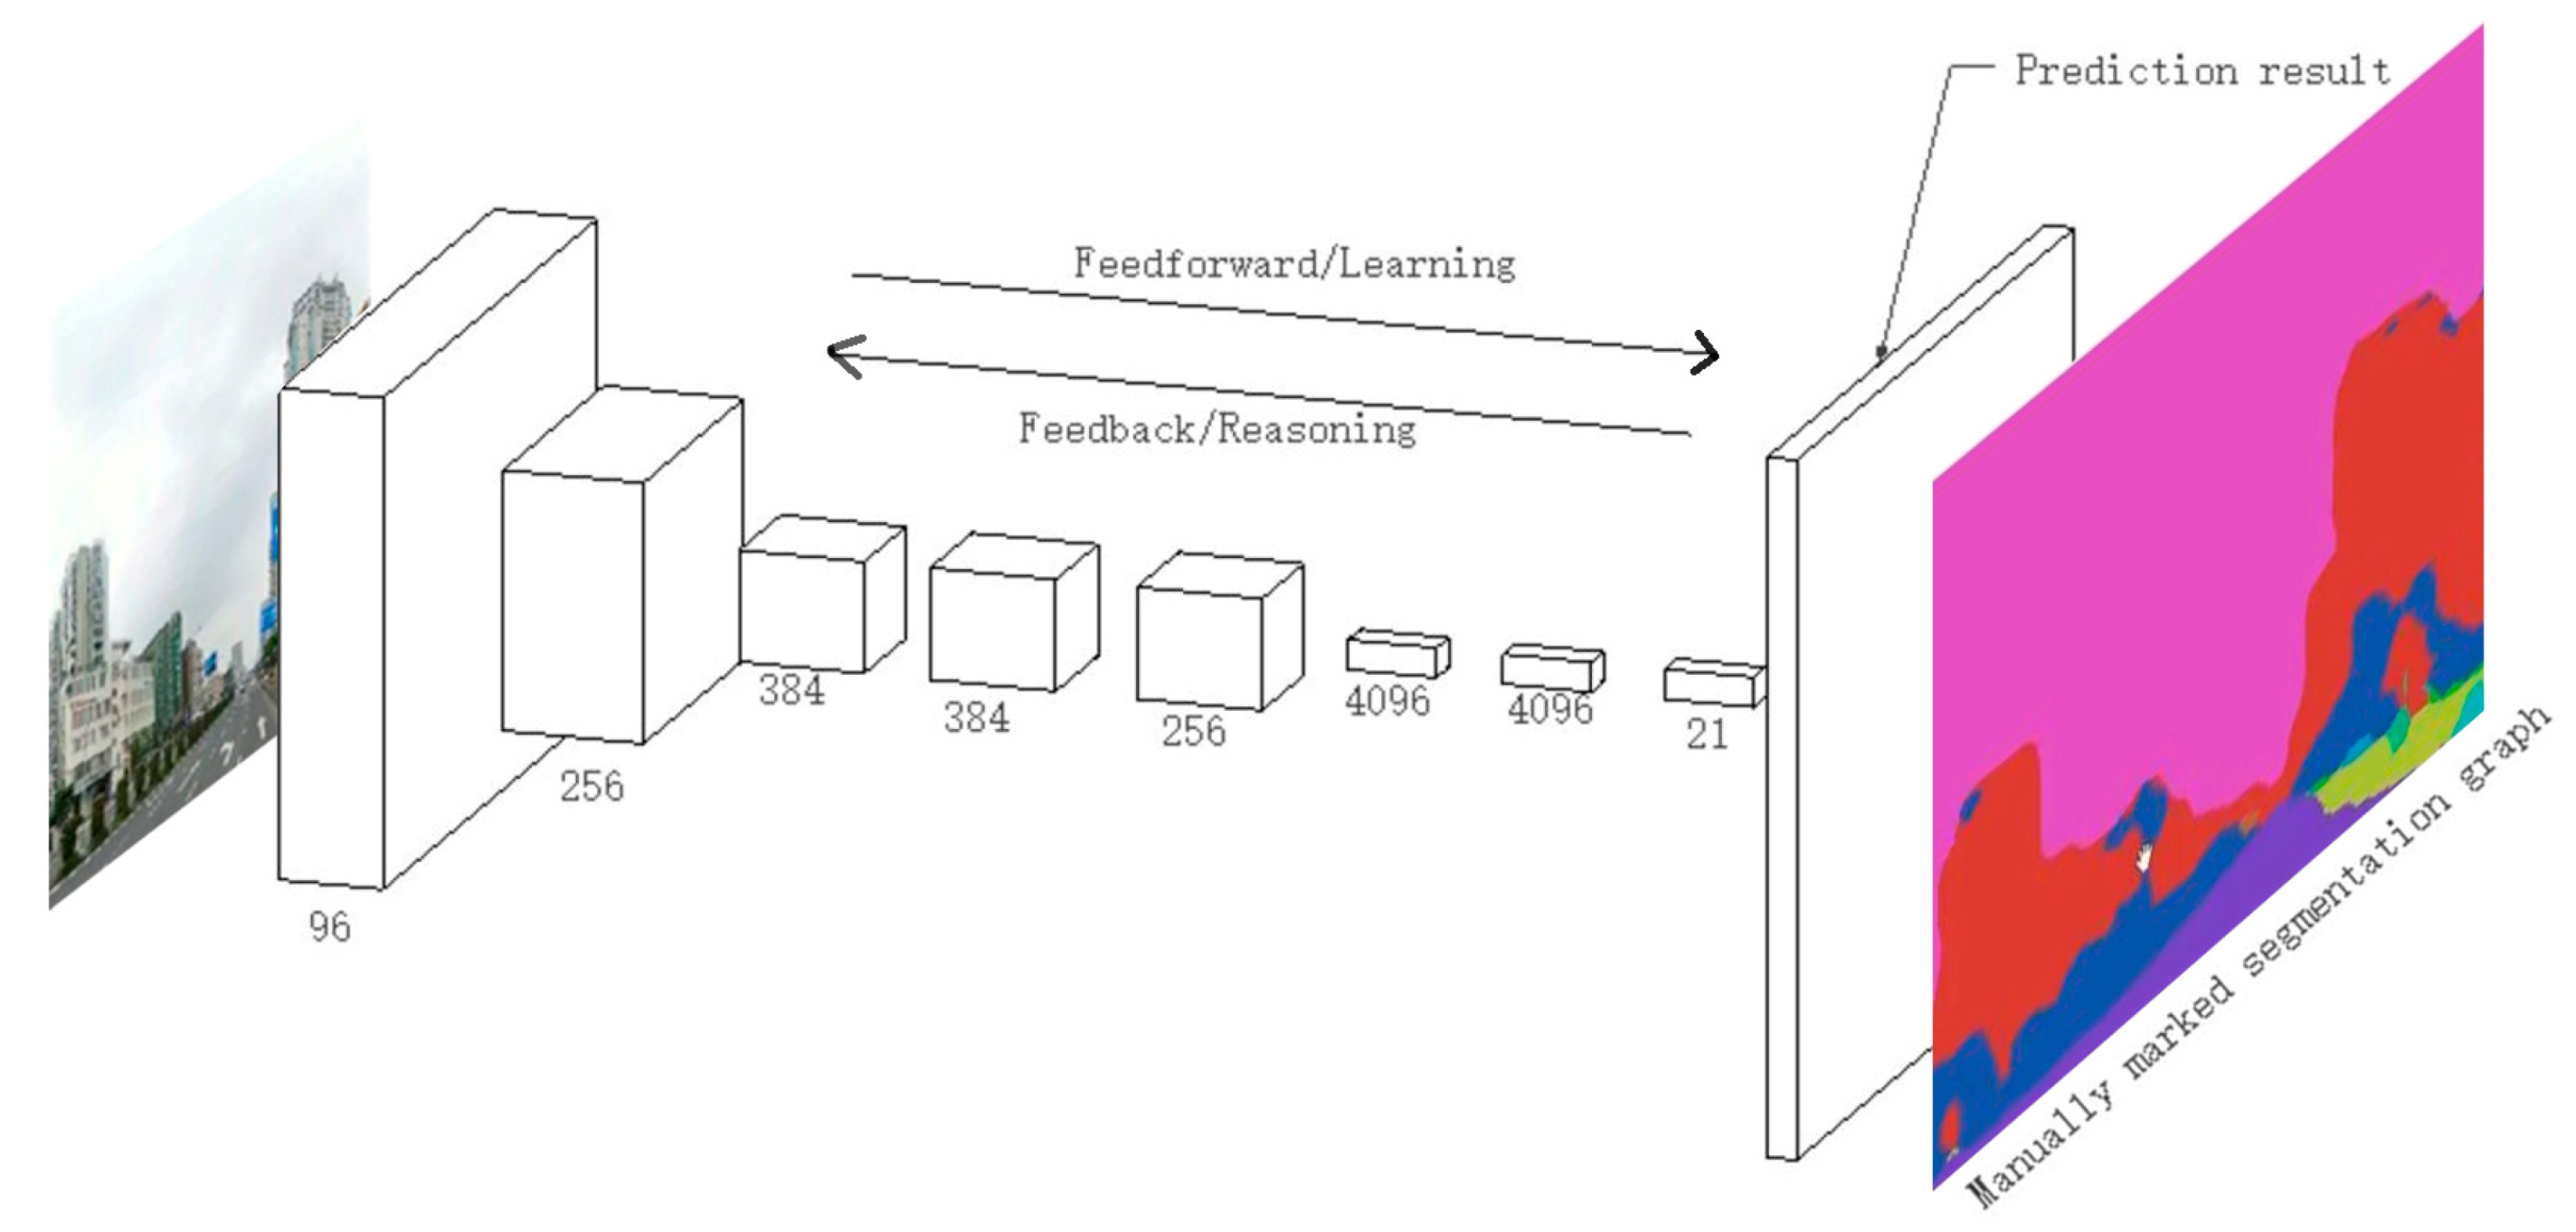
The fully convolutional network (FCN) was proposed by Jonathan Long et al. [80] of UC Berkeley in 2015 in their paper “Fully convolutional networks for semantic segmentation”, mainly for image segmentation, which can solve the problem that Convolutional Neural Networks (CNN) is difficult to achieve fine (pixel-level) segmentation in image feature extraction. The core difference between FCN and CNN is that FCN transforms the fully connected layer at the end of CNN into a convolution layer, combines the feature maps generated by the middle convolution layer by using the skip layer method (as shown in Figure 4), and then carries out upsampling by bilinear interpolation (BI) algorithm so that the network originally used for image classification can be transformed into a network used for image segmentation [81]. Deep full convolutional neural networks are used to simulate the complex hierarchical cognitive laws of the human brain by increasing the number of layers of the network, using larger training datasets, and improving the network structure of existing neural networks or training learning algorithms to close the gap with the human visual system and enable the machine to acquire the ability to “abstract concepts”. The visual image semantic segmentation software used in this study can distinguish different scenes in a photograph and calculate their proportions. The results can be used to determine the type of urban imagery a photograph belongs to, reducing the researcher’s workload given the large number of photographs.
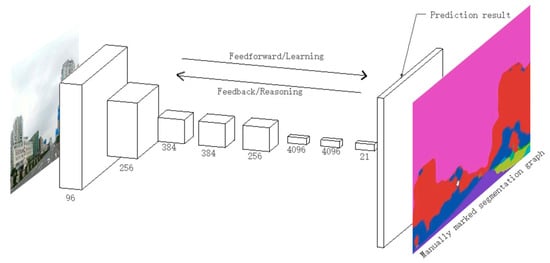
Figure 4.
FCN frame structure [80].
2.7. Evaluation of Cultural Services Perception
The cultural service of this study refers to intangible benefits that people enjoy from the complex ecosystem of the city. Based on the actual situation of the study area, starting from the perspective of cultural services, referring to the evaluation indicators of cultural ecosystem services [82,83], seven aspects of aesthetic value, historical and cultural value, learning value, recreational value, health value, economic value, and life support value are selected as evaluation indicators (see Table 2 for the description of indicator types). On the basis of formulating the evaluation index of cultural service, ROST CM6 semantic analysis software is used to carry out a word frequency analysis of the evaluation text, and the high-frequency words correspond to the value index one by one, which is taken as the basis for the evaluation of cultural services perception. According to the proportion of high-frequency words, the value level of cultural service is determined (Table 3). The value of cultural service is divided into five grades: low, relatively low, average, relatively high, and high, and the value range is from 1–5. Based on the ArcGIS platform, the empirical Bayesian Kriging method is adopted to carry out spatial interpolation processing on the perceived value of cultural services and generate a value map of cultural services, which is used to analyze the value level and spatial distribution characteristics of the perceived value of cultural services.
Table 2.
Cultural service classification system.
Table 3.
Classification of cultural service perception index words and evaluation grading standard.
3. Results
3.1. Urban Image Structure Cognition
Through Weibo data (pictures and texts), the interest points of citizens and tourists in Zhongshan’s city image are obtained and the distribution of city nodes is obtained. Through the kernel density analysis on the GIS platform, the distribution and scope of the region are obtained. The most overlapping place of nodes is the sign, and the boundary and path are based on the basic drawings of the city geographic information, combined with node, region, and sign to determine. This structure is obtained through the perception of citizens and tourists and it is the image structure of the city among different people. It mainly focuses on the “readability” of urban space in the hearts of citizens and tourists; that is, it is easy to perceive the various parts of the city and form a cohesive form of identity.
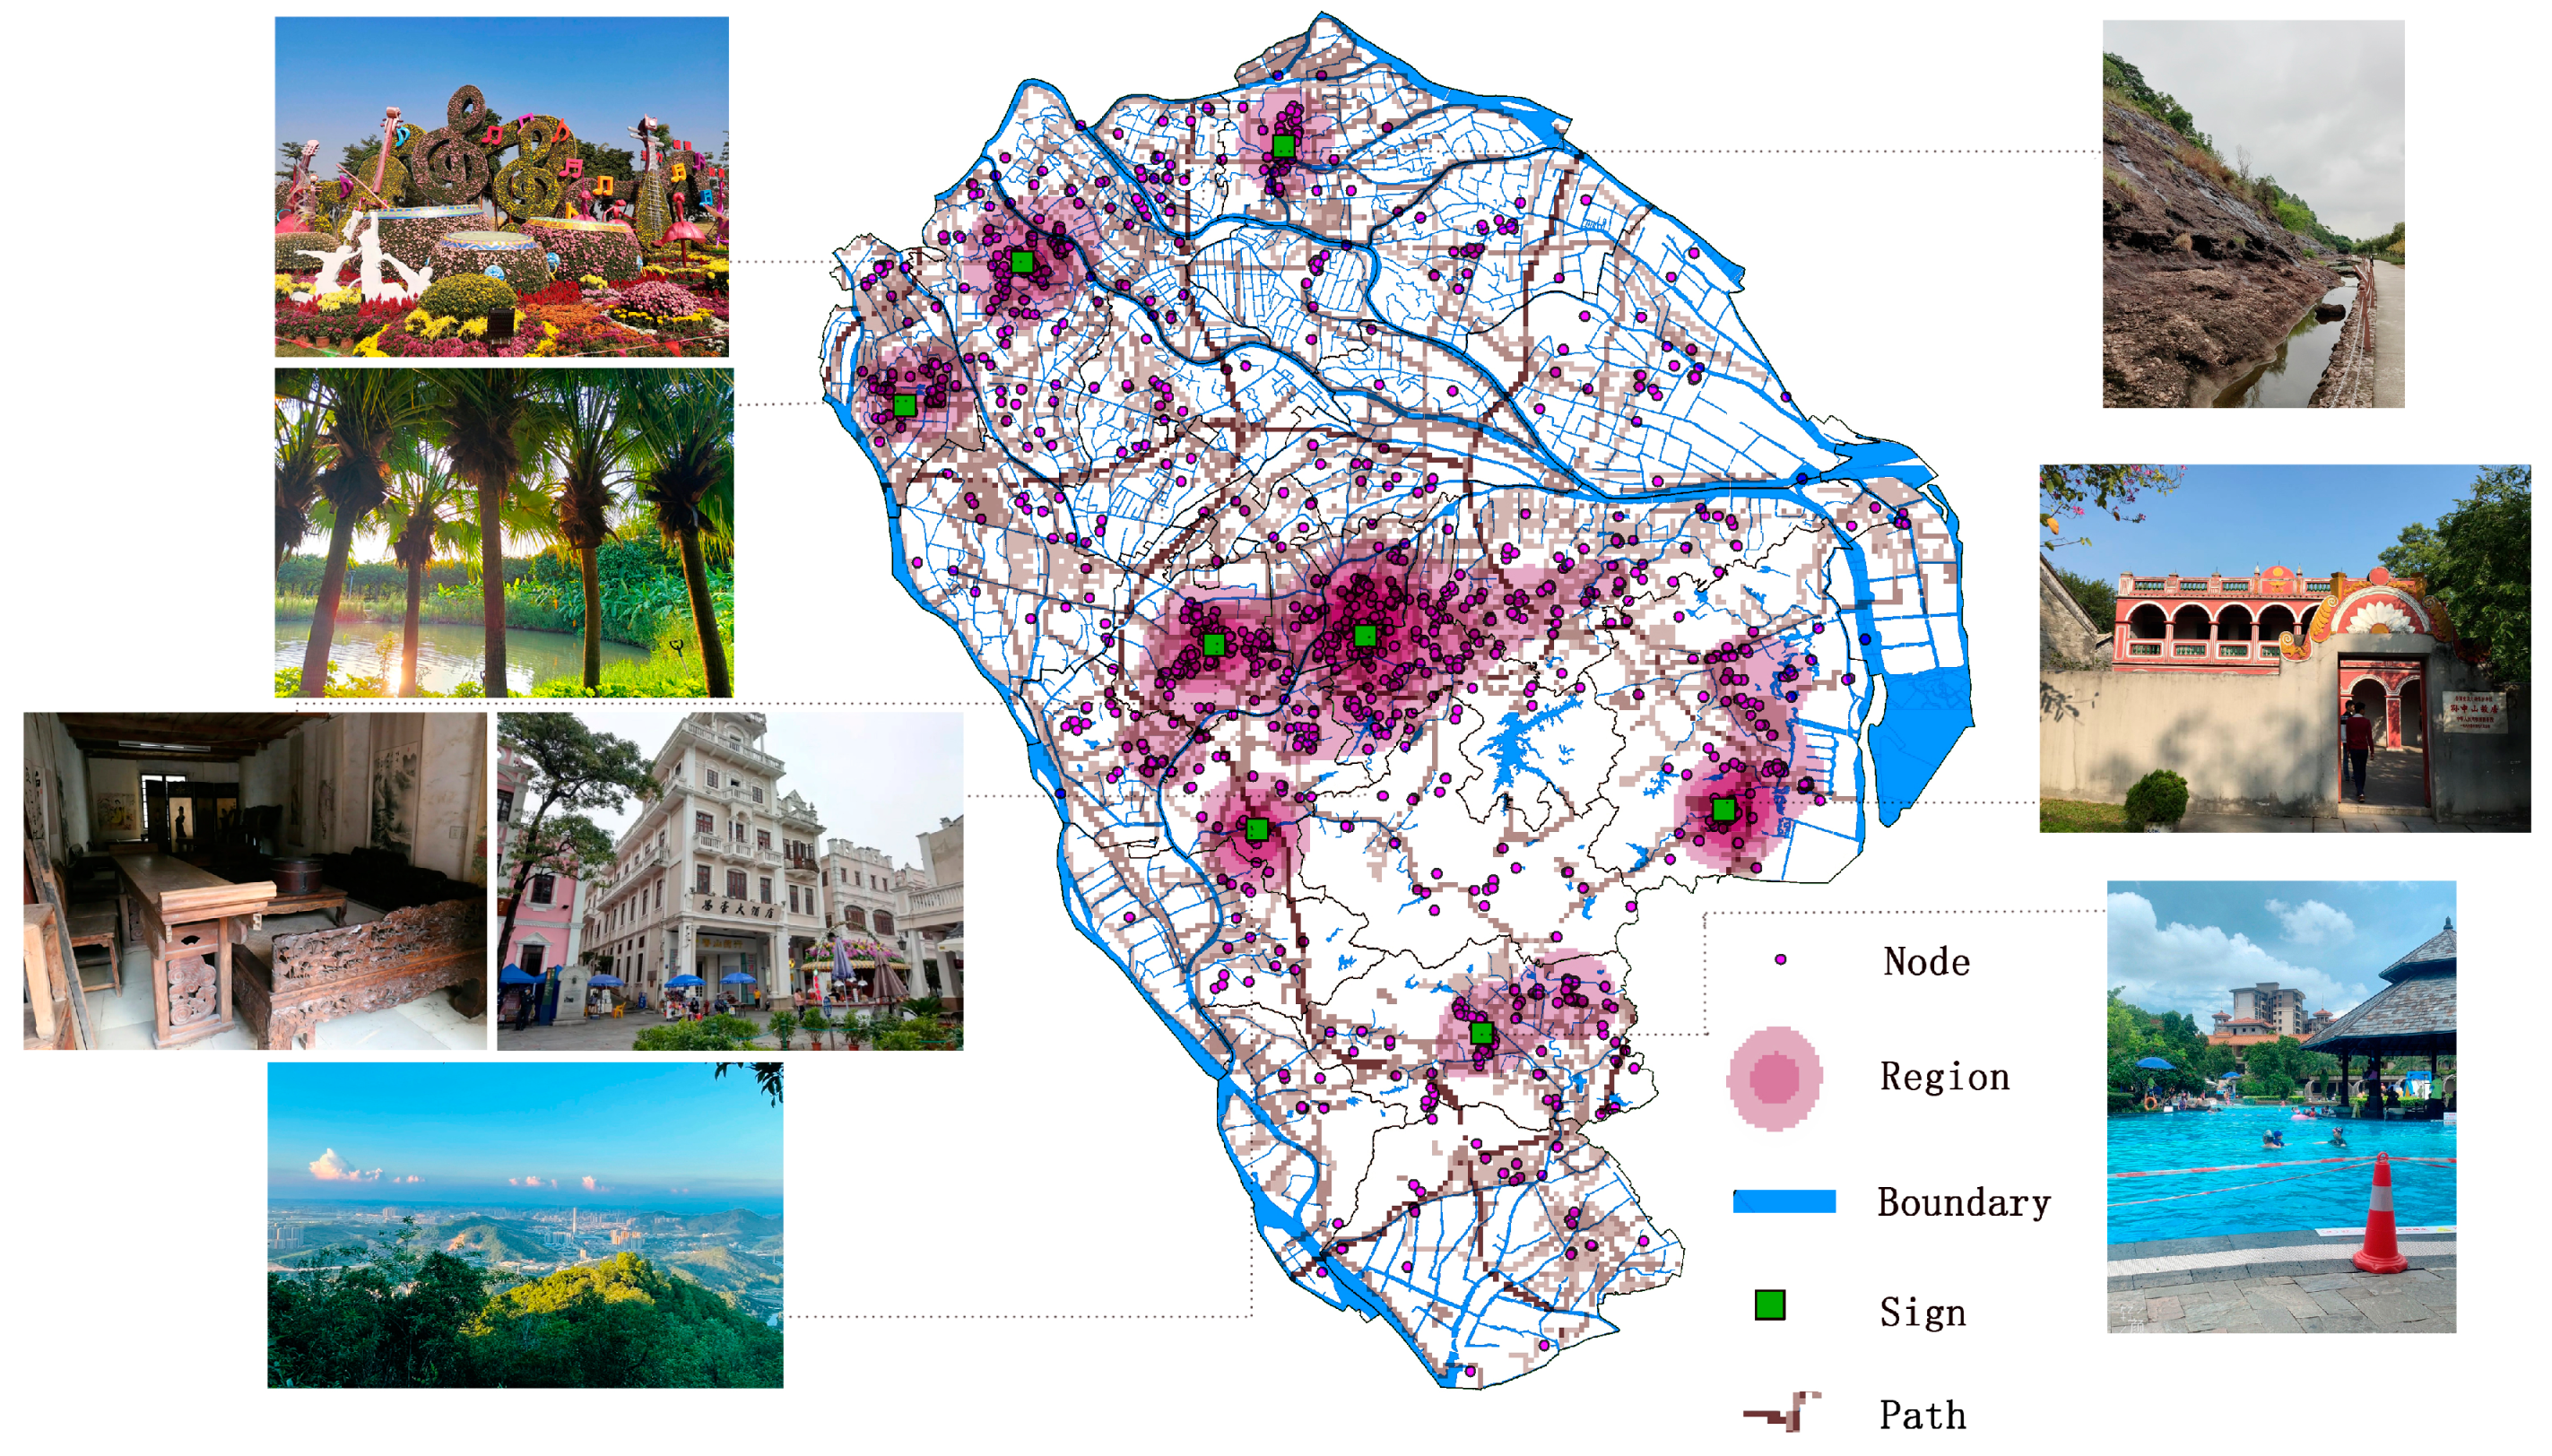
On the whole, the image structure of Zhongshan City is characterized by “node aggregation and scatter distribution”, and the separation between clusters is obvious. From the distribution of clusters, Zhongshan City has a relatively clear image structure, including seven regions, three boundaries, seven paths, eight signs, and numerous nodes of image elements (Figure 5).
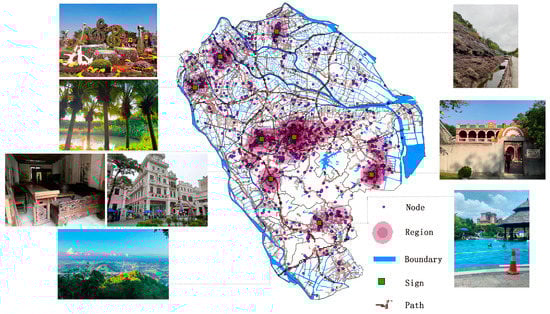
Figure 5.
Structure diagram of urban image.
Region: The region with a high degree of aggregation and continuous distribution of image points. There are seven image regions in Zhongshan City. The distribution of these areas is not uniform, among which the central city and Shaxi Town contiguous image area is the largest, mainly concentrated in the commercial center. Image elements are also the highest degree of aggregation.
Boundary: From the boundary dividing the image area, there are three obvious boundaries, which are the Xijiang River, the southern hills of the city (Wugui Mountain, Dpai Mountain, Erjian Mountain, etc.), and the South Outer Ring Road—Yongan Third Road. The image points of the whole main urban area show that roads have little effect on the segmentation of image points, whereas rivers and mountains have an obvious segmentation effect, and the South Outer Ring Road and Yong ‘an Third Road form obvious segmentation due to their proximity to hills.
Path: From the perspective of the whole research scope, seven main image paths are formed, which constitute the communication channel between each image region. From the functional point of view, the image path is a traffic road.
Sign: It refers to the spot area with the highest concentration of image elements and plays a characteristic guiding role in the perception of image space, forming seven image symbols: former residence of Sun Yat-sen, West Sunwen Road Pedestrian Street, Shaxi mahogany furniture market, forest park, ecological wetland, Xiaolan Ju Exhibition, sea erosion site, and Zhongshan Hot Spring.
Node: It refers to the location points on the map of geospatial information carried by social network data. These nodes can reflect the objects and spatial distribution of commentators’ interest in Zhongshan urban landscape or entertainment, shopping, and leisure activities.
3.2. Urban Landscape Type Analysis
In this study, urban image is divided into four types: landmark buildings, natural landscapes, public spaces, and cultural life. The purpose of dividing the collected Weibo images into city image types is to understand which types of spaces, landscapes, or cultures are more interesting to citizens and tourists in Zhongshan, whether Zhongshan is more famous for its history and humanities, or the scenery of Wugui Mountain is more popular, whether Zhongshan’s food and folklore are more attractive, or whether the city’s landmark is the most memorable. The analysis of the city’s imagery can provide a basis for city managers and cultural and tourism authorities to formulate policies.
From the overall composition of the collected images of the main urban area of Zhongshan City, 8153 of the 14,029 photos are cultural life landscape, accounting for 58.11%, public space landscape accounts for 21.69%, landmark buildings account for 13.77%, and natural landscape only accounts for 6.43%. It can be found that the proportion of the four images is not balanced. The dominant image of Zhongshan City is cultural life, followed by public spaces, landmark buildings, and natural landscapes.
Zhongshan has the highest concentration of cultural life. The main areas are the University of Electronic Science and Technology of China, Zhongshan Institute, Sunwen West Road Pedestrian Street, and Lihe Square. These areas also contain landmark buildings and public space images. The main reason is that the University of Electronic Science and Technology of China, Zhongshan Institute is the only undergraduate university in Zhongshan City, with 22,000 students. Sunwen West Road Pedestrian Street is an important expression of the “Nanyang” culture mixed with Europe and Asia. Since the Republic of China period, Sunwen West Road began to accept Western architectural forms and integrated western classical architectural forms. To this day, there are still architectural objects combining Chinese and Western elements, such as exquisite wood carvings and grey sculptures, curved natural commercial streets, comfortable external space scale, and Nanyang-style arcade buildings. From the summary results, it can be seen that tourists’ intention of photographing buildings on Sunwen West Road pedestrian street is obviously greater than the other two. In cultural life landscapes, recreational value occupies a higher position. Lihe Square, Holiday Square, and Huafa Commercial Square are all modern business districts, which are very popular. When it comes to taking photos, visitors tend to focus more on the attractiveness of the human environment rather than the buildings and spaces themselves.
In terms of public space imagery, in addition to the several shopping areas of Holiday Square, Lihe Square, and Huafa Commercial Square overlapping with the gathering areas of the cultural life category, the city also includes the Sun Yat-sen Memorial Hall, the Workers’ Cultural Palace, and many traditional streets and alleys. Zhongshan is a famous hometown of overseas Chinese. Therefore, there are many overseas Chinese houses with a combination of Chinese and western styles scattered in all streets and lanes of the city. Most of them have become protected buildings with a long history and a unique charm.
In terms of the image of landmark buildings, from the perspective of the proportion of pictures, it can already explain the lack of landmark buildings in Zhongshan. The landmark buildings in Zhongshan are concentrated in tourist areas such as the Sun Yat-sen Memorial Hall and the business districts represented by the commercial office buildings in the city center. Sun Yat-sen Memorial Hall is located in Cuiheng Village, Nanlang Town, Zhongshan. It is now a national first-class museum and a national AAAAA-level tourist attraction. The architectural appearance is a combination of Chinese and Western styles, solemn and magnificent.
Among the four city image types, natural landscape pictures are the least, accounting for only 6.43%. In fact, there is no shortage of natural landscapes in Zhongshan, but many natural landscapes are within the scope of protected areas, which leads to the lack of such network evaluation and picture information.
3.3. Evaluation of Cultural Service Perception
3.3.1. Discovering a Topic
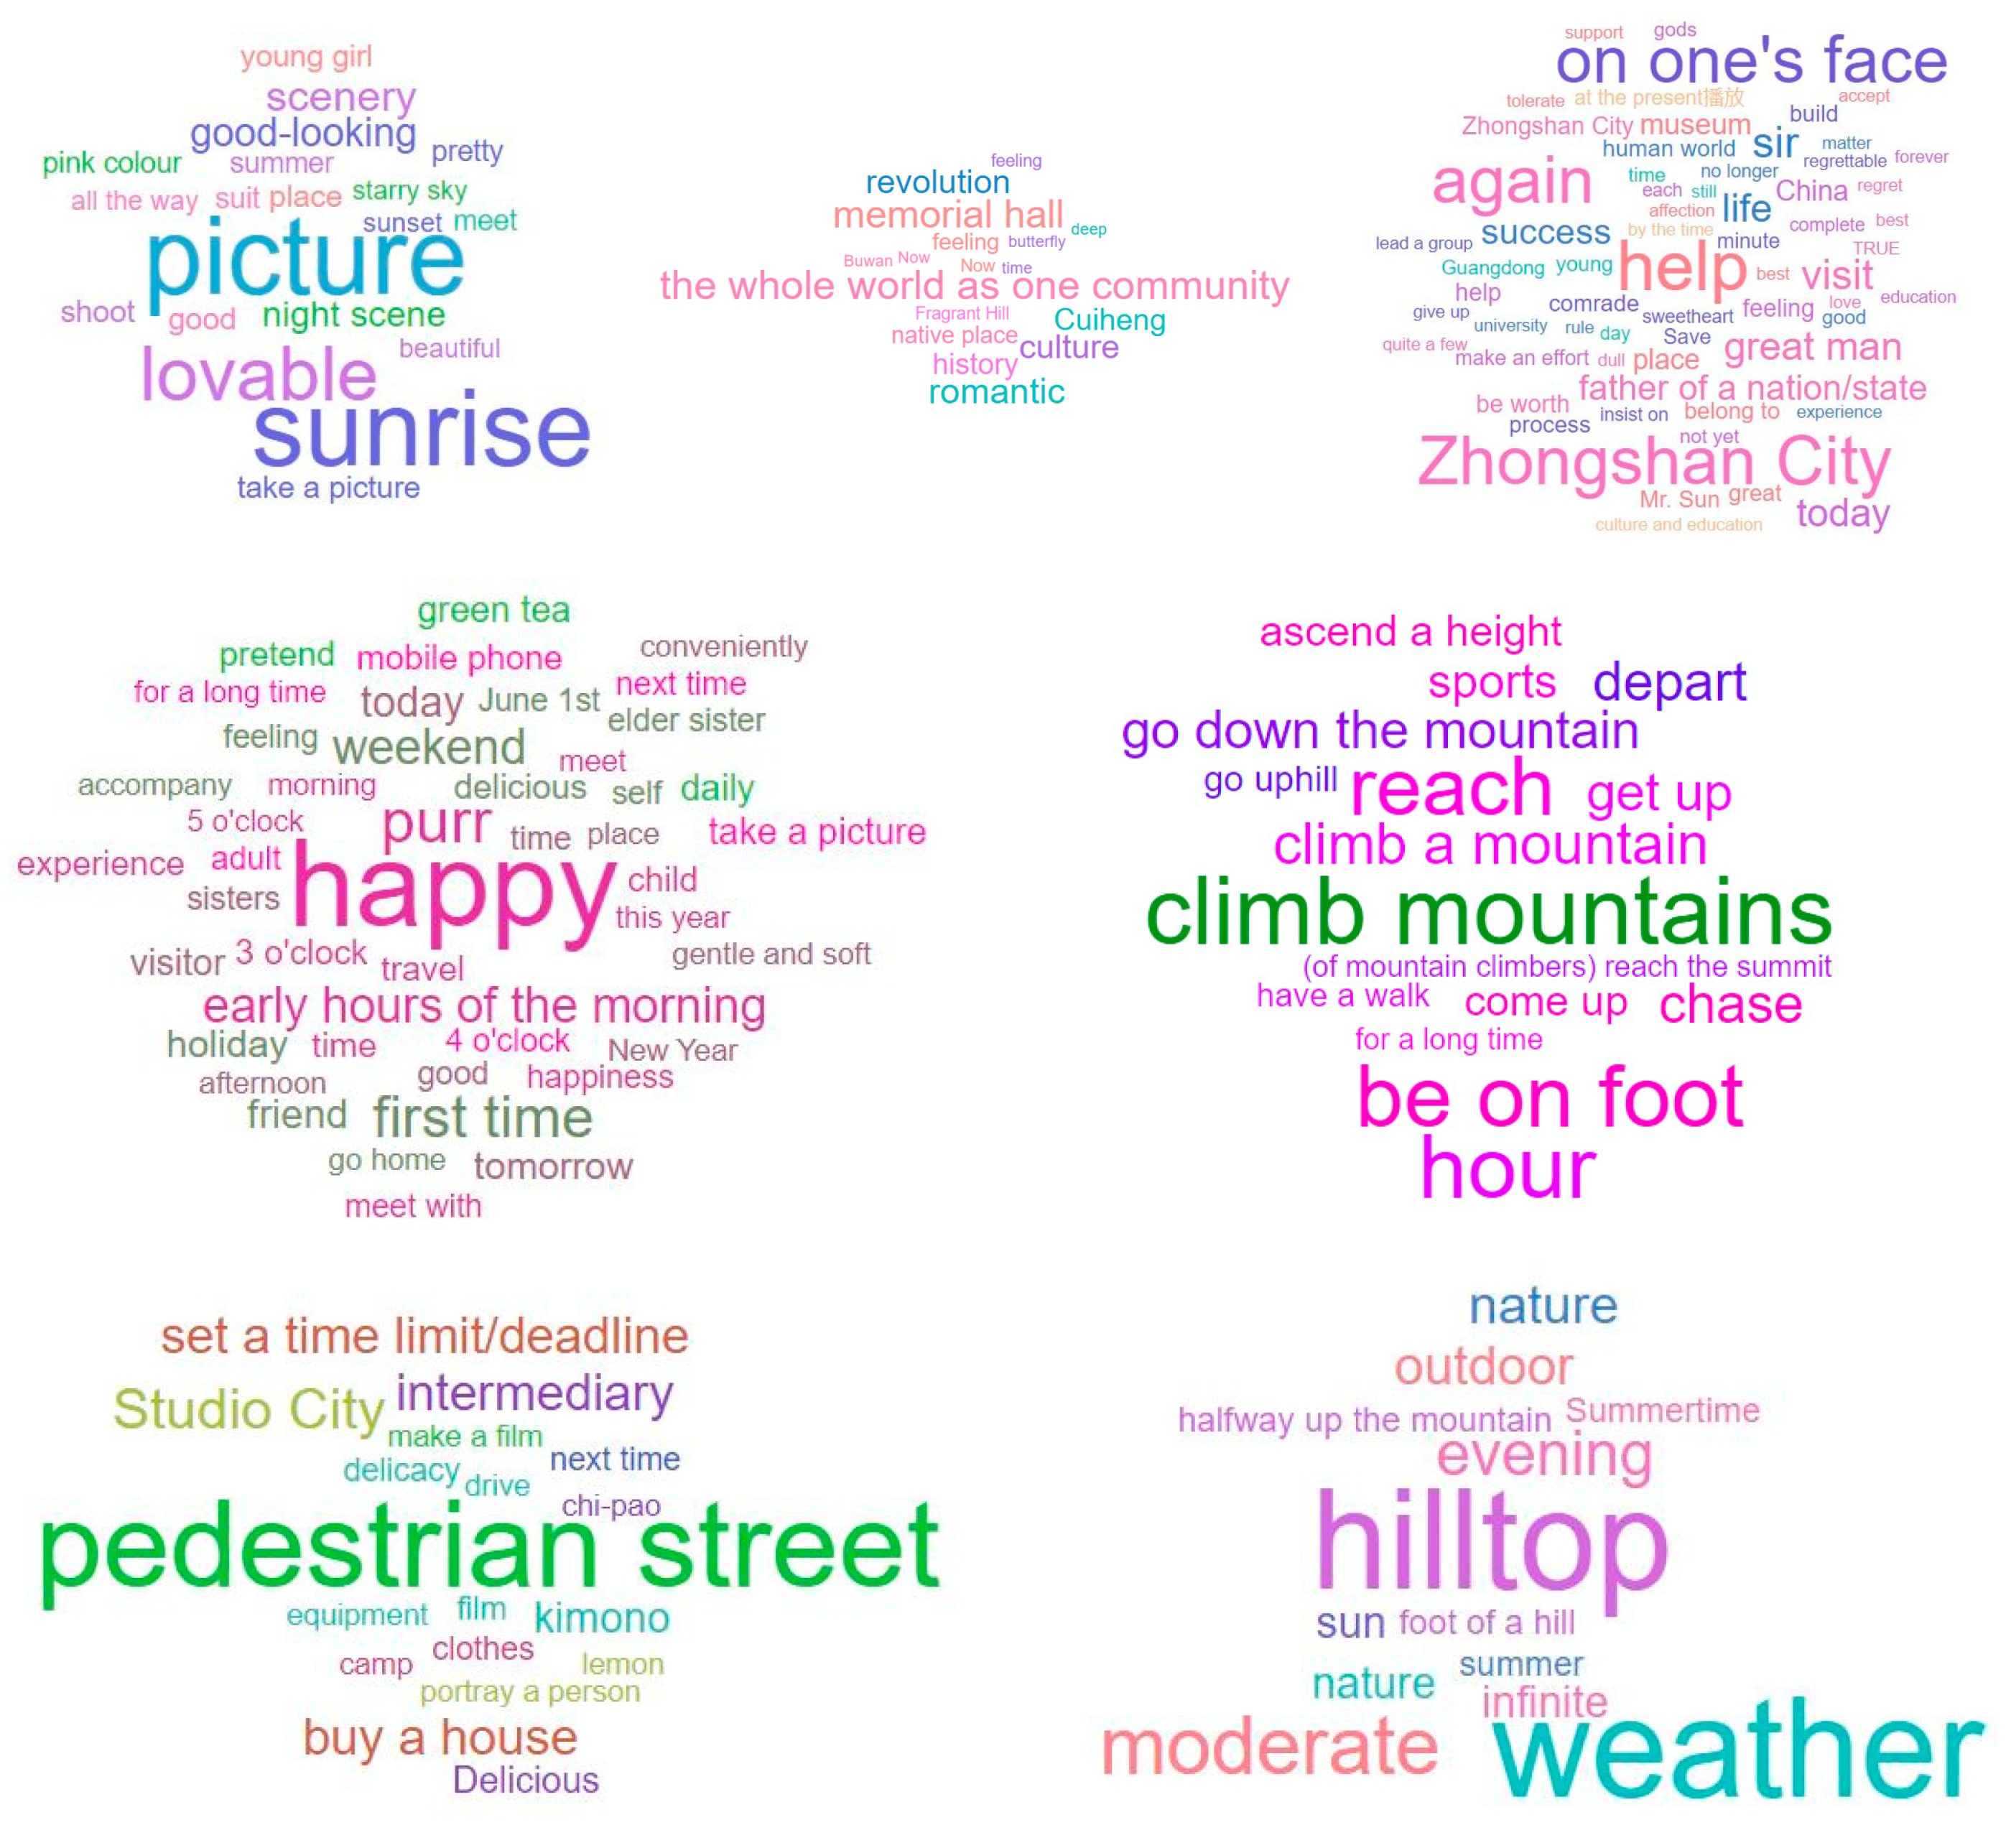
ROST CM6 semantic analysis software was used to analyze the word frequency of the collected review data and the software would output 300 words from high to low frequency by default. According to the actual needs of the research, 7 topics were selected according to the cultural service perception index (word frequency analysis is the basis for the evaluation of the perception of cultural services, and in order to demonstrate the specific work conducted by word frequency analysis, this section selects representative themes and presents them in the form of visual word cloud maps), the top 30 high-frequency words were selected for classification, and the words lacking reference value were removed. Worditout software platform (https://worditout.com/word-cloud/create, accessed on 15 December 2022) was used to draw the word cloud image (Figure 6). The size of the word font indicates the probability of the word appearing in the topic.
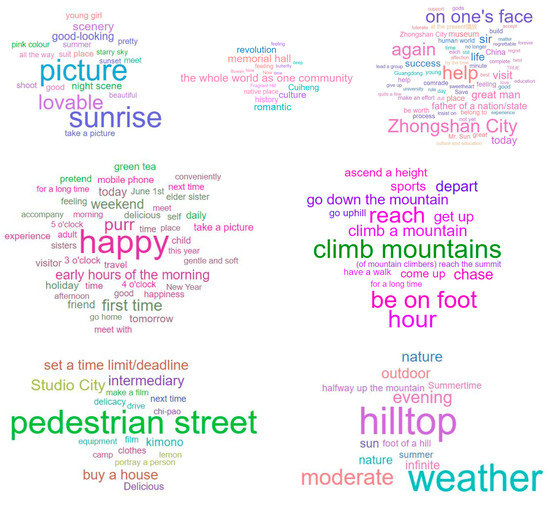
Figure 6.
Word cloud map of different cultural themes.
3.3.2. Classification of Cultural Services Perception Index Words and Evaluation Grading
Table 3 shows the classification of cultural services perception index words and evaluation grading. Among them, the representative keywords are classified into high-frequency words according to the specific descriptions of seven types of cultural services in Table 1, and the evaluation grading is made by counting the word frequency of all nodes representing various cultural services, taking the maximum word frequency of a specific cultural service as the upper limit, and then dividing it into high (5), relatively high (4), average (3), relatively low (2), and low (1), from high to low. Taking the former residence of Sun Yat-sen, a national 5A scenic spot, as an example, its high-frequency words are: former residence of Sun Yat-sen, Zhongshan, photos, the world for the public, memorial hall, great man, visit, revolution, feeling, happiness, etc. Among them, “Great man” and “revolution” belong to the cultural and historical value, and “visit” and “the world for the common” belong to the learning value. Among the top 30 high-frequency words, 17 words represent the learning value, 6 words represent the historical and cultural value, 5 words represent the recreational value, 1 word represents the aesthetics value, and 1 word represents the health value. The word frequency statistics are as follows: learning value 167, historical and cultural value 94, recreational value 27, aesthetic value 10, and health value 5. Based on the evaluation grading standard for cultural services, the learning value of Sun Yat-sen’s residence is rated as very high (5), the historical and cultural value is rated as high (4), and the recreational value, aesthetic value, and health value are all rated as low 1. According to the proportion calculated by word frequency, the result is that learning value accounted for 55.26%, cultural and historical value accounted for 30.92%, recreational value, aesthetic value, and health value accounted for 8.88%, 3.29%, and 1.65%, respectively. It can be seen that the main cultural service of Sun Yat-sen’s former residence is the learning value.
3.3.3. Evaluation Results of Cultural Service Perception of Different Image Types
According to the classification of four image types of indicators, the recreational value and aesthetic value of Zhongshan are the most easily perceived. Except for a few specific nodes, the four city image types of Zhongshan City, arranged from high to low are: recreational value, aesthetic value, learning value, cultural and historical value, economic value, health value, and life support value. Among them, aesthetic value and health value of natural landscapes are higher than the other three landscape types, but according to the comments, people generally think that the economic value of natural landscapes is low.
There are two types of landmark buildings: one is the Sun Yat-sen Memorial Hall and Zhongshan Museum, as the main tourist attractions or cultural and educational bases; another is the commercial area represented by the Twin Towers in Lihe Square. Therefore, the cultural services provided are also very different, forming two distinct parts. In the first category, most landmark architectural landscapes have both learning value and cultural and historical value. They are mainly provided by historical and cultural scenic spots such as Sun Yat-sen Memorial Hall, the former residence of Sun Yat-sen, and Zhongshan Museum. The landscapes with historical and cultural educational attributes play the role of learning and education, and many historical buildings also have high aesthetic value. In the second category, most of the symbol buildings mainly provide recreational value. Lihe Square, Huafa Commercial Capital, and Holiday Square ranked at the top because the commercial space provides the same function, so the cultural services provided by the symbol buildings of the second category have only recreational value, economic value, and a few other values, which are relatively simple. Although the office building shapes are avant-garde and have beautiful night views, they lack outstanding characteristics, and tourist willingness to take photos is low.
The natural landscape mainly provides recreational value and health value. Parks with strong natural attributes include Lianfeng Mountain Park, Zi Ma Ling Park, Zhongshan Arboreal Park, and Yixian Lake Park. Among them, Qijiang Park, designed by renowned designer Yu Kongjian and rebuilt from the foundation of Yuezhong Shipyard, has strong natural compatibility and strong aesthetic sense and has won many international awards. Sun Wen Memorial Park and Sun Yat-sen Memorial Hall Park have commonalities with cultural and historical value and learning value.
Many public spaces in Zhongshan have very profound historical backgrounds. Most of the protected buildings are built by returned overseas Chinese with a long history and unique style, combining Chinese and Western elements, and can be seen everywhere in the main urban area. Sunwen West Road Pedestrian Street is one of the few public spaces with recreational, economic, cultural, historical, and aesthetic value. Sun Yat-sen Memorial Hall, Workers’ Cultural Palace, and other buildings are ancient, with strong historical flavor and artistic content. The aesthetic value of the public space landscape in Zhongshan is very high, and tourist willingness to take photos has been significantly improved.
Types of cultural life can best reflect the recreational value. Cultural life is closely connected with university towns and business districts. People tend to take pictures of buildings or landscapes in the solemn atmosphere of the first type of landmark buildings or in the beautiful natural landscape, whereas in the relaxed atmosphere of the second type of architectural environment, they tend to take pictures of their daily leisure life. There are two main reasons: one is that commercial activities are often held in the business circle, which will attract many tourists; the other is that the characteristics of the business circle itself are not obvious, and the functions are similar. All commercial spaces basically provide the same cultural services. In this case, showing their daily life becomes the first choice.
3.3.4. Spatial Distribution of Different Cultural Services
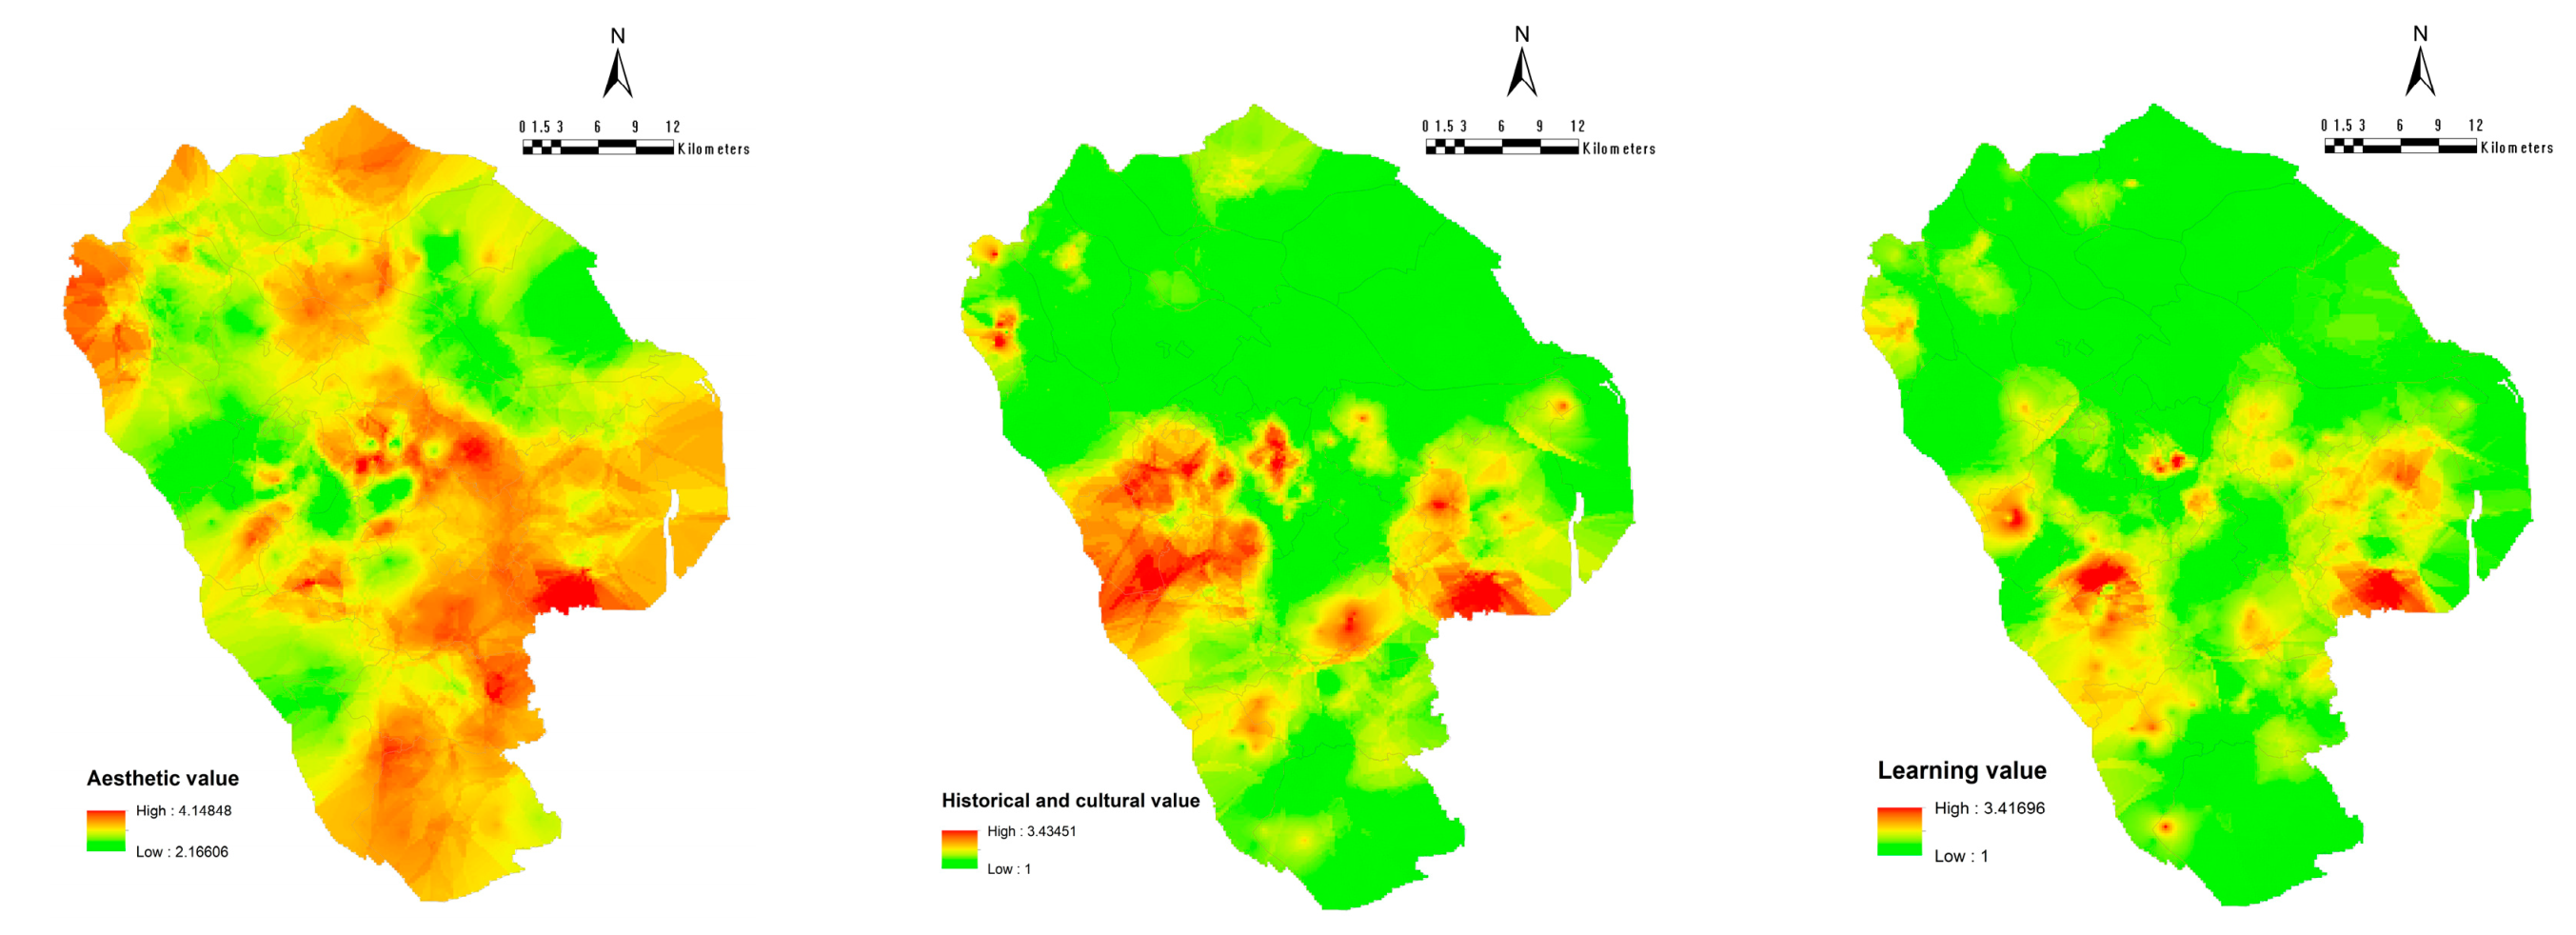
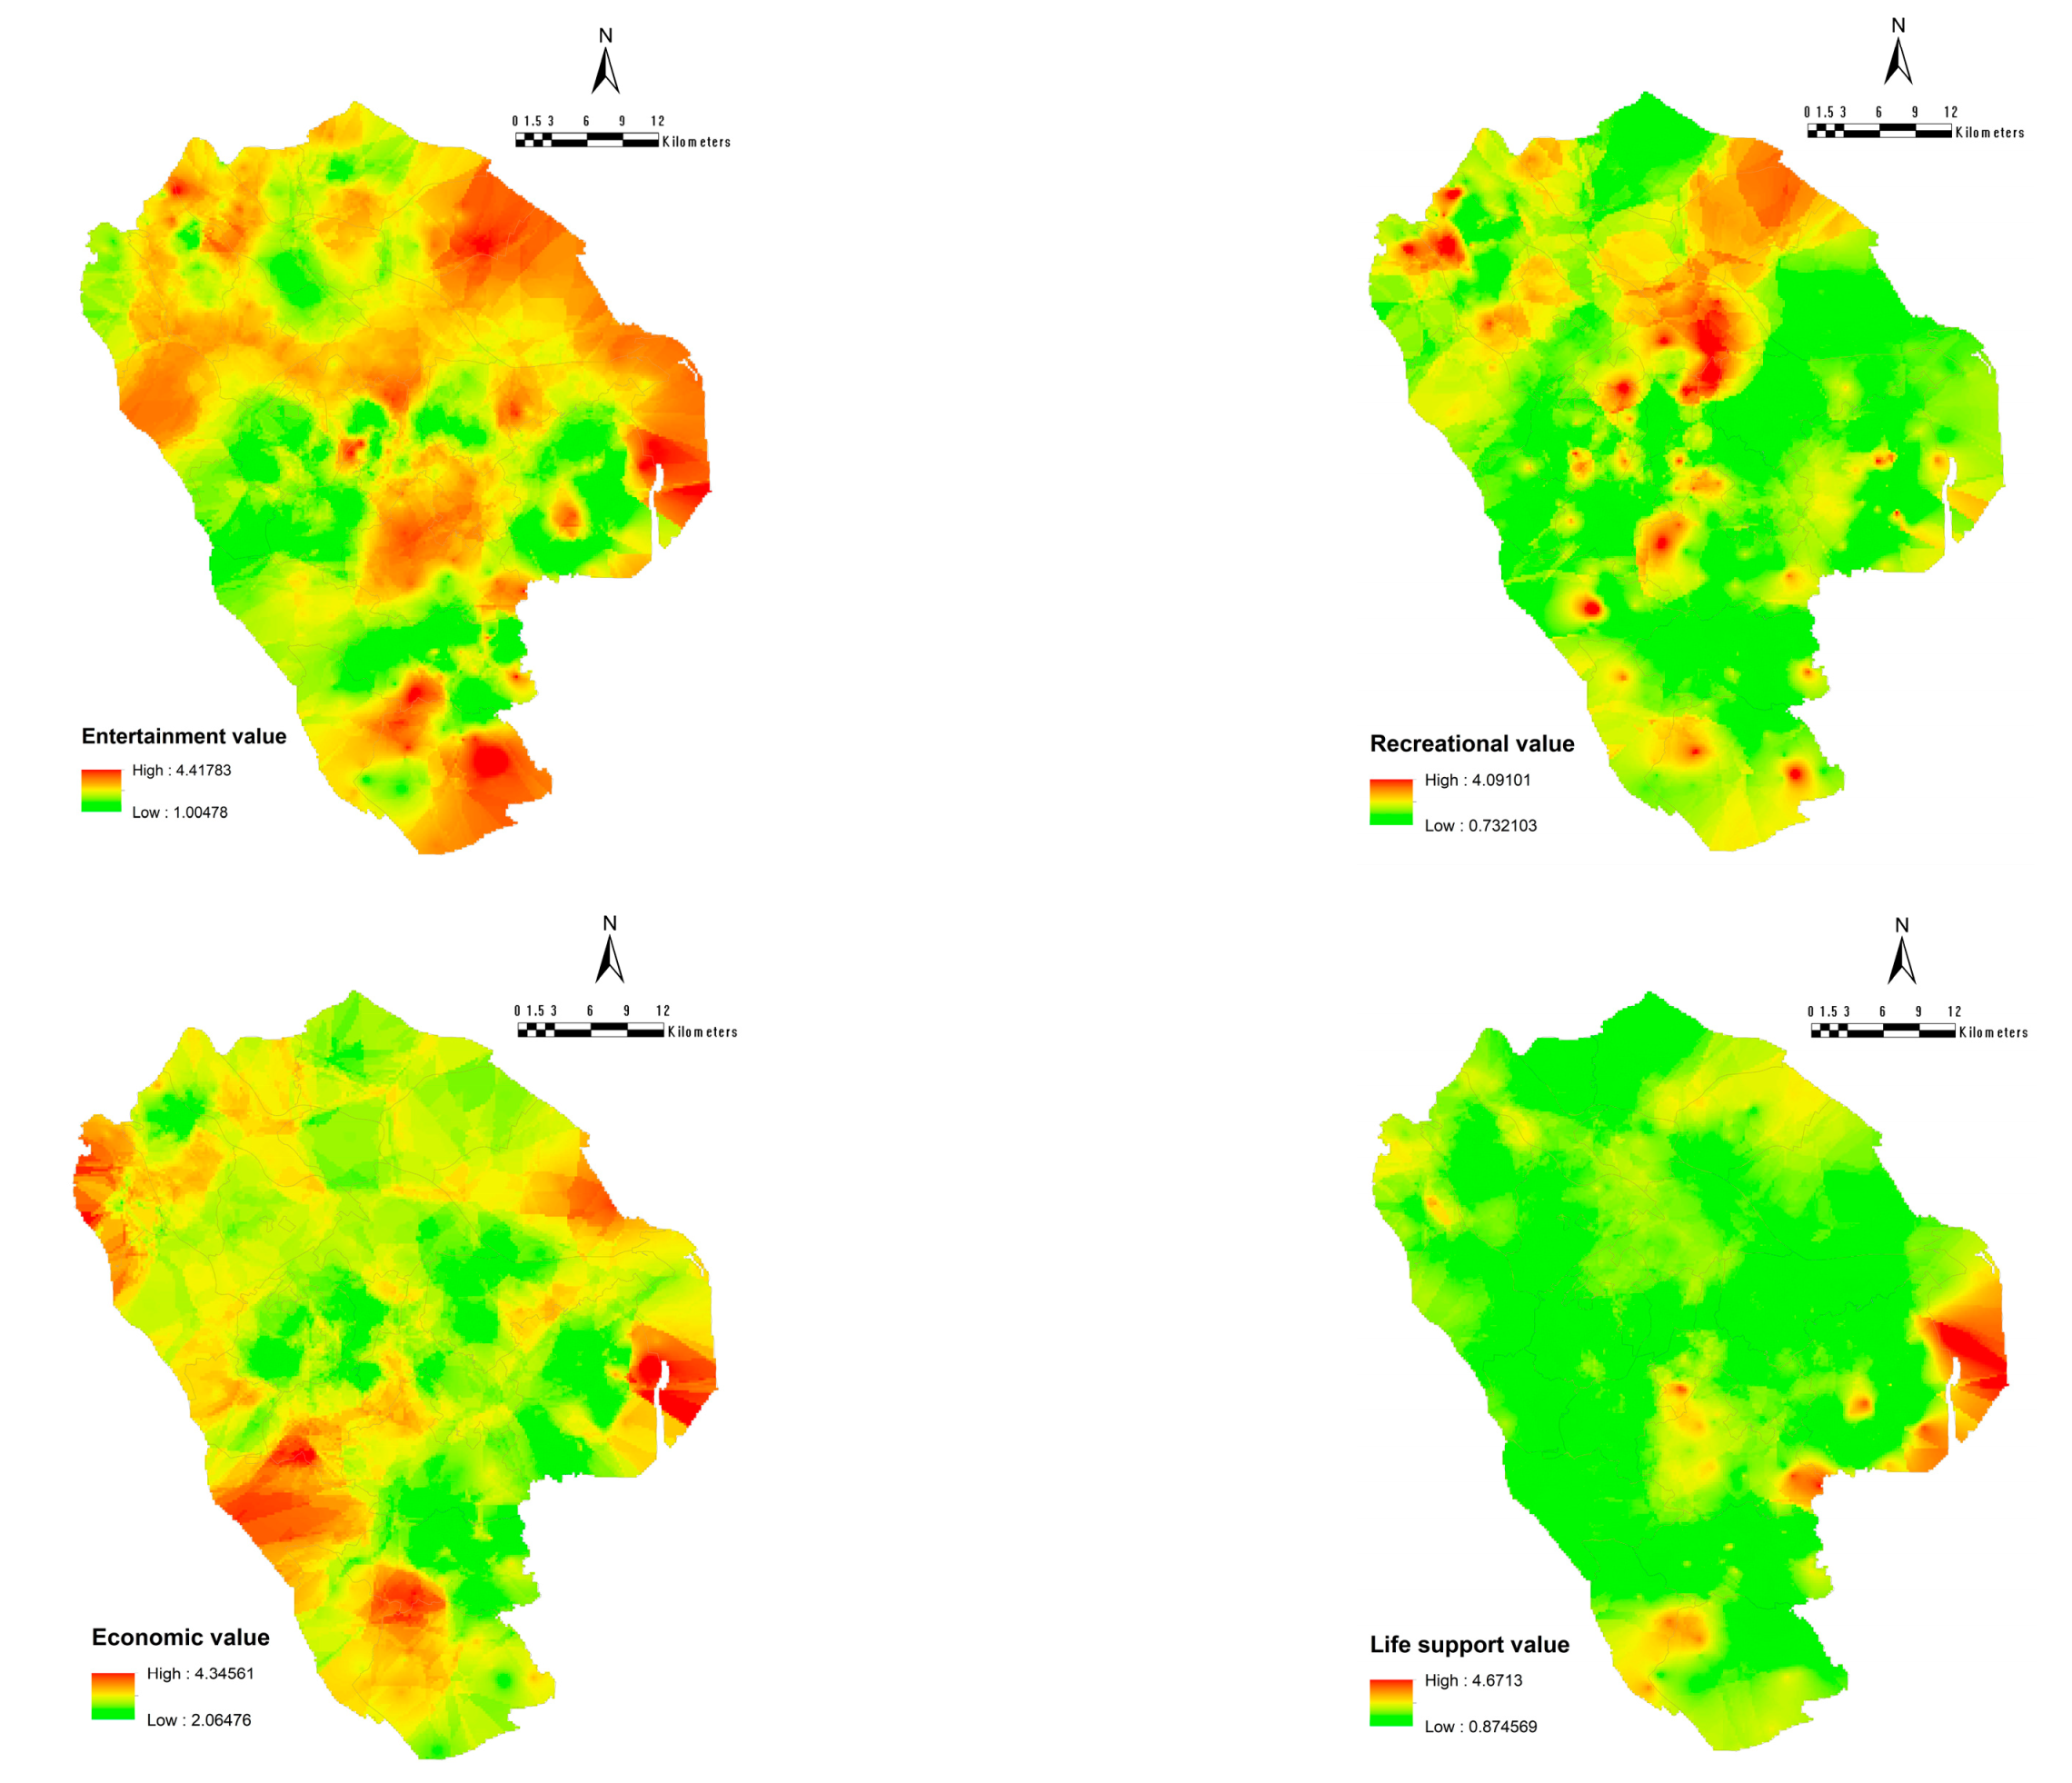
The Empirical Bayesian Kriging method was adopted in this study to carry out spatial interpolation of cultural service value, and the spatial resolution was set to 1000 dpi to generate a map of cultural service value (Figure 7). Figure 7 shows the value level and spatial distribution of seven kinds of cultural services within the administrative region of Zhongshan City. The high-value areas of various cultural services show a large divergence. Among them, the regions with high aesthetic value and recreational value are the most widely distributed, the central urban area and the surrounding hot spots occupy a large proportion, and the spatial distribution of aesthetic value and recreational value is also relatively correlated. Secondly, the areas with high historical and cultural value, recreational value, and economic value are also large, but the spatial distribution of these cultural services is rarely intermingled. For example, the areas with high historical and cultural value are mainly concentrated in the former residence of Sun Yat-sen, the walking street of Sunwen West Road, Longrui Porridge City in Shaxi, Dayong Hongbo City, etc. The areas with high recreational value are mainly concentrated in Port Wetland Park, Xurai Fitness Plaza, Tongxin Cultural and Sports Ecological Park in Triangle Town, and Guzhen Sports Ecological Park, whereas the areas with high economic value are mainly concentrated in sightseeing and entertainment projects and consumption scenes, such as Zhan Yuan, Yiyou Film and Television Base, Quanlin Happy World, and Dayong Town Culture and Art Square. The area with high learning value and life support value was the smallest, the area with high learning value was mainly concentrated in the former residence of Sun Yat-sen, and the area with high life support value was mainly concentrated in the Cuiheng National Wetland of Zhongshan, Guangdong.


Figure 7.
Value map of cultural services.
3.3.5. Relationship between Spatial Distribution of Cultural Services and City Image Structure
Nodes in the city image structure are the interest points of citizens and tourists on Zhongshan’s city image obtained from Weibo data. Through semantic word frequency analysis of comments collected by these nodes, the cultural service value grading of each node is obtained, and then the spatial distribution map of cultural services is generated by the empirical Bayesian Kriging interpolation method, so there is a necessary link between them. Comparing the spatial distribution of cultural services (Figure 7) with the city image structure (Figure 3), it is easy to see that the range of regions in the city image structure is most consistent with the range of areas with high aesthetic and recreational value. Since the scope of the region is determined according to the kernel density analysis of the node, we can infer that most commentators’ hot areas of Zhongshan’s city image mainly come from a beautiful visual experience and the pleasant experience of playing. The areas with high historical and cultural values and learning values only overlap with the Sun Yat-sen Residence area among the seven imagery areas, indicating that only the Sun Yat-sen Residence imagery area is dominated by historical and cultural values and learning values among the hotspot areas in the city image structure of Zhongshan, which is also fully consistent with the actual situation. The areas with high recreational, economic, and life support values have little overlap with the seven imagery areas, which are mainly from the scattered node. There are two possibilities to analyze the reasons: first, when commenting on the Internet, different groups of people are insensitive to or even ignore such cultural services, so they are rarely mentioned in the comments; second, in addition to the scenic spots and tourist routes at the core of Zhongshan, people with minority groups have also developed some “unconventional” free travel routes, so that they can gain a deeper understanding of Zhongshan’s history, culture, and local customs.
4. Discussion
Through the cognition of the image structure of Zhongshan city, a clear image structure is obtained through the perception of citizens and tourists, mainly focusing on the “readability” of urban space in the hearts of citizens and tourists. This image structure is quite different from the implemented Master Plan of Zhongshan City (2010–2020): The planned “one main and two sub-centres” (the “one main” refers to the urban centers of Shiqi District, East District, Qijiang New Town, and Torch Development Zone, whereas the “two sub-centres” refer to the two subcenters of Xiaolan and Sanxiang) are not significantly reflected in the urban imagery structure, and the largest “centres” in the urban imagery structure of Zhongshan obtained through the analysis of social media data are mainly the areas of Shiqi District, East District, Shaxi Town, and Torch Development Zone, whereas the area of Qijiang New Town is basically not covered, which is entirely consistent with the actual situation. Despite its reputation, the actual construction of Qijiang New Town has seriously lagged behind planning expectations, with many areas still not breaking ground by now. Although Shaxi town is not within the main urban area, it is close to the main urban area, the clothing industry is in full swing, and its food culture is unique, so it has become a punching place for Zhongshan citizens’ and foreign tourists’ daily life and travel experiences. The two subcenters are embodied in the region of image structure, which is basically the same. Both subcenters are reflected in the imaginative structure of the region, which is basically the same. The rest of the region is within the “four clusters” (central cluster, eastern cluster, northwestern cluster, and southern cluster), but much smaller than the planned clusters. This shows that urban planning has indeed played a guiding role in people’s lives, but it has not achieved the expected results. This is largely due to the fact that urban planning has not been implemented as well as it could have been, and that urban development and construction have lagged behind planning expectations and delays in planning changes. It can be seen that there is a gap between the city image structure in the minds of citizens and tourists, the structure of urban planning, and the actual spatial structure. Therefore, if a tourist wants to visit an unfamiliar city, the information obtained by searching for a map and viewing the planning will be quite different from the final urban experience. It can be seen that there is a gap between the city image structure in the minds of citizens and tourists, the structure of urban planning, and the actual spatial structure. Although there are differences in individual perception, the perception results based on massive social media comments are undoubtedly more valuable. Therefore, it is necessary to carry out a post-implementation evaluation of urban planning, and we can use the tool of big data to evaluate whether the planning objectives have been achieved.
The purpose of analyzing the image types and the proportion of images in social media big data is to grasp which type of space, landscape, or culture citizens and tourists are more interested in. The proportion of image types in Zhongshan differs significantly from other cities. In terms of landmark buildings, Chongqing [74], Shanghai, and Shenzhen account for the highest proportion of image types. As the cities with the fastest urbanization process in China, the unconventional landmark buildings in these cities can give people a deep impression; in terms of cultural life, Guangzhou and Chengdu account for the highest proportion of image types, accounting for 40.04% and 37.22%, respectively, but are still lower than Zhongshan’s 58.11%. In terms of natural landscape image types, the highest proportion is Hangzhou (37.25%), with the West Lake as the center of the lake and the mountains being very representative [50]. The dominant image type in Zhongshan is cultural life, followed by public space, landmark buildings, and natural landscapes. On the one hand, this indicates that Zhongshan is a city full of life and a fine and pleasant place to live. On the other hand, it also reflects the lack of distinctive iconic architecture in the city’s landscape construction. It is therefore important for city managers to integrate city image with the content of the urban tourism industry, not only to beautify the urban environment and optimize the urban space but also to realize a two-way interactive and integrated urban system that helps visitors to perceive the cultural connotation and spiritual sense of the city in greater depth and to create a good emotional experience of the city. Through the development of urban tourism and the rational organization of the urban landscape, the public can clearly feel the city’s symbols and form a distinctive urban tourism intention. In the process of urban design and construction, a tourist city is created that is suitable for people to live in and for tourists to visit.
Evaluating the perception of cultural service of urban image is an exploration of the perception of non-material elements on the basis of the traditional cognition of material space elements. This method can establish the corresponding relationship between comment pictures, image types, and geospatial locations, as well as the perceptual relationship between comment documents and cultural service types. The types and differences of cultural services provided by different urban image types can be reflected through reviewers’ perceptual evaluation of different image types. The perceptual evaluation of cultural services makes it easier to see at a glance the value of various cultural services at specific imagery nodes (for specific use it is better to overlay the image structure map on top of the cultural value assessment map to facilitate the reading of the map, this study does not use layer overlay in order to highlight the assessment of cultural service value and reduce the occlusion of the image nodes on the cultural service value assessment map), and also to see the global distribution of cultural services at an overall level, which has certain application value whether for making tourism strategies or optimizing the spatial layout of urban functions. Visitors’ online reviews express subjective feelings, revealing emotions and feelings about the urban spaces visited, and some of these negative reviews are valuable to managers and can provide targeted improvement plans. However, in the process of analysis, it is found that there are still some limitations in the study of cultural service perception of urban image based on network evaluation big data. For example, Wugui Mountain in Zhongshan City is a very important urban green lung and its life support value should be at a high value, but as the area is a nature reserve, development is very limited and visitors have extremely limited involvement in the area, so the review data covers insufficient geographical points and few evaluations, which is reflected in the low indicator value for the evaluation of the perception of cultural services. In addition, the number of trips across the city has fallen sharply in the two years or so since the outbreak of the new crown epidemic, with comments from a few years ago now of no real value and new data somewhat lacking.
At the same time, compared with the same type of research [84,85,86], the technical method of this study is very friendly to researchers who don’t have much academic support, and the technology is not superior. Interested researchers can completely realize the image perception research of a city that they have never been to through simple software operation according to the technical route of this paper, which is a research topic that attracts international readers. Just as some people use street view maps to travel around the world, this study also provides a way to know the world and feel the places. If one wants to replicate our approach, there is no need for a team of linguistic experts with PhDs to carry out the word separation and predict the most likely words, as our vocabulary comes from comments. There is no need to have strong knowledge of programming and algorithms, as the two most complicated steps have been completed by the software. Most importantly, it is better to use internet evaluations to reflect the types of urban imagery with better results: the content in social media is different from papers, and their meanings are accurate, but their words are not accurate, with network terms and strong personal feelings. It is impossible to imagine how many Chinese sentence expressions there are to describe how good or poor imagery is, and it is clearly unrealistic to judge by specifying just a few representative words—a large number of meaningful words would be excluded, leading to discrepancies in the results. This research method is suitable for situations where the database is large, e.g., mega-cities and first-tier cities. The sample is large enough to obtain a match. Some of the cities that are not in the limelight do not have enough reviews. This is a challenge for us. Compared with the current similar research, the research goal is different from that of Shanghai, Chongqing, and Shenzhen. Zhongshan is a second-tier city, and the results are gratifying.
In the application of city image perception research, both local governments and university researchers can use this method as research guidance. Urbanization is an inevitable and arduous process, and in those days when urban planning was not yet studied, bad planning could be considered a disaster. There are still many small and medium-sized cities in developing countries, both in China and throughout the world, that need to continue to develop, to continue to transform, and progress, and they are actively exploring what works best for them. How can we verify whether the historical scenic spots have really played a role in educating children? If not, what cultural services are lacking as a result? How to improve the next step? Our approach is informative to all these questions.
All in all, city image has a great influence on the development and design of a city, directly affecting its overall image and urban atmosphere. In order to create a truly livable, ecological, humanistic, economically vibrant, and regionally distinctive urban space and environment, it is important to understand the psychological perception of the city by its residents and visitors and to explore the various contents of city image in depth. Combined with the perceived conclusion of city image, urban planning is carried out at all levels to truly achieve the urban design goals of optimizing urban space, improving the urban environment, and manifesting urban culture, providing a strong guarantee for the sustainable development of the city.
5. Conclusions
Based on Kevin Lynch’s cognitive method of city image and Weibo’s review data, this study puts forward a method of deep fully convolutional neural network-based image semantic segmentation and word frequency analysis to perceive and analyze city image. This study combines urban image, big data, and deep learning, which can make up for the shortage of traditional research samples and expand the dimension and breadth of urban cognition. The main contributions of this study to the perception theory of urban image are as follows: on the basis of perceiving the material–spatial elements of city image based on social media big data, it explores a route to classify the image types of comment pictures by image semantic segmentation methods and extracting the cultural service value of city image by semantic word frequency analysis of online texts, thus realizing an integrated and comprehensive perception of city image. The mapping of cultural service hotpots using the perception results reveals the agglomeration state of different services and the spatial distribution characteristics of cultural service value, which can provide references for urban spatial planning and landscape design, such as service and maintenance, and help integrate the concept of cultural service into the planning and design of the cultural tourism industry. The research results can be applied to the post-implementation evaluation of urban planning, using big data on the perception of urban imagery by web users to assess whether the planning objectives have been achieved and thus further improve the design. It can also integrate urban imagery with the content of the urban tourism industry to realize a two-way interactive and integrated urban system. It can also see the distribution of cultural services in the city as a whole, so as to optimize the spatial function layout of the city in a targeted manner and ultimately achieve sustainable urban development.
This paper is still exploratory research on the comprehensive perception of urban image in the new data environment. The shortcomings are that the perception research of urban image is not subdivided according to user groups, and there is a lack of in-depth application discussion on the image perception results. Therefore, in further work in the future, we will introduce social and cultural considerations to the crowd of observers living in the city, classify them by different groups of people, and compare the perceived differences of different groups on city image; in the time dimension, we will consider a shift from horizontal to vertical research, and due to the short history of Weibo, social media data with a longer event span can be used in the future to study the evolution mechanism of Zhongshan’s city image combined with historical books, pictures, videos, and other materials. For the perception of cultural service of urban image, we will further analyze the urban landscape pattern and elements in order to provide more scientific support for urban spatial layout.
Author Contributions
Conceptualization, L.S., W.C., and L.F.; methodology, L.S. and W.C.; software, L.S., W.C., and Y.Z.; validation, L.S., W.C., Y.Z., and L.F.; formal analysis, L.S. and W.C.; investigation, W.C.; resources, L.S. and W.C.; data curation, L.S. and L.F.; writing—original draft preparation, L.S. and W.C.; writing—review and editing, L.S.,Y.Z., and L.F.; visualization, L.S. and Y.Z.; supervision, L.F.; funding acquisition, L.F. All authors have read and agreed to the published version of the manuscript.
Funding
This research was funded by major public welfare projects in Zhongshan, grant number 421S24; and the Science Foundation of Shenyang Agricultural University, grant number X2022005.
Institutional Review Board Statement
Not applicable.
Informed Consent Statement
Not applicable.
Data Availability Statement
Not applicable.
Conflicts of Interest
The authors declare no conflict of interest.
References
- Bai, K.; Zhao, A.Z. Studies on convergence and divergence of city image and destination image. Prog. Geogr. 2011, 30, 1312–1320. [Google Scholar]
- Li, X.; Li, P.; Pei, U.X.; Ran, X.G. Vision and connotation: The shaping and evolution of unique images of Chongqing City. Urban Dev. Stud. 2018, 25, 141–145+160. [Google Scholar]
- Lynch, K. The Image of the City, 1st ed.; The M.I.T. Press: Cambridge, MA, USA, 2014; pp. 35–64. [Google Scholar]
- Al-ghamdi, S.A.; Al-Harigi, F. Rethinking image of the city in the information age. Procedia Comput. Sci. 2015, 65, 734–743. [Google Scholar] [CrossRef]
- Filomena, G.; Verstegen, J.A.; Manley, E. A computational approach to ‘The Image of the City’. Cities 2019, 89, 14–25. [Google Scholar] [CrossRef]
- Shen, Y.R. Urban character and urban image. Urban Probl. 2004, 3, 8–11. [Google Scholar]
- Xu, L.Q. The rethinking of themes and paradigms: A review of urban image studies in china. New Archit. 2012, 1, 114–117. [Google Scholar]
- Feng, J. Spatial cognition and the image space of beijing’s residents. Sci. Geogr. Sin. 2005, 2, 142–154. [Google Scholar]
- Chen, M.Y.; Xu, J.G. The characteristics of imagery hot space: A case study of Nanjing. Geogr. Res. 2014, 33, 2286–2298. [Google Scholar]
- Gao, Y.J.; Jia, A.Q.; Li, F.; Zhang, Q.H. Seclusion and anchoring: A study on the lmage change of baoding historic and cultural city in cognitive map. Mod. Urban Res. 2021, 8, 45–52. [Google Scholar]
- Pan, Y.; Cui, Y.H.; Zhang, X.L. The relation between the five elements of urban image and the inheritance of cultural context. Study Nat. Cult. Herit. 2019, 4, 135–139. [Google Scholar]
- Guan, T.; Sun, X.J.; Guan, Z. Analysis of the cognitive and environmental behaviour of urban imagery elements: An example of the cognitive map of Tsinghua observers. Beauty Times 2021, 1, 62–63. [Google Scholar]
- Yang, J. A Study on the Image Space cognition of the core area of nanjing city based on the urban image theory. Art Des. 2017, 2, 64–66. [Google Scholar]
- Liu, K.; Yang, L. Exploring the spatial pattern language of mountain streets based on urban imagery: Taking chongqing yuzhong peninsula as an example. Hous. Real Estate 2018, 8, 223–224. [Google Scholar]
- Zhang, Z.H.; Wang, L.; Zhang, P. A study on tourism destination image with place theory from abroad. Mod. Urban Res. 2009, 24, 69–75. [Google Scholar]
- Liu, Y.F.; Zhou, Y.Q.; Guo, Z.J.; Tong, X.; Cui, J.H. Study on collective memory of the historic urban landscape of lhasa based on city image. Urban Dev. Stud. 2018, 25, 77–87. [Google Scholar]
- Bahrehdar, A.R.; Adams, B.; Purves, R.S. Streets of London: Using flickr and openstreetmap to build an interactive image of the city. Comput. Environ. Urban Syst. 2020, 84, 101524. [Google Scholar] [CrossRef]
- Gilboa, S.; Jaffe, E.D.; Vianelli, D.; Pastore, A.; Herstein, R. A summated rating scale for measuring city image. Cities 2015, 44, 50–59. [Google Scholar] [CrossRef]
- Kruse, J.; Kang, Y.; Liu, Y.-N.; Zhang, F.; Gao, S. Places for play: Understanding human perception of playability in cities using street view images and deep learning. Comput. Environ. Urban Syst. 2021, 90, 101693. [Google Scholar] [CrossRef]
- Oshimi, D.; Harada, M. Host residents’ role in sporting events: The city image perspective. Sport Manag. Rev. 2019, 22, 263–275. [Google Scholar] [CrossRef]
- Rall, E.; Bieling, C.; Zytynska, S.; Haase, D. Exploring city-wide patterns of cultural ecosystem service perceptions and use. Ecol. Indic. 2017, 77, 80–95. [Google Scholar] [CrossRef]
- Shao, X.C. Research on urban image and its application in urban planning. Urban Archit. Space 2020, 27, 167–168. [Google Scholar]
- Zhou, Y.B.; Sha, R.; Yang, Y.; Lu, X.X.; Hou, B. Tourism landscape image evaluation. Geogr. Res. 2011, 30, 359–371. [Google Scholar]
- Li, M.Y.; Yang, Z.H.; Xue, F. Urban street greenery quality measurement, planning and design promotion strategies based on multi-source data: A case study of fuzhou’s main urban area. Landsc. Archit. 2021, 28, 62–68. [Google Scholar]
- Liu, Y.F.; Mu, T.T.; Huang, Z.W.; Ha, R.G. Research on visually perceived image and strategies for vista view system improvement of the jinsitao waterfront of shichahai in beijing. Landsc. Archit. Front. 2019, 7, 121–131. [Google Scholar] [CrossRef]
- Guo, Y.; Barnes, S.J.; Jia, Q. Mining meaning from online ratings and reviews: Tourist satisfaction analysis using latent dirichlet allocation. Tour. Manag. 2017, 59, 467–483. [Google Scholar] [CrossRef]
- Hunter, W.C. The social construction of tourism online destination image: A comparative semiotic analysis of the visual representation of Seoul. Tour. Manag. 2016, 54, 221–229. [Google Scholar] [CrossRef]
- Tian, F.J.; Wang, Z.L. Review on city space image at home and abroad. World Reg. Stud. 2014, 23, 84–92. [Google Scholar]
- Li, H.; Xu, X.Q. Spatial analysis of guangzhou city image. Hum. Geogr. 1993, 3, 27–35. [Google Scholar]
- Feng, W.B.; Huang, G.Y. Analysis and evaluation of urban image elements based on perception of residents in the main districts of Chongqing. Geogr. Res. 2006, 5, 803–813. [Google Scholar]
- Feng, W.B.; Long, B.; Zhang, S.L. Evaluation of urban recreation space quality based on Perception of tourist in chongqig metropolis. Hum. Geogr. 2009, 24, 91–96. [Google Scholar]
- Fei, Y.M.; Ye, M. Analysis of the image of Suzhou. South Archit. 2008, 2, 65–67. [Google Scholar]
- Tian, F.J.; Sha, R. A spatial analysis of the image of urban tourist destinations: A case study on Nanchang. Tour. Trib. 2008, 7, 67–71. [Google Scholar]
- Jiang, Z.J.; Wu, G.Q.; Bai, G.R. A spatial analysis of the image of tourism destination: A case study on ancient water towns in Southern Yangtze River. Acta Sci. Nat. Univ. Sunyatseni 2003, 2, 248–253. [Google Scholar]
- Jiang, B.; Li, L.; Zhang, T. Exploring relationship between urban spatial elements and public health: Using ‘the image of city’ theory as a research framework. Shanghai Urban Plan. Rev. 2017, 3, 63–68. [Google Scholar]
- Zhang, C.Y.; Zhang, P.; Jiang, Y.; Zhang, X.J. Study on the coupling of urban cognition and urban image in harbin. China Circ. Econ. 2021, 12, 93–97. [Google Scholar]
- Liu, Y.; Wang, X. Urban imaginable morphology: To shape the distinctive features of cities. J. Qingdao Univ. Technol. 2004, 1, 34–38. [Google Scholar]
- Zhang, W.; Zhou, Y.Y. Comparative study on spatial characteristics from the perspective of urban image: Taking Chengdu and New York as examples. Sichuan Archit. 2021, 41, 77–79+84. [Google Scholar]
- Xie, Y.J.; Peng, X.; Huang, Z.; Liu, Y. Image perception of Beijing’s regional hotspots based on microblog data. Prog. Geogr. 2017, 36, 1099–1110. [Google Scholar]
- Karasov, O.; Heremans, S.; Külvik, M.; Domnich, A.; Burdun, I.; Kull, A.; Helm, A.; Uuemaa, E. Beyond land cover: How integrated remote sensing and social media data analysis facilitates assessment of cultural ecosystem services. Ecosyst. Serv. 2022, 53, 101391. [Google Scholar] [CrossRef]
- Wei, J.; Yue, W.; Li, M.; Gao, J. Mapping human perception of urban landscape from street-view images: A deep-learning approach. Int. J. Appl. Earth Obs. Geoinf. 2022, 112, 102886. [Google Scholar] [CrossRef]
- Martí, P.; Serrano-Estrada, L.; Nolasco-Cirugeda, A. Social Media data: Challenges, opportunities and limitations in urban studies. Comput. Environ. Urban Syst. 2019, 74, 161–174. [Google Scholar] [CrossRef]
- Liu, Y. Rethinking some basic problems of human geography from the perspective of social perception. Acta Ecol. Sin. 2016, 71, 564–575. [Google Scholar]
- Gosal, A.S.; Ziv, G. Landscape aesthetics: Spatial modelling and mapping using social media images and machine learning. Ecol. Indic. 2020, 117, 106638. [Google Scholar] [CrossRef]
- Lu, Y.; Xu, S.; Liu, S.; Wu, J. An approach to urban landscape character assessment: Linking urban big data and machine learning. Sustain. Cities Soc. 2022, 83, 103983. [Google Scholar] [CrossRef]
- Qiu, L.; Lindberg, S.; Nielsen, A.B. Is biodiversity attractive?—On-site perception of recreational and biodiversity values in urban green space. Landsc. Urban Plan. 2013, 119, 136–146. [Google Scholar] [CrossRef]
- Ghermandi, A.; Sinclair, M. Passive crowdsourcing of social media in environmental research: A systematic map. Glob. Environ. Chang. 2019, 55, 36–47. [Google Scholar] [CrossRef]
- Cui, N.; Malleson, N.; Houlden, V.; Comber, A. Using social media data to understand the impact of the COVID-19 pandemic on urban green space use. Urban For. Urban Green. 2022, 74, 127677. [Google Scholar] [CrossRef]
- Hospers, G.-J. Lynch, Urry and City Marketing: Taking Advantage of the City as a Built and Graphic Image. Place Brand. Public Dipl. 2009, 5, 226–233. [Google Scholar] [CrossRef]
- Cao, Y.H.; Long, Y.; Yang, P.F. City image study based on online pictures: 24 cities case. Planners 2017, 33, 61–67. [Google Scholar]
- Liu, X.Y.; Wu, Y.Y. Research on regional image perception based on stakeholder Weibo data. J. News Res. 2020, 11, 13–15. [Google Scholar]
- Zhou, N. Research on urban spatial structure based on the dual constraints of geographic environment and POI big data. J. King Saud Univ. Sci. 2022, 34, 101887. [Google Scholar] [CrossRef]
- Xue, B.; Xiao, X.; Li, J. Identification method and empirical study of urban industrial spatial relationship based on POI big data: A case of Shenyang City, China. Geogr. Sustain. 2020, 1, 152–162. [Google Scholar] [CrossRef]
- Yang, X.; Guo, X.; Li, Y.; Yang, K. The sequential construction research of regional public electric vehicle charging facilities based on data-driven analysis—Empirical analysis of Shanxi Province. J. Clean. Prod. 2022, 380, 134948. [Google Scholar] [CrossRef]
- Schmöcker, J.-D. Big Data for Public Transport Planning. In International Encyclopedia of Transportation; Vickerman, R., Ed.; Elsevier: Oxford, UK, 2021; pp. 134–139. [Google Scholar]
- Chen, Y.; Yue, W.; La Rosa, D. Which communities have better accessibility to green space? An investigation into environmental inequality using big data. Landsc. Urban Plan. 2020, 204, 103919. [Google Scholar] [CrossRef]
- Ding, L.; Huang, Z.; Xiao, C. Are human activities consistent with planning? A big data evaluation of master plan implementation in Changchun. Land Use Policy 2023, 126, 106509. [Google Scholar] [CrossRef]
- Jiang, Y.Y.; Jin, B.; Zhang, B.C. Research progress of natural language processing based on deep learning. Comput. Eng. Appl. 2021, 57, 1–14. [Google Scholar]
- Hinton, G.E.; Salakhutdinov, R.R. Reducing the dimensionality of data with neural networks. Science 2006, 313, 504–507. [Google Scholar] [CrossRef]
- Perronnin, C.F. An efficient approach to semantic segmentation. Int. J. Comput. Vis. 2011, 95, 198–212. [Google Scholar]
- Koolwal, V.; Mohbey, K.K. A comprehensive survey on trajectory-based location prediction. Iran J. Comput. Sci. 2020, 3, 65–91. [Google Scholar] [CrossRef]
- Li, Z.; Chen, G.; Yang, X.; Zhang, H.; Hua, M.; Sun, B. Large-scale evaluation and analysis of urban street space quality based on deep learning technology: Case study of Guiyang City. In Proceedings of the 2020/2021 China Urban Planning Annual Meeting and 2021 China Urban Planning Academic Season, Chengdu, China, 28–30 September 2021. [Google Scholar]
- Ye, Y.; Huang, R.; Zhang, L. People-oriented urban design supported by multi-source data and deep learning: A case study on urban greenway planning of Suzhou Creek, Shanghai. Landsc. Archit. 2021, 28, 39–45. [Google Scholar]
- Zhu, Z. Evaluation Method of Urban Green Space Landscape Satisfaction Based on Social Media Data. Master’s Thesis, Peking University, Beijing, China, 2020. [Google Scholar]
- Lingua, F.; Coops, N.C.; Griess, V.C. Valuing cultural ecosystem services combining deep learning and benefit transfer approach. Ecosyst. Serv. 2022, 58, 101487. [Google Scholar] [CrossRef]
- Fang, M. A Study on the Emotional Characteristics of Urban Park Visitors Based on Social Media Big Data. Master’s Thesis, Zhejiang Agriculture and Forestry University, Hangzhou, China, 2019. [Google Scholar]
- Shao, H.; Zhang, Y.; Li, W. Extraction and analysis of city’s tourism districts based on social media data. Comput. Comput. Environ. Urban 2017, 65, 66–78. [Google Scholar] [CrossRef]
- Zhang, S.; Zhou, W. Recreational visits to urban parks and factors affecting park visits: Evidence from geotagged social media data. Landsc. Urban Plan. 2018, 180, 27–35. [Google Scholar] [CrossRef]
- Cardoso, A.S.; Renna, F.; Moreno-Llorca, R.; Alcaraz-Segura, D.; Tabik, S.; Ladle, R.J.; Vaz, A.S. Classifying the content of social media images to support cultural ecosystem service assessments using deep learning models. Ecosyst. Serv. 2022, 54, 101410. [Google Scholar] [CrossRef]
- Zhang, F.; Zhou, B.; Liu, L.; Liu, Y.; Fung, H.H.; Lin, H.; Ratti, C. Measuring human perceptions of a large-scale urban region using machine learning. Landsc. Urban Plan. 2018, 180, 148–160. [Google Scholar] [CrossRef]
- Guo, M.M.; Liu, W.B. Study on urban spatial image of the main districts of Jincheng. Territ. Nat. Resour. Study 2019, 6, 39–41. [Google Scholar]
- Zhu, C.Y. Landscape planning and design of urban parks from the perspective of city image. J. Anhui Agric. Sci. 2009, 37, 13327–13328+13353. [Google Scholar]
- Cui, L.M.; Qu, L.Y.; He, D. Evaluating Emotional Perception of Spatial Hotspots via Deep Learning: A Case Study of Shanghai. Hum. Geogr. 2021, 36, 121–130+176. [Google Scholar]
- Cao, Y.H.; Yang, P.F.; Long, Y. The innovation of city image cognitive method based on deep learning: A case study of Chongqing main district. Chin. Landsc. Archit. 2019, 35, 90–95. [Google Scholar]
- Zhongshan Municipal People’s Government Official Website. Available online: www.zs.gov.cn/zjzs/jrfc/csry/index_2.html (accessed on 1 January 2023).
- Shan, S.; Peng, J.; Wei, Y. Environmental Sustainability assessment 2.0: The value of social media data for determining the emotional responses of people to river pollution—A case study of Weibo (Chinese Twitter). Socio-Econ. Plan. Sci. 2021, 75, 100868. [Google Scholar] [CrossRef]
- Fox, N.; Graham, L.J.; Eigenbrod, F.; Bullock, J.M.; Parks, K.E. Enriching social media data allows a more robust representation of cultural ecosystem services. Ecosyst. Serv. 2021, 50, 101328. [Google Scholar] [CrossRef]
- Yao, Y.; Liang, Z.; Yuan, Z.; Liu, P.; Bie, Y.; Zhang, J.; Wang, R.; Wang, J.; Guan, Q. A human-machine adversarial scoring framework for urban perception assessment using street-view images. Int. J. Geogr. Inf. Sci. 2019, 34, 8–17. [Google Scholar] [CrossRef]
- Kaklauskas, A.; Bardauskiene, D.; Cerkauskiene, R.; Ubarte, I.; Raslanas, S.; Radvile, E.; Kaklauskaite, U.; Kaklauskiene, L. Emotions analysis in public spaces for urban planning. Land Use Policy 2021, 107, 105458. [Google Scholar] [CrossRef]
- Long, J.; Shelhamer, E.; Darrell, T. Fully convolutional networks for semantic segmentation. IEEE Trans. Pattern Anal. Mach. Intell. 2015, 39, 640–651. [Google Scholar]
- Tian, X.; Wang, L.; Ding, Q. Review of image semantic segmentation based on deep learning. J. Softw. 2019, 30, 440–468. [Google Scholar]
- Huo, S.G.; Huang, L.; Yan, L.J. Valuation of cultural ecosystem services based on solves: A case study of the south ecological park in wuyi county, zhejiang province. Acta Ecol. Sin. 2018, 38, 3682–3691. [Google Scholar]
- Zhao, Q.Q.; Li, J.; Liu, J.Y.; Qin, K.Y.; Tian, T. Assessment and analysis of social values of cultural ecosystem services based on the SolVES model in the Guanzhong-Tianshui Economic Region. Acta Ecol. Sin. 2018, 38, 3673–3681. [Google Scholar]
- Cai, G.Y.; Xia, B.B. Multimedia sentiment analysis based on convolutional neural network. J. Comput. Appl. 2016, 36, 428–431+477. [Google Scholar]
- Zhang, H.T.; Wang, D.; Xu, H.L.; Sun, S.Y. Sentiment classification of micro-blog public opinion based on convolution neural network. J. China Soc. Sci. Tech. Inf. 2018, 37, 695–702. [Google Scholar]
- He, W.Y.; Li, C.; Nie, G.Y.; Yang, L.S.; Wang, C.Y. The latent application of deep learning in urban perception: Image discrimination analysis by convolutional neural network. Urban Plan. Int. 2019, 34, 8–17. [Google Scholar] [CrossRef]
Disclaimer/Publisher’s Note: The statements, opinions and data contained in all publications are solely those of the individual author(s) and contributor(s) and not of MDPI and/or the editor(s). MDPI and/or the editor(s) disclaim responsibility for any injury to people or property resulting from any ideas, methods, instructions or products referred to in the content. |
© 2023 by the authors. Licensee MDPI, Basel, Switzerland. This article is an open access article distributed under the terms and conditions of the Creative Commons Attribution (CC BY) license (https://creativecommons.org/licenses/by/4.0/).