4.2. Descriptive Statistics
For the preliminary analysis, we performed a statistical evaluation of inputs and outputs. We applied basic descriptive measures, i.e., maximum, minimum, mean, median, lower quartile, upper quartile, standard deviation, coefficient of variation (VC) and coefficient of asymmetry (AC) (
Table 3).
In 2013, the average level of final energy consumption in households per capita (I1) was 40.60 kg of oil equivalent (KGOE). The highest I1 was noted in Germany (221.00 KGOE), while the lowest was in Estonia (2.90). The differentiation level among countries for the value of the I1 indicator was high (133.16%). The median was lower than the average, which meant an asymmetric distribution of this variable.
Twelve countries had values lower than 19.20 KGOE, and twelve of them had higher ones. I1 was positively skewed (2.27), indicating that, for the majority of countries, final energy consumption in households per capita was lower than the average.
In 2013, the highest value of the I2 variable was observed for Finland (951.00 KGOE) and the lowest for Portugal (252 KGOE). The values of the median and the mean were close to each other, indicating a relatively symmetrical distribution of this variable. This fact was also confirmed by the asymmetry coefficient close to zero (−0.27). In the case of the I2 variable, much lower differentiation was observed (31.37%).
A high level of differentiation was observed for the I3 variable (136.08). The lowest level of the I3 variable was observed in Latvia (4.40) and the highest in Germany (308.30). A positive asymmetry coefficient (2.29) meant that most countries had lower than average values of the I3 variable.
In 2013, the highest energy productivity, measured in chain-linked volumes (2010) in EUR per kg of oil equivalent and PPS per kg of oil equivalent (O1), was observed in Denmark (13.19) and the lowest in Bulgaria (2.28). The median and mean values were approximate for this variable. Half of the countries reached values lower than the median. The countries were more differentiated regarding the O2 variable, i.e., the real GDP per capita, measured in EUR per capita. The level of this variable differentiation amounted to 56.07%. In 2013, the highest GDP per capita was observed in Denmark (44,410.0) and the lowest in Bulgaria (5390.0). Half of the countries showed a value higher/lower than the median, i.e., lower than 16,895.0.
Similar characteristics of descriptive statistics are presented for the data received for 2020. The values of the basic descriptive statistics are presented in
Table 4.
In 2020, the level of input differentiation (I1–I3) was lower than in 2013. The highest differentiation was noted, similarly to in 2013, within the I3 input, then in the I1, and the lowest was in the case of the I2 variable. The countries in which the lowest and highest I1 input values were observed did not change, and these were, respectively, Estonia and Germany. Similarly to in 2013, also in 2020, the same countries with the lowest and highest inputs were noted in the case of I2 variable—these were Portugal and Finland, respectively. The high disproportions between the surveyed countries within the I3 input, i.e., primary energy consumption, were confirmed by the value of the variability coefficient (129.25%). The value of the variable for Germany was over 61 times higher than for Latvia. Three quarters of the surveyed countries reached values lower than the upper quartile, amounting to 51.15 KGOE.
The highest value of the O1 variable was observed in 2020 in Ireland, and the lowest, similarly to in 2013, was in Bulgaria. In 2020, the level of differentiation of this variable increased as compared to 2013 by 11.57 percentage points. Half of the countries reached lower/higher values than the median (6.61). In 2020, the highest GDP per capita among the surveyed countries was noted in Ireland, and the lowest, similarly to in 2013, was in Bulgaria. The level of differentiation of this variable increased compared to that in 2013.
4.3. CCR Model Results
The CCR model results related to inputs for the 2013 data are shown in
Table 5.
In 2013, five member states fully efficiently transformed inputs into outputs. These were Estonia, Ireland, Latvia, Portugal and Spain. High values of the efficiency coefficient of transforming inputs into outputs—close to one—were noted for Slovenia and Denmark, 99.36% and 94.59%, respectively. The average value of the indicator amounted to 71.45%, which means that the surveyed countries could acquire the same outputs at inputs lower by 28.55% on average. The value of the median was slightly below the average and amounted to 70.72%. The lowest efficiency indicators were noted for Poland and then for Hungary and Bulgaria. They amounted, respectively, to 28.80, 31.13 and 33.25. Low efficiency indicators were also found for other “new” member states. These were the Czech Republic (36.17) and Romania (39.64). For example, Poland, the weakest country in 2013 regarding energy efficiency, should base its technology of transforming inputs into outputs on the technologies implemented in Portugal (0.440) and Spain (0.14). The coefficient of variation amounted to 34.05%, indicating the average differentiation of the surveyed countries in terms of energy efficiency (
Table 6).
The optimal technology for Poland—the country with the lowest efficiency in 2013—based on the technology of the countries showing the highest relative efficiency is defined in
Table 7. This technology consists of 44% technology implemented in Portugal and 14% technology implemented in Spain. The countries participating in Poland-oriented optimal joint technology, i.e., Portugal and Spain, would have been able to achieve the results acquired by this country with significantly lower input, amounting to I1—16.9 KGOE, I2—171.9 KGOE and I3—23.3 KGOE.
The EU states transforming the inputs into results in a fully efficient way played a benchmark role for inefficient countries regarding this aspect (
Table 5). Estonia played a benchmark role for Slovenia—the country should follow the pattern of technology of transforming the inputs into outputs observed also for Ireland. It was Portugal and Ireland that most often played a benchmark role, respectively, 15 and 14 times. Latvia, though fully efficient, never played a benchmark role, while efficient Spain played a benchmark role five times. The ranking of countries regarding the 2013 efficiency indicator is shown in
Figure 2.
In 2020, the average efficiency of the 24 surveyed EU countries was lower than in 2013 and amounted to 54.23% (
Table 6). The effects achieved could be obtained by the surveyed countries with inputs lower by 45.77% on average. Bulgaria was characterised by the lowest efficiency in transforming the inputs into outputs (
Table 8). The value of the efficiency indicator for this country amounted to 19.91%. Low values of energy efficiency were also noted for Hungary and Poland, 21.48% and 23.50%, respectively. The only fully efficient country was Ireland (100%). The value of the median amounted to 51.38%, which means that half of the countries were characterised by lower/higher efficiency than the abovementioned value. The median value was close to the mean, which means a relatively symmetrical distribution of the efficiency values around the mean/median. The diversity of countries in terms of the efficiency ratio was higher in 2020 than in 2013 and amounted to 41.26%. Fully efficient Ireland served as a model as many as 23 times.
Figure 3 shows the ranking of the surveyed countries in terms of energy efficiency in 2020.
The optimal technology for Bulgaria—the country with the lowest efficiency in 2020—based on the model of technologies developed in the countries representing the highest relative efficiency is defined in
Table 9. It consists of 11% technology implemented in Ireland. This country participating in the optimal Bulgaria-oriented technology would be able to achieve the effects acquired by Bulgaria with significantly lower outlay, amounting to I1—1.199 KGOE, I2—69.19 KGOE and I3—1.441 KGOE.
The level of countries’ differentiation in terms of energy efficiency was measured by the coefficient of variation, which, in 2013, amounted to 34.05%. Its value indicates the average diversity of countries in terms of the efficiency of transforming inputs into outputs. In 2020, the value of the coefficient of variation measuring this diversity increased and amounted to 42.15%. It meant an increase in differences between countries in terms of energy efficiency by 8.1 percentage points. In 2013, five countries were fully efficient in converting inputs into outputs. These were: Estonia, Ireland, Latvia, Portugal and Spain. Among energy-efficient countries, there were both “old” and “new” member states. In 2020, the number of fully energy-efficient countries fell to one. This country was Ireland, representing the “old” member states. The above results allowed for the positive verification of both hypotheses. The disparities between the 24 countries surveyed in 2020 in terms of the efficiency of converting inputs into outputs had increased as compared to 2013. At the same time, the number of countries that fully efficiently transformed inputs into outputs had decreased from five to one.
The presented results are in line with the literature. According to Makridou et al. [
71], Luxembourg, Ireland, the Netherlands, the United Kingdom and Cyprus achieved the highest energy efficiency scores, whereas Hungary, the Czech Republic, Poland, Bulgaria and Romania had the lowest scores. Their results confirmed that countries with more service-oriented economies are more energy efficient than more industrial-oriented economies. Nevertheless, they proved that, in the period of the analysis (2000–2009), most of the low-performing countries (except for Romania) achieved considerable energy efficiency improvements. The assessment of the energy efficiency of European countries in the years 1995–2007 conducted by Ceylan and Gunay [
36] showed that the energy efficiency of all countries improved. The countries with the highest energy efficiency scores in almost all years were Greece, Turkey, Malta, Iceland, the United Kingdom and Luxemburg, and the countries with the lowest efficiency scores were Finland, Belgium, Estonia, Slovenia and Romania. According to their research, most of the EU-15 countries, such as Austria, Belgium, France, Germany, Spain, Sweden and the United Kingdom, continuously increased their efficiency scores. The energy inefficiency of most of the “new” EU member states, e.g., the Czech Republic, Romania and Bulgaria, was confirmed by Simeonovski et al. [
15].
4.4. Discussion
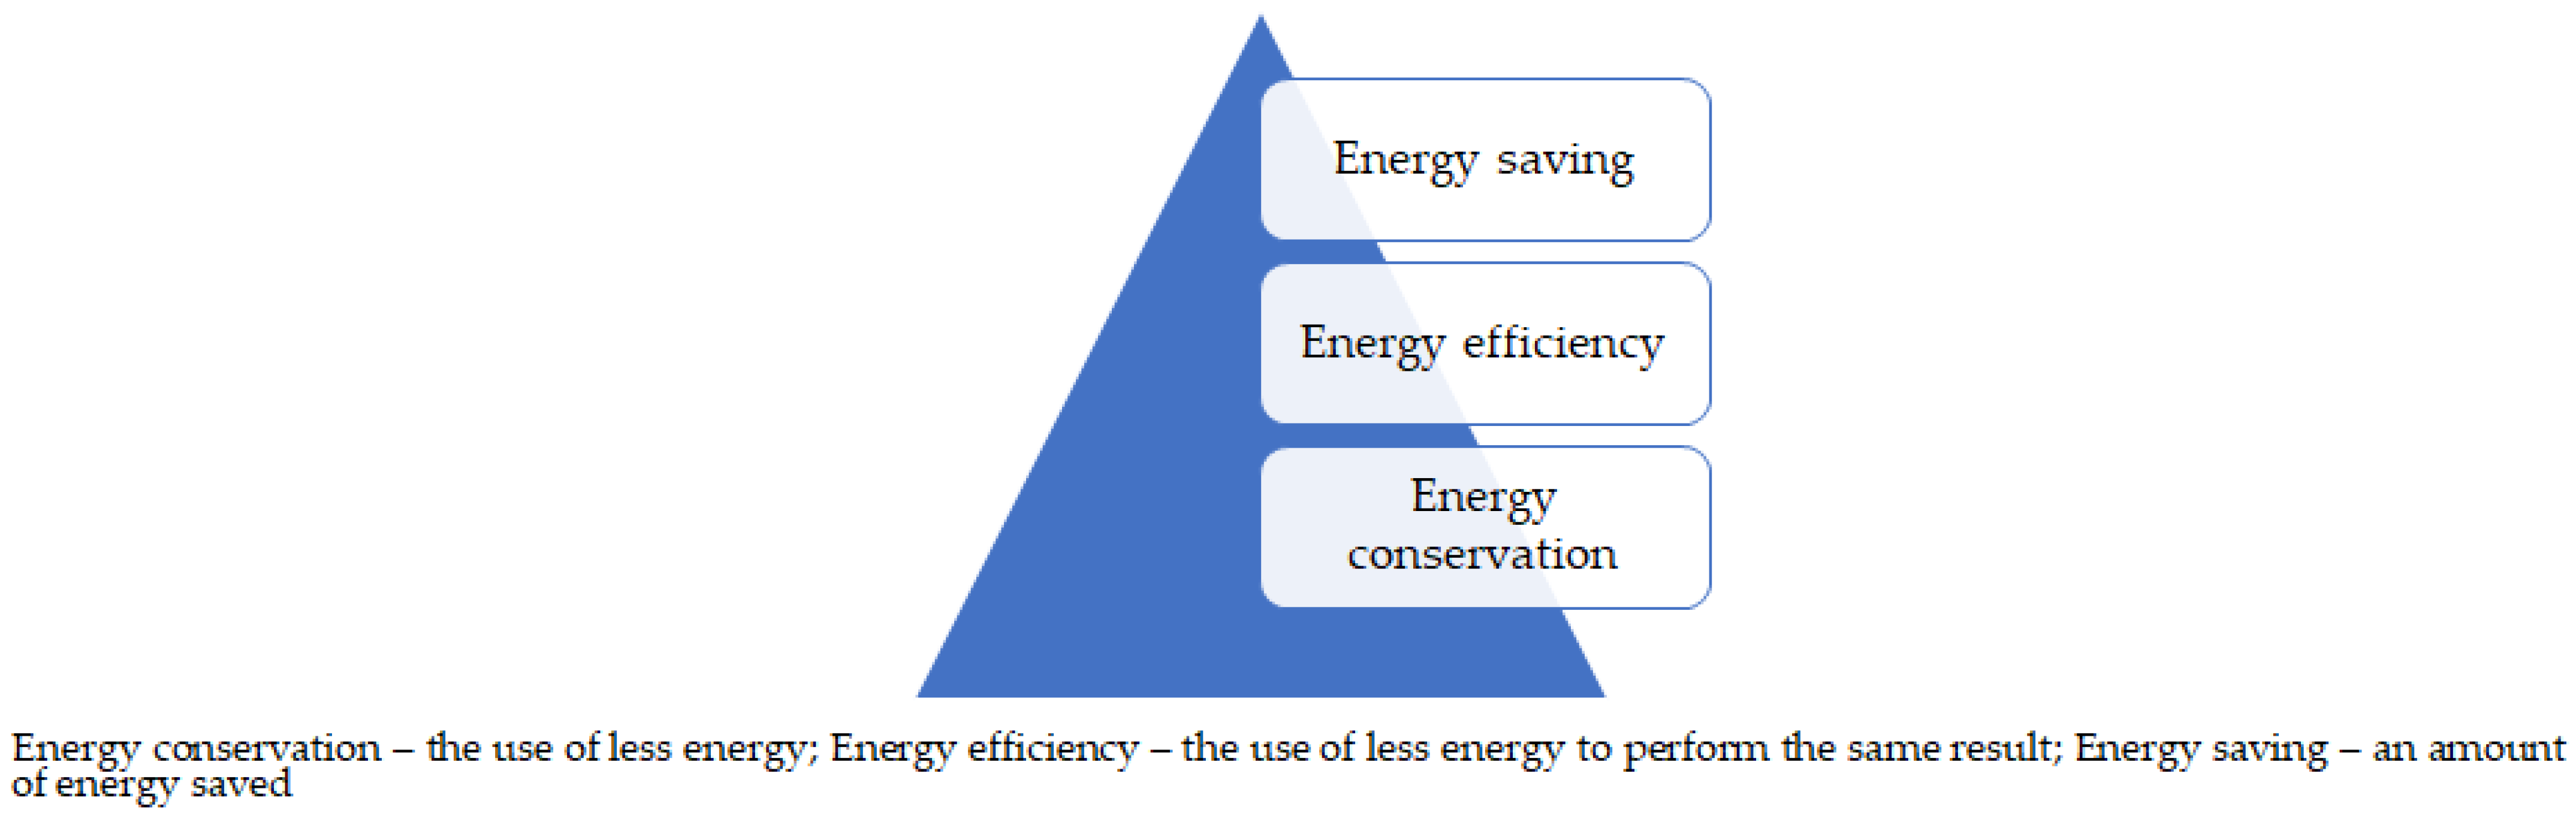
The research conducted by the authors made it possible to obtain answers to the research questions posed in the study. The theoretical and empirical analysis rendered it possible to answer the research questions posed in the introduction. A review of the literature on the subject led to the conclusion that there is no single, universally accepted definition of energy efficiency. Depending on the approach, processes taking place in individual sectors and the assumptions adopted, different proposals and approaches are presented. Yet, despite the limitations resulting from the analysis, two dominant groups of approaches were distinguished. The first proposal is to define energy efficiency as a state measured by the relationship between the results (benefits) and the energy input (costs incurred). According to the authors of this paper, increasing energy efficiency is a dynamic process that should take into account both macroeconomic and microeconomic approaches. This process is related to the management of energy consumption, which, in the first place, means limiting its growth and then satisfying the same level of energy needs of the entities, using less energy.
The second prevailing theoretical approach narrows the understanding of energy efficiency to energy savings. In the authors’ opinion, this approach is too narrow and limits the scope of analysis. Energy saving is one of the components of energy efficiency. Another important element may be a change in the behaviour of energy consumers or the use of new technologies to produce more energy-efficient goods. Bearing in mind the above, the definition of energy efficiency as a process of managing and limiting the growth of energy consumption seems to be the most accurate. Activities defined as energy efficient consist of providing a higher level of service with the same amount of energy or the same level of service with less energy.
In turn, the results of the empirical analysis made it possible to answer further research questions. Ireland was a fully efficient country within the meaning of the DEA method in both 2013 and 2020. In 2013, Ireland acted as a benchmark 14 times, i.e., the countries that were not fully effective in converting inputs into outputs could improve their efficiency in the best way by following the example of the technology used by Ireland. This country also served as a benchmark in 2020 as many as 23 times. In Ireland, numerous successful programmes have been implemented to support energy efficiency, energy saving and the production of energy from renewable sources. Ireland is a country that economically uses diversified energy, and, consequently, it has one of the highest GDPs per capita in the EU [
72]. Ireland has recently developed a large set of policies oriented toward increasing energy efficiency and renewable energy production [
73].
On the other hand, Estonia was a country which deteriorated in terms of energy efficiency. From a fully efficient country in 2020, this country fell to the second position in the ranking, with an efficiency ratio of 95.96%. Estonia is one of the “new” member states, and, among them, it should be considered a leader in terms of energy efficiency. It is one of the most independent EU countries in terms of energy, including in its role as a net exporter of energy.
Latvia, occupying a high position in the energy efficiency ranking in 2013 and representing the “new” member states, fell to seventh position in 2020, with a result of 69.60%. However, it was ranked in 2020 ahead of the countries with high GDPs per capita, such as Denmark and Sweden.
The countries of the Iberian Peninsula—Spain and Portugal—fully efficient in 2013, in the 2020 ranking were in the third and fifth positions, respectively. Both countries belong to the “old” EU, and they build their energy independence on the basis of both conventional energy sources—especially in Spain—and unconventional ones.
Apart from Estonia, Ireland, Latvia, Portugal and Spain, the remaining 19 countries were not fully energy efficient in 2013. Among them, the closest to full efficiency was Slovenia, with a score of 99.36%, ahead of Denmark, the Netherlands and Sweden. The subsequent ranking positions, from 10 to 19, were occupied by countries with comparable performance indicators. Worse results were recorded in 2013 for Romania, the Czech Republic, Bulgaria and Hungary, with the worst results in Poland. What is important is that these countries represent the “new” EU countries, for which improving energy efficiency may prove to be a challenge.
Among the “new” member states, Slovakia deteriorated in terms of energy efficiency. It fell in the ranking from 19th position in 2013, with a result of 55.86%, to 20th position, with a result of 30.24%. Slovakia, together with Romania, the Czech Republic, Poland, Hungary and Bulgaria, achieved the lowest values of the energy efficiency index, occupying the lowest positions in both the 2020 and 2013 rankings. The problem of countries occupying low-ranking positions lies in the low efficiency of converting inputs into outputs. These countries can improve their efficiency by modeling their technology on benchmark countries.
The conducted research allowed us to verify the research hypotheses put forward in the literature review. The level of countries’ differentiation in terms of energy efficiency was measured by the coefficient of variation, which, in 2013, amounted to 34.05%. Its value indicates the average diversity of countries in terms of the efficiency of transforming inputs into outputs. In 2020, the value of the coefficient of variation measuring this diversity had increased and amounted to 42.15%. It means there was an increase in differences between countries in terms of energy efficiency of 8.1 percentage points. In 2013, five countries were fully efficient in converting inputs into outputs. These were: Estonia, Ireland, Latvia, Portugal and Spain. Among energy-efficient countries, there were both “old” and “new” member states. In 2020, the number of fully energy-efficient countries fell to one. This country was Ireland, representing the “old” member states.
To sum up, the above results allowed for positive verification of both hypotheses. The disparities between the 24 countries surveyed in 2020 in terms of the efficiency of converting inputs into outputs had increased as compared to those in 2013. At the same time, the number of countries that fully efficiently transformed inputs into outputs had decreased from five to one.
The article had its limitations, which included the selection of the research method. DEA has its advantages and disadvantages. It is an approximate method which allows for estimation of the efficiency but not for its precise measuring. It provides information on the relative efficiency, i.e., the efficiency of the object compared with other objects. For this reason, each change in the frame of reference affects the assessment of the efficiency of a given object. As an approximate method, it can support the development and monitoring of economic policies or the processes of solving extensive, even global problems, such as global warming or climate change [
74]. Another limitation consisted of the selection of the research sample. The survey covered the EU countries based on the data availability, standardised indicators and the possibility of comparisons. However, we excluded three member states (Luxembourg, Malta and Cyprus) from the studies as they could have disturbed the research results.


