Article

Responses of Vegetation, Soil, and Microbes and Carbon and Nitrogen Pools to Semiarid Grassland Land-Use Patterns in Duolun, Inner Mongolia, China

1
State Key Laboratory of Environmental Criteria and Risk Assessment, Chinese Research Academy of Environmental Sciences, Beijing 100012, China
2
Chinese Research Academy of Environmental Sciences, Beijing 100012, China
*
Author to whom correspondence should be addressed.
Sustainability 2023, 15(4), 3434; https://doi.org/10.3390/su15043434
Submission received: 2 December 2022 / Revised: 19 January 2023 / Accepted: 7 February 2023 / Published: 13 February 2023
(This article belongs to the Special Issue BRICS Soil Management for Sustainable Agriculture)

Abstract

:
Previous studies have observed that increased precipitation positively affects primary production in semiarid grasslands in Inner Mongolia, while soil carbon (C) and nitrogen (N) strongly influence how ecosystems respond to precipitation as well as anthropogenic disturbances under different management strategies. Therefore, in this study, we investigated the storage of organic C and N in four grassland sites with similar flora and landforms but with different grazing intensities to characterize how the storage and concentrations of C and N respond to relief from grazing pressure and precipitation. The concentrations of soil organic carbon (SOC), soil total nitrogen (STN), microbial biomass carbon (MBC), and microbial biomass nitrogen (MBN), as well as the contents of soil bacteria and fungi in the 0–50 cm soil layers, were measured. The results showed that SOC, STN, MBC, and MBN storage varied greatly among the four grassland sites (p < 0.05), with all decreasing significantly with grassland degradation and increasing greatly with the exclusion of grazing, i.e., the establishment of natural grassland (NG). More than 90% of C and 95% of N stored in the soil were lost due to heavy grazing, but the losses were smaller in other nutrient pools (including the aboveground biomass, litter, and roots). Interestingly, the proportion of the particle size fractions (clay, silt, and sand) had a stronger effect on limiting the soil and microbial nutrient pools compared to precipitation. The limited range of C and N storage found in these grassland soils indicated that enclosed fencing was a valuable management tool with a high potential to sequester C in the top meter of the soil, showing a stronger effect than precipitation. This study provides a theoretical basis for improving grassland recovery in semiarid areas that have been heavily grazed.

1. Introduction

About 40 percent of the global land surface is covered by grasslands, most of which are drylands [1] and sustain the main livestock production systems [2]. Grassland ecosystems cover an area of 52.5 million km2, accounting for 40.5% of the Earth’s land surface, excluding Greenland and Antarctica [3]. Grassland ecosystem is the largest ecosystem in China, accounting for about 40% of the land area. They also store 34% of the terrestrial carbon stock [3], with 90% of their carbon stored below ground as root biomass and soil organic carbon (SOC), thus playing a vital role in soil carbon sequestration. In some areas, grasslands serve as important global C sinks. The achievable SOC sequestration potential in global grasslands is 2.3 to 7.3 billion tons of carbon dioxide equivalents per year (CO2e year−1) for biodiversity restoration,148 to 699 megatons of CO2e year−1 for improved grazing management, and 147 megatons of CO2e year−1 for sown legumes in pasturelands. The grasslands in the tropics are estimated to take up about 0.5 picograms (Pg) of C annually, which is influenced by the baseline soil organic carbon (SOC) level as well as annual precipitation [4,5,6]. Moreover, grassland soils store 200–300 Pg carbon, which significantly influences the global carbon cycle [5]. Worldwide, grasslands have undergone severe decreases in biodiversity and ecosystem function, leading to reductions in SOC storage [1].
The significant effects of land use and ecosystem strategies on the storage of C in grasslands have clearly been demonstrated over the past few decades [7,8,9,10,11,12]. Livestock grazing is the most common use of grasslands worldwide. Grasslands are managed to improve forage quantity and quality, thereby increasing livestock production and/or SOC storage [3,13]. In livestock-dominated systems, grazing intensity and rest periods are strongly controlled pathways. Continuous livestock grazing reduces plant cover, diversity, and productivity, and thus root inputs and plant- and microbial-mediated SOC formation while stimulating the losses through microbial turnover and erosion caused by increased compaction and reduced cover [13]. Eze et al. demonstrated that livestock grazing, on average, decreases SOC stock by 15% across five continents, with the greatest reduction (−22.4%) in SOC stock in the tropics and the least reduction (−4.5%) in temperate grasslands [14]. At the global scale, light grazing (e.g., seasonal and rotational grazing) shows the least negative effects or even promotes soil carbon storage, whereas moderate and heavy (continuous) grazing consistently reduces soil carbon stocks [5,15,16]. The pathways of soil carbon and nitrogen loss in China mainly come from hydrologically driven runoff transfer and soil erosion transport. Nitrogen is also vital for plant productivity and terrestrial ecosystem stability. Due to the close relationship between soil C and N cycles, grave concerns have arisen regarding the effects of changes in land use on the concentrations of C and N in soil [17]. For instance, in northern China, the severe degradation and desertification of temperate grasslands were primarily due to rapid livestock expansion [18]. However, improvements in soil nutrients and water availability can help plants recover from disturbances, facilitating fast-growing plants to regrow and promoting plant coverage and productivity in ecosystems [19]. Obviously, nitrogen and water availability have important impacts on the net primary productivity (NPP) of grasslands [20], especially in semiarid regions where annual precipitation inputs are significantly less than evaporation [21]. With increases in precipitation, N availability can be enhanced, which can be accompanied by increases in absorption, reallocation, and the use efficiency of N by plants [22]. Soil N availability can affect the composition of microbial communities, influencing the richness of both soil bacteria and fungi.
Despite their importance, information on the concentration potentials of C and N relative to stable or mature grassland ecosystems is inadequate. Knowledge of the stores and concentration potentials of C and N would help improve our understanding of how ecosystems respond to anthropogenic disturbances under different management strategies. Therefore, we conducted a study on organic C and N concentrations in four sites with similar flora and landforms to investigate how grazing exclusion and precipitation affect the stores and concentration potentials of C and N. This study will provide a theoretical basis for grassland recovery in semiarid, grazing-disturbed areas.

2. Materials and Methods

2.1. Study Site and Experimental Design

The study site (42 permanently designed grid areas, 1334 m. Above sea level) was located in the south of Inner Mongolia, northern China. This area has a semiarid climate with a mean annual precipitation of 379.4 mm and a mean annual temperature of 2.1 °C. Specifically, the mean annual precipitation from January to June is 118.8 mm (DS, dry season) and from January to August is 306.7 mm (WS, wet season), and the mean annual temperature from January to June is 0.1 °C and from January to August is 8.8 °C. The soil pH of the experimental site ranges from 7.1 to 7.4. The soil is of chestnut type (Table 1), i.e., Calcic Kastanozems, which is equivalent to Calcic-orthic Aridisol, according to the US soil classification system. The vegetation of the region predominantly comprises grassland plants, i.e., S. grandis, A. michnoi, C. korshinskyi, and L. chinensis (Table 1). The steppe in this region has been gravely degraded due to overgrazing during the past five decades. In this study, four experimental sites with different levels of degradation were selected: severe degradation (SD), moderate degradation (MD), light degradation (LD), and natural grassland (NG) (Table 1). Site SD had long been exposed to heavy grazing, with an estimated 90% of the aboveground biomass consumed by livestock each year; the grasslands appear heavily degraded due to their extremely sparse vegetation coverage (< 10%). Site MD had also been exposed to heavy grazing for a long period, with an estimated 75% of the aboveground biomass consumed by livestock each year, whereas the grasslands were moderately degraded with existing vegetation coverage of 10–25%. Site LD had been subjected to long-term free grazing, with an estimated 65% of the aboveground biomass consumed by livestock each year and an existing vegetation coverage of 25–30%. These aeolian plans were Spiraea salicilfolia and Salix gordejevii. Coexisting species were Leymus chinensis, Agropyron cristatum, etc. Site NG is a natural grassland that has been protected since the year 2000 with fencing but was a free-grazing grassland of 40 hectares before the local government initiated a grassland protection program [23]. The NG site was dominated by needlegrass (Stipa krylovii), wheatgrass (Agropyron cristatum), and prairie sagewort (Artemisia frigida). Each plot covered an area of 1 hectare. Because there was only one plot per grazing regime, this experimental design suffered from pseudo-replication issues, but this problem is quite common in this type of study. Nevertheless, it is likely that the differences in SOC and STN among the four plots in this study were largely due to grazing intensity and exclusion duration because the four experimental plots shared similarities (floristically and topographically) and were all located on the same upper basalt platform (Table 1).

2.2. Field Sampling and laboratory Analysis

In early April 2017, the four representative plots (i.e., SD, MD, LD, and NG) were selected to measure the above and belowground SOC and STN contents in plants, litter, and roots. The surveys were conducted in mid-June (DS) and Mid-August (WS) of 2017 in Inner Mongolia and were used as the research objects. In each plot, 5 sampling quadrats (each 1 m × 1 m) were set up at 10 m intervals along a randomly selected transect. Aboveground samples of plants and litter were then collected. Roots were sampled using a soil corer (diameter: 7 cm), with 5 sampling points for each site. Similarly, soils were sampled with a soil sampler (diameter: 4 cm), and samples were taken from five soil layers and roots: 0–10 cm, 10–20 cm, 20–30 cm, 30–40 cm, 40–50 cm soil depths were sampled, several cores per depth and composited by 5 samplings., respectively.

2.3. Chemical Analysis

The pH of the soil was analyzed at different depths in a soil–water suspension (soil: water 1:5, w/v) with a PHS-3S pH meter (Sartorius, Germany). Soil aggregates were fractionated using a laser particle size analyzer. For particle size fractions, 50 g soil (<2 mm) was mixed in 250 ml distilled water with a KS-600 probe-type Ultrasonic Cell Disrupter System; then, the different particle size fractions were separated following Morra et al. [24]. The contents (%) of organic C in the samples were determined using a modified Mebius method. The concentration of SOC was determined by chemical oxidation with a K2Cr2O7 solution. Then, 0.2 g aliquots of each air-dried soil sample were weighed into separate test tubes, with analytical replicates for each sample, finally obtaining 5 subsamples from each treatment plot. Then, 10 mL reaction solution containing 0.032 Mol Ag2SO4, 0.06667 Mol K2Cr2O7, and 9.39 Mol H2SO4 was added to each tube before placing it in a hot (~200 3PO4) bath for 5 min. Three tubes containing 0.5 g SiO2 were taken as blanks. The amount of K2Cr2O7 consumed by SOC oxidation was measured by titrating the remaining K2Cr2O7 in the test tubes after digestion. The total N (%) of the plant, litter, root, and soil was determined with the modist tubes after digestion [25]. Then, duplicate 0.5 g aliquots of air-dried and finely ground soil samples were taken from each sample. These were then digested with 18.76 Mol H2SO4 for 6 h under progressively increasing temperatures (from 150 °C to 270 °C, 270 °C, and 380 °C) and then automatically distilled in a Kjeldahl apparatus, where evolved NH3 was adsorbed by H3BO3 (20 g L−1). The yield of NH3 was determined by titration with diluted H2SO4 (0.02 Mol) and converted into the total amount of N in soil. Soil microbial biomass (MBC and MBN) was determined using the fumigation-extraction method [26]. In this study, an innovative method using a novel soil microbial fumigation device and an improved fumigation method (ZL 2020 3 0785811.3) was employed to extract microbial biomass. Traditionally, during the process of microbial fumigation, glass drying dishes are sealed with paraffin wax, which not only creates a poor seal but also makes it difficult to maintain constant culture temperature. Therefore, a vacuum pump was employed here to maintain a certain negative pressure in the culture environment. However, it was challenging to maintain the same negative pressure in all the samples of a batch, thus resulting in variability among samples during fumigation.
Furthermore, removing chloroform from the container after fumigation is not ideal. Therefore, the procedure of the patented device improved on the defects of the prior equipment. In the new procedure, one subsample of each soil sample (10 g) was fumigated with ethanol-free chloroform (CHCl3) for 24 h at 25 °C. The other subsample was kept at the same conditions but was not fumigated. After the CHCl3 was fully removed, organic C from the fumigated and unfumigated soil samples was extracted with 0.5 Mol K2SO4 using a soil-to-extractant ratio of 1:4 (w/v) for 1 h while being shaken at 150 rpm. Then, the extractable organic C was analyzed by a TOC analyzer (High TOC, Elementar). The MBC and MBN were measured as the difference between the fumigated and nonfumigated samples and normalized to the weight of the soil fraction. The PLFAs were extracted, fractionated, and quantified as described by Bossio and Scow [27]. Frozen soil aggregate samples (equivalent to 8 g dry mass of soil) were extracted using a mixture of methanol, chloroform (CHCl3), and phosphate buffer with a volumetric ratio of (2:1:0.8) for 2 h. The sediment was extracted for another 30 min. After the extractions, the supernatants were transferred to a separation funnel and let rest overnight. After the separation, the CHCl3 layer was produced and then dried under N2. After successive elutions with CHCl3, acetone, and methanol in silica-bonded phase columns, the polar lipids were separated from the neutral lipids and glucolipids (Supelco Inc., Bellefonte, PA). Using a mild alkali methanolysis, polar lipids were converted into fatty acid methyl esters. The extractants were then redissolved in 300 μL hexane containing methyl nonadecanoate fatty acid as an internal standard. Samples were analyzed using an Agilent 6850 gas chromatograph coupled with a microbial identification system (Microbial ID. Inc., Newark, DE, USA). For bacteria, i14:0, i15:0, a15:0, i16:0, i17:0, 14:1ω5c, 16:1ω7c, cy17:0, 17:1ω6c, 17:1ω8c, 18:1ω7c, cy19:0, 16:1 2OH, and a17:0 were used as biomarkers, while for fungi, 18:1ω9c, 18:2ω6c, 18:3ω6, 16:1ω5, 10me16:0, 10me17:0, and 10me18:0 PLFAs were used as biomarkers [21,28,29].

2.4. Calculations

The SOC storage and STN storage (Mg ha−1) in the different soil layer (0–50 cm) was calculated by the following equation:
SOC/STN storage = SOC/STN concentration × BD × H × 10, where BD is the soil bulk density (g cm−3), and H is the depth of the soil layer (0.1 m).
The MBC storage and MBN storage (g M−2) in the different soil layer (0–50 cm) was calculated by the following equation:
BMBC = EC/KEC, where BMBC is the soil Microbial total organic carbon mass fraction (mg kg−1), and EC is the difference between the amount of organic carbon extracted from fumigated soil samples and that from unfumigated soil samples; KEC is the proportion of microbial biomass carbon extracted from fumigated samples, the value is 0.45.
BMBN = EN/KEN, where BMBN is the soil Microbial total nitrogen mass fraction (mg kg−1), and EC is the difference between the amount of nitrogen extracted from fumigated soil samples and that from unfumigated soil samples; KEC is the proportion of microbial biomass nitrogen extracted from fumigated samples, the value is 0.45.
MBC/MBN storage = BMBC/BMBN concentration × BD × H × 10, where BD is the soil bulk density (g cm−3), and H is the depth of the soil layer (0.1 m).

2.5. Statistical Analysis

All data were expressed as means ± SE. To determine the SOC and STN concentration potentials in the grassland. Analysis of variance (three-way ANOVA) was used to assess the effect of land-use change on SOC and STN concentrations and microbiological differences. All statistical analyses were conducted with the R program (ver. 3.4.1) and Sigmaplot. The meteorological data were sourced from the China Meteorological Data Network (http://www.worldclim.org, accessed on 12 July 2022).

3. Results

3.1. C and N Pool Variability

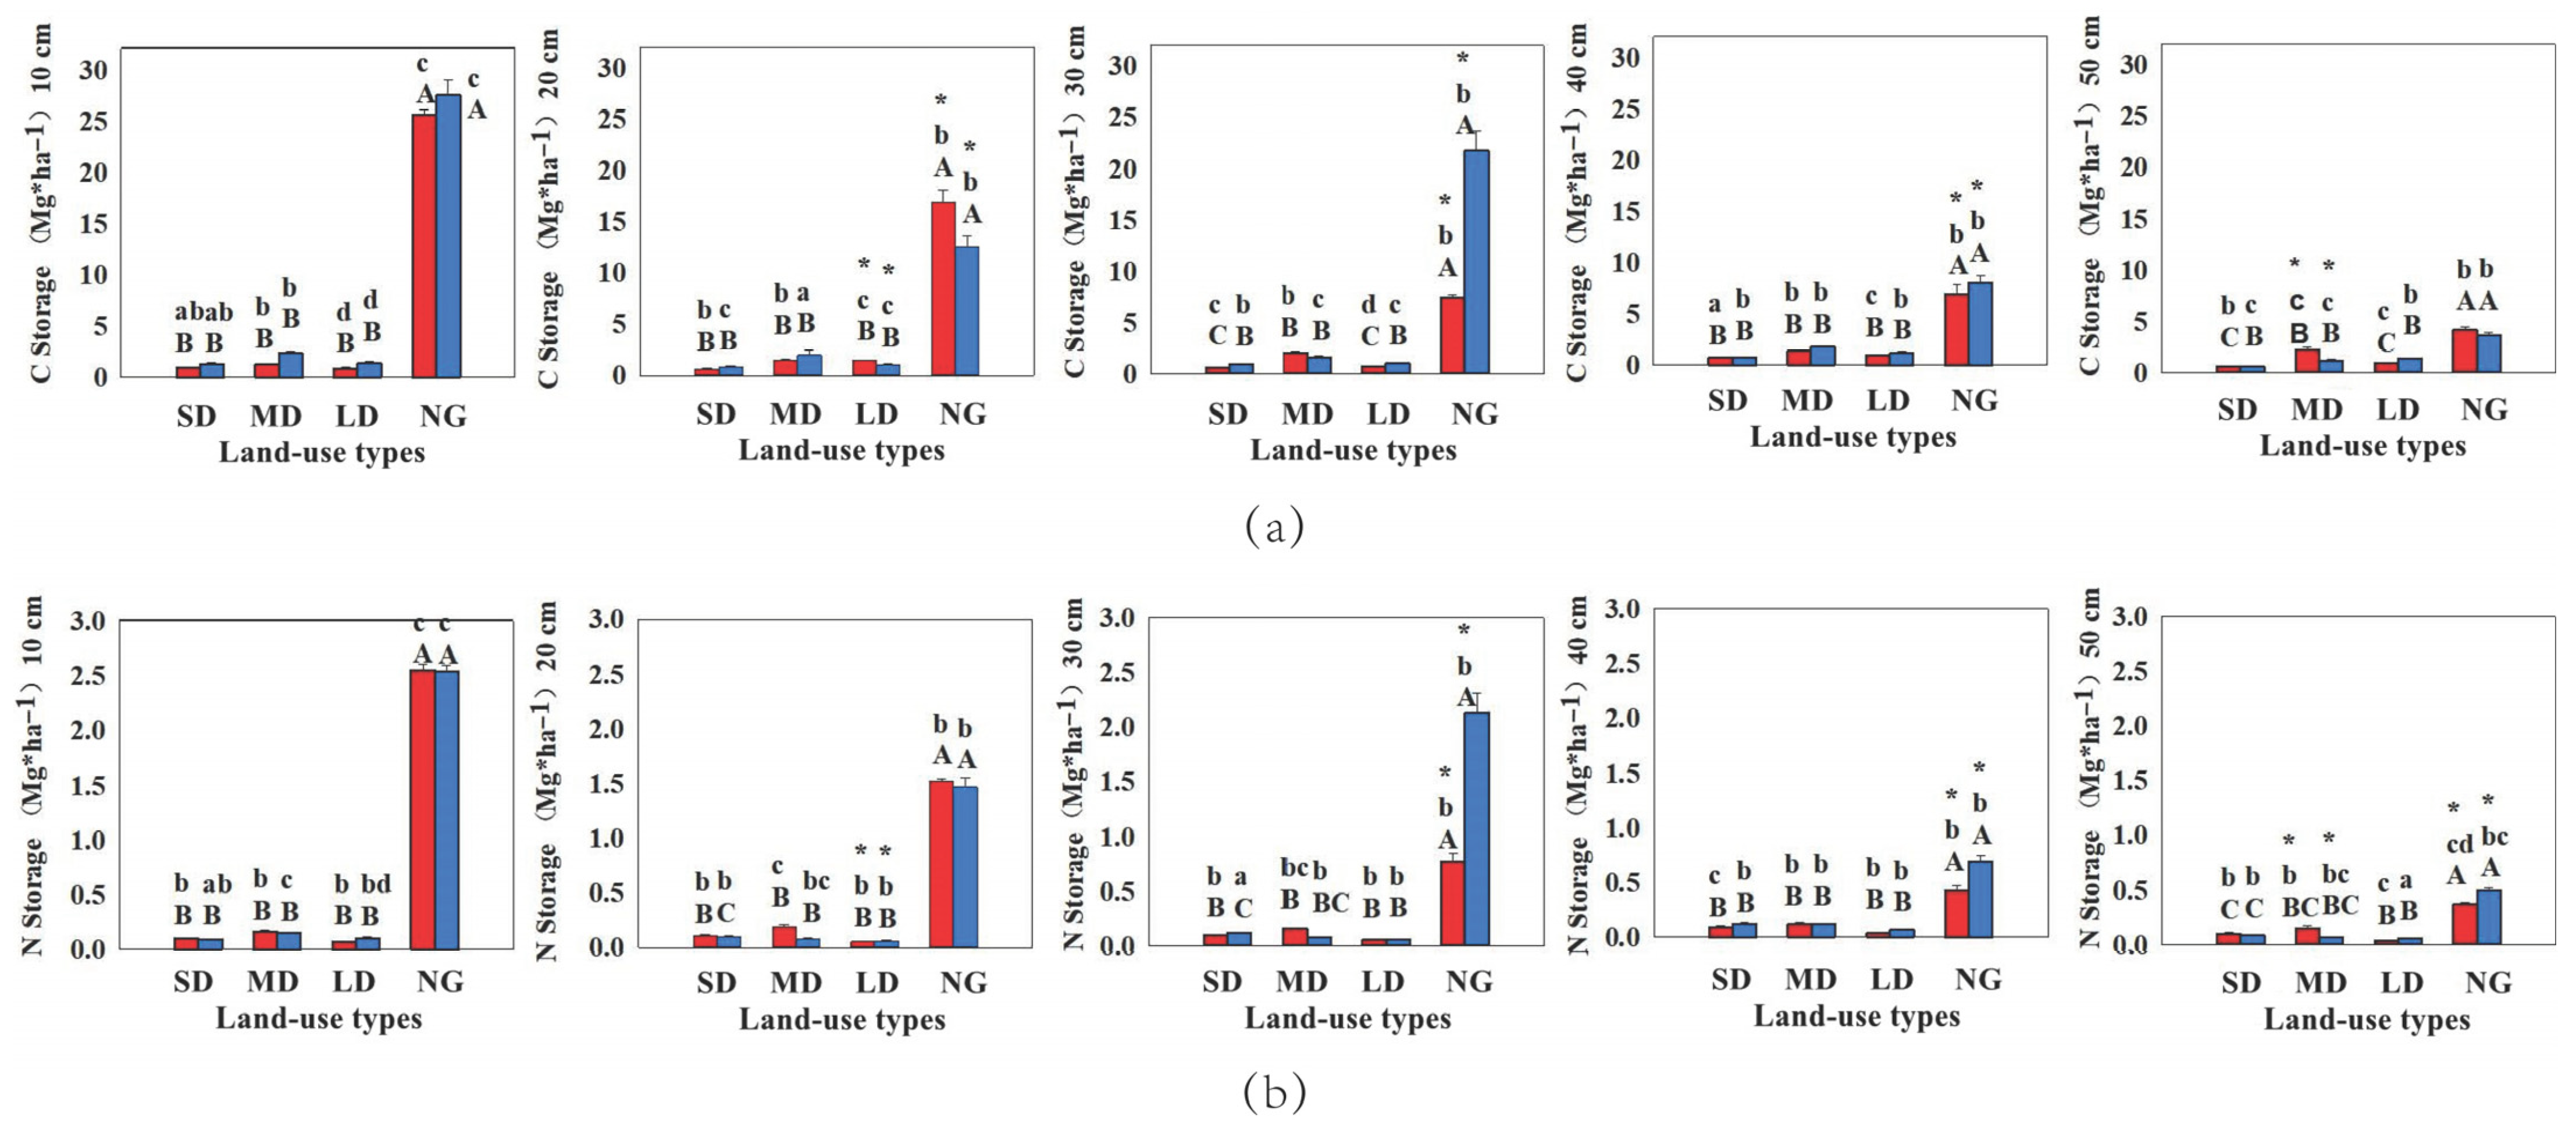
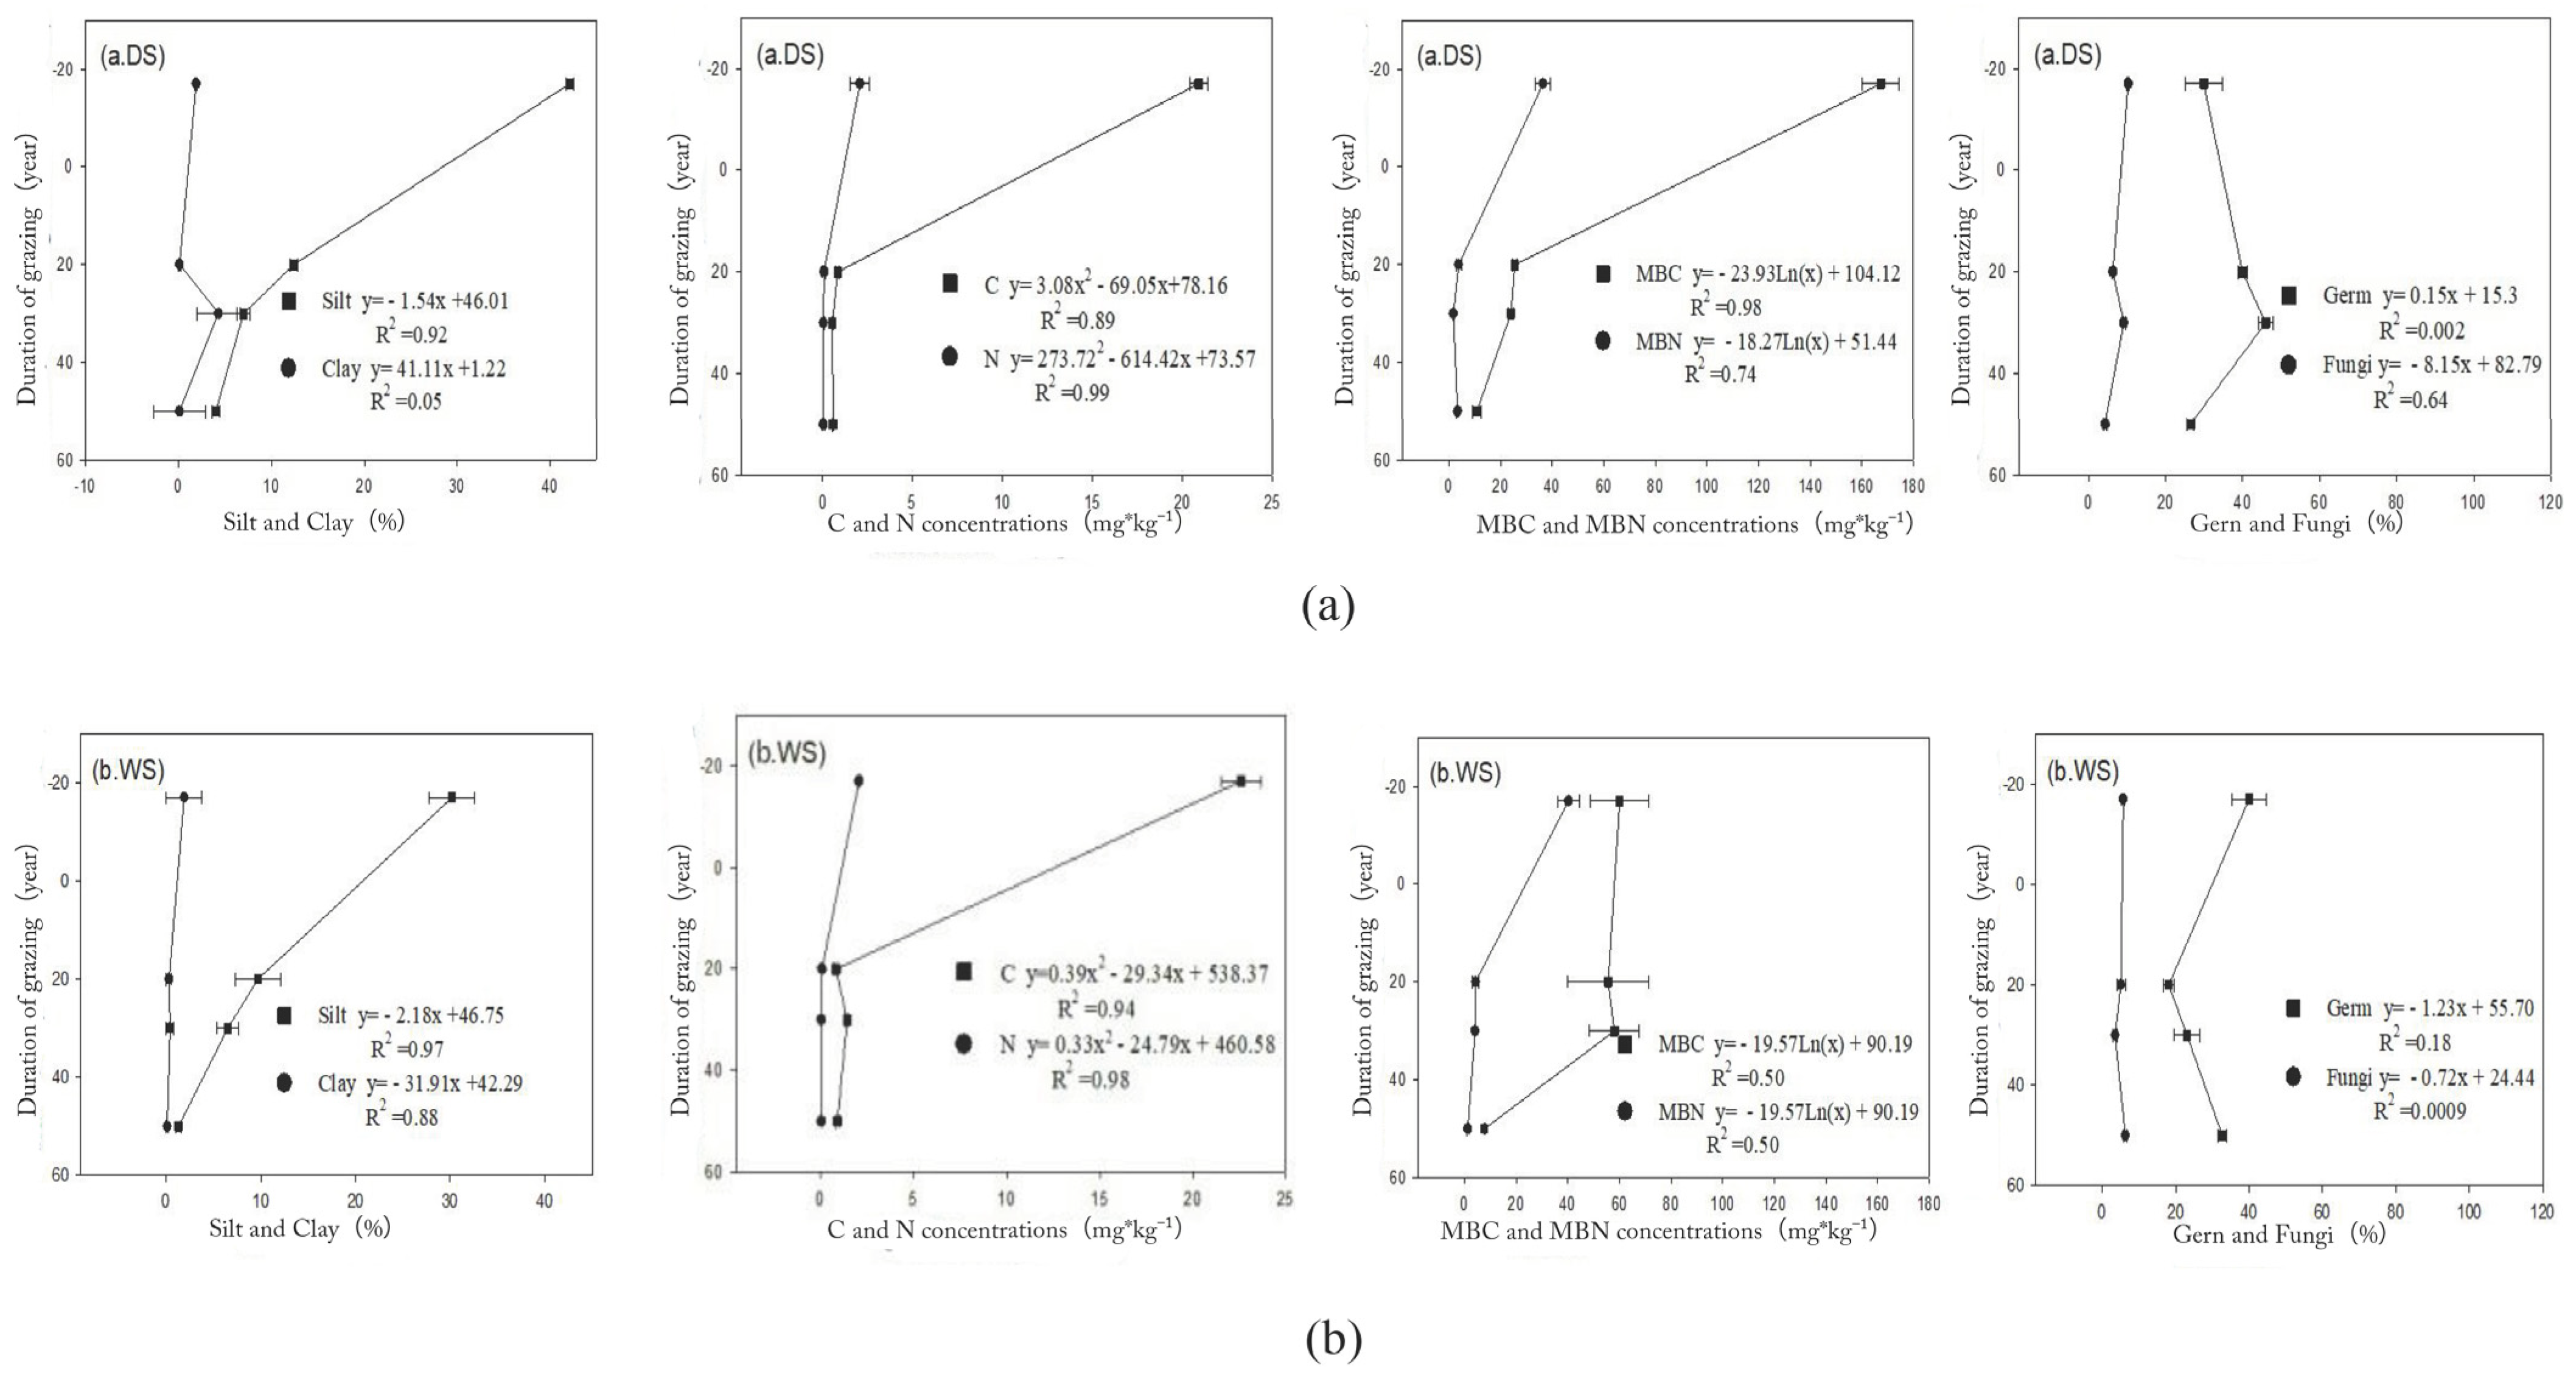
3.1.1. SOC and STN Pools

SOC storage exhibited a greater difference among the four sites (p < 0.01), ranging from 0.6 Mg C ha−1 in SD to 27.5 Mg C ha−1 in NG. Similarly, STN storage differed remarkably among the four sites (p < 0.01), ranging from 0.1 Mg N ha−1 in MD to 2.6 Mg N ha−1 in NG (Figure 1). SOC storage showed significant decreases with grassland degradation and increased significantly with the establishment of NG. SOC storage in soil was much higher in the 10 cm, 20 cm, and 30 cm soil layers than in the other soil layers (Figure 1a), while STN storage in soil was much higher in the 0–10 cm and 10–20 cm soil layers than in the other layers (Figure 1b).
The storages of SOC and STN in MD were less than 1.3 Mg C ha−1 and 0.2 Mg C ha−1, respectively (Figure 1). The storages of SOC and STN in LD were less than 1.5 Mg C ha−1 and 0.1 Mg C ha−1, respectively (Figure 1).
When compared to SD, SOC and STN storage in the 10 cm layer in NG was 96.3% and 96.1% higher, respectively (p < 0.05).

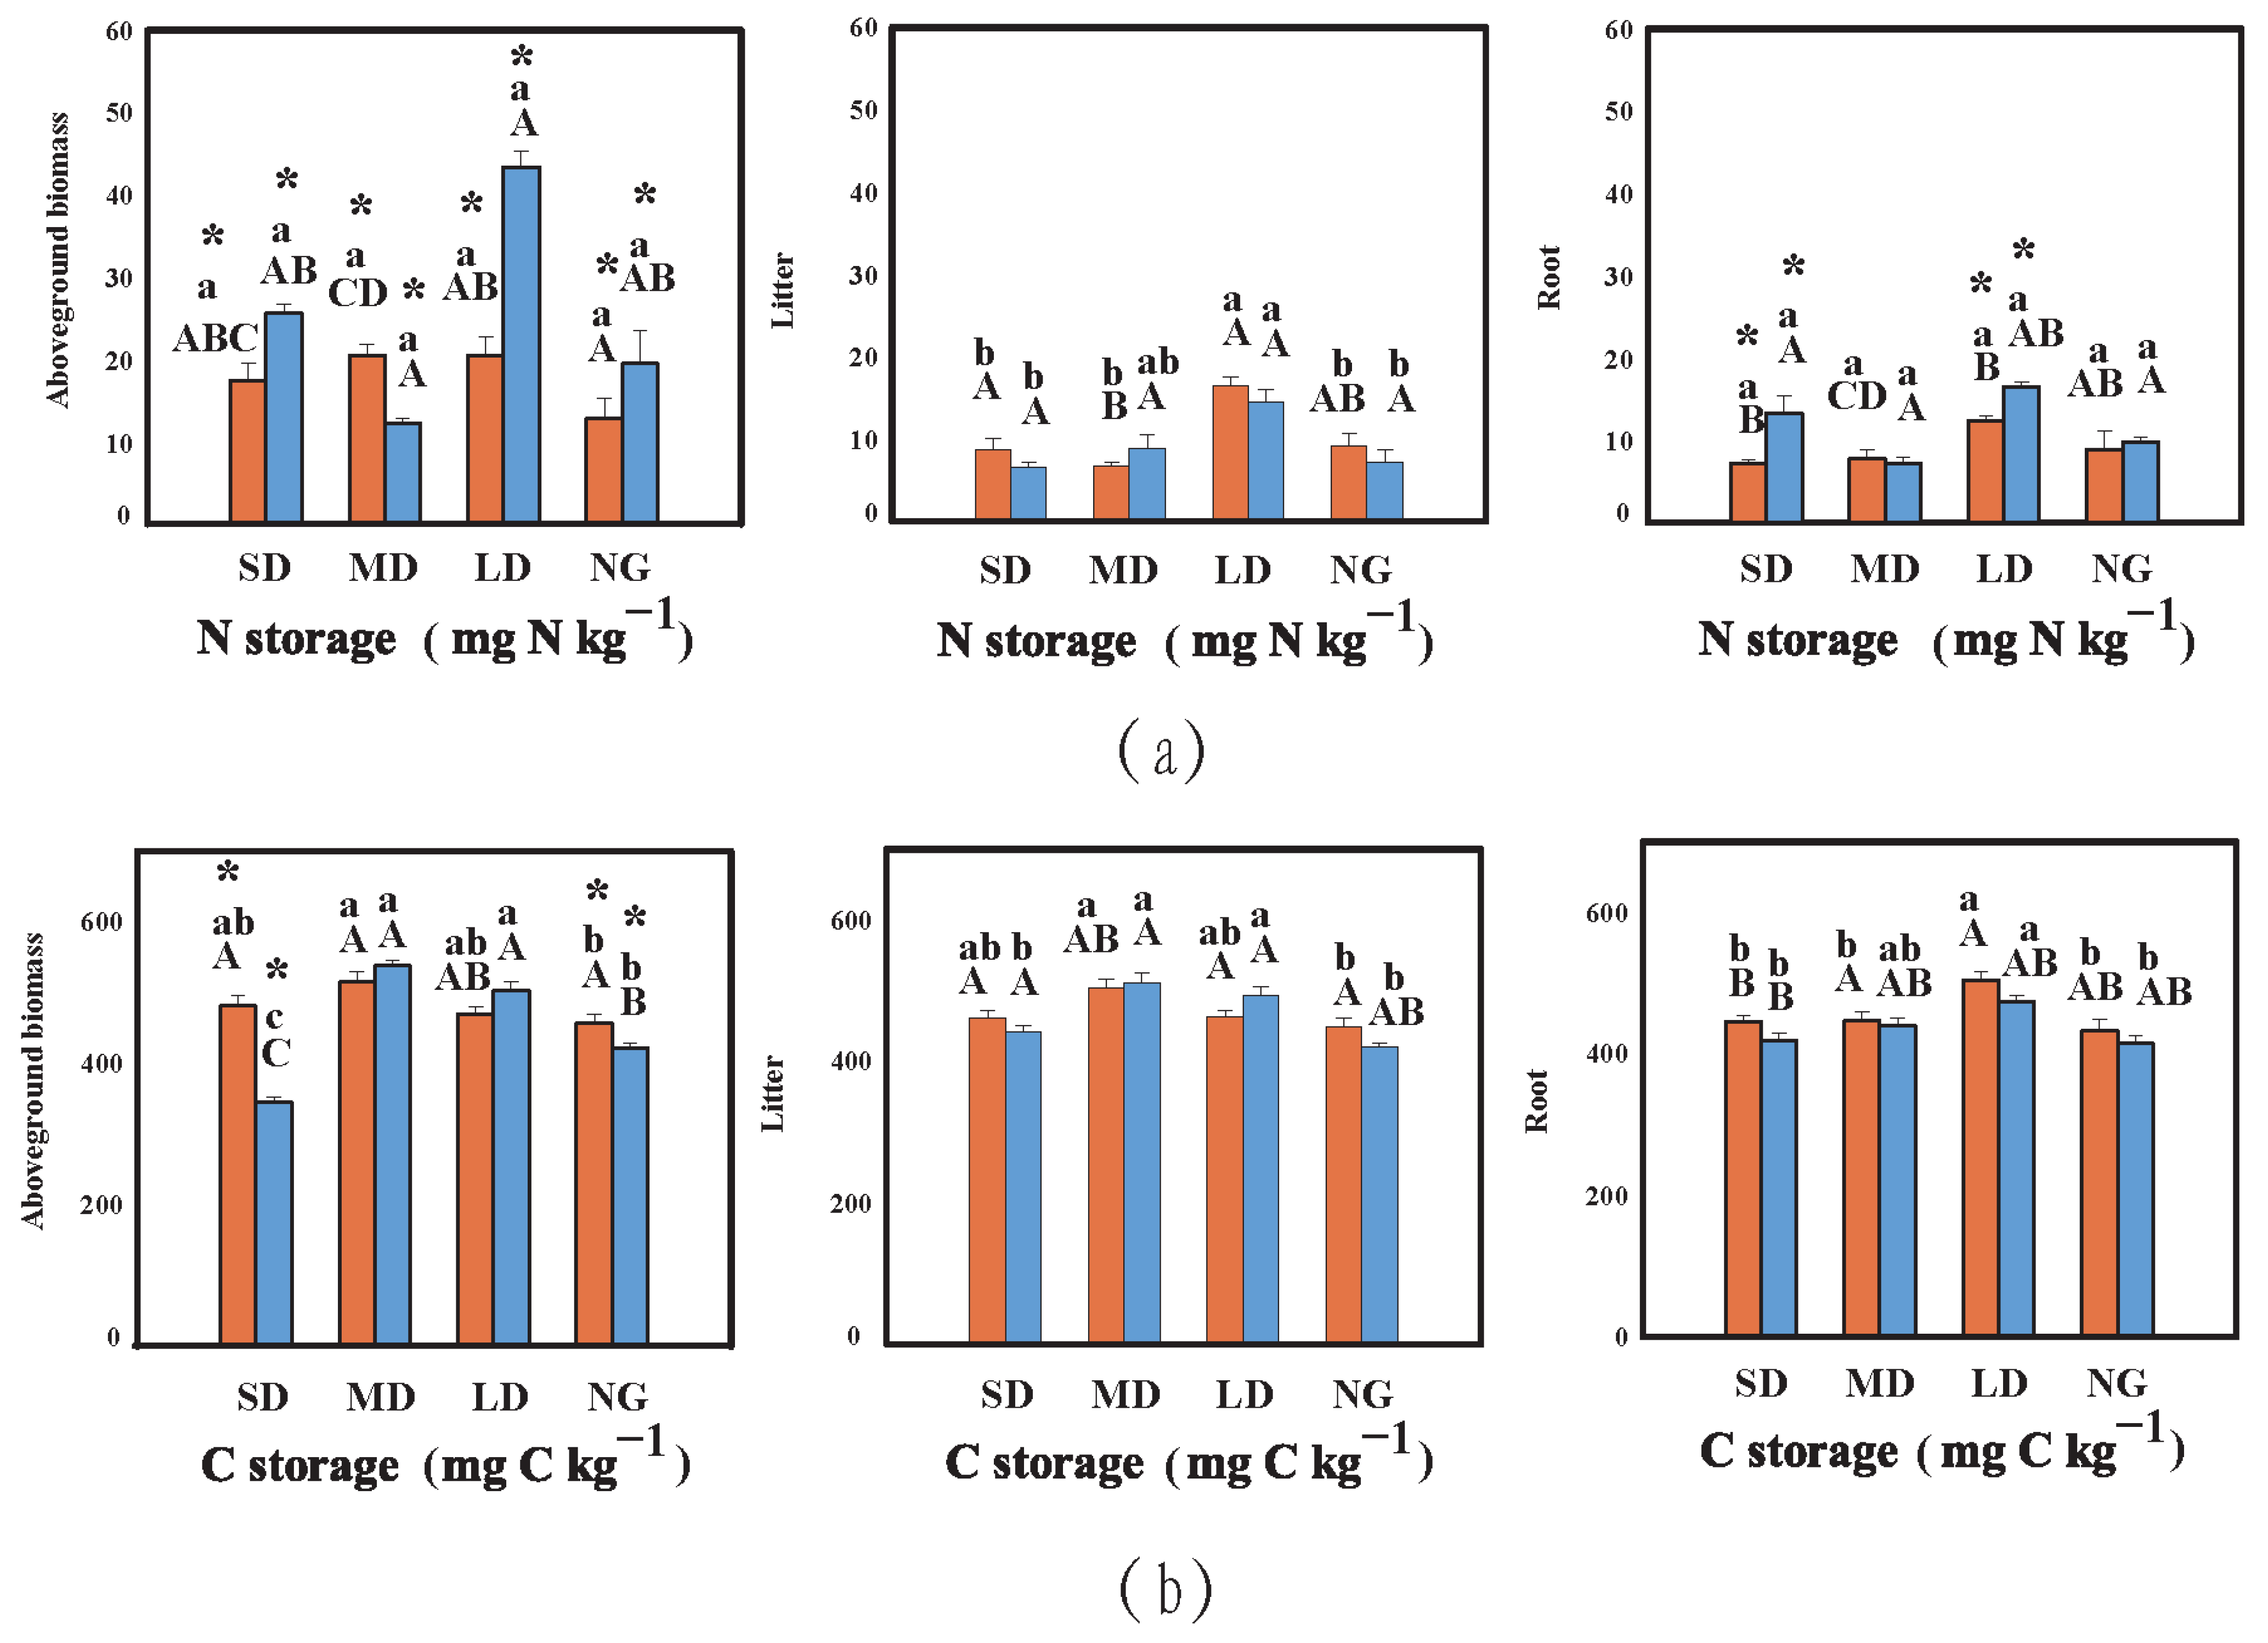
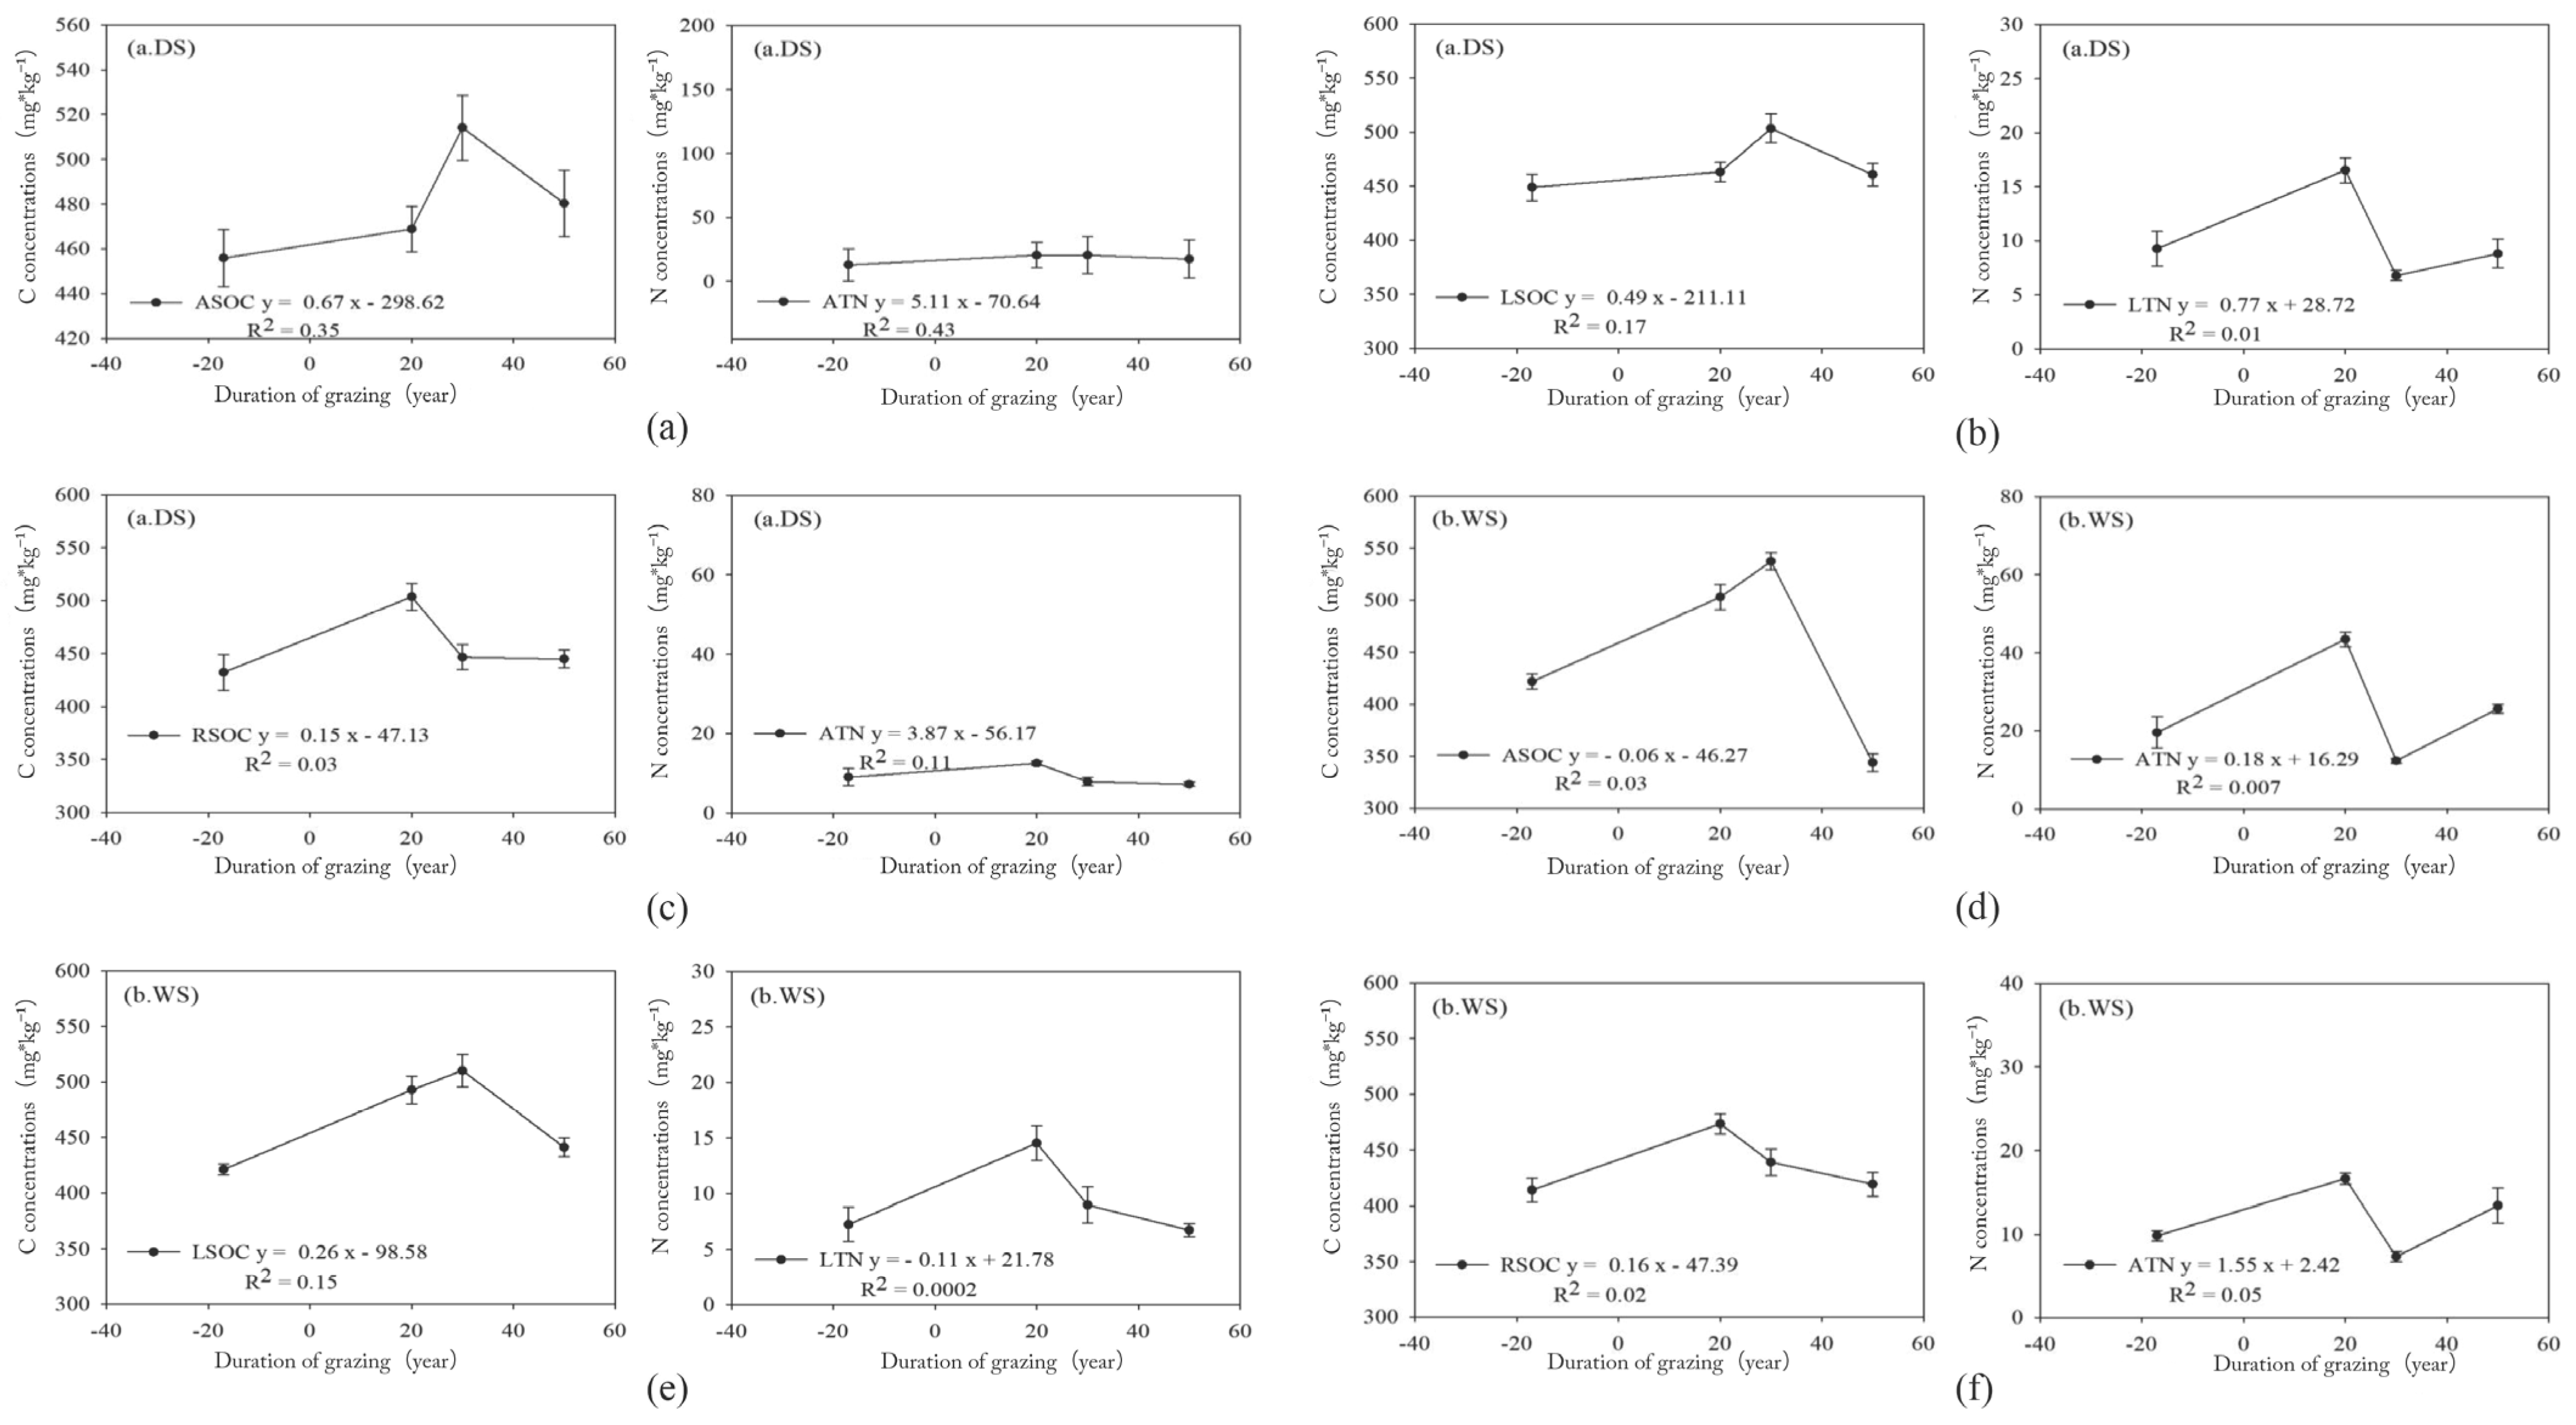
3.1.2. Carbon and Nitrogen in Plants

The C (ASOC) and N (ATN) concentrations in the aboveground biomass were less than 537.2 g C kg−1 and 20.1 g N kg−1, respectively (Figure 2). In the roots, the C (RSOC) and N (RTN) concentrations were less than 503.5 g C kg−1 and 16.5 g N kg−1, respectively, and the C (LSOC) and N (LTN) concentrations in the litter were less than 510.0 g C kg−1 and 16.6 g N kg−1, respectively. The total C concentrations (including that stored in aboveground biomass, litter, and roots) showed great differences among the four sites (p < 0.01), and the C concentrations varied notably among the different pools (Figure 1 and Figure 2). The C stored in plants accounted for over 90% of the total C concentration, while that which was in the soil was quite small (<10%), and in the roots, it ranged from 8.5 g C kg−1 in SD to 432.1 g C kg−1 in NG. Similarly, the total N concentration (including that which was stored in aboveground biomass, litter, and roots) showed great differences among grasslands with different land uses (p < 0.01). The total N concentration ranged from 8.5 g N kg−1 in SD to 12.5 g N kg−1 in NG (Figure 2). The C and N concentrations differed significantly among the different pools in different seasons (Figure 2a,b). The amount of N stored in the litter and roots was quite small compared to that in the aboveground biomass (Figure 2).

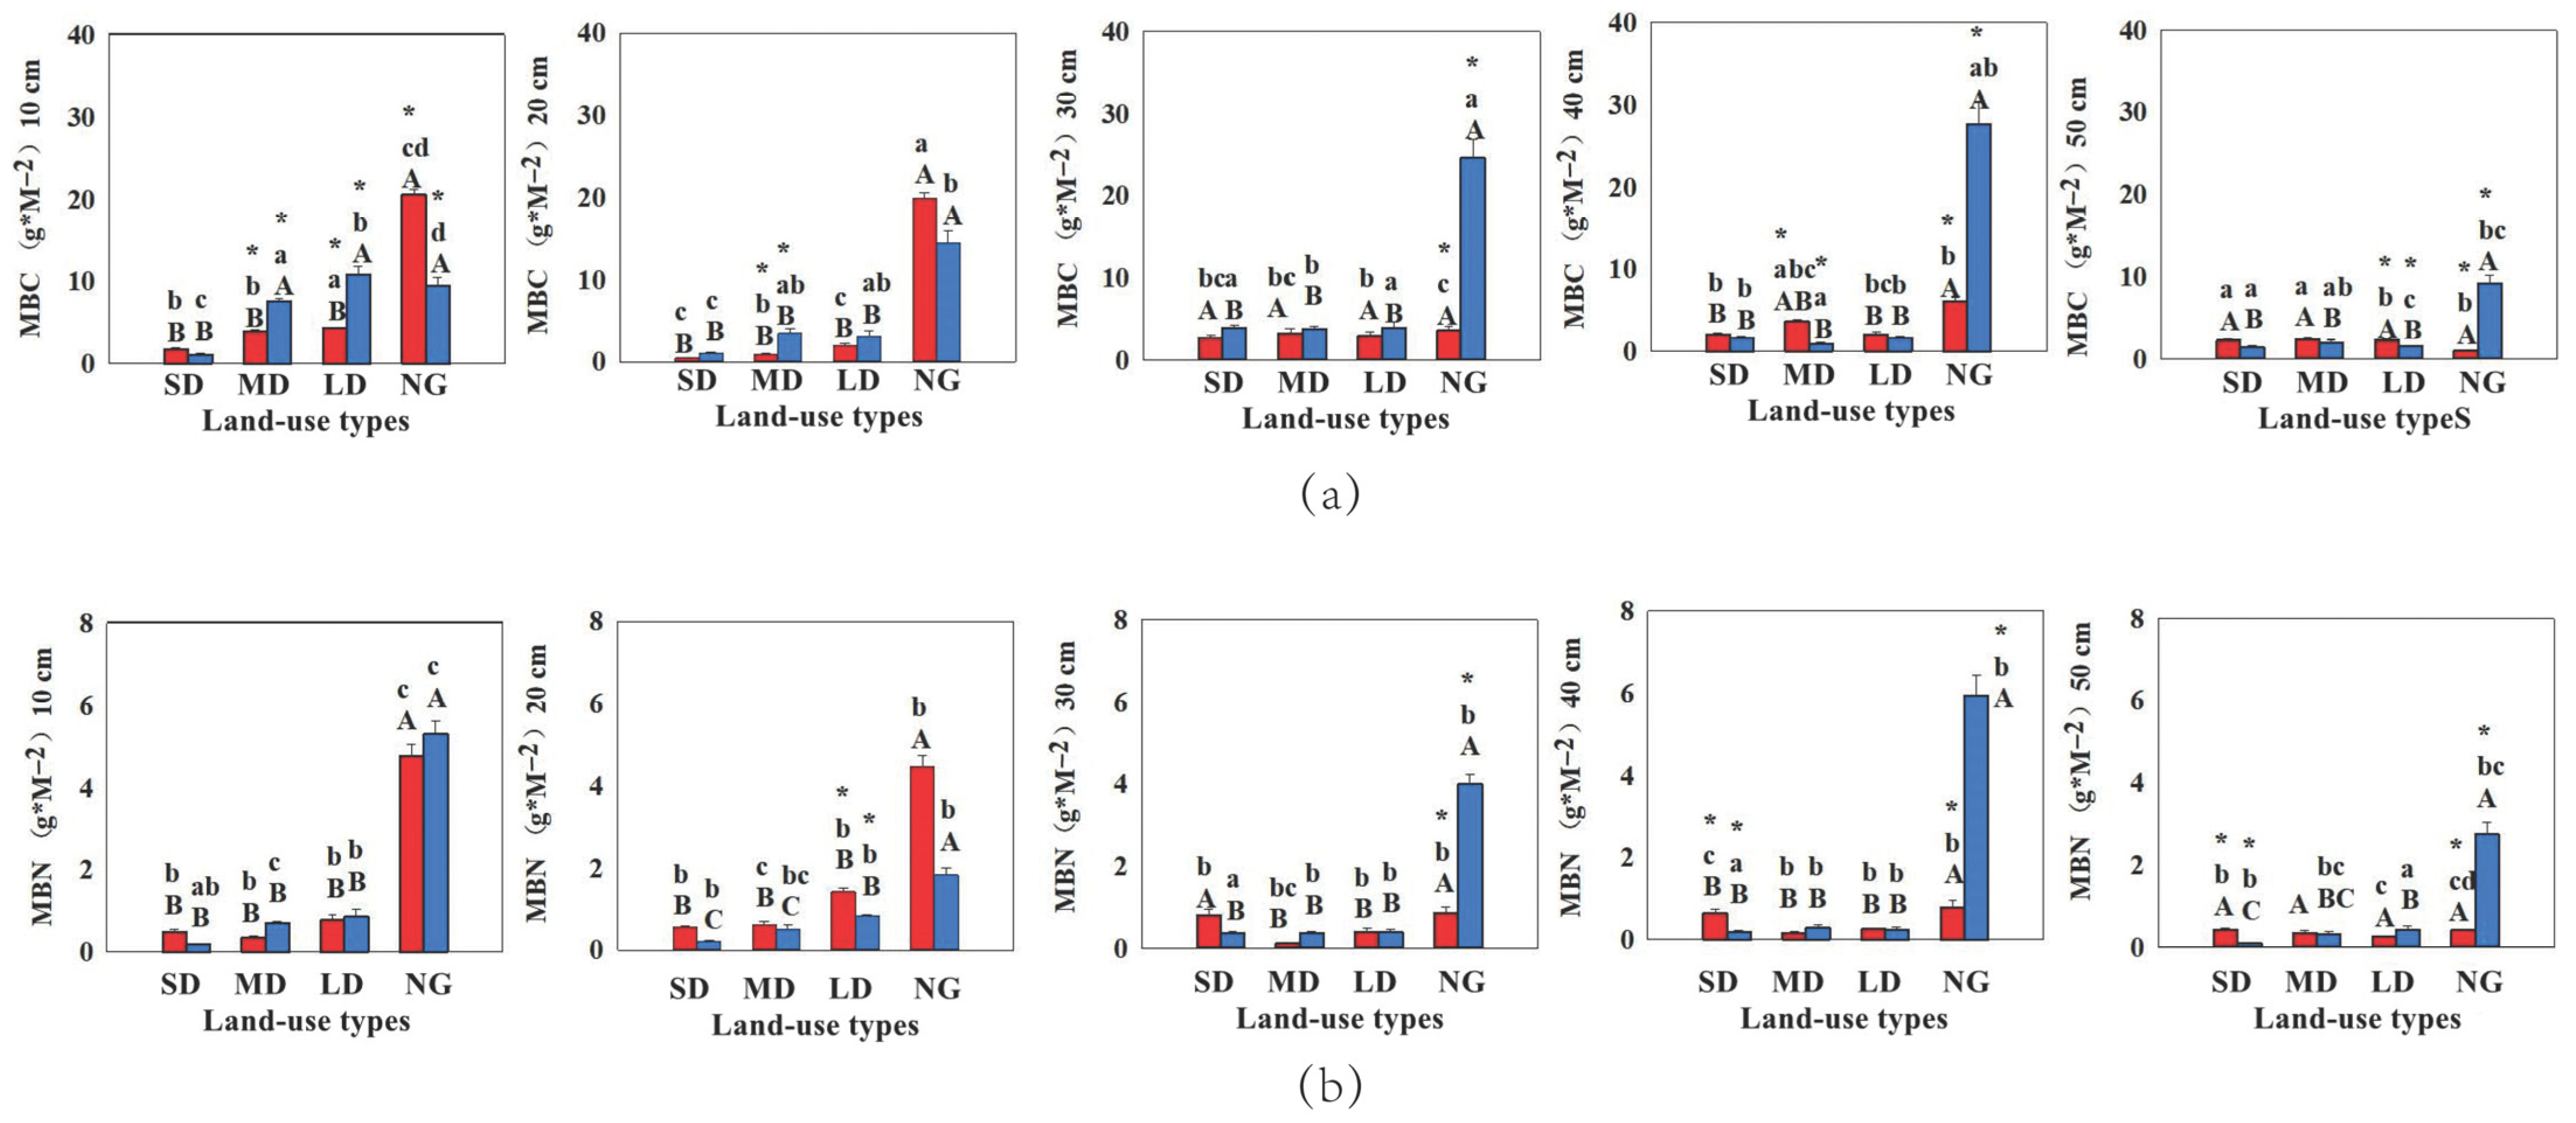
3.1.3. Microbial Biomass Carbon and Nitrogen Pools

MBC storage showed large differences among the four sites (p < 0.01), ranging from 1.4 g MBC M−2 in MD to 20.6 g MBC M−2 in NG (Figure 3a). Similarly, MBN storage differed greatly among the four sites (p < 0.01), ranging from 0.4 g N M−2 in MD to 5.9 g N M−2 in NG (Figure 3b). The microbial C and N storages in MD were less than 7.5 g MBC M−2 and 0.7 g MBN M−2, respectively (Figure 3a). The MBC and MBN storages in the DS were less than 3.9 g MBC M−2 and 0.6 g MBN M−2 in MD, respectively, while the MBC and MBN storages in the WS were less than 7.5 g MBC M−2 and 0.7 mg MBN kg−1 in MD. The MBC and MBN storages in the DS were less than 4.3 g MBC M−2 and 1.4 g MBN M−2 in LD, respectively, while the MBC and MBN storages in the WS were less than 10.8 g MBC M−2 and 0.9 mg MBN kg−1 in LD. Total MBC storage (including that stored in the 10–50 cm soil layers) varied greatly among the four sites (p < 0.01). Total MBC concentration decreased greatly with grassland degradation and was significantly higher in the NG site (Figure 3).
In NG, the MBC stored in the 10 cm layer accounted for over 70% of the total MBC, and the MBC storage in the deep-soil layer was quite small (<20%) compared to the other layers. The MBN concentration in the soil ranged from 0.1 g MBN M−2 in MD to 5.3 0.1 g MBN M−2 in NG. The MBN storage in soil was much higher in the 10 cm, 20 cm, and 30 cm soil layers than in the other layers (Figure 3). The total MBC and MBN storage differed significantly among different seasons in NG (p < 0.01) and exhibited both increases and decreases depending on the pools (Figure 3a,b). When compared to NG, over 90% of the soil microbial biomass in MD had been lost. When compared to MD, the total MBC and MBN storage in the 10 cm soil layer of NG were higher by 93.5% and 90.7%, respectively. The total MBC and MBN concentrations did share similar increasing trends over time in NG (p < 0.05) (Figure 3).
The MBC concentration showed large differences among the four sites (p < 0.01), ranging from 0.9 mg MBC kg−1 in MD to 200.7 mg MBC kg−1 in NG (Figure S2a). Similarly, the MBN concentration differed greatly among the four sites (p < 0.01), ranging from 0.8 mg N kg−1 in MD to 32.0 mg N kg−1 in NG (Figure S2b). The microbial C and N concentrations in MD were less than 26.9 mg MBC kg−1 and 4.41 g MBN kg−1, respectively (Figure S2). The MBC and MBN concentrations in the DS were less than 19.6 mg MBC kg−1 and 6.25 mg MBN kg−1 in MD, respectively, while the MBC and MBN concentrations in the WS were less than 26.7 mg MBC kg−1 and 2.2 mg MBN kg−1 in MD. The total MBC concentration (including that stored in the 10–50 cm soil layers) varied greatly among the four sites (p < 0.01). The total MBC concentration decreased greatly with grassland degradation and was significantly higher in the NG site (Figure S2).

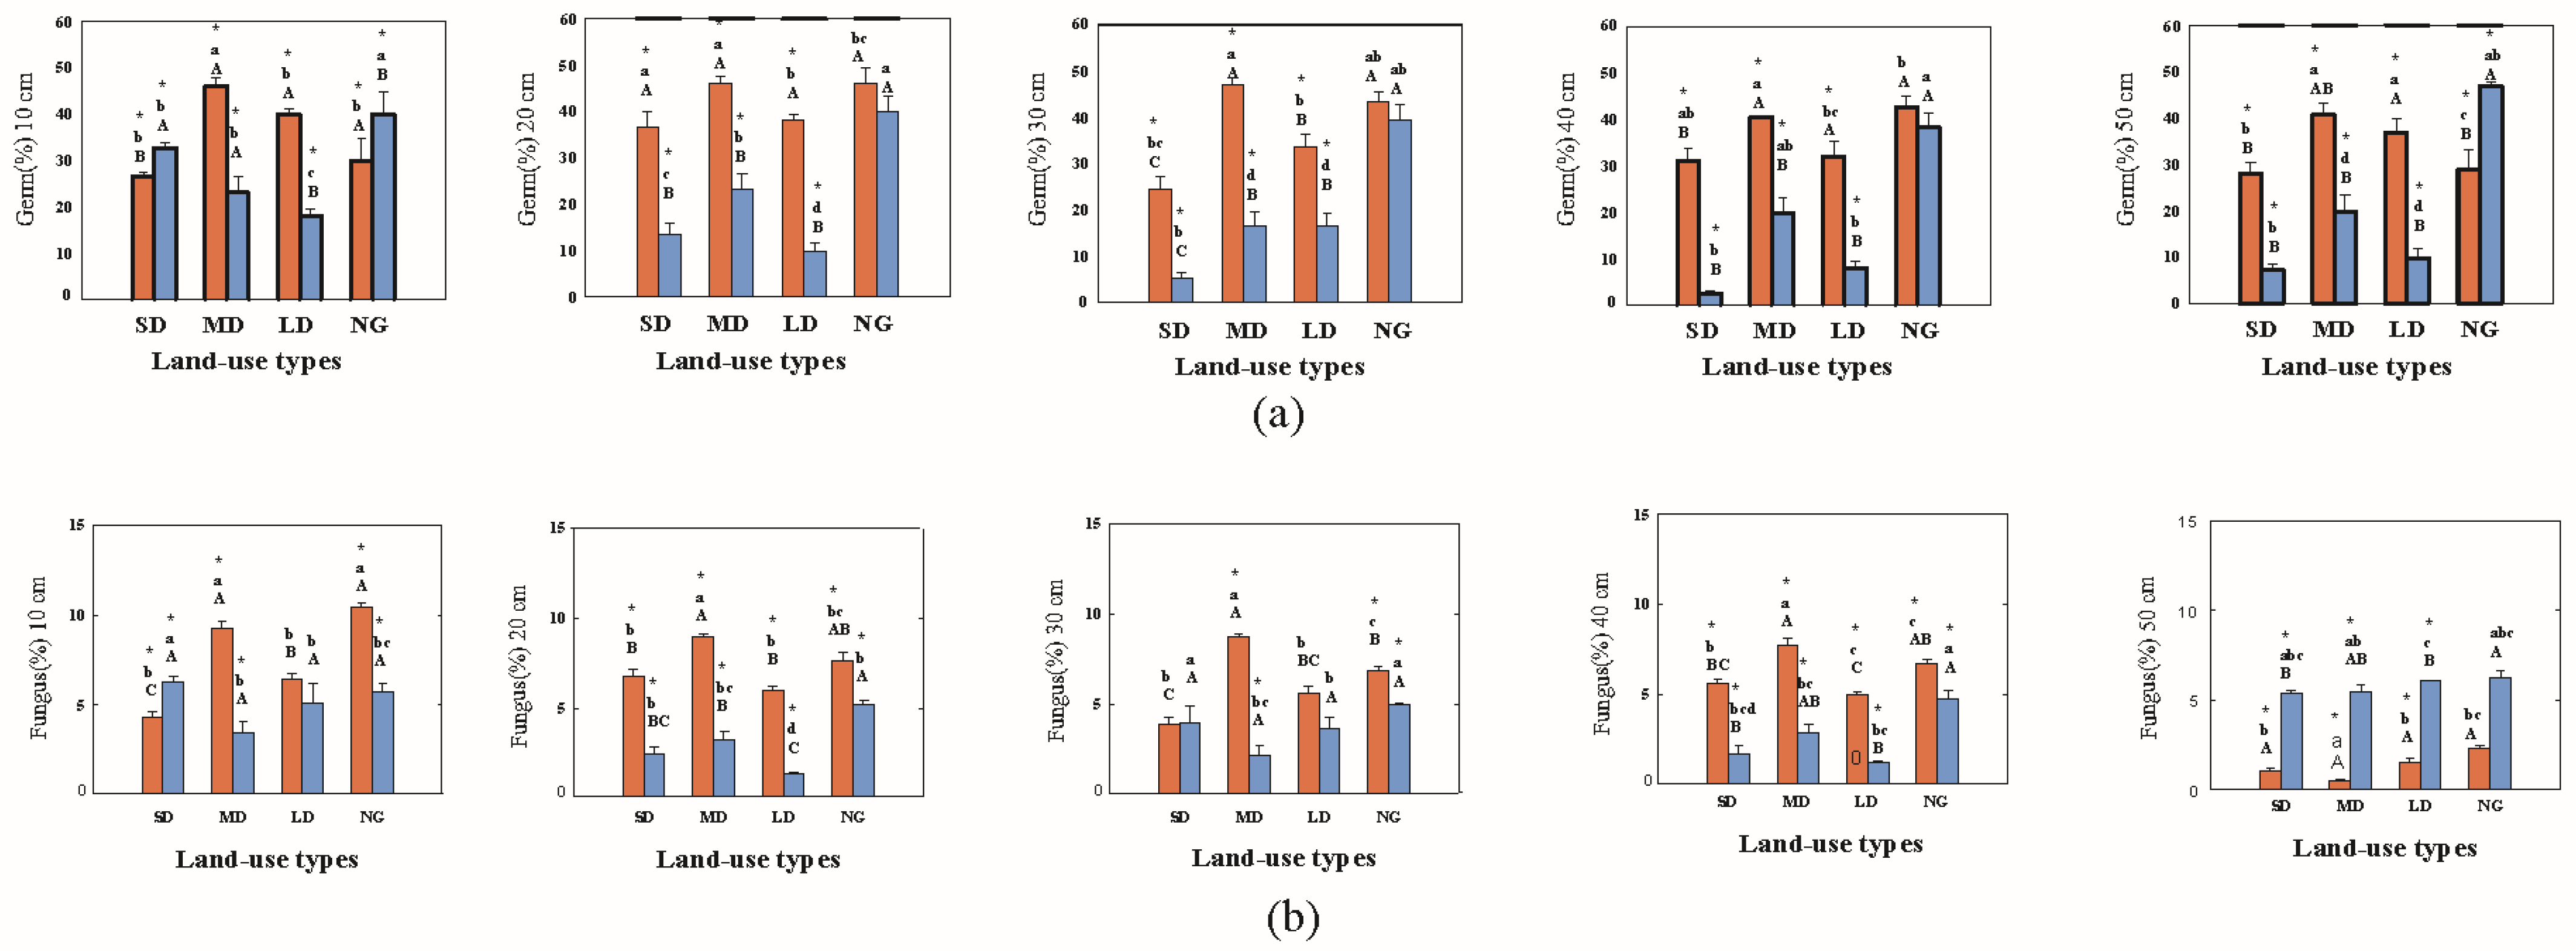
3.1.4. Bacterial and Fungal Abundances

The contents of sand and gravel had a greater influence on soil fungi than bacteria and had a positive effect. The micro-organisms were not always limited by SOC and STN, and bacteria and fungi storage did not share similar trends of an increase in NG over time (p < 0.05). The percentage of bacteria and fungi varied significantly among the different grazing levels (Figure 4). The soil bacteria percentage in the DS ranged from 26.5% to 40.7%, and in the WS, it ranged from 5.4~47.0%, while the soil fungi percentage in the DS and WS ranged from 3.9~10.42% and 1.3~8.9%, respectively. With different levels of desertification, the overall levels of soil fungi were lowest in SD, while MD and LD exhibited similar median levels, and NG had the highest (Figure 4).
Our results partially showed that there was a decreased contribution of fungal PLFAs in the WS compared to the DS in the 0–40 cm soil layers and an increased contribution of fungal PLFAs in the WS compared to the DS in the 40–50 cm soil layers (Figure 4a,b). With increasing precipitation, soil bacteria and fungi significantly increased or decreased, which indicated that the soil micro-organisms were greatly influenced by precipitation patterns. Bacteria and fungi content were both found in their highest concentrations in the DS in MD and LD but in the WS in NG. Additionally, they were remarkably different from the lowest to highest content, ordered SD < MD < LD < NG in the WS. The distribution of soil bacteria in the surface layer was far higher than that in the bottom layer (0–30 cm) among SD, MD, and LD (dry season, Figure 4a).

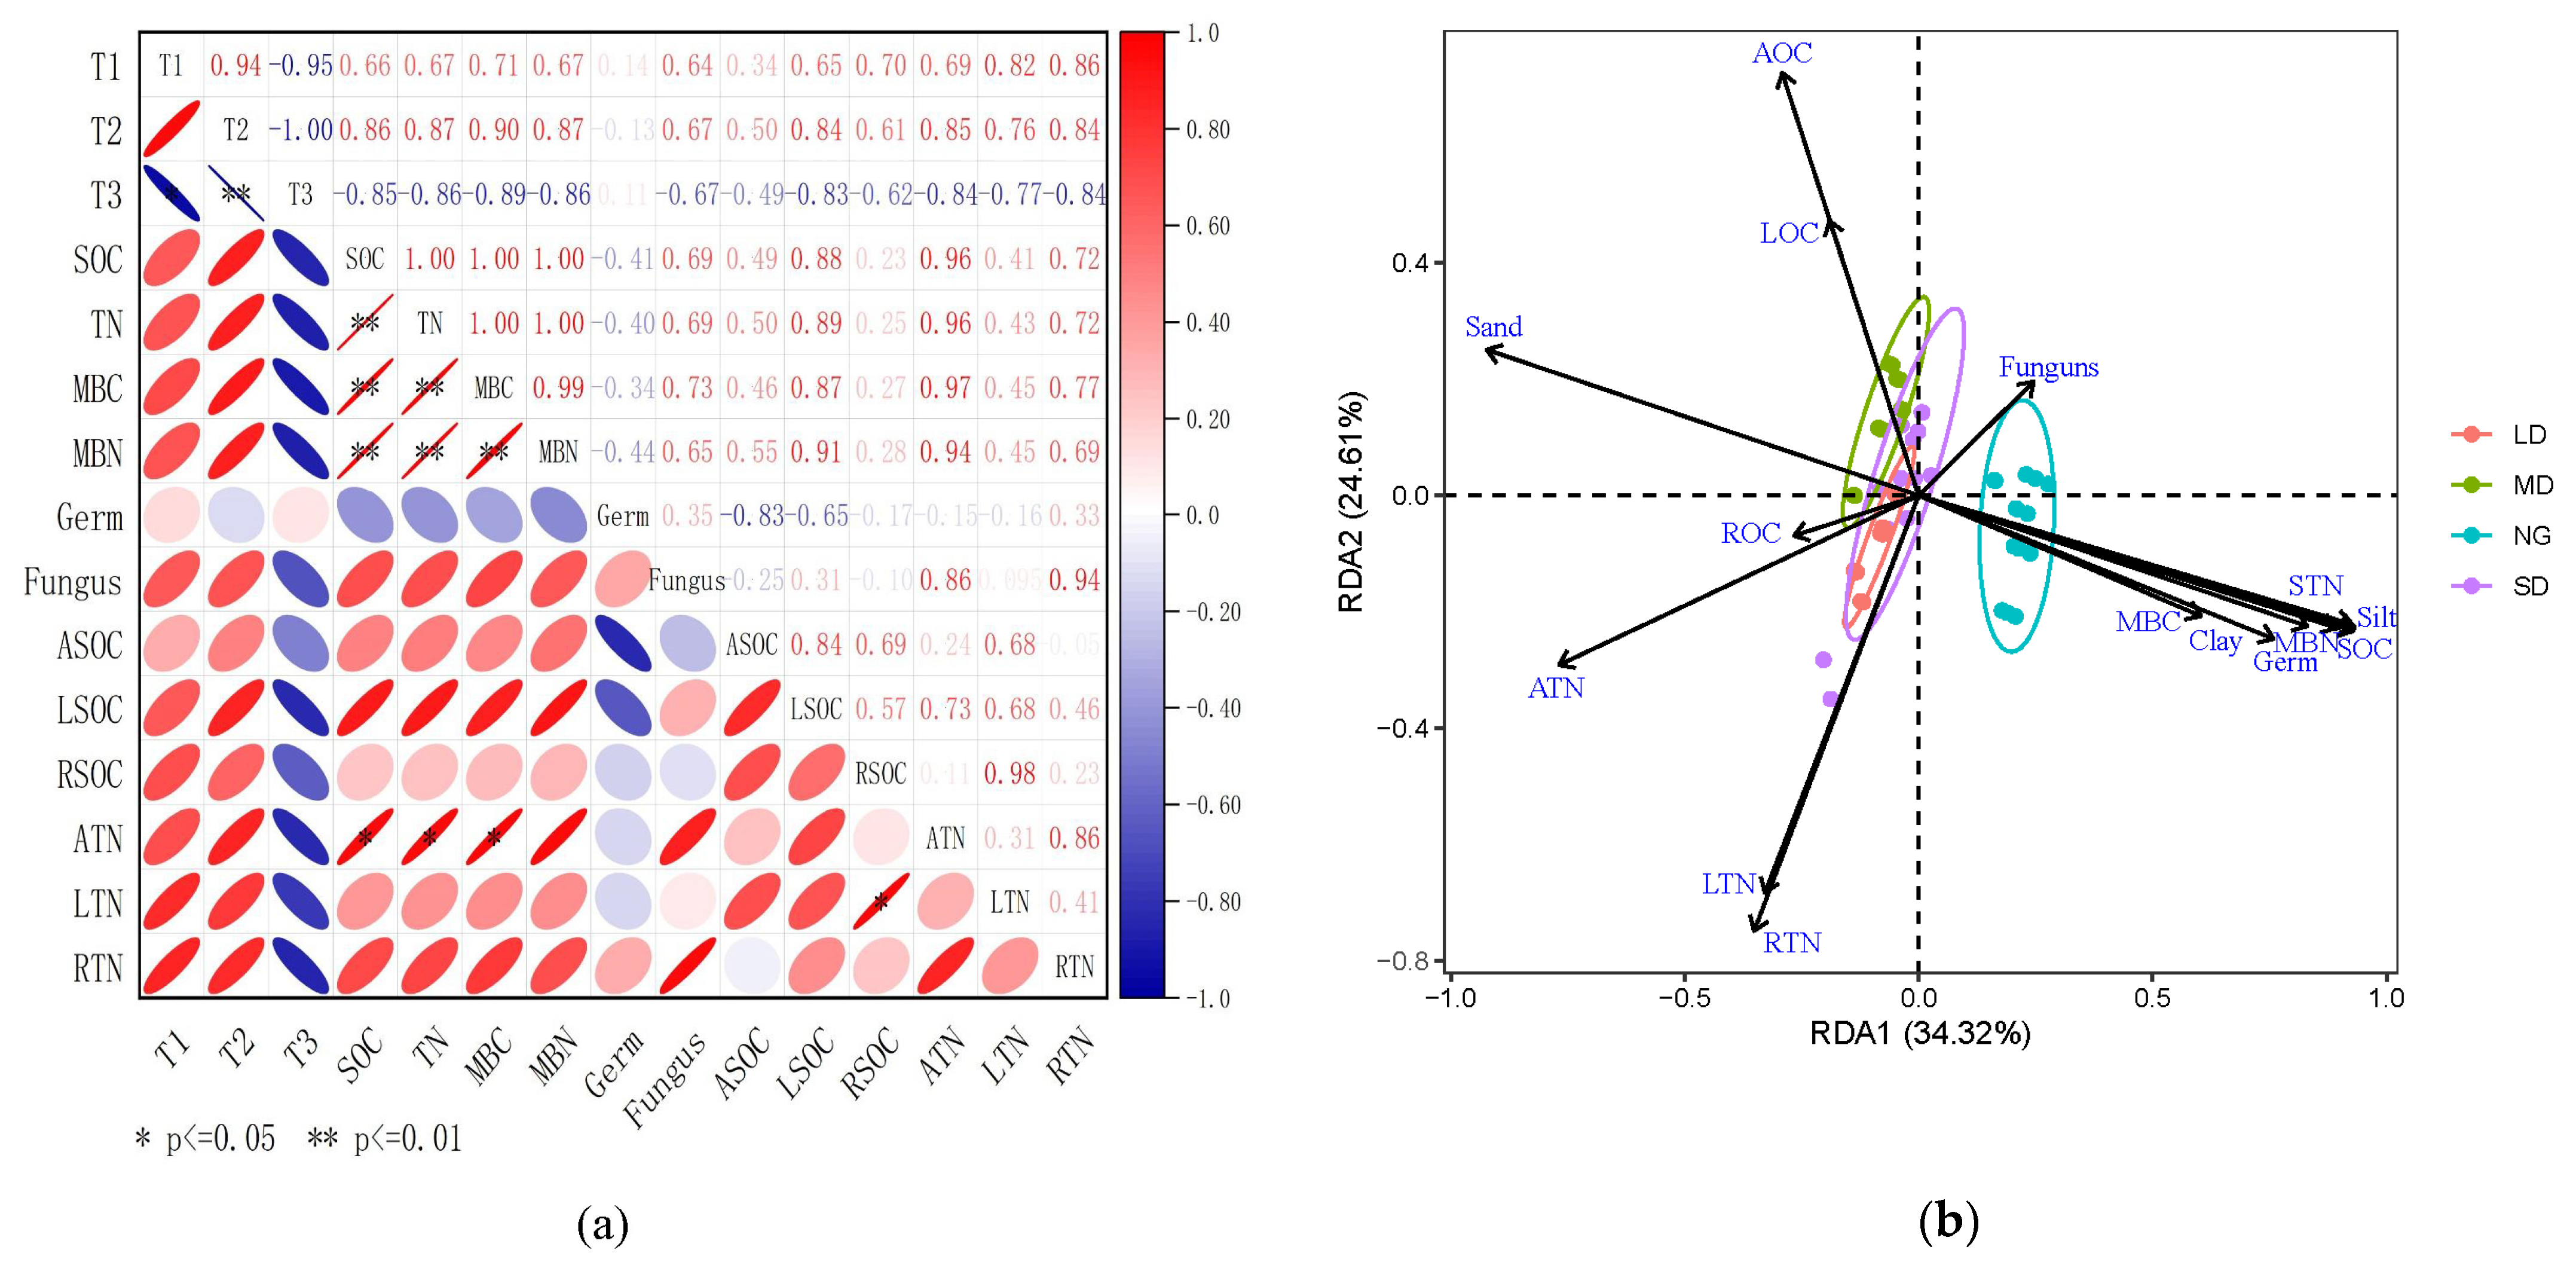
3.2. Relationship between Nutrient Pools and Grazing Intensity

In this study, the relationships between plant nutrients (including C and N concentrations in aboveground biomass, litter, and roots,) and grazing intensity were relatively weak (R2 < 0.5) (Figure 5).
Land-use change has significant effects on soil aggregate size in the grasslands of northern China. When compared to SD, the silt and clay concentrations in the 10 cm soil layer of NG were higher by 90.2% and 90.5%, respectively. In this study, differences in grazing management resulted in increases in silt (R2 = 0.97) and clay (R2 = 0.88) storage, respectively (Figure 6).
When compared to SD, NG had higher SOC and STN concentrations in the 10 cm soil layer by 97.3% (R2 > 0.89) and 98.1% (R2 ≥ 0.98). In addition, the total SOC content depended on land-use type to some extent. The SOC and STN storage exhibited an initial rapid increase with the establishment of the NG (Figure 6).
Furthermore, the degradation of temperate grasslands due to long-term heavy grazing reversed their sequestration potential and caused MBC and MBN loss by erosion and oxidation. In our study, the soil MBC concentration had decreased by 93.5%, 85.6%, and 84.7% in the SD, MD, and LD plots (R2 = 0.98, DS; R2 = 0.50, WS), respectively, and the soil MBN concentration had decreased by 90.7%, 95.2%, and 89.5% (R2 = 0.74, DS; R2 = 0.50, WS) (Figure 6).
The change in land use did not significantly affect bacterial and fungal content in the grasslands of northern China. Specifically, there were low correlation coefficients between grazing and the bacterial and fungal contents in both the dry and wet seasons (R2 < 0.20; R2 < 0.65) (Figure 6).

3.3. Analysis of Factors Driving Soil Degradation

Grazing exclusion had a remarkable positive effect on soil particulate matter composition (R > 0.90; p < 0.01). In the RDA analysis, the first two axes of RDA could explain 34.3.% and 24.6% of the total variation, respectively, in which the explanatory variables are MAP, MAT, Ele, silt, clay, sand, and grazing intensity, and the remaining variables were the response. The RDA analysis showed that precipitation did not contribute much to the potential of the soil and plant carbon and nitrogen concentrations. The microclasses of soil silt contributed more to the total soil nutrient pool (Figure 6 and Figure 7a,b), and the soil nutrient pool and microbial pool increased with time (years) and grazing exclusion (R > 0.50; p < 0.05) (Figure 6a,b), indicating that soil quality degradation was a synergistic response to grazing disturbance intensity.

4. Discussion

4.1. Responses of Soil Nutrient Pools to Grazing Intensity

The free-grazing land-use practice is far-ranging and common in the temperate grasslands of northern China. A decades-long period of unregulated overgrazing has resulted in the decline of grassland productivity and resulted in the deterioration of grasslands and soil loss over vast areas [18]. In the semiarid grasslands of China, the concentration potentials of C and N are approximately 17.5 g C kg−1 and 1.7 g N kg−1, respectively. The productivity of grasslands with established NG or grazing exclusion areas quickly stabilizes and matures [30,31]. Moreover, the result of a 17-year study (2000–2017) on MD suggested that the semiarid grasslands (after grazing) that had been excluded for over 15 years were still a very weak source of C. It has been noted that, after long periods of enclosure (i.e., >15 years), the C and N storage gradually became comparatively higher. Furthermore, the seasonal dynamics of C and N storage have not been observed to differ significantly (p > 0.05), which was consistent with this study. One plausible theory to explain this states that an increase in ANPP would lead to greater competition for resources, such as nutrients and water, and such an increase in demand for nutrients would lead to greater gross rates of soil organic matter (Figure 1). In study observations, total C and N increased in the WS (including aboveground biomass, ground litter, and roots), which would likely lead to increased soil organic matter mineralization during disturbances, such as from large-animal grazing. By altering the soil-water content, nutrient availability, heterogeneity, productivity, etc., grazing exerts a strong influence on the C and N cycles in grassland ecosystems [4,32,33,34].
In spite of these caveats, estimations of the potential concentration capacities can help us systematically characterize the effects of different management strategies on C and N concentrations in the grasslands of northern China. In this study, the C concentration in site NG was about 27.5 Mg C ha−1, which aligned with the previous estimate of 10–12 kg C m2 for the area [35], which was higher than the global mean value of 10.6 kg C m2 [8]. Burke et al. [33] showed that a 50-year period was enough for the active SOM and nutrient availability to fully recover from long-term grazing disturbance. Therefore, we concluded that a 20-year period would be reasonable for the restoration of semiarid grasslands subjected to MD, allowing them to transition from a degraded state to a high-productivity state, with SOC and STN storage similar to natural grasslands.
In this study, the SOC and STN contents in the surface layer were relatively high, which was due to the fact that surface soil can quickly adsorb newly imported organic matter, thus reducing the effect of soil organic carbon mineralization.

4.2. Response of Soil Microbial Abundance to Grazing Intensity

Based on our correlation analysis, the soil nutrient pools and soil microbial biomass pools exhibited similar increases or decreases. The C and N concentrations showed remarkable variability, with significant positive correlations with microbial biomass carbon and nitrogen pools, respectively (Figure 1, Figure 3 and Figure 4). The RDA indicated that silt and clay were the most important contributors to soil microbial biomass C and N storage compared to other soil size classes. Contrary to previous studies, we observed that higher water availability did not significantly affect C or N storage.
With regard to MBC and MBN concentrations, the grasslands with a higher potential for MBC and MBN sequestration were those depleted by poor management strategies in the past. Based on our findings, we came to the conclusion that the temperate grasslands of northern China exhibit the tremendous potential to increase their MBC and MBN concentrations.

4.3. Effects of Precipitation on Carbon and Nitrogen Pool Cycles

This study showed that precipitation had minor effects on the recovery of soil nutrients and their microbial biomass contents (Figure 1, Figure 3 and Figure 7b). This agreed with previous studies that saw no significant effect from different precipitation patterns [36], which may have been due to high recovery, often with low productivity, at low N. In grasslands, where nutrient availability limits productivity, the resistance of natural systems to disturbance is reduced, whereas its recovery/resilience is increased with increasing amounts of limiting nutrients, such as N and P [37]. This also indicated that, with limited nutrient resources, ecosystem resistance and recovery/resilience could be adversely affected [38].
Our RDA revealed that precipitation did not contribute much to the concentration potentials of soil carbon and nitrogen (including that stored in aboveground biomass, litter, and roots) (Figure 7b). Therefore, in contrast to resistance, the recovery of ANPP or plant growth after a dry season or a drought event was often higher when precipitation was low (Figure 2 and Figure 6), which was consistent with previous studies [39]. Among various ecosystems, the more severe and prolonged droughts are, the more time ecosystems need to recover [40]. However, in the SD, MD, and LD sites, the great increase in the recovery of nutrients in the dry season regimes may have been partly due to the fact that the vegetation had not been permanently damaged, leaving it with the potential to survive if returned to predrought conditions [40]. Additionally, this may be ascribed to the compensatory growth and release of soil nutrients after rewetting [22]. Compensatory growth may play a central role in the rapid recovery of some ecosystems. Sankaran [39] recently pointed out that, in these arid and semiarid grasslands, the ability of the plant community to recover from drought stress hinges on the length, severity, and frequency of dry periods in the predrought period [41]. Therefore, whether recovery is influenced by predrought conditions may depend on the duration and severity of the predrought period [39] and the growth stages of the plants [41]. Recent studies have shown that changes in rainfall regimes have no significant effect on soil resilience, which was consistent with our findings in a semiarid grassland (Figure 1 and Figure 2). This may have been because the whole cycle from normal precipitation (through a low precipitation period) to rewetting is encompassed by the resilience metric; therefore, the inverse correlation between resistance and recovery may indicate that a trade-off occurs with resilience.
A previous study showed that water additions remarkably enhanced fungal abundance in all soil aggregate classes (on average, by 37.4%). The compositions of bacterial communities are more strongly affected by rainfall than the compositions of fungal communities [42]. In our study, the changes in bacteria and fungi caused by precipitation may have reflected the microbial response to sufficient water inputs during the wet season. When compared to bacteria, the contents of sand and gravel contributed more to the growth of soil fungi and had a positive effect (Figure 6), and bacteria have been found to be better adapted to the environment. Soil acidification due to precipitation has been shown to benefit bacterial reproduction but not fungal reproduction [43]. The same conclusion can be drawn from this study, which saw a slow decrease in bacteria with altered rainfall patterns. Conversely, it has also been shown that fungi increased by as much as 80.8% during low water periods, which suggested that fungi could be better adapted to low water availability than bacteria [44]. With increasing rainfall in the growing season, the growth rates of bacteria and fungi were different, indicating that water has different effects on different microbial groups, which was consistent with the findings of Zhang et al. In addition, enhanced water availability could further improve substrate diffusion and nutrient accessibility to soil micro-organisms, thereby promoting microbial growth and increasing the total PLFA concentration and abundance of different microbial communities [15,16].
This study observed that, with precipitation, there were great decreases in fungal abundance (Figure 3b) and the F/B ratio, which indicates that there was a change in microbial diversity, as bacteria proliferated faster than fungi in certain water conditions [45]. This might be ascribed to the different growth strategies of fungi and bacteria, i.e., hyphal growth versus individual cells [46]. Fungal hyphae can transport nutrients and resources from one microsite to sites where nutrient limitations were constraining growth [47]. However, it has been observed that improved nutrient diffusion rates following water additions might be more beneficial to bacteria than fungi, thus decreasing the F/B ratio as nutrients were translocated more efficiently within the three soil fractions [15].

4.4. Response of Plant Nutrient Pools to Grazing Intensity

Recently, grasslands have been limited by both N and water as N additions of 5.25–17.5 g N m2 yr−1 above the background levels raised the NPP by 13–62% [31], whereas water addition increased the above and belowground NAPP by 32.9% and 38.3%, respectively [20]. However, soil micro-organisms were not limited by the same factors that constrain plant systems [48,49]. For instance, the study by Wei et al. indicated that there were differences in N saturation levels (threshold levels for N demand) between plants and soil micro-organisms, which highlighted that microbes could be limited by C or P, while plants were limited by N. In addition, under enhanced N availability in temperate grasslands, both the size and activity of soil microbial biomass showed decreases [49,50,51].
Plant nutrients did not appear limited by soil nutrients or microbial activity, which may just be due to lags in time and space between plant succession and soil nutrient concentrations in our sampling sites. Vegetation replacement and nutrient status changes require long buffering periods. Soil organic carbon content showed a gradual decrease from the NG to the SD, but this was not synchronized with plant performance. The soil response to desertification was more sensitive than vegetation, and, as stated earlier, changes in plant nutrients exhibited a certain time lag.

4.5. Effects of Enclosure on Carbon and Nitrogen Pools

Regression analysis showed that enclosure treatment significantly positively affected soil particle size fractions (clay, silt, and sand). There is a known relationship between silt + clay% and carbon storage and composition and nitrogen pools (R > 0.90; p < 0.01). Due to the enhancement of functional groups and the increase in vegetation cover in the fenced grasslands, there was an accumulation of silt in the nongrazed system. This might have been due to the off-site transport of water or the wind-blown capture of higher grass biomass. High pasture biomass prevented the loss of clay and silty soil particles by blowing and trapping wind. In contrast, in heavily grazed plots, lighter silt particles in the soil are more likely to be carried away by the wind. After enclosure treatment, the macroaggregate soil size class contributed more than 70% to soil nutrient storage (Figure 6). Soil nutrients and soil microbial biomass increased with increasing time after grazing (R > 0.50; p < 0.05) (Figure 6). The heavy-grazing area took more than 50 years to recover to a stable and healthy natural grassland status after enclosure management measures were taken (Figure 6). A large number of previous studies have suggested that, after a desertified grassland is enclosed, 10 years is required for the soil to develop from quantitative to qualitative changes, and 17 years is required for organic matter content to reach 2.86% (36.7 times that when initially contained). This study showed that there was a strong correlation between soil nutrients and microbial nutrient pools under different grazing intensities, and the longer the regulated grazing period was, the more nutrients returned annually to the soil. The number of soil surface bacteria in the initial stage of the fenced grassland was 43.348 × 10⁴ g−1 soil. After 17 years of containment, 975.51 × 10⁴ g−1 soil was observed. The increase was 40.95 times that of the time of the initial containment. For SD and MD grassland, the restoration process may be enhanced by reseeding with suitable native plant seeds with proper organic fertilizer input and enclosures.

5. Conclusions

Changes in land-use strategies have strong effects on C and N storage in the grasslands of northern China. The storage of C and N has reduced greatly due to grassland degradation from long-term heavy grazing. Under heavy grazing pressure, the storage potentials of C and N in semiarid grasslands are about 0.93 Mg C ha−1 and 0.11 Mg N ha−1, respectively. These values are far lower than in natural grasslands (27.51 Mg C ha−1 and 2.55 Mg N ha−1), which means there is huge potential to increase C storage in the temperate grasslands of northern China. The proportion of aggregate size in soil was shown to be the main limiting factor for both soil nitrogen pools and microbial biomass C and N storage in semiarid grassland. Importantly, the site that had been fenced for 17 years had the highest level of soil microaggregates. This demonstrated that fencing is an economical and effective measure for the natural restoration of degraded grassland. However, this is a long process, and heavily grazed areas can require at least 50 years to become stable and healthy.

Supplementary Materials

The following supporting information can be downloaded at: https://www.mdpi.com/article/10.3390/su15043434/s1, Figure S1: Vegetation coverage in different land-use patterns on semiarid grasslands in Duolun, Inner Mongolia, China (i.e., SD: 20 ha plot that has been grazed for more than 50 years; MD: Free-grazing, long-term heavy grazing 24 ha plot that has been grazed since 1989; LD: Free-grazing, light grazing 24 ha plot that has been grazed since 1979; NG: 40 ha plot fenced since 2000); Figure S2: Microbial biomass C (a) and N (b) concentrations and depth profiles in the different land-use types in a semiarid grassland. Error bars indicate SE (n = 5). See Table 1 for site abbreviations. Different letters indicate significant differences among soil SOC and STN (i.e., lower-case letters indicate significant difference between soil depth; capital letters indicate significant difference among grazing intensity), and asterisks (*) indicate significant difference between dry season (red color bars) and wet seasons (blue color bars).

Author Contributions

X.G. conceived and designed this experiment. X.G. performed the field experiment and processed the data. D.L. and Z.D. and Z.Z. processed the data. S.L. and D.W. put forward the proposal advices and X.G. revised the manuscript. X.G. analyzed the data and wrote the manuscript. All authors have read and agreed to the published version of the manuscript.

Funding

This study was supported by the National Basic Research Program (2016YFC0500501).

Institutional Review Board Statement

Not applicable.

Informed Consent Statement

Not applicable.

Data Availability Statement

The data presented in this study are available on request from the corresponding author.

Acknowledgments

We are grateful to Yongfei Bai for providing experimental platforms. We would also like to thank the staff of the field stations for their logistical support during the course of the experiment.

Conflicts of Interest

The authors declare no conflict of interest.

References

  1. Maestre, F.T.; Salguero-Gómez, R.; Quero, J.L. It is getting hotter in here: Determining and projecting the impacts of global environmental change on drylands. Philos. Trans. R. Soc. B Biol. Sci. 2012, 367, 3062–3075. [Google Scholar] [CrossRef] [PubMed]
  2. Kemp, D.R.; Guodong, H.; Xiangyang, H.; Michalk, D.L.; Fujiang, H.; Jianping, W.; Yingjun, Z. Innovative grassland management systems for environmental and livelihood benefits. Proc. Natl. Acad. Sci. USA 2013, 110, 8369–8374. [Google Scholar] [CrossRef] [PubMed]
  3. Kansheba, J.M.; Wald, A.E. Entrepreneurial ecosystems quality and productive entrepreneurship: Entrepreneurial attitude as a mediator in early-stage and high-growth activities. J. Small Bus. Enterp. Dev. 2022, 2, 29. [Google Scholar] [CrossRef]
  4. Davidson, E.A.; Nepstad, D.C.; Klink, C.; Trumbore, S.E. Pasture soils as carbon sink. Nature 1995, 376, 473. [Google Scholar] [CrossRef]
  5. Scurlock, J.M.O.; Hall, D.O. The global carbon sink: A grassland perspective. Glob. Chang. Biol. 1998, 4, 229–233. [Google Scholar] [CrossRef]
  6. Tan, Z.; Liu, S.; Johnston, C.A.; Liu, J.; Tieszen, L.L. Analysis of ecosystem controls on soil carbon source-sink relationships in the northwest Great Plains. Glob. Biogeochem. Cycles 2006, 4, 20. [Google Scholar] [CrossRef]
  7. Lugo, A.E.; Brown, S. Management of tropical soils as sinks or sources of atmospheric carbon. Plant Soil 1993, 149, 27–41. [Google Scholar] [CrossRef]
  8. Post, W.M.; Emanuel, W.R.; Zinke, P.J.; Stangenberger, A.G. Soil carbon pools and world life zones. Nature 1982, 298, 156–159. [Google Scholar] [CrossRef]
  9. Donnelly, J.A. Carbon sequestration in temperate grassland ecosystems and the influence of management, climate and elevated CO2. New Phytol. 2010, 164, 423–439. [Google Scholar]
  10. Billings, S.A. Soil organic matter dynamics and land use change at a grassland/forest ecotone. Soil Biol. Biochem. 2006, 38, 2934–2943. [Google Scholar] [CrossRef]
  11. Elmore, A.J.; Asner, G.P. Effects of grazing intensity on soil carbon stocks following deforestation of a Hawaiian dry tropical forest. Glob. Chang. Biol. 2010, 12, 1761–1772. [Google Scholar] [CrossRef]
  12. Liao, J.D.; Boutton, T.W.; Jastrow, J.D. Storage and dynamics of carbon and nitrogen in soil physical fractions following woody plant invasion of grassland. Soil Biol. Biochem. 2006, 38, 3184–3196. [Google Scholar] [CrossRef]
  13. Hau, L.C.; Lim, Y.S. Proposed method for evaluating controllers of battery-based storage system in maximum demand reductions. J. Energy Storage 2022, 46, 103850. [Google Scholar] [CrossRef]
  14. Samuel, E. Impacts of Climate Change and Land Management on Carbon Dynamics of British Upland Grassland Soils. Ph.D. Thesis, University of Leeds, Ritz, UK, 2018. [Google Scholar]
  15. Dungait, J.A.J.; Hopkins, D.W.; Gregory, A.S.; Whitmore, A.P. Soil organic matter turnover is governed by accessibility not recalcitrance. Glob. Chang. Biol. 2012, 18, 1781–1796. [Google Scholar] [CrossRef]
  16. Nielsen, U.N.; Ball, B.A. Impacts of altered precipitation regimes on soil communities and biogeochemistry in arid and semi-arid ecosystems. Glob. Chang. Biol. 2015, 21, 1407–1421. [Google Scholar] [CrossRef]
  17. Houghton, R.A.; Hackler, J.L.; Lawrence, K.T. The U.S. Carbon Budget: Contributions from Land-Use Change. Science 1999, 285, 574–578. [Google Scholar] [CrossRef]
  18. Dong, X.B.; Zhang, X.S. The Grassland in the Inner Mongolia is Overloaded and Changes of the Production Pattern are Highlighted. Resour. Sci. 2005, 27, 175–179. [Google Scholar]
  19. Stampfli, A.; Bloor, J.; Fischer, M.; Zeiter, M. High land-use intensity exacerbates shifts in grassland vegetation composition after severe experimental drought. Glob. Chang. Biol. 2018, 24, 2021–2034. [Google Scholar] [CrossRef]
  20. Xu, Z.Z.; Zhou, G.S. Photosynthetic Recovery of a Perennial Grass Leymus chinensis after Different Periods of Soil Drought. Plant Prod. Sci. 2007, 10, 277–285. [Google Scholar] [CrossRef]
  21. Zak, D.R.; Holmes, W.E.; White, D.C.; Peacock, A.D.; Tilman, D. Plant diversity, soil microbial communities, and ecosystem function: Are there any links? Ecology 2003, 84, 2042–2050. [Google Scholar] [CrossRef]
  22. Mackie, K.A.; Zeiter, M.; Bloor, J.M.G.; Stampfli, A. Plant functional groups mediate drought resistance and recovery in a multisite grassland experiment. J. Ecol. 2019, 107, 937–949. [Google Scholar] [CrossRef]
  23. Xu, Z.; Wan, S.; Ren, H.; Han, X.; Li, M.H.; Cheng, W.; Jiang, Y.; Chen, H.Y.H. Effects of Water and Nitrogen Addition on Species Turnover in Temperate Grasslands in Northern China. PLoS ONE 2012, 7, e3976. [Google Scholar] [CrossRef]
  24. Morra, M.J.; Blank, R.R.; Freeborn, L.L.; Shafii, B. Size Fractionation of Soil Organo-Mineral Complexes Using Ultrasonic Dispersion. Soil Sci. 1991, 152, 294–303. [Google Scholar] [CrossRef]
  25. Gallaher, R.N.; Weldon, C.O.; Boswell, F.C. A semiautomated procedure for total nitrogen in plant and soil samples. Soil Sci. Soc. Am. J. 1976, 40, 887–889. [Google Scholar] [CrossRef]
  26. Vance, E.D.; Brookes, P.C.; Jenkinson, D.S. An extraction method for measuring soil microbial biomass C. Soil Biol. Biochem. 1987, 19, 703–707. [Google Scholar] [CrossRef]
  27. Bossio, D.A.; Scow, K.M. Impacts of Carbon and Flooding on Soil Microbial Communities: Phospholipid Fatty Acid Profiles and Substrate Utilization Patterns. Microb. Ecol. 1998, 35, 265–278. [Google Scholar] [CrossRef]
  28. Zhang, N.; Wan, S.; Guo, J.; Han, G.; Gutknecht, J.; Schmid, B.; Yu, L.; Liu, W.; Bi, J.; Wang, Z. Precipitation modifies the effects of warming and nitrogen addition on soil microbial communities in northern Chinese grasslands. Soil Biol. Biochem. 2015, 89, 12–23. [Google Scholar] [CrossRef]
  29. Deforest, J.L.; Zak, D.R.; Pregitzer, K.S.; Burton, A.J. Atmospheric Nitrate Deposition, Microbial Community Composition, and Enzyme Activity in Northern Hardwood Forests. Soil Sci. Soc. Am. J. 2004, 68, 132–138. [Google Scholar] [CrossRef]
  30. Xiao, X.M.; Wang, Y.F.; Chen, Z.Z. Dynamics of primary productivity and soil organic matter of typical steppe in the Xilin River basin of Inner Mongolia and the response to climate change. Acta Bot. Sin. 1996, 38, 45–52. [Google Scholar]
  31. Bai, Y.; Han, X.; Wu, J.; Chen, Z.; Li, L. Ecosystem stability and compensatory effects in the Inner Mongolia grassland. Nature 2004, 431, 181–184. [Google Scholar] [CrossRef]
  32. Hulbert, L.C. Causes of Fire Effects in Tallgrass Prairie. Ecology 1988, 69, 46–58. [Google Scholar] [CrossRef]
  33. Collins, S.L.; Smith, M. Scale-dependent interaction of fire and grazing on community heterogeneity in tallgrass prairie. Ecology 2006, 87, 2058–2067. [Google Scholar] [CrossRef]
  34. Macneil, M.; Haferkamp, M.R.; Vermeire, L.T.; Muscha, J.M. Prescribed fire and grazing effects on carbon dynamics in a northern mixed-grass prairie. Agric. Ecosyst. Environ. 2008, 127, 66–72. [Google Scholar] [CrossRef]
  35. Bai, Y.; Wu, J.; Clark, C.M.; Naeem, S.; Pan, Q.; Huang, J.; Zhang, L.; Han, X. Tradeoffs and thresholds in the effects of nitrogen addition on biodiversity and ecosystem functioning: Evidence from inner Mongolia Grasslands. Glob. Chang. Biol. 2010, 16, 358–372. [Google Scholar] [CrossRef]
  36. Ma, Q.; Liu, X.; Li, Y.; Li, L.; Yu, H.; Qi, M. Nitrogen deposition magnifies the sensitivity of desert steppe plant communities to large changes in precipitation. J. Ecol. 2020, 108, 598–610. [Google Scholar] [CrossRef]
  37. DeAngelis, D.L.; Mulholland, P.J.; Palumbo, A.V.; Steinman, A.D.; Huston, M.A.; Elwood, J.W. Nutrient Dynamics and Food-Web Stability. Annu. Rev. Ecol. Syst. 1989, 20, 71–95. [Google Scholar] [CrossRef]
  38. Herbert, D.A.; Fownes, J.H. Hurricane damage to a Hawaiian forest: Nutrient supply rate affects resistance and resilience. Ecology 1999, 80, 908–920. [Google Scholar] [CrossRef]
  39. Xu, Z.; Zhou, G.; Shimizu, H. Are plant growth and photosynthesis limited by pre-drought following rewatering in grass? J. Exp. Bot. 2009, 60, 3737. [Google Scholar] [CrossRef]
  40. Schwalm, C.R.; Anderegg, W.R.L.; Michalak, A.M.; Fisher, J.B.; Biondi, F.; Koch, G.; Litvak, M.; Ogle, K.; Shaw, J.D.; Wolf, A. Global patterns of drought recovery. Nature 2017, 548, 202–205. [Google Scholar] [CrossRef]
  41. Sankaran, M. Droughts and the ecological future of tropical savanna vegetation. J. Ecol. 2019, 107, 1531–1549. [Google Scholar] [CrossRef]
  42. Manzoni, S.; Schimel, J.P.; Porporato, A. Responses of soil microbial communities to water stress: Results from a meta-analysis. Ecology 2012, 93, 930–938. [Google Scholar] [CrossRef] [PubMed]
  43. Pennanen, T.; Fritze, H.; Vanhala, P.; Kiikkila, O.; Bååth, E. Structure of a Microbial Community in Soil after Prolonged Addition of Low Levels of Simulated Acid Rain. Appl. Environ. Microbiol. 1998, 64, 2173–2180. [Google Scholar] [CrossRef] [PubMed]
  44. Wang, R.; Dorodnikov, M.; Dijkstra, F.A.; Yang, S.; Jiang, Y. Sensitivities to nitrogen and water addition vary among microbial groups within soil aggregates in a semiarid grassland. Biol. Fertil. Soils 2016, 53, 129–140. [Google Scholar] [CrossRef]
  45. Griffiths, B.S.; Ritz, K.; Ebblewhite, N.; Dobson, G. Soil microbial community structure: Effects of substrate loading rates. Soil Biol. Biochemistry 1998, 31, 145–153. [Google Scholar] [CrossRef]
  46. Frey, S.D.; Knorr, M.; Parrent, J.L.; Simpson, R.T. Chronic nitrogen enrichment affects the structure and function of the soil microbial community in temperate hardwood and pine forests. For. Ecol. Manag. 2004, 196, 159–171. [Google Scholar] [CrossRef]
  47. Strickland, M.S.; Rousk, J. Considering fungal:bacterial dominance in soils—Methods, controls, and ecosystem implications—ScienceDirect. Soil Biol. Biochem. 2010, 42, 1385–1395. [Google Scholar] [CrossRef]
  48. Hobbie, E.A.; Trappe, J.J. Foliar and fungal 15N: 14N ratios reflect development of mycorrhizae and nitrogen supply during primary succession: Testing analytical models. Oecologia 2005, 146, 258–268. [Google Scholar] [CrossRef]
  49. Wei, C.; Yu, Q.; Bai, E.; Lü, X.; Li, Q.; Xia, J.; Kardol, P.; Liang, W.; Wang, Z.; Han, X. Nitrogen deposition weakens plant-microbe interactions in grassland ecosystems. Glob. Chang. Biol. 2013, 19, 3688–3697. [Google Scholar] [CrossRef]
  50. Treseder, K.K. Nitrogen additions and microbial biomass: A meta-analysis of ecosystem studies. Ecol. Lett. 2010, 11, 1111–1120. [Google Scholar] [CrossRef]
  51. Gutknecht, J.L.M.; Field, C.B.; Balser, T.C. Microbial communities and their responses to simulated global change fluctuate greatly over multiple years. Glob. Chang. Biol. 2012, 18, 2256–2269. [Google Scholar] [CrossRef]
Figure 1. Changes in total C (a) and total N storage (b) based on different land-use types in a semiarid grassland (i.e., top 50 cm soil layer). Data are presented as mean ± SE (n = 5). See Table 1 for site abbreviations. Different letters indicate significant differences among soil SOC and STN (i.e., lower-case letters indicate significant difference between soil depth; capital letters indicate significant difference among grazing intensity), and asterisks (*) indicate significant difference between dry season (red color bars) and wet seasons (blue color bars).
Sustainability 15 03434 g001
Figure 2. C (a) and N (b) storage in aboveground biomass, litter, and roots based on different land-use types in semiarid grassland. Data are presented as mean ± SE (n = 5). See Table 1 for site abbreviations. Different letters indicate significant differences among soil SOC and STN (i.e., lower-case letters indicate significant difference between soil depth; capital letters indicate significant difference in grazing intensity), and asterisks (*) indicate significant difference between dry season (red color bars) and wet seasons (blue color bars).
Sustainability 15 03434 g002
Figure 3. Microbial biomass C (a) and N (b) storage and depth profiles in the different land-use types in a semiarid grassland. Error bars indicate SE (n = 5). See Table 1 for site abbreviations. Different letters indicate significant differences among soil SOC and STN (i.e., lower-case letters indicate significant difference between soil depth; capital letters indicate significant difference in grazing intensity), and asterisks (*) indicate significant difference between dry season (red color bars) and wet seasons (blue color bars).
Sustainability 15 03434 g003
Figure 4. Percentage abundances of bacteria (a) and fungi (b) along the depth profiles in different land-use types in semiarid grassland in northern China. Error bars indicate SE (n = 5). See Table 1 for site abbreviations. Different letters indicate significant differences among soil SOC and STN (i.e., lower-case letters indicate significant difference between soil depth; capital letters indicate significant difference among grazing intensity), and asterisks (*) indicate significant difference between dry season (red color bars) and wet seasons (blue color bars).
Sustainability 15 03434 g004
Figure 5. Relationships between plant nutrient concentrations and grazing in the dry season (DS) and wet season (WS). Horizontal bars indicate SE (n = 5). (i.e., ASOC and ATN indicate organic carbon and total nitrogen concentrations in aboveground biomass; LSOC and LTN indicate organic carbon and total nitrogen concentrations in the litter; RSOC and RTN indicate organic carbon and total nitrogen concentrations in roots. ((a DS), dry season; (b WS), wet season,). (a,d) indicate Relationships organic carbon and total nitrogen concentrations in aboveground biomass between grazing in the dry and wet seasons. (b,e) indicate Relationships organic carbon and total nitrogen concentrations in the litter between grazing in the dry and wet seasons. (c,f) indicate Relationships organic carbon and total nitrogen concentrations in the root between grazing in the dry and wet seasons.
Sustainability 15 03434 g005
Figure 6. Changes in soil nutrient pools and microbial pools over time after grazing exclusion (year) (DS, dry season, (a); WS, wet season, (b)). Horizontal bars indicate SE (n = 5).
Sustainability 15 03434 g006
Figure 7. Analysis of the factors driving soil degradation. (a) Correlation diagram (T1 indicates silt; T2 indicates clay; T3 indicates sand) and (b) RDA.
Sustainability 15 03434 g007
Table 1. Characteristics of experimental plots (DS, dry season; WS, wet season).
Land-Use
Type
LocationDominant and Subdominant SpeciespHSand (%)Silt (%)Clay (%)C:N RatioLand-Use HistoryCoverage DS Coverage WS
SD116°28′
42°20′
L. chinensis, S. grandis, C. squarrosa, Artemisia frigida Willd., Salsola collina Pall., Achnatherum sibiricum Keng7.4 ± 0.1 a98.7 ± 0.3 a (WS)
96.0 ± 0.4 a (DS)
1.3 ± 0.3 c (WS)
4.0 ± 0.4 bc (DS)
0.1 ± 0.1 b (WS)
0.1 ± 2.8 b (DS)
10.6 ± 0.6 bFree-grazing, long-term heavy grazing
20-ha plot that has been grazing for more than 50 years
5–15%15–25%
MD116°27′
42°10′
L. chinensis, S. grandis, C. squarrosa, A. frigida, Kochia prostrate Schrad, A. sibiricum7.3 ± 0.1 a93.5 ± 1.1 a (WS)
93.0 ± 0.7 a (DS)
6.5 ± 1.1 c (WS)
7.0 ± 0.7 c (DS)
0.4 ± 0.2 b (WS)
4.3 ± 2.3 b (DS)
12.49 ± 0.3 bFree-grazing, long-term heavy grazing 24-ha plot that has been
grazing since 1989 (About 30 years)
30~35%40–50%
LD116°29′
42°20′
L. chinensis, S. grandis,
C. squarrosa, A. sibiricum, A. frigida, S. collina
7.2 ± 0.1 a90.3 ± 2.4 b (WS)
87.6 ± 0.4 b (DS)
9.7 ± 2.4 b (WS)
12.4 ± 0.4 b (DS)
0.3 ± 0.1 b (WS)
0.1 ± 0.1 b (DS)
32.5 ± 0.6 aFree-grazing, light grazing 24-ha plot that has been
grazing since 1979 (About 20 years)
45–50%50–65%
NG116°16′
42°02′
L. chinensis, S. grandis, A. michnoi, A. sibiricum, C. squarrosa, Carex korshinskyi7.1 ± 0.1 a67.3 ± 2.5 c (WS)
56.0 ± 1.5 c (DS)
30.2 ± 2.4 a (WS)
42.1 ± 0.4 a (DS)
1.9 ± 0.5 a (WS)
1.9 ± 0.1 a (DS)
7.8 ± 0.6 c40-ha plot fenced since 200060~65%70~85%
SD, severe degradation; MD, moderate degradation; LD, light degradation; NG, natural grassland. Values (0–10 cm soil layer) represented as mean ± SE (n = 5) and designated by the same letters in the same column (different grazing intensity) are not significantly different p < 0.05.
Disclaimer/Publisher’s Note: The statements, opinions and data contained in all publications are solely those of the individual author(s) and contributor(s) and not of MDPI and/or the editor(s). MDPI and/or the editor(s) disclaim responsibility for any injury to people or property resulting from any ideas, methods, instructions or products referred to in the content.

