Abstract
Improving the inclusiveness of urban development is crucial to improving the wages of low- and middle-income workers. In this study, we used machine learning to cluster urban labor into low, middle, and high socioeconomic groups in order to analyze the effects of economic agglomeration and compare them with the results, which were classified according to income. The results showed that economic agglomeration has improved the wages of the low and middle socioeconomic groups; the estimated wage spillover effect was 3.9%. By contrast, the estimated result based on the groups classified by a single index of income was 20.3%, which represents an overestimation of the wage spillover effect of economic agglomeration. This method is often used to explain the inclusiveness of China’s urbanization, leading to overestimation. Further mechanism analysis found that the characteristics of the industrial structure affect the change in wage elasticity caused by economic agglomeration, which has a moderating effect on the wages of workers. The differing wage elasticity associated with economic agglomeration is responsible for wage disparities in China.
1. Introduction
According to the seventh census of China, the number of people living in cities has reached 902 million, accounting for 63.89% of the total population. In the next five years, China’s urbanization rate will continue to grow steadily, and the population will be further concentrated in cities. The agglomeration of the economy has played an essential role in increasing income [1,2,3,4]; however, wage disparities within the city are also large [5,6,7]. Rising inequality in earnings is a recurring concern in policy debates in China; simultaneously, “China’s 14th Five-Year Plan” proposes to promote common prosperity more effectively, and it pays attention to both efficiency and fairness, which are the essence of inclusive growth. In brief, if a certain factor has a positive impact on income growth, and relatively poor people benefit more from this factor, then this factor will bring about inclusive growth. Considering the accelerating urbanization and large spatial wage disparities in China, it is particularly important to explore the impact of urbanization on inclusive growth; however, this has barely been studied.
However, the major issue that must be addressed in order to draw a causal interpretation of the impact of economic agglomeration is how to identify low-, middle-, and high-income workers. Different strands of the literature have classified workers by a single indicator of income, which often assigns a larger role to agglomeration effects because the effect contains the impact of other individual differences in the workers on wages, and also cannot reflect the heterogeneity of internal multidimensional metrics between groups [8]. To this end, we used the advantages of unsupervised machine learning algorithms to cluster urban workers by combining the high-latitude indicators of 21 individual characteristics. On this basis, the effect of economic agglomeration on wages was estimated and compared with the estimation results, which were classified according to income.
For many years, studies have focused on income inequality caused by the unbalanced development between urban and rural areas or regions [9,10]. In fact, there are income gaps among farmers [11,12] and urban populations; with the rapid development of urbanization, the imbalance of the income distribution among urban people is more prominent [13,14]. The reason for this is that although urban agglomeration can promote economic growth with externalities as a link to increase income, the differences in the skills, work experience, and other individual characteristics of different groups will lead to inequality. With upgrades in the urban industrial structure, the demand for skill-intensive talents increases, and highly skilled individuals with higher education are more likely to obtain relatively high wages [15,16]. The learning-by-doing effect also causes the accumulation of work experience, resulting in wage differences between groups. Household, registration, discrimination [17,18,19], and information asymmetry in the job market [20,21] hurt the income of urban migrants. The existing studies mainly reflect the problem associated with measuring the income gap between specific groups using one indicator, as it cannot identify group differences caused by other characteristics, which may lead, to a certain extent, to group classification bias. This study uses the advantages of machine learning algorithms to process high-latitude data and re-examines the characteristics of different groups from multiple dimensions, which is more objective than classification based on a single factor, providing a new perspective on studying inequality.
Another source of inequality is the positive externality of the effects of economic agglomeration. Economic agglomeration improves the productivity of labor and generates a positive externality to income [22,23]. The coordinated development of urban characteristics and economic agglomeration, such as urban commuting facilities, human capital levels, and industrial structure, is conducive to the release of economic agglomeration effects. Labor has different preferences in urban and industrial characteristics, resulting in unequal benefits. Studies on the income gap caused by the characteristics of cities and industries have shown that larger urban-scale agglomeration effects and endowment effects have obvious advantages for wage growth premiums when compared with low-scale cities [24,25]. In addition, the spatial form is an important dimension that affects the externality of urban space, and improving infrastructure can alleviate the negative impact of inferior urban forms on workers’ wages [26,27]. The rationalization of the industrial structure significantly affects income distribution; after controlling for time trends and regional characteristics, the industrial structure has been found to significantly reduce income inequality [28,29]. A more extensive stock of human capital produces positive effects, including knowledge spillover and learning sharing. An increase in the concentration of human capital will increase regional income levels [30,31], while an uneven distribution of human capital may widen regional income gaps. Through reviewing the existing research, it has been found that the heterogeneity of urban and industrial characteristics is an important factor in the formation of income gaps; however, few studies discuss the endogenous relationship between economic agglomeration and industrial characteristics.
This paper aimed to contribute to the literature by proposing a general framework that encompasses economic agglomeration to evaluate the unequal wage gains across workers that arise from it. We also explored whether the gains were similar across workers and whether different classification methods led to different results. We tested for these effects by identifying the low- and middle-income and low and middle socioeconomic workers simultaneously and by comparing the magnitude of the estimation results. Understanding whether and how different groups of workers benefit from the spatial concentration and the presence of low and middle socioeconomic workers (low- and middle-income workers) in cities has key policy implications for China’s future urban growth, including whether to accelerate or slow down its tremendous urbanization process.
Based on the above analysis, we adopted a machine learning algorithm to analyze the effects of economic agglomeration on different urban labor groups. In contrast to the existing methods of dividing groups by a single index, we divided the sample into three groups, including a low socioeconomic group, middle socioeconomic group, and high socioeconomic group, based on the advantages of unsupervised machine learning algorithms. The differences were distinguished from the perspective of high-dimensional data, providing a new perspective to analyze the inclusiveness of China’s urbanization.
The possible contributions of this paper are mainly reflected in the following three aspects. First, we assessed the inclusiveness of China’s urbanization, including both economic factors and non-economic factors, which provides a new perspective for the study of China’s urbanization. Second, we introduced an unsupervised clustering machine learning algorithm for economic analysis, which provides a new basis for future labor research and introduces the possibility of observing more economic phenomena. Third, from the perspective of theoretical contributions, we expand the research boundary of wage disparities by using an unsupervised clustering machine learning algorithm to classify workers. In addition, based on the analysis framework of Combes et al. (2020), we further construct a theoretical model of wage income differences between groups and describe the relationship between economic agglomeration and wage disparities through comparative static analysis.
The remainder of the paper is organized as follows. Section 2 establishes a theoretical model and discusses the reasons for the formation of wage gaps between different groups. Section 3 includes a description of the data and the cluster analysis. Section 4 pertains to the model setting and variable definition. Section 5 includes the empirical results and analysis, while Section 6 pertains to the mechanism analysis. Finally, Section 7 and Section 8 include the discussion and conclusions, respectively.
2. Theoretical Analysis
We intended to estimate the impact of economic agglomeration on the wages of low- and middle-income groups. Therefore, we divided urban workers, including migrant workers, into three different groups: low-income, middle-income, and high-income; these groups were called different socioeconomic groups if the labor was clustered by machine learning algorithms. Based on the analytical framework of Combes et al. (2020), a theoretical model was further constructed.
2.1. Production Process
It is assumed that different workers have the same production function within the same group. The output of a city is produced using a labor input composed of three different groups. To characterize the substitutability between groups, it is assumed that the main mechanisms are grasped by considering a CES production function, as shown in Equation (1):
where is the production of different cities and , represents the efficiency of workers in the high-, middle-, and low-income groups. As the low-income group should be more substitutable to the middle-income group than the high-income group, we also expect .
Assuming that the price of the final product is 1, it is possible to solve for wages at the group level using the first-order conditions that determine the optimal use of each type of labor under perfect competition. For instance, the wages of high-income workers can be expressed by the following formula:
where is the wage of the high-income group. Under the same assumption, the average wage of the middle-income group can be obtained as:
The wage of the low-income group can be expressed by Equation (4):
2.2. Transmission Mechanism of Economic Agglomeration and Wage
Economic agglomeration enables workers to earn higher wages by improving the efficiency of production. We assume that the labor efficiency of each group of workers is a function of economic agglomeration and draws on the analytical framework of Combes et al. (2020); the specific functional form is shown in Formula (5):
where is the economic agglomeration and represents the output elasticity of the production efficiency relative to the economic agglomeration of the group . Economic agglomeration ultimately impacts the total output of labor by affecting the productivity of different workers.
By combining the wage function (Equations (2)–(4)) and the economic agglomeration and wage transmission mechanism function (Equation (5)), the impact of economic agglomeration on the wages of high-income groups can be obtained, as shown in Equation (6):
Importantly, Equation (6) directly matches the specifications we estimated, showing that economic agglomeration has a positive spillover effect on the wages of high-income groups. Similarly, it has a similar effect on the wages of middle-income and low-income groups. Thus, the theoretical analysis shows that economic agglomeration has an overall positive wage spillover effect. These are important conclusions from a policy perspective, for instance, concerning the economic agglomeration that would enhance labor productivity and affect wage gaps between workers. Based on the above analysis, we put forward hypothesis 1:
Hypothesis 1.
The development of economic agglomeration can increase the wages of workers.
On this basis, we use the ratio of the wages of different types of workers to measure the wage gap, where is the wage gap between urban low-income and high-income groups; is the wage gap between urban low-income and middle-income groups; and is the wage gap between urban middle-income and high-income groups. Combined with , the wage gap between low- and high-income groups derived from economic agglomeration is shown in Equation (7):
where represents the ratio of the output of the low-income group to that of the middle-income group and is assumed to be less than 1. Therefore, whether the result of Equation (7) is positive or negative is determined by the difference in the production efficiency, which is related to the elasticity of economic agglomeration between the low- and high-income groups. According to the conclusion of the theoretical model, economic agglomeration causes wage spillover effects by improving production efficiency. In addition, the elasticity of production efficiency specific to the worker’s group is the reason for wage disparities. Groups with relatively high elasticity will share more development bonuses as a result of economic agglomeration. Based on the above analysis, we put forward hypothesis 2:
Hypothesis 2.
The characteristics of structural transformation will affect the distribution of wages.
The result of the derivation of the wage gap between the low-income group and the middle-income group with economic agglomeration is shown in Equation (8), and the conclusion is consistent with Equation (8):
Interestingly, it is difficult to determine which labor groups have a greater impact on the labor productivity of economic agglomeration at the theoretical level. If the effect of economic agglomeration on the production efficiency of low-income workers is greater than that of those with high income, the low-income worker shares a greater dividend of urbanization. Urbanization must show inclusiveness; otherwise, it does not have the characteristic of inclusive growth. Moreover, one may also obtain different results if different indicators are used to classify labor. Here, we wish to evaluate whether China’s urbanization is inclusive or not; based on the above analysis, we put forward hypothesis 3, which states that different classification methods will obtain different results. This hypothesis must be further verified by empirical analysis.
Hypothesis 3.
Different classification methods will influence the results with respect to the effect of economic agglomeration on wages.
3. Data and Cluster Analysis
3.1. Data Interpretation
The microdata for the empirical analysis in this paper were taken from two datasets of urban households and migrant households in the fifth round of the China Household Income Survey Project (CHIP) in 2013. The microdata includes 117 cities in 14 provinces in China, which allowed us to consider the different groups of workers identified by their income or socioeconomic status. The unsupervised machine learning algorithm used in this study is based on the sum of squares of errors, including 21 individual characteristic indicators (as shown in Table 1), e.g., work nature, living conditions, social security, etc. We removed the samples with missing values and retained 6189 samples. There were 788 samples with an agricultural household registration, 4519 samples with an urban household registration, and 882 samples with a residential household registration. The macro-data were obtained from “The China Urban Statistical Yearbook”, “China Regional Economic Statistical Yearbook”, and “China Urban Construction Statistical Yearbook”. Table 1 shows the descriptive statistics for all of the variables used in our empirical research.

Table 1.
Descriptive analysis of variables.
3.2. Unsupervised Clustering
The existing literature concerning group classification assumes the indicators of the classification in advance, which is characteristic of supervised methods. However, unsupervised machine learning algorithms can cluster the sample data from multiple dimensions without presupposing specific indicators. The purpose of this paper was to distinguish between groups of urban workers from multiple dimensions and classify the groups by synthesizing a variety of indicators. The advantages of unsupervised machine learning algorithms make this possible [8].
Among the clustering methods, one of the most popular is k-means clustering; however, it has two shortcomings. The first is that it only analyzes continuous quantitative variables, and the second is that it is sensitive to extreme values. These extreme values may seriously distort the average value of the cluster and affect the allocation of other objects to the cluster. In contrast, PAM (partitioning around medoids) can process mixed data, both quantitative and qualitative [32], attempts to minimize the dissimilarities of all observations to the nearest medoid, and can be used with arbitrary distances. We used the Ward distance to minimize the dissimilarity; the Ward method minimizes the total within-cluster variance
where is the mean of the points in cluster and is the number of clusters.
In addition, there is still an important issue to address: the selection of an optimal number of clusters, which is key to the results. We mainly used the elbow method to judge the optimal number of clusters [33]. As the number of clusters is open, the appropriate cluster number is selected, referring to the actual economic background. The PAM calculation process contains five steps [32].
The realization tool used for clustering was Matlab R2016. In terms of data processing, to eliminate the influence of extreme values on the clustering results as much as possible, the data were normalized before the cluster analysis; in addition, the data were not standardized to preserve the weight relationship between different indicators. The number of clusters was determined using the elbow method, and the PAM algorithm was used for the unsupervised cluster. According to the elbow method, when the number of sample clusters was three, the reduced rate of the sum of squared errors of the clusters was the largest, indicating that the value reached a valid number of clusters, as shown in Figure 1. Finally, the samples were divided into three groups.
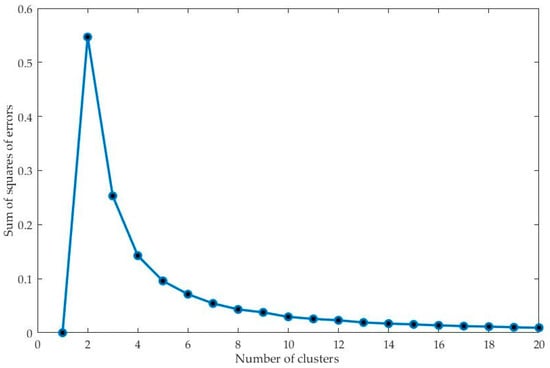
Figure 1.
Optimal number of clusters according to the Elbow Method.
The characteristics of the three different groups based on the PAM algorithm are shown in Table 2 and Figure 2. According to the OECD’s definition, the digital divide refers to individuals with different social and economic levels. This paper defines three groups as the low socioeconomic group, middle socioeconomic group, and high socioeconomic group. With the exception of the types of social assistance, the mean of each index showed significant differences between the groups. Work experience, health status, and the nature of household registration did not show significant differences between the middle and high socioeconomic groups, and the types of medical insurance and endowment insurance were not significantly different between the middle and low socioeconomic groups. From the perspective of household registration distribution, agricultural household registration accounted for 17.13%, 26.02%, and 56.85% of the high, middle, and low socioeconomic groups, indicating that agricultural workers are still mainly concentrated in the low socioeconomic group. The average age of the high, middle, and low socioeconomic groups was 38.45, 37.21, and 41.41 years old, respectively, reflecting an obvious aging trend in the low socioeconomic group. In addition, in the low socioeconomic group, the frequency of changing jobs (mean 1.96) and working time (mean 2.49) was significantly higher than in the middle and high groups, while the types of social security (mean 1.97) and health status (mean 1.93) were significantly lower than those of the middle and high groups. These results show that the low socioeconomic group faces a more severe situation.
Table 2.
Descriptive statistics based on PAM algorithm cluster.
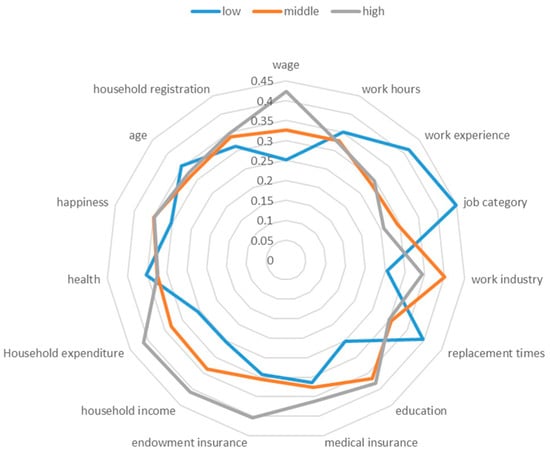
Figure 2.
PAM results: characteristics of different groups.
Other key indicators for the three groups can be summarized as follows. The low socioeconomic group accounted for 27.69% of the total sample: the average years of education was 8.65 years, the average of happiness was 2.32, and the proportion of family minimum living security expenditure in disposable income was 54.38%. The middle socioeconomic group accounted for 30.99% of the total sample: the average years of education was 12.63, the average of happiness was 2.68, and the proportion of family minimum living security expenditure in disposable income was 48.88%. The high socioeconomic group accounted for 41.32% of the total sample: the average years of education was 13.16, the average of happiness was 2.67, and the proportion of family minimum living security expenditure in disposable income was 48.77%. By comparing the results of the two classifications, we found that the low and middle socioeconomic groups fell behind the high socioeconomic group in terms of both the economic and non-economic factors. It is essential to solve their problems through economic development or policy adjustment.
4. Empirical Model and Variable
4.1. Empirical Model
Based on the research purpose, the middle socioeconomic group and the low socioeconomic group were combined into a low and middle socioeconomic group. Based on the research [34], the model in this paper is set as follows:
where is wage; represents economic agglomeration; indicates whether the worker is from the low and middle socioeconomic groups (low- and middle-income groups); is the control variable; and is the random disturbance term.
The mechanism test model is set as follows:
where represents the mechanism variable, which contains industrial specialization and the advanced industrial structure. The formula for the calculation of the urban industrial structure is shown in Formula (12):
where and represent industrial specialization and the advanced industrial structure, respectively [6,35]; indicates the industry type; represents employees in a certain industry; represents the total employees in the city; ; ; is a space vector with the proportion of the added value of the three industries in GDP as the coordinate , , .
4.2. Variable
4.2.1. Dependent Variable
In this work, the dependent variable was wage, including hourly wages and annual wages. Hourly wage was the dependent variable of the robustness test, as it is generally considered to be a better response variable for efficiency wages [36].
4.2.2. Independent Variable
The independent variable was economic agglomeration. Drawing on the methods in the existing literature, the employment per unit area of the urban municipal districts was used as a measure of economic agglomeration [37]. The low and middle socioeconomic groups were defined in two ways. First, using the clustering results of the machine learning algorithm, the low socioeconomic group and the middle socioeconomic group were combined to form a low and middle socioeconomic group, accounting for 58.68% of the total sample. The second method was to use the urban household income values listed in the “China Statistical Yearbook” from 2013. The lowest, lower, lower–middle, middle, and upper–middle groups were defined as the low- and middle-income group, accounting for 52.77% of the total sample.
4.2.3. Other Variables
The control variables included work experience, the square of work experience, years of education, health status, frequency of job changes, gender, marriage status, urban human capital level, and per capita road area [34]. The instrumental variables included the employment density in 2003 and the population density in 1984. The employment density in 2003 and the population density in 1984 were calculated in the same way as the economic agglomeration [38]. The mechanism variables included industrial specialization and the advanced industrial structure. The calculation method is shown in Formula (12).
5. Empirical Results and Analysis
5.1. Basic Regression Results
Column (1) in Table 3. shows the regression result after the clustering of the machine learning algorithm. It can be interpreted as follows: under the control of other factors affecting wage, such as individual, industry, and regional characteristics, the estimation between economic agglomeration and whether a worker is from the low and middle socioeconomic group is 0.039. This indicates that an increase in economic agglomeration by one unit increases the annual wage of the low and middle socioeconomic groups by 3.9%. The development of economic agglomeration improves the wages of workers in the low and middle socioeconomic groups, which is, to a certain extent, inclusive.
Table 3.
The results of the impact of economic agglomeration on wage disparities.
Column (2) shows the regression result after classification according to income. The wage elasticity of low- and middle-income workers was 20.3%, which was significantly higher than the former. By comparing the estimated results, it was found that, firstly, whether workers were classified by multiple indicators or a single indicator of income, economic agglomeration significantly improved the wages of low- and middle-income workers, which suggests that economic agglomeration is inclusive in China. Secondly, the striking result from Table 3. is that the estimations do not seem to be consistent; the effect estimated by classification according to income was larger. Some evidence of the inclusiveness of urbanization in China was found; however, the inclusiveness does not seem to be as wide-ranging as we had thought.
Rising wage inequality is a recurring concern in the policy debate in China. There are a number of studies that discuss the relationship between economic agglomeration and wage disparities. Our basic results provide a new perspective to observe the impact of China’s urbanization on wages, which includes the role of the non-economic profits that are available to workers. The growth of non-economic factors, such as social security, lags behind the growth rate of economic factors.
5.2. Robustness Analysis
5.2.1. Substitute Dependent Variable
The productivity returns of workers can be better reflected by hourly wage, as China’s labor market security is not perfect, particularly for workers in the low socioeconomic group. As the increase in their annual salary may be due to the extension of working hours, to verify the generality of our conclusions, we replaced annual income with hourly wages; the results are shown in Table 4. Specifically, Column (1) shows the regression result of the PAM clustering algorithm. The estimated coefficient between economic agglomeration and the low and middle socioeconomic group was 0.055, which was significant at the 1% level. Column (2) shows the regression results according to classification by income; the elasticity of the interaction term between economic agglomeration and the low- and middle-income group was 19.4%, which is significantly larger than the result in Column (1), indicating that the conclusions of the basic model were robust to a certain extent.
Table 4.
Robustness test results obtained by substituting hourly wage as the dependent variable.
5.2.2. Quantile Regression
We investigated the impact of economic agglomeration on the conditional expectations of wages through OLS regression, which is actually mean regression. It cannot reflect the impact of economic agglomeration on the entire conditional distribution of wages. Therefore, we used quantile regression to further explain the complete situation of the impact of economic agglomeration on wages. Table 5 shows the impact of the interaction between economic agglomeration and the low and middle socioeconomic group (and low- and middle-income group) on the conditional distribution of wages. The results in the first row are the estimation results based on the PAM algorithm, while the results in the second row are based on classification by income. At the different quantile levels, economic agglomeration significantly improved the wages in the low and middle groups, and the estimation results based on a single indicator of income were still markedly higher than the multi-indicator clustering results, which supports the conclusion of the basic model.
Table 5.
Robustness test results by quantile regression.
5.2.3. Instrumental Variable
Although the basic model controlled the variables that affect wage as much as possible, there could still be a problem with missing variables, such as economic development, which affects the employment locations of different groups of workers. Cities with high agglomeration levels may have higher wages and thus attract high-level groups to agglomerate. This may lead to non-uniform parameter estimates of the basic model. To solve the above endogeneity problems, we used the employment density of municipal districts in 2003 and the population density in 1984 as the instrumental variables. The reasons for choosing the 2003 data as an instrumental variable are as follows: Firstly, the data—with a lag of ten years—were related to the values of economic agglomeration in 2013, while the wages in 2013 did not correlate with the data from 2003. Secondly, based on the availability of the data, the statistics for employment in various industries in 2003 were more comprehensive, which was conducive to accurately calculating the employment density of each city. The reason for choosing the population density in 1984 as another instrumental variable was based on the availability of the data. Columns (1) and (3) in Table 6 report the estimated results after classification based on the PAM algorithm, and Columns (2) and (4) show the results classified according to income. The instrumental variable estimation results showed that the basic model has a certain robustness.
Table 6.
Robustness test results using instrumental variables.
6. Mechanism Analysis
We demonstrated that economic agglomeration has spillover effects on the wages of low and middle socioeconomic groups; these conclusions are robust and consistent with the theoretical analysis. Therefore, how does economic agglomeration lead to spillover effects on the wages of low and middle socioeconomic groups? Moreover, what is the intermediate mechanism? Our theoretical analysis showed that the elasticity of the production efficiency specific to the groups is the reason for wage disparities, and groups with relatively high elasticity will share more development bonuses as a result of economic agglomeration. Unfortunately, we cannot directly obtain the elasticity of the production efficiency between different groups at the individual level. However, according to the existing research, the urban industrial structure has external characteristics, which will affect the production efficiency of different workers. Therefore, we tried to explain the mechanism from the perspective of urban industrial characteristics.
Column (1) in Table 7 shows the regression result based on the PAM algorithm. The result indicates that the interaction coefficients of industrial specialization and the effects of economic agglomeration on low and middle socioeconomic groups are significantly positive. Column (3) shows the result for the advanced industrial structure, which also has a positive effect. Columns (2) and (4) in Table 7 show the regression results classified according to the income standard published in the “China Statistical Yearbook”. These results show that the wages of the low-and middle-income groups are also positively affected by the urban industrial structure. It is evident that the industrial structure can explain the wage spillover effect of economic agglomeration.
Table 7.
Mechanism test results using structural transformation.
We now turn to the inclusiveness of urbanization in China. As shown in Table 7, the results estimated according to the PAM algorithm were relatively small. The inclusiveness was reduced when the differences between workers were taken into account. A possible reason for this is that urbanization does increase workers’ income when we only consider their wage, but after considering social security and other factors, urbanization may not have such an obvious positive effect. To summarize, economic agglomeration has improved the income of the low- and middle-income groups through the effect of industrial structure; however, the results obtained after dividing the groups based on a single indicator of income were overestimated to a certain extent.
7. Discussion
Different strands of the literature have shown that the urbanization of China is an important factor in reducing poverty; in particular, scholars have reached a consensus on the small urban–rural income gap [39,40]. With economic and social development, social security and employment welfare have become important indicators to judge the quality of labor employment. The disparities between different labor forces are not only reflected in the income gap; therefore, the impact of economic agglomeration on wage distribution from the perspective of income may overestimate or underestimate the role of China’s urbanization. For this reason, we attempted to use a machine learning algorithm to identify workers in multiple dimensions.
Some striking results can be observed from Table 8. Firstly, the wage, education, and health of low- and middle-income workers were lower; this result held for all of the classification methods. However, the difference was smaller in the multi-indicator classification results. This shows that China’s urbanization is unbalanced [41,42,43]. Based on the classification results of the machine learning algorithm, it was found that this imbalance is manifested in many aspects, such as level of education. In particular, we found that health status also showed an imbalance; thus, we need to pay more attention to the health status of low and middle socioeconomic workers. The second noticeable observation from Table 8 is that the employment environments of low and middle socioeconomic workers were more severe, their work was relatively unstable, and their aging was more serious. In general, our conclusion is that the imbalance in China’s urbanization is multifaceted.
Table 8.
The results of mean value in different groups.
We now turn to the magnitude of the estimated effects in the different groups of workers. Based on our classification results, we found that economic agglomeration improved the imbalance of urbanization in China; this resulted in a significant alteration of wage inequality, in agreement with previous studies [7,44]. The effect was 20.3% from the perspective of wage only, and 3.9% from multiple perspectives. One possible explanation for these results is that the marginal utility of welfare conducted by economic agglomeration is less than the marginal effect of wages; this is also supported by the existing research. These results show that although China’s rapid urbanization has improved income inequality, it still lags behind in labor market norms [45,46]. Therefore, the impact is smaller when we estimate China’s urbanization from multiple perspectives; this result is our novel discovery.
From the perspective of the structural transformation, we explained the impact mechanism from two aspects: the specialization externalities effect and the advanced externalities effect. The specialization externalities focus on the question of how to develop comparative advantage industries in a region, while the advanced externalities pay attention to the issue of how to simulate agglomeration economies by optimizing industrial distribution in space [47,48,49]. Our theoretical analysis and empirical results suggest that the structural transformation—whether by industry specialization or advanced industrial structure—presents a positive effect on the wage elasticity of low and middle socioeconomic groups (low- and middle-income groups). Meanwhile, the literature also reports evidence that individual characteristics affect workers’ rewards from urbanization [50,51]. As shown in our theoretical analysis, the reason why economic agglomeration has a positive effect on the wage elasticity of low and middle socioeconomic groups can be mainly attributed to individual characteristics. The transformation of the industrial structure will lead to different demands for workers, which will lead to different wage spillover effects caused by economic agglomeration.
A clear limitation of this study Is that although the clustering contained more dimensions of individual characteristics, it was generated using data. This made it difficult to accurately describe the economic meaning of each cluster, as the deeper explanations of reasons and motives were missing. This method will be effective for future research exploring deeper reasoning and, for instance, engaging in focus group discussions with the different types of workers. Another limitation lies in the fact that although the sample was large and comprised workers from a high regional coverage in China, it was still only a section of the population; therefore, the representativeness could still be improved.
8. Conclusions
In contrast to the previous studies, we considered the multidimensional characteristics of workers; thus, the results we observed are relatively comprehensive. This is important for exploring the law of urbanization. In addition, we applied machine learning algorithms to the area of wage disparities and provided a method for group classification that does not assume the classification indicators in advance; all of the classifications are determined by the data, which is conducive to a greater variety of research perspectives. We used the PAM algorithm and comprehensively considered the values of 21 individual indicators to cluster urban workers into three groups, including a low socioeconomic group, middle socioeconomic group, and high socioeconomic group. In addition, we compared the regression results based on the PAM algorithm with the results of the classification according to income.
Our conclusions include three aspects. First, the clustering results showed that, in addition to significant differences in wages, there are also considerable differences in social security and living standards among urban workers. We also found that migrant workers are mainly distributed in the low socioeconomic group, accounting for 56.85%. The level of health and social security of this group is relatively low, and what is more serious is that the aging trend is particularly obvious. Second, the wages of the low and middle groups show the spillover effect of economic agglomeration, and groups divided by a single indicator of income overestimate the spillover effect. The effects of economic agglomeration become smaller when considering multidimensional indicators. Third, the industrial structure has a positive influence on the effects of economic agglomeration on the low and middle groups, which helps to amplify these effects. The different returns to urbanization contribute to the role of different industrial characteristics in shaping the wage gaps in urban China.
Our findings have important policy implications. First, the government should continue to promote the transfer of agricultural populations to cities and enable more people to share the fruits of economic development, and strengthen its role in increasing income and narrowing the income gap. In particular, it should pay more attention to the improvement of the human capital level, social capital level, and psychological capital level of the low- and middle-socioeconomic groups. Second, the Chinese government should promote a people-oriented new urbanization strategy while paying attention to disparities other than income, speed up the reform of the household registration system, and improve the social security level of low- and middle-socioeconomic groups. It should pay attention to both the efficiency and fairness of development. Third, the local governments should optimize their industrial structure and release more structural dividends and accelerate the transformation and upgrading of the industry by improving the industrial infrastructure to constantly improve the wage income and welfare level. Fourth, it is necessary to focus on the aging challenge of the low socioeconomic group and actively respond to the problem of the solidification of the income classes caused by aging. It should strengthen the equalization of public services for the low socioeconomic group and pay more attention to the equality of educational opportunities for their children.
Author Contributions
Conceptualization, Z.G.; writing—original draft preparation, Z.G.; supervision, Z.W. and M.Z. All authors have read and agreed to the published version of the manuscript.
Funding
This research was funded by National Natural Science Foundation of China, (71573197; 71973100).
Institutional Review Board Statement
Not applicable.
Informed Consent Statement
Not applicable.
Data Availability Statement
Not applicable.
Conflicts of Interest
The authors declare no conflict of interest.
References
- Roca, J.; Puga, D. Learning by working in big cities. Rev. Econ. Stud. 2017, 84, 106–142. [Google Scholar] [CrossRef]
- Wen, M. Relocation and agglomeration of Chinese industry. J. Dev. Econ. 2004, 73, 329–347. [Google Scholar] [CrossRef]
- Zhou, D.; Liu, Y.; Ren, X.; Yan, C.; Shi, Y. Economic agglomeration and product quality upgrading: Evidence from China. J. Chin. Econ. Bus. Stud. 2022, 20, 377–395. [Google Scholar] [CrossRef]
- Sun, F.; Mansury, Y.S. Economic impact of high-speed rail on household income in China. Tran. Res. Rec. 2016, 2581, 71–78. [Google Scholar] [CrossRef]
- Combes, P.P.; Démurger, S.; Li, S. Unequal Migration and Urbanization Gains in China. J. Dev. Econ. 2020, 142, 102328. [Google Scholar] [CrossRef]
- Xing, C.; Li, S. Residual wage inequality in urban China, 1995–2007. China Econ. Rev. 2012, 23, 205–222. [Google Scholar] [CrossRef]
- Chen, A.; Dai, T.; Partridge, M.D. Agglomeration and firm wage inequality: Evidence from China. J. Reg. Sci. 2021, 61, 352–386. [Google Scholar] [CrossRef]
- Zeng, Q.; Chen, X. Identification of urban-rural integration types in China–an unsupervised machine learning approach. China Agric. Econ. Rev. 2022; ahead-of-print. [Google Scholar] [CrossRef]
- Yankow, J.J. Why do cities pay more? An empirical examination of some competing theories of the urban wage premium. J. Urban Econ. 2006, 60, 139–161. [Google Scholar] [CrossRef]
- Au, C.C.; Henderson, J.V. How migration restrictions limit agglomeration and productivity in China. J. Dev. Econ. 2006, 80, 350–388. [Google Scholar] [CrossRef]
- Morduch, J.; Sicular, T. Politics, growth, and inequality in rural China: Does it pay to join the Party? J. Public Econ. 2000, 77, 331–356. [Google Scholar] [CrossRef]
- Du, Y.; Park, A.; Wang, S. Migration and rural poverty in China. J. Comp. Econ. 2005, 33, 688–709. [Google Scholar] [CrossRef]
- Wang, C.; Wan, G.; Yang, G. Income Inequality in the people’s Republic of China: Trends, Determinants, and Proposed Remedies. J. Econ. Sur. 2015, 28, 99–123. [Google Scholar]
- Han, J.; Liu, R.; Zhang, J. Globalization and wage inequality: Evidence from urban China. J. Int. Econ. 2012, 87, 288–297. [Google Scholar] [CrossRef]
- Dequiedt, V.; Zenou, Y. International Migration, Imperfect Information, and Brain Drain. J. Dev. Econ. 2013, 102, 62–78. [Google Scholar] [CrossRef]
- Fleisher, B.M.; Hu, Y.; Li, H.; Li, H. Economic transition, higher education and worker productivity in China. J. Dev. Econ. 2011, 94, 86–94. [Google Scholar] [CrossRef]
- Meng, X.; Zhang, J. The two-tier labor market in urban China: Occupational segregation and wage differentials between urban residents and rural migrants in Shanghai. J. Comp. Econ. 2001, 29, 485–504. [Google Scholar] [CrossRef]
- Song, Y. What should economists know about the current Chinese hukou system? China Econ. Rev. 2014, 29, 200–212. [Google Scholar] [CrossRef]
- Zhang, J.; Jin, S.; Li, T.; Wang, H. Gender discrimination in China: Experimental evidence from the job market for college graduates. J. Comp. Econ. 2021, 49, 819–835. [Google Scholar] [CrossRef]
- Broadberry, S.; Ghosal, S.; Proto, E. Anonymity, Efficiency Wages and Technological Progress. J. Dev. Econ. 2017, 127, 379–394. [Google Scholar] [CrossRef]
- Lee, L. Decomposing wage differentials between migrant workers and urban workers in urban China’s labor markets. China Econ. Rev. 2012, 23, 461–470. [Google Scholar] [CrossRef]
- Liu, Y.; Lu, M.; Xiang, K. Balance through agglomeration: A race between geography and policy in China’s regional development. China World Econ. 2018, 26, 72–96. [Google Scholar] [CrossRef]
- Zhang, S.; Bani, Y.; Selamat, A.I.; Ghani, J.A. Impact of Industrial Agglomeration on China’s Residents’ Consumption. Sustainability 2022, 14, 4364. [Google Scholar] [CrossRef]
- Combes, P.P.; Démurger, S.; Li, S. Migration Externalities in China. Eur. Econ. Rev. 2015, 76, 152–167. [Google Scholar] [CrossRef]
- Peng, S. Urban scale and wage premium: Evidence from China. J. Asia Pac. Econ. 2019, 24, 468–480. [Google Scholar] [CrossRef]
- Han, J.; Li, S. Internal Migration and External Benefit: The Impact of Labor Migration on the Wage structure in Urban China. China Econ. Rev. 2017, 46, 67–86. [Google Scholar] [CrossRef]
- Xiao, H.; Zheng, X.; Xie, L. Promoting pro-poor growth through infrastructure investment: Evidence from the Targeted Poverty Alleviation program in China. China Econ. Rev. 2022, 71, 101729. [Google Scholar] [CrossRef]
- Steckel, R.H.; Moehling, C.M. Rising inequality: Trends in the distribution of wealth in industrializing New England. J. Econ. His. 2001, 61, 160–183. [Google Scholar] [CrossRef]
- Shi, J.; Liu, H. Wage increase and innovation in manufacturing industries: Evidence from China. J. Asia Pac. Econ. 2022, 27, 173–198. [Google Scholar] [CrossRef]
- Liu, Z. Human Capital Externalities in Cities: Evidence from Chinese Manufacturing Firms. J. Econ. Geogr. 2014, 14, 621–649. [Google Scholar] [CrossRef]
- Fraumeni, B.M.; He, J.; Li, H.; Liu, Q. Regional distribution and dynamics of human capital in China 1985–2014. J. Comp. Econ. 2019, 47, 853–866. [Google Scholar] [CrossRef]
- Graskemper, V.; Yu, X.; Feil, J. Farmer Typology and Implications for Policy Design—An Unsupervised Machine Learning Approach. Land Use Policy 2021, 103, 105328. [Google Scholar] [CrossRef]
- Madhulatha, T.S. An overview on clustering methods. IOSR J. Eng. 2012, 2, 719–725. [Google Scholar] [CrossRef]
- Hu, W.; Zhang, J.H. Density, distance and migrant workers’ wages: Premium or discount? Econ. Res. 2021, 56, 167–185. [Google Scholar]
- Fu, L. Empirical Study on the Relationship between China’s Advanced Industrial Structure and Economic Growth. Stat. Res. 2010, 27, 79–81. [Google Scholar]
- Xing, C.; Zhang, J. The preference for larger cities in China: Evidence from rural-urban migrants. China Econ. Rev. 2017, 43, 72–90. [Google Scholar] [CrossRef]
- Behrens, K.; Pokrovsky, D.; Zhelobodko, E. Market size, occupational self-selection, sorting, and income inequality. J. Reg. Sci. 2018, 58, 38–62. [Google Scholar] [CrossRef]
- Ciccone, A.; Hall, R.E. Productivity and the Density of Economic Activity. Am. Econ. Rev. 1996, 86, 54–70. [Google Scholar]
- Liu, J.; Peng, P.; Luo, L. The relation between family socioeconomic status and academic achievement in China: A meta-analysis. Edu. Psy. Rev. 2020, 32, 49–76. [Google Scholar] [CrossRef]
- Li, C.; Gibson, J. Rising regional inequality in China: Fact or artifact? World Dev. 2013, 47, 16–29. [Google Scholar] [CrossRef]
- Cao, S.; Lv, Y.; Zheng, H.; Wang, X. Challenges facing China’s unbalanced urbanization strategy. Land Use Policy 2014, 39, 412–415. [Google Scholar] [CrossRef]
- Wang, X.; Wan, T.; Yang, Q.; Zhang, M.; Sun, Y. Research on innovation non-equilibrium of Chinese urban agglomeration based on SOM neural network. Sustainability 2021, 13, 9506. [Google Scholar] [CrossRef]
- Qiu, L.; Zhao, D. Urban inclusiveness and income inequality in China. Reg. Sci. Urban Econ. 2019, 74, 57–64. [Google Scholar] [CrossRef]
- Adams, S.; Klobodu, E.K.M. Urbanization, economic structure, political regime, and income inequality. Soc. Ind. Res. 2019, 142, 971–995. [Google Scholar] [CrossRef]
- Fleisher, B.M. Labor laws and regulations in China. China Econ. Rev. 2003, 14, 426–433. [Google Scholar] [CrossRef]
- Fu, S.; Liao, Y.; Zhang, J. The effect of housing wealth on labor force participation: Evidence from China. J. Hous. Econ. 2016, 33, 59–69. [Google Scholar] [CrossRef]
- Tan, X.; Yu, W.; Wu, S. The impact of the dynamics of agglomeration externalities on air pollution: Evidence from urban panel data in China. Sustainability 2022, 14, 580. [Google Scholar] [CrossRef]
- Yin, J.; Yang, Z.; Guo, J. Externalities of Urban Agglomerations: An Empirical Study of the Chinese Case. Sustainability 2022, 14, 11895. [Google Scholar] [CrossRef]
- Yu, Y.; Zhang, Y.; Miao, X. Impacts of dynamic agglomeration externalities on eco-efficiency: Empirical evidence from China. Int. J. Environ. Res. Public Health 2018, 15, 2304. [Google Scholar] [CrossRef]
- Ehrl, P.; Monasterio, L. Spatial skill concentration agglomeration economies. J. Reg. Sci. 2021, 61, 140–161. [Google Scholar] [CrossRef]
- Gambardella, A.; Giarratana, M.S. Localized knowledge spillovers and skill-biased performance. Str. Ent. J. 2010, 4, 323–339. [Google Scholar] [CrossRef]
Disclaimer/Publisher’s Note: The statements, opinions and data contained in all publications are solely those of the individual author(s) and contributor(s) and not of MDPI and/or the editor(s). MDPI and/or the editor(s) disclaim responsibility for any injury to people or property resulting from any ideas, methods, instructions or products referred to in the content. |
© 2023 by the authors. Licensee MDPI, Basel, Switzerland. This article is an open access article distributed under the terms and conditions of the Creative Commons Attribution (CC BY) license (https://creativecommons.org/licenses/by/4.0/).