Abstract
According to the national and European Community legislation and the quality control regulations for wine, a series of analyses are carried out by government agencies on locally produced wines in Greece. The present study examines the analyses of dry white wines produced in the regions of Ioannina in the Epirus region and the Ionian Islands, correlating them with the climatic conditions of each region. The purpose of this correlation is to evaluate the effect of the local climate on the wines’ individual characteristics, as identified by the analyses. Another crucial objective of this study is the evaluation of the effects caused by the continual changes in climate on these characteristics, as determined by the analyses. Results indicate that the prevailing climatic conditions, in conjunction with climate change, can affect all the parameters evaluated in the analyses for the wines produced in the two regions under this study.
1. Introduction
In the last years, the need to implement a modern production process that incorporates a sustainable approach as much as possible in food production and agriculture, in general, has gradually become a matter of urgency, which is a common view in the Common Agricultural Policy framework [1,2]. The definition of sustainability is rather complicated due to the special environmental issues of the different wine-growing regions [3]. Sustainability can be understood as the process of reducing residues in wine and its subsequent treatment in the elaboration of wine’s characteristics. Within the production chain, this implies adequate management of resources in terms of water and energy efficiency, both in vineyards and wineries. Sustainability will grow in importance in people’s minds since climate change is a reality in the 21st century.
Consumers’ demands evolve over time under the influence of various factors in each country [4]. In addition to the pressures exerted by consumer preferences on the production processes, other factors impose their effects, mainly the evolving climate change, which affects human activities and the food production process. In relation to climate change, the prevailing opinion in the scientific literature [5] is that the observed global increase in temperature over the last 100 years is greater than the expected estimates of natural climate changes, while there is no doubt that these climate changes are human-influenced. The EU institutions also agree characteristically on the same point of view as the European Environment Agency [6] points out: “Climate change is one of the most important challenges of our time. Its effects are tangible across the planet, affecting people, nature and the economy”.
Climate change has the potential to significantly change viticulture internationally. Εxtreme temperatures associated with future climate change (e.g., droughts, heat waves, and storms) are also expected to adversely affect wine production, but the impacts to date remain largely unquantified. Understanding the impacts and the extent of climate change on ecosystems is crucial to sustainable development. Given that climate change is expected to adversely affect global wine production, sustainable production of wine in the future will be even more difficult to achieve, making climate mitigation even more important [7].
In this context, the present research examines the analyses conducted by the Greek National Quality Control Agency on specific attributes of white wines (total alcoholic strength, actual (recovered) alcoholic strength, total acidity, volatile acidity, total sulfite, pH, and residual sugars) produced in the regions of Ioannina (Epirus) and the Ionian Islands by correlating them with the climatic conditions of each region. The purpose of this correlation is to evaluate the effect of the local climate on the wines’ individual characteristics, as identified in the analyses. The object of this study is the evaluation of the effects caused by the continual changes of climate on these characteristics, as determined by the analyses. In the estimates, wine production is not only considered in terms of the winemaking stage but as an agri-food chain, including all the components of the production as a whole.
It should be noted that, in the agri-food chain of grape production (and subsequently of wine), relevant studies conclude that the climatic characteristics of each region where the production process takes place together with the soil and geomorphological characteristics resonate and influence wine quality. Other regional characteristics apart from climate are generally stable in relation to time [8]. Similarly, other studies highlight that climate and viticulture are undoubtedly strongly linked, and, therefore, knowledge of regional climate conditions is of utmost importance when deciding upon the best varietal choice, the sustainability of grape/wine production, and the general quality of the wines produced [9]. Thus, the weather patterns of individual regions determine their suitability for growing different grape varieties, and in turn, the kind of wine that can be produced there. Throughout time, the main goal of wine production has been to make choices (about varieties, regions, etc.) that would produce wines with high-quality characteristics and, thus, achieve sustainability in the wine industry [10].
Research around the globe in various places correlates specific climatic conditions with different features of wines from specific regions [11]. In the Bordeaux region of France, in particular, it has been established that the climatic conditions prevailing in each growing season affect (to a different extent per variety) the sugar content of the grapes and, therefore, the quality of the wines produced [12]. Similar conclusions have resulted from studies in the western USA and Italy, some of which reveal that the sugars/acids relationship is affected (to a different extent per variety) by the climatic conditions that prevail in the grape production area. It is generally considered that the best quality wine is produced in close correlation with the climatic conditions, which include relatively higher temperatures and lower relative humidity in the growing area of the vineyards [13,14].
The relationship between the particular characteristics and the quality of the wine produced is very strong and is dependent on the prevalent climatic conditions where the vines are grown. Thus, the following question was justly posed: “What is expected to happen when climate change alters the prevailing climatic conditions?” The answer often given is that changes in regional weather patterns significantly affect wine quality [15]. A relevant study in Greece showed that under the conditions of climate change, i.e., under conditions of greater lack of water, non-irrigated vineyards presented increased sugars and malic acid breakdown. In addition, a severe lack of water was beneficial in terms of the concentration of anthocyanins, resulting in increased levels of aromatic components in grapes. It was also discovered through taste tests that such grapes were preferred by consumers [16]. However, it is worth emphasizing the risk of reduced production if conditions develop further to much drier ones. Various studies discuss the possibility of predicting future grape yields using weather-related data from vineyards [17].
Since climatic conditions affect the wines produced in each region, the changes in weather patterns, which have been developing over the years, consequently have an effect on wines’ special characteristics and, therefore, quality, altering them to a certain extent [18]. As weather patterns change, scientific research mandates investigations into new ways for the “survival” of the agri-food chain in wine production and related businesses, involving viticulture, grape production, and the wine industry. This is highlighted as the risks from climate change become apparent [19,20].
Extensive field studies of harvest conditions conducted in France over the past 400 years reveal that the grape harvest period is affected by climate. Indeed, early-season harvests occur at higher temperatures during a single growth period, due to the greenhouse effect and not because of a lack of water. Thus, it is worrisome that changes in weather patterns may further alter the climate and have consequences for viticulture and wine quality [21]. In addition, the change in grapes’ characteristics and components, e.g., increased sugar levels, may have some effect on fermentation and chemical processes, and, thus, on the wine that is being produced, as reported by other researchers [22].
The relationship between climatic variables and production features has been particularly noted over the years in many other studies evaluating the effects of climatic parameters on the values achieved for wines, which are extremely critical for everyone involved (vine growers, wine industries, etc.) [23]. The analysis of climate data in the last five decades of the previous century indicates that temperature had a steady upward trend while interannual variations decreased. While it is often pointed out that the quality levels achieved in the wines produced have improved over the same period, this cannot by any means imply that the constantly changing future climate patterns will continue to positively affect wine-producing regions, as well as all varieties. Successful vine-growing requires specific soil conditions and a stable climate without major temperature changes [24]; this effect does not have a uniform character as scientific estimates indicate the opposite. In this sense, it is stated that the redistribution of vine production regions is the most likely global outcome [25]. Such considerations are particularly important as many studies show the relationship between changing weather patterns and the climatic conditions gradually prevailing in Europe [26].
According to Jones and Goodrich [27], in the western USA and particularly in the Napa Valley of California, meteorological phenomena taking place in the Pacific Ocean affect the climate of the valley and, in turn, the vineyards and wines produced there. Thus, it is likely that the climate-induced impacts can affect all Denomination of Origin wines in that region [27]. Furthermore, the results of research conducted in California [28] using data from 1970 to 2004 indicated that the weather patterns of each growing season induced effects on both wine quality and wine prices.
In the wine-producing regions of Europe, increased temperature in terms of climate change has been shown by scientific documentation to have had some effect on wine quality, by affecting the water balance. Water balance is modified, contributing to the shift in the harvesting time, which is now taking place earlier compared with previous seasons. Under these circumstances, changes are caused by the chemical composition of the grape which is modified [29]. In addition, the existence of indications for the effect of temperature on sugars and acids, as well as on the aromatic compounds of grapes and wine, in quantitative terms, is also formulated here. Duchêne et al. [30] highlight the significant modifications that changes in weather patterns can impose on viticulture. Specifically for wine production in the Rhine Valley in Germany, scientists have achieved a good correlation between wine quality ratings in the last three centuries (with the establishment of a five-category classification system) and the climate data recorded at weather stations in England for this same period [31]. Furthermore, the same study stated that increasing average temperatures by 1 °C throughout the entire growing period would potentially improve the quality of Rhine wines.
In southeast Spain, a temperature increase of 1.3–2.0 °C was recorded during the years 1952 to 2006. It could be argued that this increase actually assisted in achieving higher wine quality in those years with the highest daily ripening temperatures and, concurrently, in achieving reduced production in warmer annual cycles. In terms of annual precipitation, the results were inconclusive. However, it is estimated that 1 °C increases during the growth period can lead to an increased need for irrigation by up to 14% [32]. In Hungary, the existence of a correlation between the grape quantity produced and the quality levels with the climatic conditions of the region was proven. It was confirmed, in the context of scientific research, that the most significant parameters are sunshine hours during May, June, July and August, along with precipitation levels in September. As far as the quality of the wine is concerned, the most significant variables were mean temperature, precipitation, and sunshine periods in May and September, along with precipitation in July and sunshine in August [33]. On the other hand, in Australia (where the effects of climate change are more intense), a rise in temperature is estimated to have a negative impact on wine-growing areas and, therefore, on wine production. Certainly, the impact on quality varies, presenting unfavorable effects on inland areas [34].
Pons et al. [35] proposed to adopt appropriate measures to mitigate the effects of changing weather patterns. Such measures include the careful selection of harvest dates and the adoption of appropriate practices in the field of cultivation. Significant changes are proposed: limiting thinning and management of plant nutrition, the administration of sufficient nitrogen to ensure the vegetative power of the stumps, achieving the preservation of the aromatic potential of the grapes, and limiting the effects on wine production. Moreover, if weather patterns continue to change and start to reach extreme levels, vine varieties will have to be re-evaluated, so that those considered adaptive to future climatic conditions will be used. Changes in rainfall levels and their potential impact on the development of pathogens may have an effect on grape quality, as well as wines’ aroma and flavor features as they age. Scientific studies have embarked on identifying the various substances in wine grapes that shape the scent of the produced wines. A future goal is to develop specific strategies to identify the taste of wines in terms of consumer expectations [36].
A related monograph published recently [37] mentioned that the successful use of statistical analysis based on data from laboratory analyses carried out on wines aimed (a) to investigate the possibility of distinguishing wines according to their origin/place of production and (b) to correlate the parameters resulting from the wine analyses of the climate factors and the restraints of the climate data (where the wine factors are maximized or minimized). As pointed out, such data is of particular importance in planning the development of viticulture in the assessment of the effects of ongoing global shifts under the effects of climate change in order to make an effective, sustainable, and successful developmental effort for the food chain of grapes and wine.
In terms of other aspects linking wine production to climate change, it could be stated that the effect of the production process contributing to climate change is limited as reported by researchers [38]. Findings indicate that sustainable wine production generally makes little contribution to climate change. Adopting some sustainable viticulture practices can turn the system into a net carbon sink capable of fully offsetting anthropogenic emissions in vineyard management. The sustainability angle is given serious consideration in the Italian wine sector as well [39]. A relevant study [40] states that while a vineyard’s emissions start from a low base, opportunities for further reduction of greenhouse gases from viticulture include reducing energy inputs, especially in tractor operations and water pumping for irrigation, as well as the rational use of fertilizers. The study of Mariani and Vastola [41] states that the wine sector worldwide is firmly committed to improving the vine-growing environment.
In order to facilitate calculations on the subject, the International Organization of Vine and Wine–OIV4 formulated a framework in 2011 under the title “General Principles of the OIV Greenhouse Gas Accounting Protocol for the Vine and Wine Sector-GHGAP” [42] on GHG emissions from the grape and wine production departments. In the same direction, another specialized standard (protocol) in the field of grape and wine production has been formulated by the organization “California Sustainable Winegrowing Alliance–CSWA5” [43,44]. According to this protocol, in terms of grape production, certain operations in the vineyard, such as driving and using tractors “produce” carbon dioxide (CO2), which affects climate change, while at the same time, the cultivation of vineyards for the purposes of producing grapes and wine “consumes” CO2 through photosynthesis, with long-term storage of carbon in plant structures and soils. For this reason (among others), the production of grapes and wine is a significantly smaller source of CO2 than transport and industrial activities.
While the pre-existing literature has paid attention to the relationship between climatic variables and wines’ quality characteristics, these effects on the regional level remain to be further explored. This study further expands the literature studying climate change effects on the wines’ individual quality characteristics utilizing nonpublic data on a local level for Greece. Unfortunately, the impact of climate change effects on Greek-produced wines’ specific characteristics has not yet received much attention from scholars, although Greece is a country with a long history and tradition in winemaking. Furthermore, the present study attempts to explore the abovementioned effects in two Greek regions with significant variation regarding their geomorphological characteristics since Ioannina is a mountainous region in the mainland of Greece and the Ionian Islands are coastal areas. Thus, potential differences in the induced climate change effects across regions could be inferred. It should be emphasized that the present study has innovative characteristics as the utilized data have not been used until now, either by public services or entrusted to researchers to exploit them scientifically.
2. Materials and Methods
2.1. Statistical Discrimination of Dry White Wines According to Geographical Origin
Firstly, considering the pivotal importance of a sample that is as representative as possible, we requested access to the nonpublic data of the quality control analyses of the wines provided by the Decentralized Unit of the Regional Center of Plant Protection, Quality and Phytosanitary Control of Ioannina (National Quality Control Agency). Particularly, the dataset consists of measurements from samples derived from 48 wine firms located in the two regions under study (Ioannina and the Ionian Islands). It is worth mentioning that the quantity and the exact configuration of the utilized data provided by the National Quality Control Agency are pre-settled and specified by the National and European Community legislation. According to this, in order to configure the data, a risk assessment analysis of the winemaking firms is carried out taking into account the evaluation criteria, as described in the relevant documents of European and national legislation.
Following the scope of the present study, a Multivariate Analysis of Variance (MANOVA) was applied initially, in order to point out which parameters are significant for the geographical classification of dry white wines. A total number of seven characteristics (total alcoholic strength, actual (recovered) alcoholic strength, total acidity, volatile acidity, total sulfite, pH, and residual sugars) constituted the dependent variables in the analysis, while the independent variable used was the geographical origin.
Linear Discriminant Analysis (LDA) was then applied using significant dependent variables exclusively, as arising from the MANOVA, to explore the possibility of classifying wine samples according to geographical origin. The corresponding loadings on the discrimination functions were calculated via Fisher’s coefficients. The number of samples collected from each one of the two regions was different; hence, the correct ranking likelihood criterion was based on the group size [45]. Both the original and “leave one out” cross-validation techniques were applied in order to test the accuracy of the predicted classification. According to Field [45], the “leave one out” cross-validation is a more conservative method for producing accurate classification, as well as being more reliable: it gives lower rates of correct prediction, and the results can also be generalized to the whole population from which the samples were collected. Thus, it reflects the prediction rates for a tested sample and strengthens the discrimination efforts since it calculates the probabilities, omitting one observation from the analysis in each iteration. In this way, a discrimination function was created, and then the remaining observations were assigned to one of the groups created, using this function as a basis. This procedure was repeated for each one of the observations in the sample, which leads to more reliable discrimination. To check for the homogeneity of the variances (a basic assumption for the reliability of the analysis, especially for unequal sample sizes for the categories), Box’s M statistical test was applied [45].
It is worth mentioning that this applied methodology is only indicative of the total number of wines produced in the region. As mentioned earlier, the standard procedure was applied in order for the examined samples (which are taken in terms of quality control and legislation provisions) to be referred to the total number of produced wines.
2.2. Analysis of Covariance by Each Dependent Variable
For the investigation into the effect of the two climate variables (Mean Temperature and Mean Relative Humidity) on each of the significant elements of wine (total alcoholic strength, actual (recovered) alcoholic strength, total acidity, volatile acidity, total sulfite, and residual sugars), the General Linear Model (GLM) was used together with the Analysis of Covariance (ANCOVA). ANCOVA is a special case of the GLM and is applied in the case where the analysis of variance includes covariates, i.e., quantitative continuous variables that are not part of the initial experimental design but have an effect on the outcome of the dependent variable (45,46]. In the analysis, the dependent variables are those arising from the MANOVA analysis.
The main factor is the harvest areas, which for this study are Ioannina (in the region of Epirus) and the Ionian Islands of Greece. Temperature and relative humidity means for the growth period are used as the covariates since we suppose that these variables can affect the values of the dependent variables for each of the two regions. It should be emphasized at this point that the independent categorical variable (region) participates in the adjusted model as a dummy variable. Due to the fact that the categorical variable has two levels (Ioannina and the Ionian Islands), only one dummy variable was created since the number of dummy variables should always be one less than the levels of the categorical factor [45,46,47]. For the design of the experiment, 48 samples were used. The analysis was conducted using the GLM procedure of the statistical package Minitab 20.1 (Minitab Inc., 2021). The adjusted model for each one of the dependent variables is as follows:
where j = 1,2,3 are the corresponding coefficients of the linear terms (two covariates and one dummy variable), β0 the constant term of the model, Y is the value of each one of the dependent variables arising from the MANOVA analysis, and ε the random error of the model.
Contour plots were subsequently created for each of the two regions. Using these graphs and the Response Optimization process, the researcher may identify the combinations of factors and covariates that can extract the maximum or the minimum value of the outcome variable [46].
3. Results
3.1. Geographical Discrimination of Dry White Wines for the Two Different Regions
The initial results of the MANOVA analysis are significant as the following indices show: Pillai’s Trace = 0.998 (F = 36.393, p-value < 0.001) and Wilk’s Lambda = 0.002 (F = 35.181, p-value ≤ 0.001), which means that there is a significant multivariate effect of different items on the geographical origin of the dry white wines. Both the significant (p-value < 0.05) and nonsignificant characteristics of the white wines for ascertaining regional differences are presented in Table 1.

Table 1.
Significant items of MANOVA analysis.
In the next step, the six significant items (except pH) were all subjected to the Linear Discrimination Analysis (LDA) aimed at discovering whether they can distinguish the region of the dry white wines. Results showed that only one statistically significant discriminant function is extracted (Wilk’s Lambda = 0.662, X2 = 17.743, df = 6, p-value < 0.05). A significant value of Wilk’s Lambda index indicates that the extracted discriminant function is important for the discrimination of the investigated groups. The test of the homogeneity of variances (Box’s M index) is nonsignificant at the 5% level (24.387, F = 1.275, p-value = 0.051), revealing the existence of homogeneity of the variances of the samples within regions.
Table 2 depicts the classification results using the two aforementioned techniques (the original and the cross-validation). The overall correct classification rate was 91,7% using the original, and 85,4% using the cross-validation method. As the results indicate, the Ioannina samples have the highest classification rate (95,1%).
Table 2.
Classification results for dry white wines in terms of their characteristics.
3.2. ANCOVA Results for Each of the Dependent Variables
3.2.1. Total Alcoholic Strength
In the following tables and figures, the notation is as follows: TAS: total alcoholic strength (% Vol. 20 °C), AAS: actual alcoholic strength (% Vol. 20 °C), TA: total acidity, VA: volatile acidity, RS: residual sugars, MT: mean temperature, MRH: mean relative humidity.
The analysis shows that “Region” insignificantly affects the TAS, with the simultaneous presence of both MT and MRH as covariates in the model. Therefore, the difference in regions seems not to be affected by TAS (F(2.700) = 4.27, p = 0.107), which is illustrated in Figure 1.
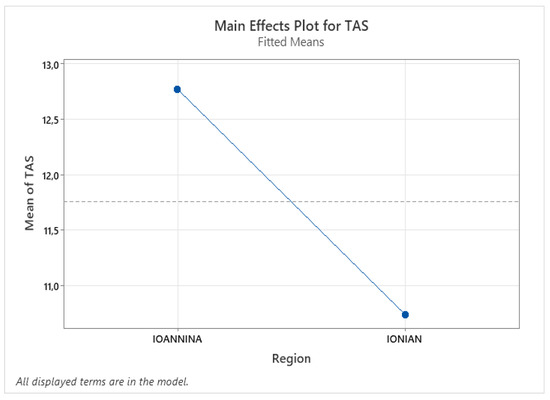
Figure 1.
Mean values of total alcoholic strength by region.
Figure 1 demonstrates that the regions of Ioannina and the Ionian Islands show a difference in mean TAS in dry white wines, but this difference tends to be insignificant. The Lack of Fit test is insignificant (F(3.47) = 2.30, p = 0.078 > 0.05), something that shows an overall good fit of the model.
Contour plots can display the simultaneous effects of both factors and covariates. The adjusted model consists of more than two variables, so it becomes apparent that not all variables can be represented in a two-dimensional graph [46]. Thus, two separate graphs were created, for each one of the regions. Figure 2a,b show the effect of MRH combined with MT on TAS for the two regions. In both regions, it appears that TAS takes its maximum values when the values of MRH are less than about 70 and the MTe of the growth period is below 22 °C. These maximum values are above 13 (% Vol. 20 °C) for the Ionian Islands and above 15 (% Vol. 20 °C) for Ioannina.
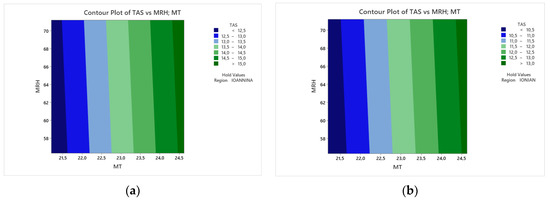
Figure 2.
Contour plots by region for total alcoholic strength for the combination of mean temperature and mean relative humidity. (a) Region of Ioannina; (b) Region of Ionian Islands.
The maximum and minimum TAS values can be determined with the Response Optimization process for a specific value of each covariate and each category of the factor. The maximum value of TAS is 15.273 (% Vol. 20 °C), which can be obtained when MT is 24.6 °C and MRH is 71.18% in the Ioannina region, whereas the minimum value of TAS is 10,0975 (% Vol. 20 °C), which can be obtained when MT is 21.2 °C and MRHy is 56.31% in the Ionian Islands.
3.2.2. Actual Alcoholic Strength
From the analysis, it appears that “Region” does not have a considerable effect on AAS, with the simultaneous presence of both MT and MRH as covariates in the model. Therefore, the difference in regions does not affect the AAS (F(1.44) = 2.84, p = 0.09 > 0.05), as shown in Figure 3.
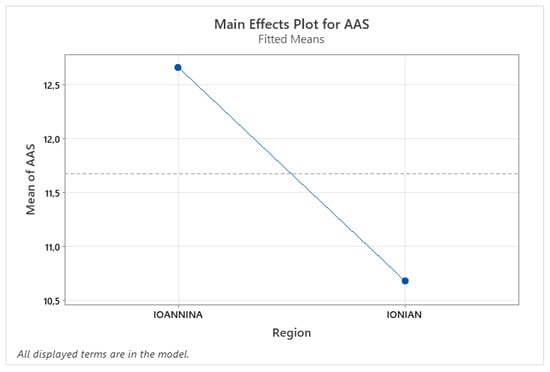
Figure 3.
Mean values of actual alcoholic strength by region.
Figure 3 illustrates that the different wines of Ioannina and the Ionian Islands have slightly different values for AAS on average, but this difference does not seem to be significant. The Lack-of-Fit test is not significant (F(3.47) = 1.78, p = 0.165 > 0.05), indicating a good overall fit of the model. Contour plots present the concurrent effects of factors and covariates for each region, as described in the previous section.
Figure 4a,b show the influence of MRH combined with MT on AAS for the two regions. For Ioannina (Figure 4a), AAS appears to be maximized when MRH values are above 64, and the MT of the growth period is above 24.5 °C. The maximum values of AAS are above 15 (% Vol. 20 °C) (Figure 4a). However, in the case of the Ionian Islands (Figure 4b), the AAS is maximized, and the above values appear to be decreased since the MRH values are slightly above 62% and the temperature is above 24.5 °C. In this case, the maximum values of TAS are over 13 (% Vol. 20 °C).
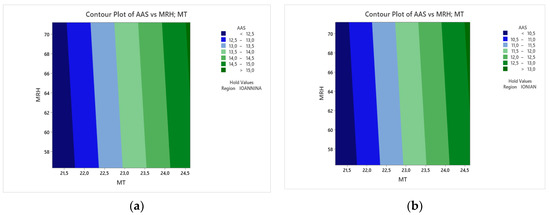
Figure 4.
Contour plots by region for actual (or recovered) alcoholic strength (AAS) for the combination of mean temperature and mean relative humidity. (a) Region of Ioannina; (b) Region of the Ionian Islands.
Furthermore, the maximum and minimum values of AAS can be determined with the Response Optimization process for a specific value of each covariate and each region. The maximum value of AAS is 15,096 (% Vol. 20 °C), which can be obtained with MT at about 24.62 °C and the MRH at about 71.18%, for Ioannina; whereas the lowest value of AAS is 10.035 (% Vol. 20 °C), which can be obtained with MT at about 21.2 °C and MRH at about 56.31%, for the Ionian Islands.
In conclusion, as far as the TAS is concerned, it is evident from the contour plots that, with regard to the climatic conditions, only temperature significantly affects it in both regions, while the AAS is mainly affected by temperature and less by humidity. The “narrow zones” in the contour plots of both these parameters provide an important indication of the strong effect of climate change. Between the two, the effect of climate change seems to be stronger in the case of the AAS as higher values of this parameter are combined with higher values of relative humidity, which climate change limits to lower levels.
3.2.3. Total Acidity
The results of the analysis appear to show that “Region” has a considerable influence on TA when MT and MRH are taken into consideration. Therefore, differences in regions affect total acidity (F (1.47) = 2.32, p = 0.045 < 0.05.), as depicted in Figure 5.
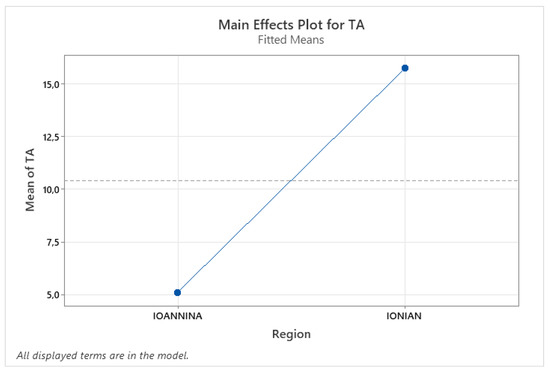
Figure 5.
Mean values of total acidity by region.
More specifically, Figure 5 shows that the mean total acidity for the dry white wines of the Ionian Islands appears to be significantly greater. The Lack-of-Fit test is not significant (F(3.47) = 10.06, p = 0.498 > 0.05), which shows almost a perfect overall fit of the model. Contour plots present the simultaneous effects of both the factors and the covariates for each region, as described in the previous sections.
Figure 6a,b display the influence of MRH combined with MT on TA for the two regions. In the Ionian Islands (Figure 6b), TA appears at the maximum value when the MRH values are less than 59% and the MT of the growth period is below 22.5 °C. The maximum values of TA are above 7. The results regarding Ioannina appear to be quite different (Figure 6a). The range in which TA is maximized appears to be increased since the MRH values are below 61% and the temperature is lower than 23 °C. The maximum values of TA are above 6.
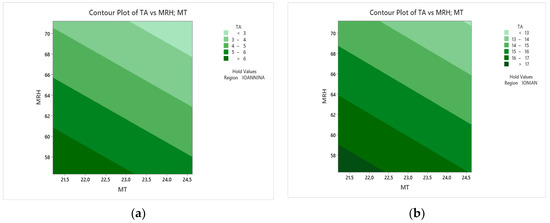
Figure 6.
Contour plots by region for total acidity (TA) for the combination of mean temperature and mean relative humidity. (a) Region of Ioannina; (b) Region of the Ionian Islands.
Based on the above analysis, the maximum and minimum values of TA can be determined with the Response Optimization process for a specific value of each covariate and each of the two regions. The maximum value of TA is 17.56, which can be obtained when the MT is 21.2 °C and the MRH is 56.313% for the Ionian Islands; whereas the minimum value of TA is 2.27, which can be obtained with MT at about 24.6 °C and MRH about 71.185% for Ioannina.
In conclusion, as far as TA is concerned, it appears to be affected by both temperature and relative humidity. Higher TA values in both regions are associated with lower temperatures and lower relative humidity. Thus, climate change could have a significant effect by differentiating it, although winemaking practices provide significant possibilities to regulate it.
3.2.4. Volatile Acidity
From the analysis, it appears that “Region” has no significant effect on VA when MT and MRH are taken into consideration. Thus, differences in regions affect VA (F(1.47) = 0.16, p = 0.0586 > 0.05) as can be seen in Figure 7.
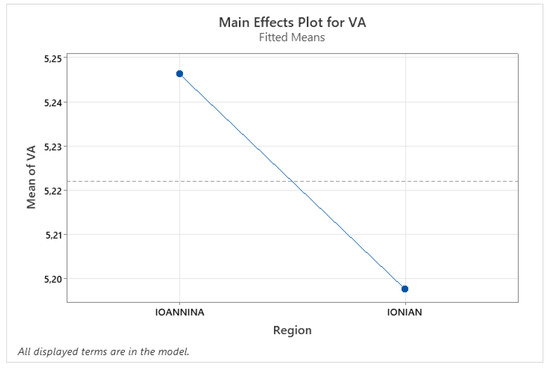
Figure 7.
Mean values of volatile acidity by region.
Figure 7 shows that the dry white wines of Ioannina and of the Ionian Islands have almost the same VA. The Lack-of-Fit test is not significant (F(3.47) = 2.32, p = 0.523 > 0.05), which shows a good fit. Contour plots show the concurrent effects of factors and covariates for each region, as described in the previous sections.
Figure 8a,b display the impact of MRH combined with MT on VA for the two regions. For Ioannina (Figure 8a), VA appears to be maximized when MRH values are less than 58% and the MT of the growth period lies above 24,5 °C. The maximum values of VA are greater than 8. The results regarding the Ionian Islands are almost the same (Figure 8b).
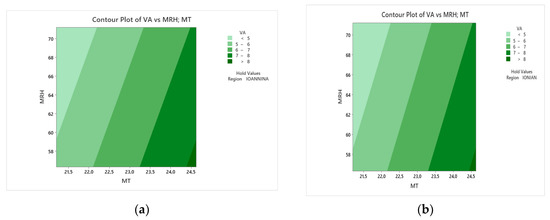
Figure 8.
Contour plots by region for volatile acidity (VA) for the combination of mean temperature and mean relative humidity. (a) Region of Ioannina; (b) Region of the Ionian Islands.
Based on the above analysis, the maximum and minimum values of VA can be extracted with the Response Optimization process for a specific value of each covariate and each region. The maximum value of VA is 8.217, which can be obtained when MT is 24.62 °C and MRH is 56.313% for Ioannina; whereas the minimum value of VA is 4.07, which can be obtained when MT is 21.2 °C and MRH is 71.185% for the Ionian Islands.
To sum up, VA also seems to be affected by both temperature and relative humidity. Higher VA values for both geographic regions are associated with higher temperatures but lower relative humidity. Therefore, climate change can affect this parameter by raising its values even more through the limitation of relative humidity and the elimination of low-temperature levels.
3.2.5. Residual Sugars
Based on the analysis, it appears that “Region” significantly affects the quantity of the RS, when MT and MRH are taken into consideration. This implies that differences in regions affect the quantity of RS-(F(1.47) = 4.23, p = 0.001 < 0.05) as shown in Figure 9.
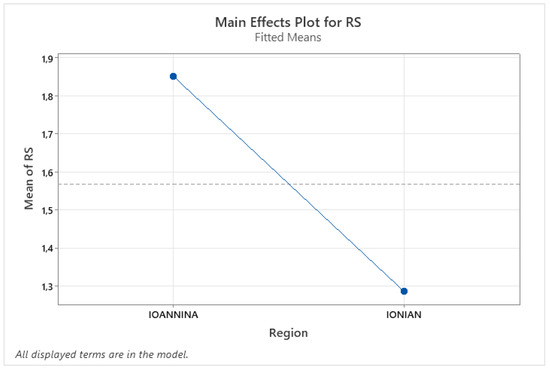
Figure 9.
Mean values of residual sugars by region.
According to Figure 9, the value of RS in the Ionian Islands seems to be significantly lower, even though the difference is very small. The Lack-of-Fit test is not significant (F(3.47) = 0.36, p = 0.78 > 0.05), which implies a good fit. Contour plots present the simultaneous effects of both factors and covariates for each region, as described in the previous sections.
Figure 10a,b display the impact of MRH combined with MT on the quantity of RS for each of the two regions. For Ioannina (Figure 10a), the quantity of RS appears to be maximized when MRH values are less than 58% and the MT of the growth period is greater than 24 °C. The maximum values of RS are greater than 3.5. Similar results are found regarding the Ionian Islands (Figure 10b) with the range of maximization area appearing to be the same. The maximum values of RS are greater than 3. However, the range of minimization area of RS for the Ionian Islands is wider, with MRH over 64% and MT below 22 °C.
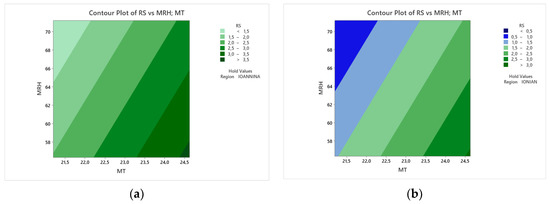
Figure 10.
Contour plots by region for the quantity of residual sugars (RS) for the combination of mean temperature and mean relative humidity. (a) Region of Ioannina; (b) Region of the Ionian Islands.
The maximum and minimum values of the quantity of RS can be determined with the Response Optimization process for a standard value of each covariate and each region. The maximum value of RS is 3.623, which can be obtained when the MT is 24.62 °C and the MRH is 56.313% for Ioannina; whereas the minimum value of RS is 0.495, which can be obtained with MT at around 21.2 °C and MRH at about 71.185% for the Ionian Islands.
The situation is similar as far as RS is concerned. Higher values for this parameter are also associated with higher temperatures and lower humidity. The image provided by the contour plot of the Ionian Islands demonstrates that the effects of climate change there have room to differentiate this parameter more strongly because the temperature values at which the values of RS are analyzed are lower compared with the region of Ioannina (due to the island character of the Ionian region). In total, for both geographical areas, climate change, which pushes the temperature values to increase and the relative humidity to decrease, may contribute to the increasing levels for this parameter.
3.2.6. Total Sulfite
From the analysis, it appears that “Region” significantly affects the quantity of TS, when both MT and MRH are taken into consideration. Thus, differences in regions affect the quantity of TS (F(1.47) = 2.61, p = 0.04 < 0.05). Figure 11 depicts the main effects graphically.
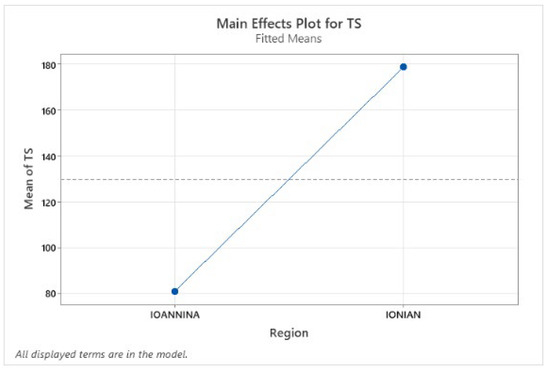
Figure 11.
Mean values of total sulfite by region.
According to Figure 11, TS in the Ioannina region seems to be significantly lower than in the Ionian Islands. The Lack-of-Fit test is not significant (F(3.47) = 1.34, p = 0.18 > 0.05), which implies a good overall fit. Contour plots present the simultaneous effects of both factors and covariates for each region, as described in the previous sections.
Figure 12a,b show the impact of MRH combined with MT on the quantity of TS for the two regions. For Ioannina (Figure 12a), the quantity of TS appears maximized when MRH values are less than 66%, and the MT of the growth period is below 21.5 °C. The maximum values of TS are greater than 100. The results are also the same regarding the Ionian Islands (Figure 12b), with a similar range of maximization and minimization areas, but with different values. In this case, the maximum values of TS are greater than 200.
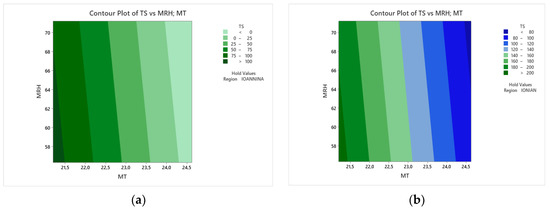
Figure 12.
Contour plots by region for the quantity of total sulfite (RS) for the combination of mean temperature and mean relative humidity. (a) Region of Ioannina; (b) Region of the Ionian Islands.
The maximum and minimum values of TS can be determined with the Response Optimization process, for a specific value of each covariate and each category of the factor. The maximum value of TS is 208.173, which can be obtained when MT is 21.2 °C and MRH is 56.313% for the Ionian Islands; whereas the minimum value of TS is 23.879, which can be obtained when MT is 24.62 °C and MRH is 71.185% for Ioannina.
The final parameter of TS, although regulated by human manipulation in the winemaking process in order to preserve wine to the optimal condition, combines the highest values with lower values for temperature and relative humidity. This leads to the conclusion that climate change and the consequent increase in rates can affect the choices of winemakers regarding the use of these substances.
4. Conclusions
The incentive for the conduction of the current study resides in expanding the debate on environmental sustainability in the wine industry. Sustainability issues in the wine industry are being increasingly recognized as a source of competitive advantage in terms of brand image and profit for wine companies. Since the literature on sustainability and wine is relatively recent, current results do not cover all the practices that can be implemented along the wine supply chain. As our results indicate, the prevailing climatic conditions in conjunction with climate change can affect the values of all the parameters determined in the analyses conducted for the wines produced in the two regions under study. This effect must be given serious consideration by producers and wine companies, as well as by all actors involved in the industry’s value chain so that the industry will continue to thrive by producing prime products with high-quality characteristics, utilizing concepts such as biodiversity in production and sustainable agri-food value chains. In general, sustainable agriculture and food processing are considered effective strategies to adapt the food system to climate change and mitigate its effects [48]. Sustainability also has become a major concern for all food value chains in order to reduce the negative impact they induce on the environment and minimize the negative impacts of climate change.
Lastly, reference should be made to the necessity of continuing research in the same direction in other regions and/or other countries. As climate change evolves, it is necessary to evaluate both its effects on wine production and possibilities of adapting this process to the new conditions that have developed. Comparisons of findings obtained from different regions will provide more insightful and useful results.
Author Contributions
Conceptualization, T.M. and C.S.; data curation, D.S.; formal analysis, S.K. and T.M.; investigation, S.K., D.S. and T.M.; methodology, T.M. and S.K.; project administration, T.M.; resources, S.K.; software, D.S.; supervision, T.M. validation, T.M. and C.S.; visualization, S.K.; writing—original draft, T.M. and C.S. All authors have read and agreed to the published version of the manuscript.
Funding
This research received no external funding.
Institutional Review Board Statement
Not applicable.
Informed Consent Statement
Not applicable.
Data Availability Statement
Not applicable.
Acknowledgments
The authors would like to thank the Ministry of Rural Development and Food of The Hellenic Republic, especially the Decentralized Unit of the Regional Center of Plant Protection, Quality and Phytosanitary Control of Ioannina, and personally, the head of the unit Chr. Roukos, for providing the data of the quality control analyses of the wines of the area under the responsibility of the Center, and for giving the permission to scientifically process and publish them in the context of the present study.
Conflicts of Interest
The authors declare no conflict of interest.
References
- Markopoulos, T. Common Agricultural Policy and Local Economy and Development in the Region of Eastern Macedonia–Thrace (Greece). J. Eng. Sci. Technol. Rev. 2019, 15, 185–223. [Google Scholar] [CrossRef]
- Tahon, C.; Batt, P.J. An Exploratory Study of the Sustainable Practices Used at Each Level of the Bordeaux Wine Value Chain. Sustainability 2021, 13, 9760. [Google Scholar] [CrossRef]
- Maicas, S.; Mateo, J.J. Sustainability of Wine Production. Sustainability 2020, 12, 559. [Google Scholar] [CrossRef]
- Brankov, T.; Markopoulos, T.; Kontakos, S. Long-term trends in food consumption: Comparison between Serbia and Greece. Econ. Agric. 2019, 66. [Google Scholar] [CrossRef]
- Rapsomanikis, S.; Kastrinakis, E. Basic Principles of Air Anti-Pollution Technology; TZIOLAS Publications: Thessaloniki, Greece, 2008; (In Greek). ISBN 978-960-418-169-8. [Google Scholar]
- European Environment Agency. Climate change is one of the biggest challenges of our times. 2022. Available online: https://www.eea.europa.eu/themes/climate/climate-change-is-one-of (accessed on 19 September 2022).
- Smith, P.; Olesen, J.E. Synergies between mitigation of, and adaptation to, climate change in agriculture. J. Agric. Sci. 2010, 148, 543–552. [Google Scholar] [CrossRef]
- Bisson, L.F.; Waterhouse, A.L.; Ebeler, S.E.; Walker, M.A.; Lapsley, J.T. The present and future of the international wine industry. Nature 2002, 418, 696–699. [Google Scholar] [CrossRef]
- Koufos, G.C.; Mavromatis, T.; Koundouras, S.; Jones, G.V. Response of viticulture-related climatic indices and zoning to historical and future climate conditions in Greece: Response of viticulture-related climatic indices and zoning in greece. Int. J. Climatol. 2018, 38, 2097–2111. [Google Scholar] [CrossRef]
- Jones, G.; Reid, R.; Vilks, A. Climate, Grapes, and Wine: Structure and Suitability in a Variable and Changing Climate. In The Geography of Wine; Dougherty, P.H., Ed.; Springer: Dordrecht, The Netherlands, 2012; pp. 109–133. [Google Scholar]
- Fraga, H.; Malheiro, A.C.; Moutinho-Pereira, J.; Santos, J.A. Climate factors driving wine production in the Portuguese Minho region. Agric. For. Meteorol. 2014, 185, 26–36. [Google Scholar] [CrossRef]
- Ashenfelter, O.; Ashmore, D.; Lalonde, R. Bordeaux Wine Vintage Quality and the Weather. CHANCE 1995, 8, 7–14. [Google Scholar] [CrossRef]
- Jones, G.; Davis, R.E. Climate Influences on Grapevine Phenology, Grape Composition, and Wine Production and Quality for Bordeaux, France. Am. J. Enol. Vitic. 2000, 51, 249. [Google Scholar] [CrossRef]
- Grifoni, D.; Mancini, M.; Maracchi, G.; Orlandini, S.; Zipoli, G. Analysis of Italian Wine Quality Using Freely Available Meteorological Information. Am. J. Enol. Vitic. 2006, 57, 339. [Google Scholar] [CrossRef]
- Marta, D.; Grifoni, D.; Mancini, M.; Storchi, P.; Zipoli, G.; Orlandini, S. Analysis of the relationships between climate variability and grapevine phenology in the Nobile di Montepulciano wine production area. J. Agric. Sci. 2010, 148, 657–666. [Google Scholar] [CrossRef]
- Koundouras, S.; Marinos, V.; Gkoulioti, A.; Kotseridis, Y.; Van Leeuwen, C. Influence of Vineyard Location and Vine Water Status on Fruit Maturation of Nonirrigated Cv. Agiorgitiko (Vitis vinifera L.). Effects on Wine Phenolic and Aroma Components. J. Agric. Food Chem. 2006, 54, 5077–5086. [Google Scholar] [CrossRef] [PubMed]
- Shanmuganathan, S.; Sallis, P.; Narayanan, A. Data Mining Techniques for Modelling Seasonal Climate Effects on Grapevine Yield and Wine Quality. In Proceedings of the 2nd International Conference on Computational Intelligence, Communication Systems and Networks, Liverpool, UK, 28–30 July 2010; pp. 84–89. [Google Scholar] [CrossRef]
- Jones, G.; Webb, L.B. Climate Change, Viticulture, and Wine: Challenges and Opportunities. J. Wine Res. 2010, 21, 103–106. [Google Scholar] [CrossRef]
- Mozell, M.R.; Thach, L. The impact of climate change on the global wine industry: Challenges & solutions. Wine Econ. Policy 2014, 3, 81–89. [Google Scholar] [CrossRef]
- Touzard, J.M.; Ollat, N. Long-term adaptation to climate change in viticulture and enology: The Laccave project. J. Int. Des Sci. Vigne Vin. 2017, pp. 1–7. Available online: https://www.researchgate.net/publication/262915289_Long-term_adaptation_to_climate_change_in_viticulture_and_enology_the_Laccave_project (accessed on 19 September 2022).
- Cook, B.I.; Wolkovich, E.M. Climate change decouples drought from early wine grape harvests in France. Nat. Clim. Chang. 2016, 6, 715–719. [Google Scholar] [CrossRef]
- Mira de Orduña, R. Climate change associated effects on grape and wine quality and production. Food Res. Int. 2010, 43, 1844–1855. [Google Scholar] [CrossRef]
- Chevet, J.M.; Lecocq, S.; Visser, M. Climate, Grapevine Phenology, Wine Production, and Prices: Pauillac (1800–2009). Am. Econ. Rev. 2011, 101, 142–146. [Google Scholar] [CrossRef]
- Navrátilová, M.; Beranová, M.; Severová, L.; Šrédl, K.; Svoboda, R.; Abrhám, J. The Impact of Climate Change on the Sugar Content of Grapes and the Sustainability of their Production in the Czech Republic. Sustainability 2021, 13, 222. [Google Scholar] [CrossRef]
- Jones, G.; White, M.A.; Cooper, O.R.; Storchmann, K. Climate Change and Global Wine Quality. Clim. Change 2005, 73, 319–343. [Google Scholar] [CrossRef]
- Seneviratne, S.I.; Lüthi, D.; Litschi, M.; Schär, C. Land–atmosphere coupling and climate change in Europe. Nature 2006, 443, 205–209. [Google Scholar] [CrossRef]
- Jones, G.; Goodrich, G. Influence of climate variability on wine regions in the western USA and on wine quality in the Napa Valley. Clim. Res. 2008, 35, 241–254. [Google Scholar] [CrossRef]
- Ramirez, C.D. Wine Quality, Wine Prices, and the Weather: Is Napa ‘Different’? J. Wine Econ. 2008, 3, 114–131. [Google Scholar] [CrossRef]
- Van Leeuwen, C.; Darriet, P. The Impact of Climate Change on Viticulture and Wine Quality. J. Wine Econ. 2016, 11, 150–167. [Google Scholar] [CrossRef]
- Duchêne, E.; Huard, F.; Dumas, V.; Schneider, C.; Merdinoglu, D. The challenge of adapting grapevine varieties to climate change. Clim. Res. 2010, 41, 193–204. [Google Scholar] [CrossRef]
- Storchmann, K. English weather and Rhine wine quality: An ordered probit model. J. Wine Res. 2005, 16, 105–120. [Google Scholar] [CrossRef]
- Ramos, Μ.; Jones, G.; Martínez-Casasnovas, J. Structure and trends in climate parameters affecting winegrape production in northeast Spain. Clim. Res. 2008, 38, 1–15. [Google Scholar] [CrossRef]
- Makra, L.; Vitányi, B.; Gál, J.; Mika, A.; Matyasovszky, I.; Hirsch, T. Wine Quantity and Quality Variations in Relation to Climatic Factors in the Tokaj (Hungary) Winegrowing Region. Am. J. Enol. Vitic. 2009, 60, 312. [Google Scholar] [CrossRef]
- Webb, L.; Whetton, P.; Barlow, E. Climate change and wine grape quality in Australia. Clim. Res. 2008, 36, 99–111. [Google Scholar] [CrossRef]
- Pons, A.; Allamy, L.; Schüttler, A.; Rauhut, D.; Thibon, C.; Darriet, P. What is the expected impact of climate change on wine aroma compounds and their precursors in grape? OENO One 2017, 51, 141–146. [Google Scholar] [CrossRef]
- Francis, I.L.; Newton, J.L. Determining wine aroma from compositional data. Aust. J. Grape Wine Res. 2005, 11, 114–126. [Google Scholar] [CrossRef]
- Markopoulos, T. On Macedonian and Thracian Greek Wines. J. Eng. Sci. Technol. Rev. 2020, 13, 37–68. [Google Scholar] [CrossRef]
- Chiriacò, M.V.; Belli, C.; Chiti, T.; Trotta, C.; Sabbatini, S. The potential carbon neutrality of sustainable viticulture showed through a comprehensive assessment of the greenhouse gas (GHG) budget of wine production. J. Clean. Prod. 2019, 225, 435–450. [Google Scholar] [CrossRef]
- Mancuso, T.; Arfo, S.; Di Mauro, M.; Matarazzo, A.; Froio, A.P.; Scuderi, A. Application of SOSTAIN to Wine Sector in Sicily as Sustainability Management Tool. J. Biomed. Res. Environ. Sci. 2022, 3, 302–306. [Google Scholar] [CrossRef]
- Longbottom, M.L.; Petrie, P.R. Role of vineyard practices in generating and mitigating greenhouse gas emissions. Aust. J. Grape Wine Res. 2015, 21, 522–536. [Google Scholar] [CrossRef]
- Mariani, A.; Vastola, A. Sustainable winegrowing: Current perspectives. Int. J. Wine Res. 2015, 7, 37–48. [Google Scholar] [CrossRef]
- International organization of Vine. Resolution OIV-CST 431-2011—General Principles of the OIV Greenhouse Gas Accounting Protocol for the Vine and Wine Sector—Certified in conformity Montpellier, 2011. Available online: https://www.oiv.int/public/medias/2107/oiv-cst-431-2011-en.pdf (accessed on 9 November 2022).
- CSWA: Vineyard Management Practices and Carbon Footprints. 2009. Available online: https://www.sustainablewinegrowing.org/docs/Vineyards%20and%20GHGs%20Handout%20Final%20-%20May%202009.pdf (accessed on 9 August 2022).
- CSWA: California Vineyard Greenhouse Gas Emissions, 2019. Available online: https://www.sustainablewinegrowing.org/docs/CSWA%20GHG%20Report_Final.pdf (accessed on 10 August 2022).
- Field, A. Discovering Statistics Using SPSS, 4th ed.; SAGE: London, UK, 2009. [Google Scholar]
- Montgomery, D. Design and Analysis of Experiments, 8th ed.; John Wiley and Sons: New York, NY, USA, 2013. [Google Scholar]
- Kleinbaum, G.D.; Kupper, L.L.; Muller, E.K.; Nizam, A. Applied Regression Analysis and Other Multivariate Methods, 3rd ed.; Duxbury Press: Pacific Grove, CA, USA, 1998. [Google Scholar]
- Broccardo, L.; Zicari, A. Sustainability as a driver for value creation: A business model analysis of small and medium entreprisesin the Italian wine sector. J. Clean. Prod. 2020, 259, 120852. [Google Scholar] [CrossRef]


Disclaimer/Publisher’s Note: The statements, opinions and data contained in all publications are solely those of the individual author(s) and contributor(s) and not of MDPI and/or the editor(s). MDPI and/or the editor(s) disclaim responsibility for any injury to people or property resulting from any ideas, methods, instructions or products referred to in the content. |
© 2023 by the authors. Licensee MDPI, Basel, Switzerland. This article is an open access article distributed under the terms and conditions of the Creative Commons Attribution (CC BY) license (https://creativecommons.org/licenses/by/4.0/).