Article

A K-Means Clustering and the Prim’s Minimum Spanning Tree-Based Optimal Picking-List Consolidation and Assignment Methodology for Achieving the Sustainable Warehouse Operations

1
Department of Business Administration, National Taipei University of Business, Taipei 100, Taiwan
2
Department of Industrial Engineering and Management, National Taipei University of Technology, Taipei 106, Taiwan
*
Author to whom correspondence should be addressed.
Sustainability 2023, 15(4), 3544; https://doi.org/10.3390/su15043544
Submission received: 16 January 2023 / Revised: 10 February 2023 / Accepted: 12 February 2023 / Published: 15 February 2023
(This article belongs to the Special Issue Sustainability and Optimization in Production and Service Systems)

Abstract

:
Rapid industrialization has caused the concentration of greenhouse gases in the atmosphere to increase rapidly, leading to drastic global climate changes and ecological degradation. To establish a sustainable supply chain for consumer electronic products, this study focuses on warehouse operations and develops a K-means clustering and Prim’s minimum spanning tree-based optimal picking-list consolidation and assignment methodology. Compact camera modules are used to demonstrate and verify the effectiveness of this methodology. This methodology can be divided into two parts. First, the K-means clustering method is applied to conduct a picking-list consolidation analysis to create an optimal picking-list consolidation strategy for sustainable warehouse operations. Second, the most similar picking lists in each cluster are connected using Prim’s minimum spanning tree algorithm to generate the connected graph with the minimum spanning tree so as to establish a picking-list assignment strategy for sustainable warehouse operations. In this case study, this to-be model substantially reduced the traveling distance of the electric order-picking trucks within a warehouse and increased the picking efficiency to diminish the carbon emissions toward a sustainable supply chain.

1. Introduction

Economic development improves the quality of life and has led to a boosted demand for energy, which has contributed to the increase in greenhouse gas (GHG) emissions. Because of global warming, the frequency of extreme climates has raised, leading to severe droughts and floods in some areas. Therefore, the effective reduction of greenhouse gas emissions has become a key objective for governments worldwide. At present, the world’s major economies are starting to require companies to implement GHG inventory, analyze the carbon emissions generated by their supply chains, and pay carbon taxes. This emphasis on environmentally sustainable development is gradually spreading to other countries, prompting companies to take active steps to conserve energy and reduce their carbon emissions. Compared with manufacturing and recycling, the reduction of carbon emissions due to warehousing activities has received less research attention [1]. According to a report released by the World Economic Forum [2], logistics activities in supply chains account for 5.5% of global GHG emissions. To achieve environmental sustainability and a low-carbon supply chain, companies must examine every aspect of carbon emission generation.
The rapid market penetration of smartphones, vehicles with advanced driver assistance systems, smart home appliances, and smart buildings has led to a considerable increase in the demand for compact camera modules. This trend is estimated to increase the global production amount of compact camera modules from 5.5 billion in 2019 to 8.9 billion in 2025 [
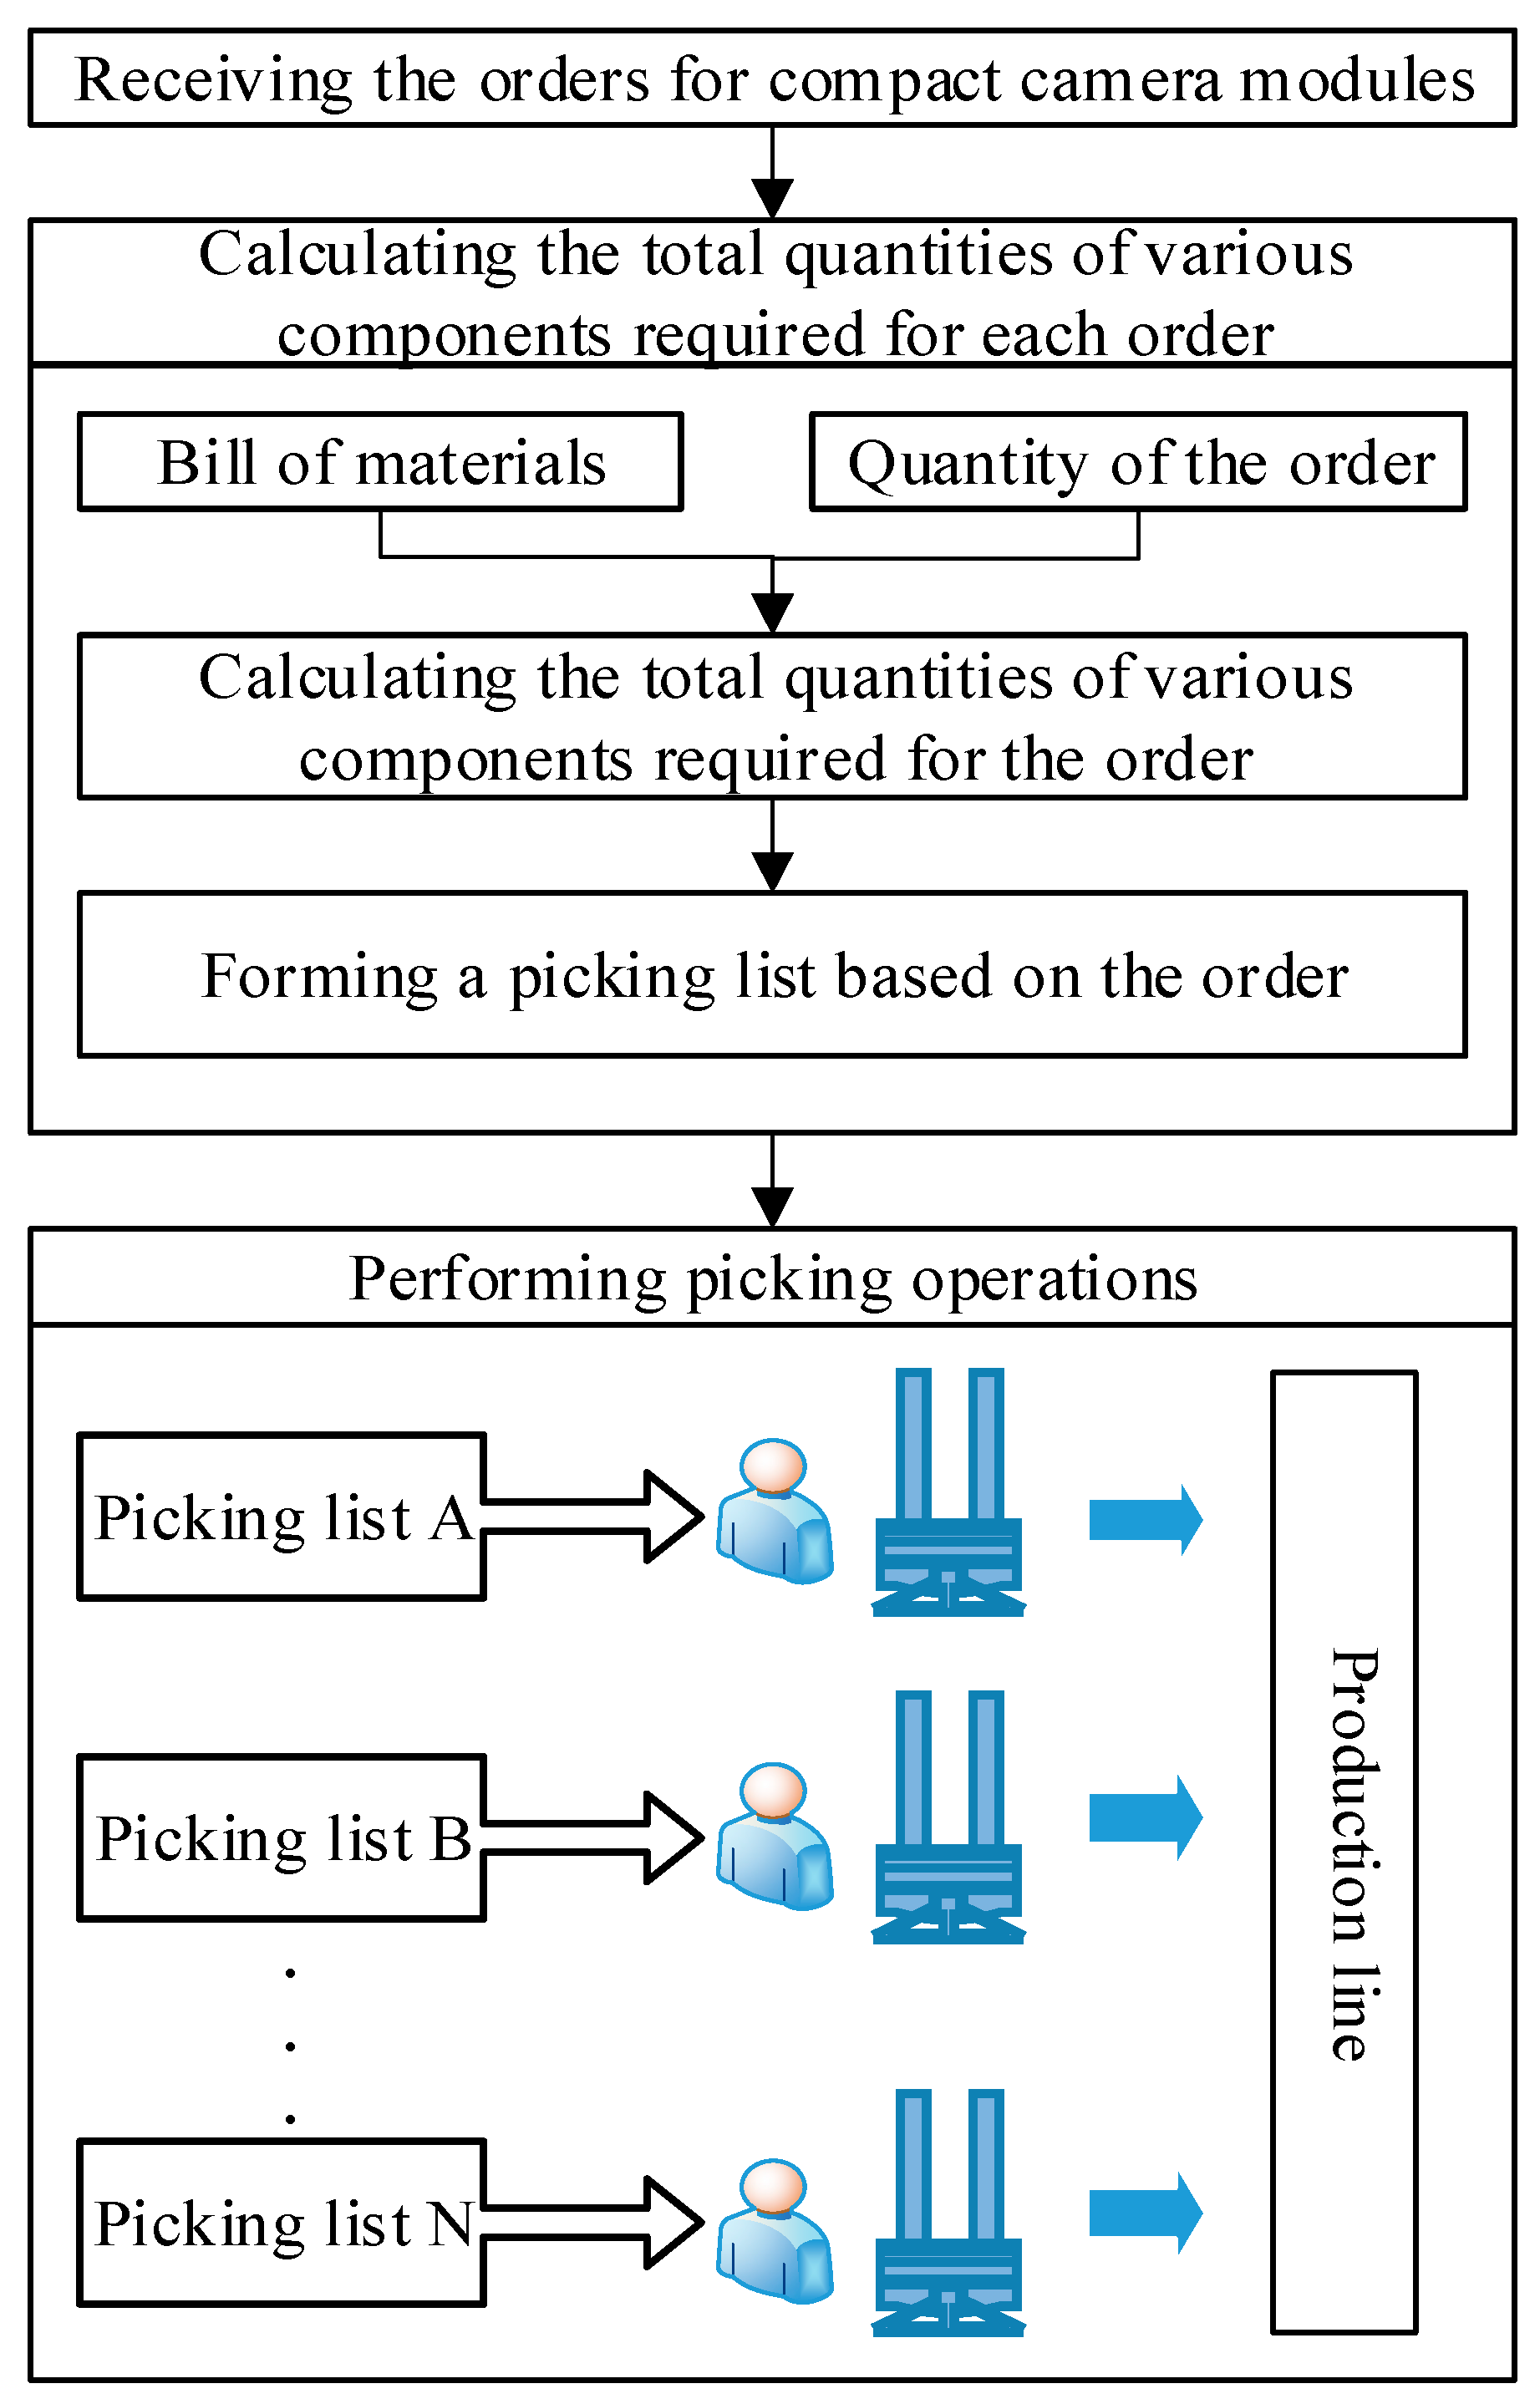
3]. Because compact camera modules are customized products, the product specifications vary considerably. Therefore, the companies adopt the build-to-order business model for compact camera modules. After the production line receives the production order, the picking operation commences for a customer’s order. For compact camera modules, different types of components are required for different customized customer orders. Hence, different components are picked for different picking lists, and this considerably increases the operation time and energy consumption required by the electric order-picking trucks to produce more carbon emissions. Hence, picking-list consolidation is very important. Some clustering methods are available to solve the picking-list consolidation problem such as hierarchical clustering, K-means clustering, density-based spatial clustering of applications with noise (DBSCAN) and hierarchical DBSCAN (HDBSCAN).
Hierarchical clustering and K-means clustering adopt the distance between data points or clusters as the basis of clustering. Dinh et al. [4] developed a K-SCC algorithm to find the largest value of the average Silhouette in the range of predefined minimum and a maximum number of clusters so as to decide the optimal number of clusters in categorical data for partitional clustering.
To deal with noises in the data points and the arbitrary distribution of data points, density-based clustering is suitable. However, DBSCAN needs to set two hyperparameters, i.e., the number of data points within a small distance (epsilon). The two hyperparameters are sensitive in clustering. The clustering result may become worse unless they are set appropriately. At the same time, if the density varies significantly across the clusters, DBSCAN cannot capture all the clusters properly [5]. To solve the above-mentioned problems, HDBSCAN was developed, in which just one hyperparameter needs to be set, i.e., the minimum cluster size. HDBSCAN can adjust the epsilon to form varying density clusters [6]. Therefore, HDBSCAN is more robust than DBSCAN. However, compared to DBSCAN, HDBSCAN has higher complexity in spending more execution time for large datasets [7].
Because each picking list is considered as the data point, noises need to be clustered. In addition, comparing hierarchical clustering, K-means clustering can optimize the clustering result by updating the centroids of clusters and reallocating data points to the nearest clusters continuously until the cluster centers are unchangeable. In addition, the K-means algorithm is quick [8]. Therefore, this research uses the K-means clustering method to combine the picking lists.
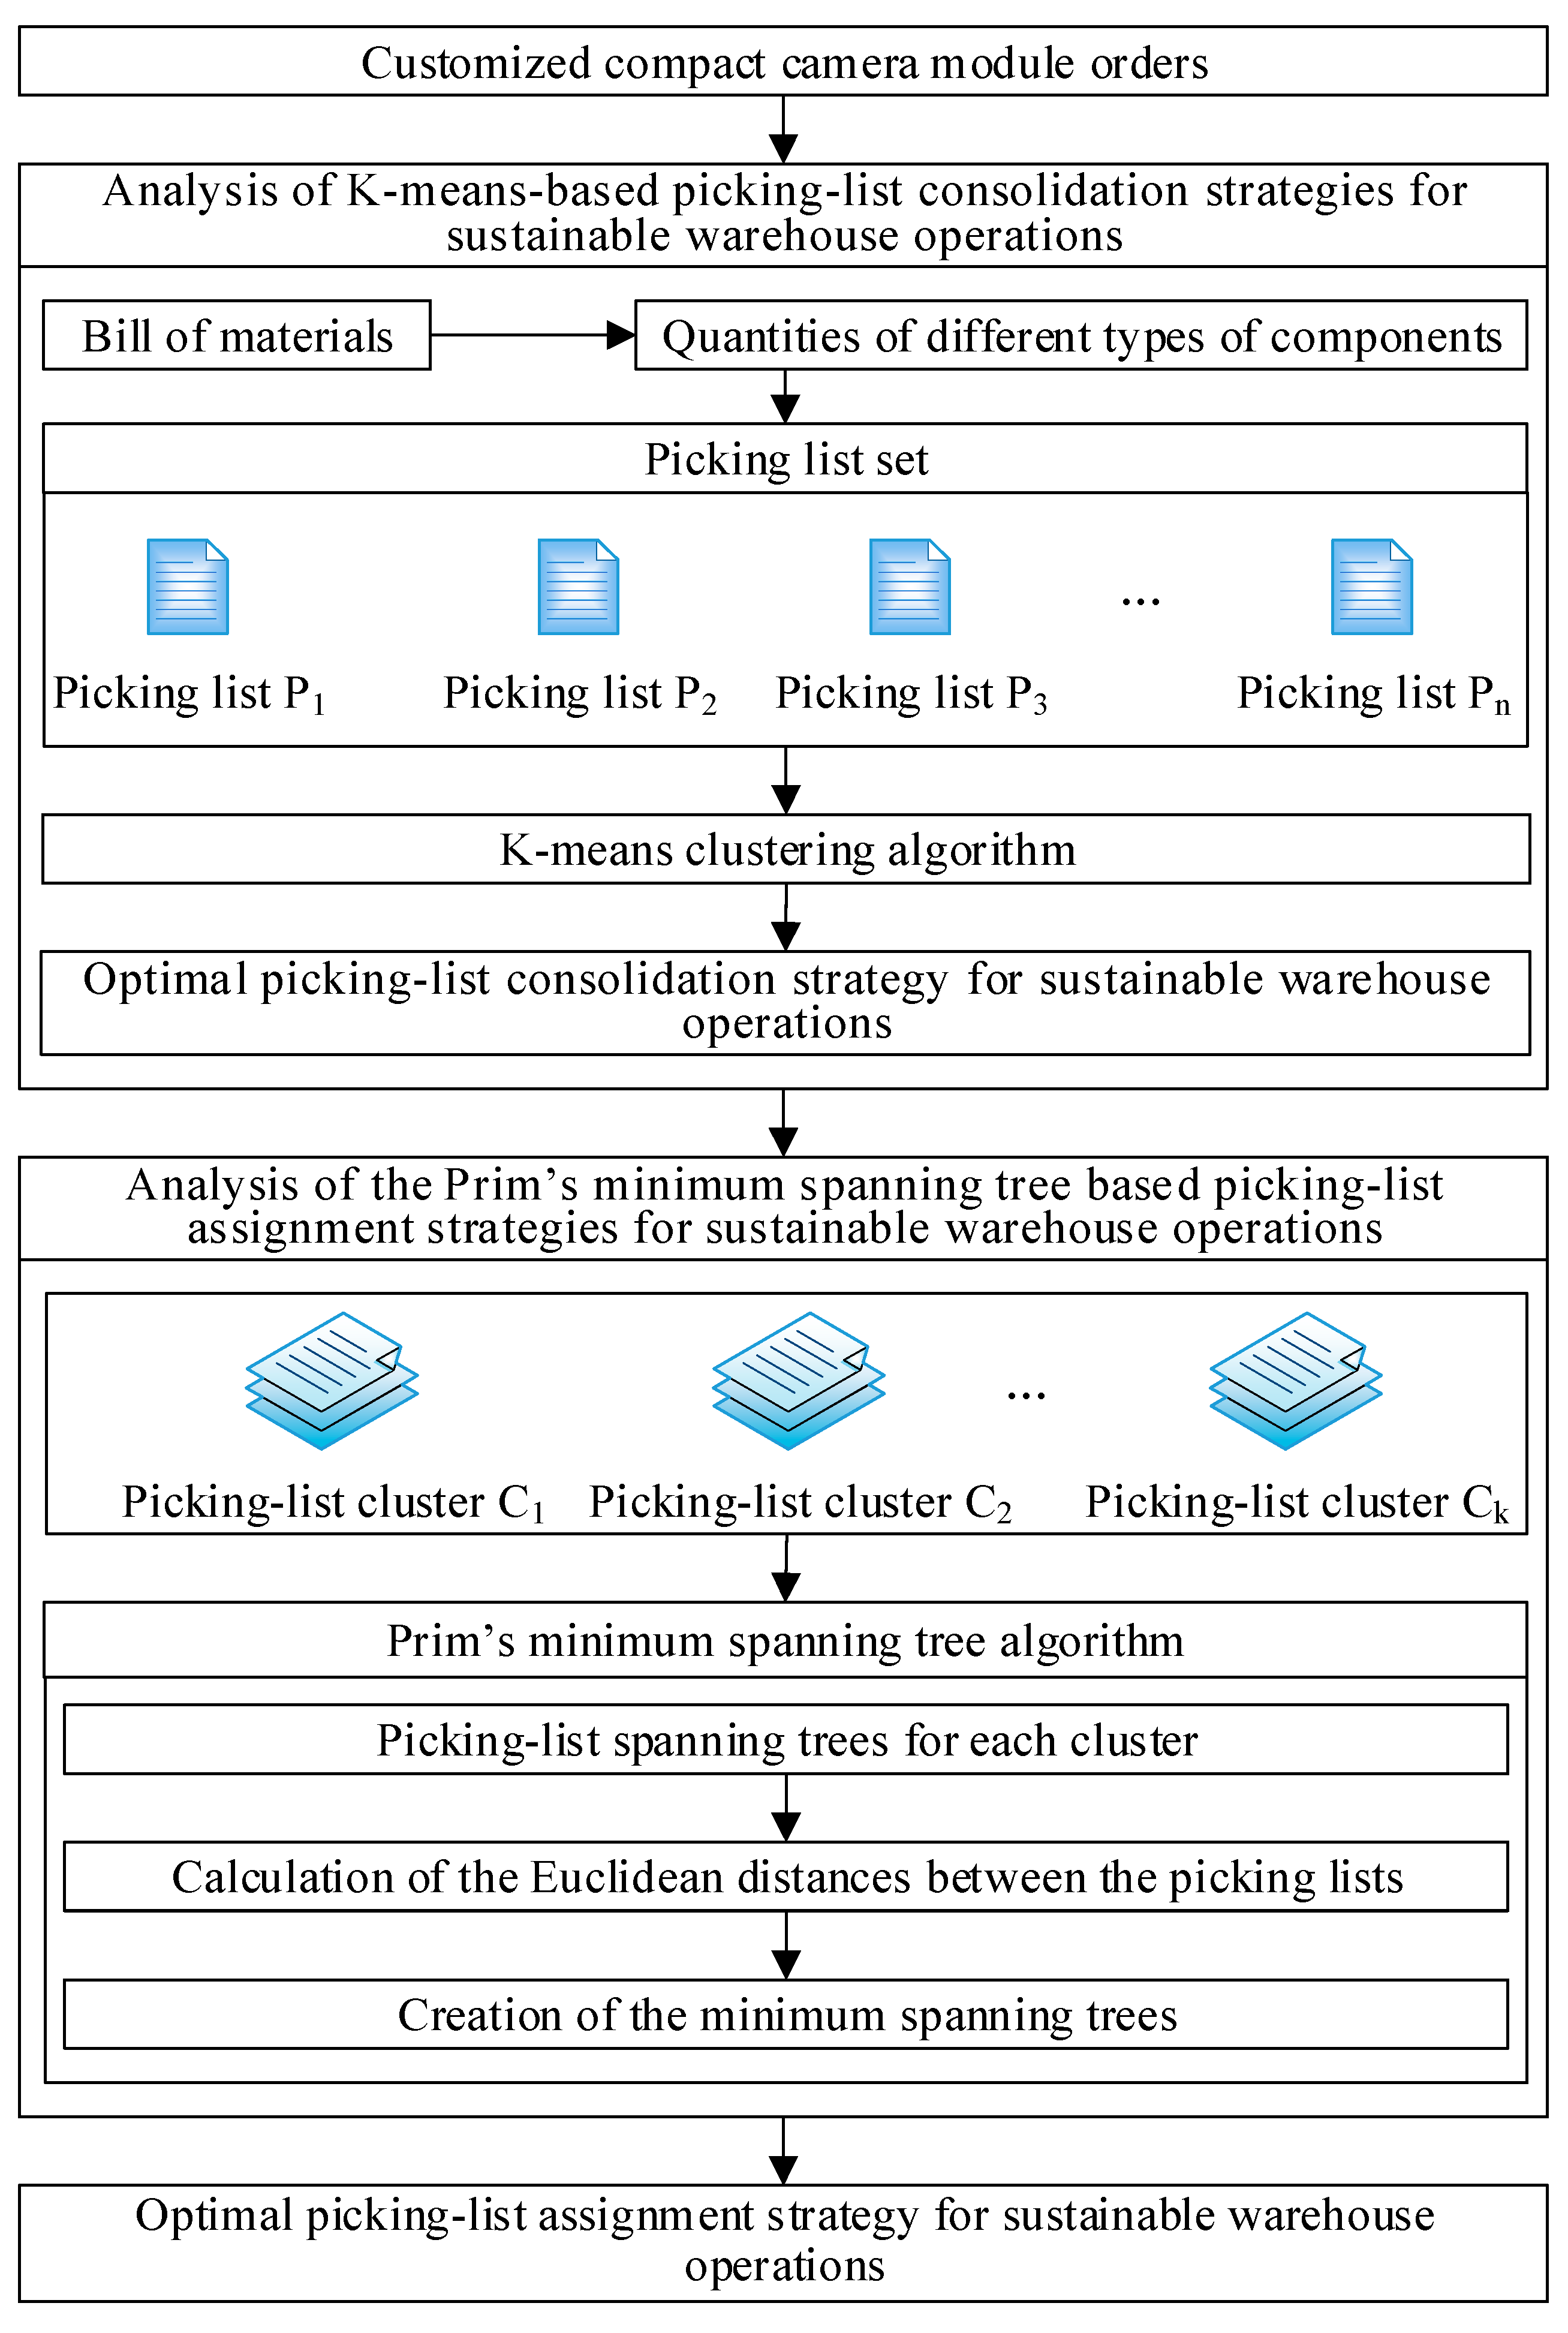
To increase the efficiency of picking operations and reduce carbon emissions, this research develops the K-means clustering and Prim’s minimum spanning tree-based optimal picking-list consolidation and assignment methodology for achieving sustainable warehouse operations. This methodology is divided into two parts. In the first part, the K-means clustering method is applied to combine picking lists with similar components to form multiple picking-list clusters, thereby enabling the formulation of an optimal picking-list consolidation strategy. In the second part, to complete the picking-list operations for a given cluster, a graph-based Prim’s minimum spanning tree algorithm is applied to minimize the shortest distance between linked picking lists to create the optimal picking-list assignment strategy. The second part can noticeably reduce the operating times and the carbon emissions of the electric order-picking trucks and contributes to the goal of implementing sustainable warehouse operations.
The rest of this paper is organized as follows. Section 2 reviews the related research for sustainable supply chains. Section 3 explains the proposed methodology. Section 4 uses a real case to demonstrate the significant contribution to the decarbonization of warehouse operations. Finally, Section 5 is this paper’s conclusion.

2. Literature Review

Rapid industrial development during the past twenty years induces a surge of greenhouse gas emissions to engender climate change. To diminish the frequency of occurrence of extreme climate, the issue of the sustainable supply chain has aroused great concern. He and Zhang [9] used factor analysis to extract several important indicators of low-carbon supplier selection. Then, data envelopment analysis (DEA) screened out weak effective and ineffective sustainable supply chain partners. For effective sustainable supply chain partners, AHP was utilized to rank and find the best sustainable supply chain partner. Manupati et al. [10] established a three-echelon sustainable supply chain, including two suppliers, three manufacturers and four distributors. The authors devised a multi-objective decision-making framework to minimize carbon emissions and manufacturing and transportation costs from suppliers to manufacturers. To reduce the carbon emission of the physical flow of products between vendors and dealers in logistics management, Lo [11] created the logistics network design with cross-docking operations and used the particle swarm algorithm to solve the vehicle routing problems with carbon emissions reduction. From a perspective of product design, Chiang and Che [12] used back-propagation neural networks to forecast the amounts of GHG emissions for all parts of a new electronic product throughout the product life cycle and proposed a bi-objective decision-making methodology for low-carbon electronic product design to find the best low-carbon design alternative. Zhang and Ji [13] developed the digital twin-driven carbon emission prediction model to estimate carbon footprints. These studies do not consider the efficiency of warehouse operations. Çelik and Süral [14] considered the order-picking problem in a parallel-aisle warehouse. The bi-objective model was established to minimize turn and travel time. That research assumed that one picker picks items given in a single order. In order to improve the order-picking efficiency, Menéndez et al. [15] applied a general variable neighborhood search method to group orders into bathes to boost warehouse operations. However, that method is a local search method. Chiang et al. [16] used the hierarchical clustering method and the K-means clustering method to analyze the performance of picking-list consolidation. Considering the picking capacity of the pickers, an optimal picking-list consolidation strategy was created. How to evaluate and improve GHG emissions from warehousing and transshipment is a critical issue. Rüdiger et al. [17] calculated GHG emissions for logistics facilities with environmental performance indicators. The analytical result of that article can trigger the development of decarbonization strategies at logistics facilities. Ries et al. [18] assessed the carbon footprint of warehouse operations, including lighting, heating, cooling, air conditioning, and mobile material handling equipment. Due to most picking-order operations that are operated by electronic picking equipment, there is an increasing number of GHG emissions. From the perspective of intra-logistics and building design, Freis et al. [19] evaluated the CO2 emissions of different options to find the most suitable logistics center design. That paper estimated the total energy demands of different types of logistics centers, which include intra-logistics equipment, building technology, and the type of construction.
Minashkina and Happonen [1] pointed out that decarbonizing warehousing activities have not gained as much attention compared to decreasing CO2 during manufacturing, transportation and recycling. In addition, to our best knowledge, little works integrated macro- and micro-level viewpoints to develop a holistic analysis method of low-carbon picking-list analysis. Therefore, this research develops an optimal low-carbon picking-list consolidation and assignment approach to deal with the important problem of reducing the GHG emissions of picking-up operations.

3. Methodology

3.1. Problem Description

Figure 1 illustrates the as-is picking operation model for compact camera modules. When a manufacturer receives a customer’s order, the quantities required for various components are calculated by using the bill of materials (BOMs) in accordance with the specification and the order quantity of the customized compact camera modules. A warehouse picker is responsible for a customer order and performs the picking operation on the basis of the total number of components as indicated by the picking list. When N picking lists are created, the times that the electric order-picking trucks enter the warehouse is N to cause more carbon emissions during the picking operation process. In addition, if the warehouse picker receives multiple picking lists in which the components to be picked up are stored in significantly different locations within the warehouse, the warehouse picker must travel long distances with the electric order-picking truck to pick the required components, thereby increasing energy consumption. The as-is picking operation model does not perform clustering analysis on the basis of the types of components to be picked up for each picking list and combines picking lists with high similarities to pick them simultaneously. Furthermore, the picking lists within the same cluster must be optimally assigned to improve picking efficiency and reduce the carbon emissions of picking activities. To solve the aforementioned problems, this study applies the K-means clustering algorithm and Prim’s minimum spanning tree algorithm to develop a sustainable warehouse operation methodology for optimizing picking-list consolidation and assignment.

3.2. Analytical Process Framework of the Proposed Methodology

Figure 2 presents the analytical process framework of the proposed methodology. This framework is divided into two parts. First, the analysis of K-means-based picking-list consolidation strategies for sustainable warehouse operations is performed. Second, the analysis of Prim’s minimum spanning tree-based picking-list assignment strategies for sustainable warehouse operations is executed.
In the first stage, multiple orders for customized compact camera modules are received. Next, the quantities of different types of components required for each order for customized compact camera modules are determined on the basis of the bill of materials for each order. Subsequently, the K-means algorithm is applied to merge picking lists with similar components and analyze multiple picking-list consolidation strategies and then the optimal picking-list consolidation strategy for sustainable warehouse operations can be identified. Therefore, in the first stage, the total operation time of the electric order-picking trucks can be considerably reduced by using the consolidation picking-list consolidation strategy to decrease carbon emissions. To decide the picking-list assignment within a cluster, the second part uses Prim’s minimum spanning tree algorithm to build a picking-list spanning tree and calculate the Euclidean distances between the picking lists. Next, the shortest distances between multiple picking lists in a given cluster are linked; that is, the picking lists that are most similar are linked to identify the shortest pickup path, which is represented on a graph (i.e., minimum spanning tree). The analytical result can be used to establish the optimal picking-list assignment strategy for sustainable warehouse operations. Hence, warehouse pickers can pick the required components more efficiently during picking operations and the operation time of electric order-picking trucks can significantly be depleted to fulfill the aim of sustainable warehouse operations. Table 1 shows the notations of variables of the proposed methodology.

3.2.1. Analysis of K-Means-Based Picking-List Consolidation Strategies for Sustainable Warehouse Operations

In this subsection, the various types of components in the bill of materials are used as the feature variables, and the K-means clustering method is applied to evaluate the degree of similarity between picking lists and to perform picking-list consolidation analysis with the objectives of reducing the number of inbound and outbound warehouse performed and the energy consumed by electric order-picking trucks. The complexity of the K-means algorithm is O (KnI), where I is the number of iterations and Kn represents the computation for the distances between data points and their clusters’ centers [8]. The analytical process of K-means-based picking-list consolidation strategies is as follows:
  • Step 1. The setting of initial parameters: Each picking list represents a single data point. The number of clusters used for picking-list consolidation and the maximum number of iterations is prespecified.
  • Step 2. From multiple data points, K-picking lists are randomly selected as the initial center points of K clusters.
  • Step 3. The Euclidean distance between a picking list and each group center is calculated as shown in Equation (1), and each picking list is assigned to the cluster that corresponds to the nearest cluster’s center. The Euclidean distance is an intuitive measure method and is suitable for continuous space.
d i , c = ( p i h c ) 2
  • Step 4. On the basis of the arithmetic mean, the center point of each cluster is recalculated.
  • Step 5. If a cluster’s center point has changed, Step 3 is repeated. If the cluster center point is unchanged, the process is terminated, and the optimal cluster’s result can be obtained.
In this study, the sum of squared errors (SSE) is used to evaluate the degrees of intra-group similarity for different numbers of clusters, as shown in Equation (2). SSE is a helpful metric in deciding the best number of clusters because it can respond to the clustering performance by measuring the squared average distance between all the points within a cluster to the cluster’s centroid. Consequently, this analysis can clarify how SSE decreases in response to an increase in the number of clusters. If increasing the number of clusters does not significantly improve the degrees of intra- cluster similarity, the optimal number of clusters is identified [5]. Through this analysis, the optimal picking-list consolidation strategy for sustainable storage operations can be obtained.
TSSE = i = 1 I j S i ( x i , j C i ) 2

3.2.2. Analysis of the Prim’s Minimum Spanning Tree-Based Picking-List Assignment Strategies for Sustainable Warehouse Operations

This study utilizes Prim’s minimum spanning tree algorithm to analyze picking-list assignment strategies. This method is a greedy algorithm that finds the minimum spanning tree with the shortest path through a weighted undirected graph (Sanaullah et al., 2020). Before a minimum spanning tree is constructed, picking lists must be linked to form a connected graph. All the nodes in the graph represent the picking lists, i.e., V = {v1, v2, ……, vn}, where n is the number of picking lists in a cluster. Connecting picking lists generates a total of n − 1 edges, that is, E = {e1, e2, ……, en−1}. Each edge represents the degree of similarity between two picking lists. The complexity of Prim’s minimum spanning tree algorithm is O (V + E).
First, we start with any picking list in the connected graph and link it to the picking list that is most similar to it. Because the two linked picking lists have the highest degree of similarity, the edge E of the linked picking lists has the lowest weight. This process is repeated n − 1 times to link all picking lists and generate a spanning tree. The spanning tree is a connected graph that represents the continuous picking action of a warehouse picker. Because picking lists are linked when (1) the similarity of picking lists is maximum each other and (2) the edge between picking lists is minimized, the minimum spanning tree formed by picking lists represents the optimal picking-list assignment strategy. Figure 3 presents the analytical process of the optimal picking-list assignment strategy for sustainable warehouse operations.

4. Case Study

This study used the compact camera modules produced by Company H as an example to verify the efficacy of the proposed methodology. The picking list information provided by Company H mainly comprised the order quantities and bill of materials for compact camera modules. Table 2 lists the compact camera modules manufactured by Company H and the order numbers that correspond to the product names. The customer orders and bills of materials provided by Company H can be converted to picking lists. This picking list specifies the quantities of the required components (e.g., integrated circuit, capacitor, connector, diode, and inductor) that a warehouse picker must pick up from the warehouse and then transferred to the production line so as to fulfill the assembly of the 5-megapixel autofocus compact camera modules for Order No. 16. This study examined 102 picking lists of compact camera modules that list a total of 24,613 components. Figure 4 shows the components required for the assembly process for Order No. 16.
When the types of components as specified by the picking list were obtained, the K-means clustering method was applied to analyze the picking-list clustering. Figure 5 illustrates the total within-group variances of the optimal clustering for various numbers of clusters, and it reveals that the within-group variance decreased when the number of clusters (K value) increased. When K = 9, the total within-cluster variances decreased considerably but tended to converge thereafter. Therefore, in this study, the optimal picking-list consolidation strategy for sustainable warehouse operations was determined to involve nine clusters as shown in Table 3. At this time, a warehouse picker could simultaneously pick multiple picking lists with high similarity; this enables the warehouse workers to reduce the picking distance to avoid excessive energy consumption by electric order-picking trucks.
The element aij in an adjacency matrix represents the distance between picking lists i and j. On the basis of the K-means clustering results, we constructed the spanning trees of the first to ninth clusters to find the minimum spanning trees. Prim’s minimum spanning tree algorithm was applied to find the shortest linkage distances for all picking lists to form a minimum spanning tree. Because the numbers of picking lists for the sixth to ninth clusters were small, the results for these clusters did not require further analysis and were assigned directly. Therefore, the first five clusters were analyzed subsequently, and the minimum spanning trees were identified, as shown in Figure 6, Figure 7, Figure 8, Figure 9 and Figure 10.
In the minimum spanning tree for the first cluster, the differences between No. 33 and 45, No. 51 and 127, and No. 16 and 17 were substantial; thus, these three links were removed such that the original first cluster could be split into four smaller clusters, namely 1A, 1B, 1C, and 1D as shown in Table 4. The step was performed to evenly distribute the number of picking lists in each cluster and balance the assignment of picking lists. Similarly, in the minimum spanning tree for the second cluster, the differences between No. 23 and 52 as well as No. 21 and 23 were substantial. Thus, these two links were removed such that the original second cluster could be split into three smaller clusters, namely 2A, 2B, and 2C as shown in Table 4. In the minimum spanning tree for the third cluster, the differences between No. 14 and 73, No. 14 and 15, and No. 4 and 73 were considerable; thus, these three links were removed such that the original third cluster could be split into four subgroups, namely 3A, 3B, 3C, and 3D as shown in Table 4. The minimum spanning tree for the fourth cluster indicated that the difference between No. 6 and 60 was considerable; therefore, this link was removed such that the original fourth cluster could be split into two subgroups, namely 4A and 4B as shown in Table 4. The minimum spanning tree for the fifth cluster revealed that the differences between No. 88 and 96, No. 90 and 87, and No. 92 and 98 were substantial; therefore, these three links were removed such that the original fifth cluster could be split into four subgroups, namely 5A, 5B, 5C, and 5D as shown in Table 4. The minimum spanning tree algorithm can link picking lists (vertices) to each other with the shortest distance. Because the distance traveled by the electric order-picking truck is minimized, its energy consumption and carbon emissions are decreased.
In this study, Prim’s minimum spanning tree algorithm was applied to optimize the clustering results of the proposed K-means clustering method and to develop the optimal picking-list assignment strategy for implementing sustainable warehouse operations. This method involves connecting the edges with the shortest distance between each data point to find the minimum distance path in a graph. Specifically, the most similar picking lists in each cluster were linked to enable a manager to assign the most similar picking lists to a warehouse picker, thereby achieving the optimal picking-list assignment.
To test the effect of the proposed methodology in reducing the carbon emissions of electric order-picking trucks, a comparison and analysis of the as-is model and the to-be models was conducted. For the as-is model, three picking lists of Company H were randomly selected, namely No. 16, 17, and 60. The to-be model was compared with the as-is model by examining the 4B group, which was obtained during the analysis of picking-list assignment strategies for implementing the optimal sustainable warehouse operations. The picking process originally implemented by Company H is that a single warehouse picker executes the picking task for one picking list at a time. In the to-be model, orders are merged before picking operations are performed, and the order numbers in this study were No. 60, 61, and 64.
Figure 11 illustrates the layout of Company H’s warehouse for storing various components on storage racks; the area illustrated in this figure comprises six aisles, and the solid black area represents the beams of a building. In this study, each component was assumed to have a dedicated storage location. The lower right section in Figure 11 displays the warehouse entrance and exit. A warehouse picker uses this position as the starting and ending points of each picking path. The carbon emission generated on the basis of the distance traveled by the electric order-picking truck was used to perform a performance evaluation, during which the differences between the performance of the as-is and to-be models were identified. Table 5 reveals that in the as-is model, the electric order-picking truck traveled a total of 693.3 m. By contrast, the electric order-picking truck traveled 227.2 m in the to-be model. That is, the to-be model increased pickup efficiency by reducing the distance by the electric order-picking truck by 466.1 m. For every 1 m of distance traveled, an electric order-picking truck consumes 6 watts of electricity. According to the Bureau of Energy in Taiwan [20], 0.502 kg of CO2 emissions per watt. Therefore, the to-be model reduced carbon emissions (CO2 e) by 233.9 kg.

5. Conclusions

The rapid growth of the consumer electronics market has led to an increase in the carbon emissions generated by warehouse operations in supply chains. To our knowledge, few academic papers simultaneously consider picking-list consolidation and assignment. To build a sustainable supply chain, this study focused on the picking operations of a supply chain and develops an optimal picking-list consolidation and assignment methodology for sustainable warehouse operations that were based on K-means clustering and Prim’s minimum spanning tree. To verify the effectiveness of this methodology, it was applied to the assembly of compact camera modules to compare the difference in the carbon emissions for the as-is model and the to-be model. Because compact camera modules are customized products, the types and specifications of components required are based on the needs of the customers. Therefore, different parts are picked for different picking lists, which considerably limits picking efficiency and leads to the high energy consumption of the electric order-picking truck. Given the aforementioned factors, the first stage of the proposed methodology applied the K-means clustering method to merge multiple picking lists with similar components, thereby establishing the optimal picking-list consolidation strategy for sustainable warehouse management. On the basis of the analysis results obtained during the first stage of the methodology, the second stage links the picking lists in each cluster that are most similar by applying Prim’s minimum spanning tree algorithm to create a graph comprising the minimum spanning tree. This step ensures that each warehouse picker is assigned the most similar picking lists to create a balanced work assignment.
Through the aforementioned analysis procedure, the picking-list assignment strategy for optimizing sustainable warehouse management can be implemented. The to-be model removes the need for a warehouse picker to enter a warehouse multiple times to perform picking operations. The execution of picking tasks for multiple picking lists with high similarity can substantially reduce the distance traveled by the electric order-picking trucks in a warehouse and improve picking efficiency to reduce carbon emissions.

Author Contributions

Conceptualization, T.-A.C. and Z.-H.C.; methodology, T.-A.C. and Z.-H.C.; software, T.-A.C. and C.-W.H.; validation, T.-A.C., Z.-H.C. and C.-W.H.; formal analysis, T.-A.C., Z.-H.C. and C.-W.H.; investigation, T.-A.C. and Z.-H.C.; resources, T.-A.C.; data curation, T.-A.C. and C.-W.H.; writing—original draft preparation, T.-A.C., Z.-H.C. and C.-W.H.; writing—review and editing, T.-A.C., Z.-H.C. and C.-W.H.; visualization, T.-A.C. and Z.-H.C.; supervision, T.-A.C.; project administration, T.-A.C.; funding acquisition, T.-A.C. All authors have read and agreed to the published version of the manuscript.

Funding

This research was funded by the Ministry of Science and Technology, Taiwan, grant number MOST 111-2221-E-141-003.

Institutional Review Board Statement

Not applicable.

Informed Consent Statement

Not applicable.

Data Availability Statement

After signing a non-disclosure agreement, the data utilized in this research cannot be shared.

Conflicts of Interest

The authors declare no conflict of interest.

References

  1. Minashkina, D.; Happonen, A. Decarbonizing warehousing activities through digitalization and automatization with WMS integration for sustainability supporting operations. In Proceedings of the 7th International Conference on Environment Pollution and Prevention (ICEPP 2019), Melbourne, Australia, 18–20 December 2019. [Google Scholar]
  2. World Economic Forum. Available online: https://www3.weforum.org/docs/WEF_LT_SupplyChainDecarbonization_Report_2009.pdfRL (accessed on 12 January 2023).
  3. AI-Powered Camera Sensors Computing at the Edge: Smart Cameras, Robotic Vehicles and End-Point Devices. Available online: https://www.gyrfalcontech.ai/wp-content/uploads/2020/09/AI-Powered-Camera-Sensors-GTI-WhitePaper.pdf (accessed on 12 January 2023).
  4. Dinh, D.T.; Fujinami, T.; Huynh, V.N. Estimating the optimal number of clusters in categorical data clustering by Silhouette coefficient. In Proceedings of the Knowledge and Systems Sciences, Da Nang, Vietnam, 1 November 2019. [Google Scholar]
  5. Géron, A. Hands-On Machine Learning with Scikit-Learn, Keras, and TensorFlow, 2nd ed.; O’Reilly Media: Sebastopol, CA, USA, 2019. [Google Scholar]
  6. McInnes, L.; Healy, J.; Astels, S. hdbscan: Hierarchical density based clustering. Open Source Softw. 2017, 2, 205. [Google Scholar] [CrossRef]
  7. Stewart, G.; Al-Khassaweneh, M. An Implementation of the HDBSCAN* Clustering Algorithm. Appl. Sci. 2022, 12, 2405. [Google Scholar] [CrossRef]
  8. Hand, D.J.; Mannila, H.; Smyth, P. Principles of Data Mining; The MIT Press: Cambridge, MA, USA, 2001. [Google Scholar]
  9. He, X.; Zhang, J. Supplier selection study under the respective of low-carbon supply chain: A hybrid evaluation model based on FA-DEA-AHP. Sustainability 2018, 10, 564. [Google Scholar] [CrossRef] [Green Version]
  10. Manupati, V.K.; Schoenherr, T.; Ramkumar, M.; Wagner, S.M.; Pabba, S.K.; Inder Raj Singh, R. A blockchain-based approach for a multi-echelon sustainable supply chain. Int. J. Prod. Res. 2020, 58, 2222–2241. [Google Scholar] [CrossRef]
  11. Lo, S.-C. A particle swarm optimization approach to solve the vehicle routing problem with cross-docking and carbon emissions reduction in logistics management. Logistics 2022, 6, 62. [Google Scholar] [CrossRef]
  12. Chiang, T.-A.; Che, Z.H. A decision-making methodology for low-carbon electronic product design. Decis. Support Syst. 2015, 71, 1–13. [Google Scholar] [CrossRef]
  13. Zhang, C.; Ji, W. Digital twin-driven carbon emission prediction and low-carbon control of intelligent manufacturing job-shop. Procedia CIRP 2019, 83, 624–629. [Google Scholar] [CrossRef]
  14. Çelik, M.; Süral, H. Order picking in a parallel-aisle warehouse with turn penalties. Int. J. Prod. Res. 2016, 54, 4340–4355. [Google Scholar] [CrossRef]
  15. Menéndez, B.; Pardo, E.G.; Sánchez-Oro, J.; Duarte, A. Parallel variable neighborhood search for the min-max order batching problem. Int. Trans. Oper. Res. 2017, 24, 635–662. [Google Scholar] [CrossRef]
  16. Chiang, T.-A.; Che, Z.H.; Lee, C.-H.; Liang, W.-C. Applying clustering methods to develop an optimal storage location planning-based consolidated picking methodology for driving the smart manufacturing of wireless modules. Appl. Sci. 2021, 11, 9895. [Google Scholar] [CrossRef]
  17. Rüdiger, D.; Schön, A.; Dobers, K. Managing greenhouse gas emissions from warehousing and transshipment with environmental Performance Indicators. Transp. Res. Proc. 2016, 14, 886–895. [Google Scholar] [CrossRef]
  18. Ries, J.M.; Grosse, E.H.; Fichtinger, J. Environmental impact of warehousing: A scenario analysis for the United States. Int. J. Prod. Res. 2017, 55, 6485–6499. [Google Scholar] [CrossRef]
  19. Freis, J.; Vohlidka, P.; Günthner, W.A. Low-carbon warehousing: Examining impacts of building and intra-logistics design options on energy demand and the CO2 emissions of logistics centers. Sustainability 2016, 8, 448. [Google Scholar] [CrossRef]
  20. Bureau of Energy. Available online: https://www.moeaboe.gov.tw/ECW/populace/content/SubMenu.aspx?menu_id=114 (accessed on 1 February 2023).
Figure 1. As-is picking operation model for compact camera modules.
Sustainability 15 03544 g001
Figure 2. Analysis process framework of the proposed methodology.
Sustainability 15 03544 g002
Figure 3. The analytical process of the optimal picking-list assignment strategy for sustainable warehouse operations.
Sustainability 15 03544 g003
Figure 4. Components required for the assembly process for Order No. 16.
Sustainability 15 03544 g004
Figure 5. Total within-group variances of the optimal clustering for various numbers of clusters.
Sustainability 15 03544 g005
Figure 6. The minimum spanning tree for the 1st cluster.
Sustainability 15 03544 g006
Figure 7. The minimum spanning tree for the 2nd cluster.
Sustainability 15 03544 g007
Figure 8. The minimum spanning tree for the 3rd cluster.
Sustainability 15 03544 g008
Figure 9. The minimum spanning tree for the 4th cluster.
Sustainability 15 03544 g009
Figure 10. The minimum spanning tree for the 5th cluster.
Sustainability 15 03544 g010
Figure 11. Layout of Company H’s warehouse.
Sustainability 15 03544 g011
Table 1. Notations of variables of the proposed methodology.
VariableDescription
h c the center point of the cth cluster
p i the picking list i
d i , c the distance between picking list i and the center point of the cth cluster
h c the center point of the cth cluster
TSSEthe total sum of squared errors within clusters
S i the picking-list set in the ith cluster
xi,jthe jth picking list in the ith cluster
Cithe center point of the ith cluster
Table 2. Compact camera modules and corresponding order numbers.
Product NameOrder Number
Auto focus (AF)1, 2
Fixed focus (FF)3, 4, 5, 6, 7, 8, 9, 10, 11
2 megapixels12, 13
4 megapixels14, 15
5 megapixels AF16, 17
8 megapixels AF18
8 megapixels FF19
High definition (HD)20, 21, 22, 23, 24, 25, 26, 27, 28, 29, 30, 31, 32, 33, 34, 35, 36, 37, 38, 39, 40, 41, 42, 43, 44, 45, 46
HD laptop47, 48, 49, 50, 51
HD CL52, 53, 54, 55, 56, 57, 58, 59
HD CR60, 61, 62, 63, 64
HD IR laptop65, 66, 67, 68, 69, 70, 71, 72
Hybrid RGB+IR Laptop73, 74
Laptop75, 76, 77, 78, 79, 80, 81, 82, 83, 84, 85, 86
Video graphics array87, 88, 89, 90, 91, 92, 93, 94, 95, 96, 97, 98, 99, 100
24 megapixels126, 127
Table 3. Optimal picking-list consolidation strategy.
Cluster No.Quantity of the Picking ListsPicking List No.
1233, 16, 17, 48, 49, 50, 51, 29, 85, 55, 62, 63, 30, 31, 32, 33, 34, 18, 44, 45, 46, 19, 127
21020, 21, 22, 24, 25, 52, 53, 54, 39, 40
32214, 15, 23, 26, 27, 28, 65, 66, 67, 68, 73, 74, 4, 5, 57, 59, 7, 8, 86, 41, 42, 126
476, 60, 61, 64, 9, 10, 11
5211, 2, 12, 47, 37, 38, 87, 88, 89, 90, 91, 92, 93, 94, 95, 96, 97, 98, 99, 100, 13
6456, 35, 36, 58
7580, 81, 82, 83, 84
8675, 76, 77, 78, 79, 43
9469, 70, 71, 72
Table 4. Optimal assignment result achieved using Prim’s minimum spanning tree algorithm.
Cluster No.Sub-Cluster No.Picking List No.
11A3, 17, 55, 62, 63, 85
1B16, 18, 48, 49, 50, 51
1C19, 29, 44, 45, 46, 127
1D30, 31, 32, 33, 34
22A52, 53, 54
2B23, 24, 25
2C20, 21, 22, 39, 40
33A14, 26, 27, 28, 86, 126
3B15, 41, 42
3C65, 66, 67, 68, 73, 74
3D4, 5, 7, 8, 23, 57, 59
44A6, 9, 10, 11
4B60, 61, 64
55A1, 2, 12, 91, 92, 97
5B90, 93, 94, 98, 99
5C13, 87, 88, 89
5D37, 38, 47, 95, 96, 100
6 56, 35, 36, 58
7 80, 81, 82, 83, 84
8 75, 76, 77, 78, 79, 43
9 69, 70, 71, 72
Table 5. Travel distances and carbon emissions of picking operation for the as-is model and the to-be model.
As-Is ModelTo-Be Model
Travel distanceCarbon emissionsTravel distanceCarbon emissions
693.3348227.2114.1
Disclaimer/Publisher’s Note: The statements, opinions and data contained in all publications are solely those of the individual author(s) and contributor(s) and not of MDPI and/or the editor(s). MDPI and/or the editor(s) disclaim responsibility for any injury to people or property resulting from any ideas, methods, instructions or products referred to in the content.

