1. Introduction
Streamflow is often considered to consist of runoff and baseflow. Runoff is composed mainly of surface flow, whereas baseflow has many definitions. Baseflow has been identified as the water that maintains streamflow during low-flow periods and also the components in high-flow periods, which consist mainly of groundwater or other sources [
1,
2,
3] or the streamflow components that respond slowly to precipitation and are associated with groundwater discharge [
4,
5,
6]. Many recent studies have identified baseflow as the flow resulting from groundwater discharge, which is mainly composed of shallow, lateral, and deep groundwater and other delayed sources, such as lakes, wetlands, and reservoir storage [
7,
8,
9,
10,
11], and changes gradually in the short- and long-terms [
12,
13]. Baseflow is not only a key source of basic streamflow but also plays an important role in groundwater systems [
6,
7,
14]. In the dry season, most streamflow consists of baseflow, whereas in the wet season, precipitation is the main source of streamflow, and the proportion of baseflow is low. As baseflow accounts for most streamflow in the dry season, water resources for the ecological environment and human activities must be provided by baseflow during this period. In areas with long-term drought, the dependence on baseflow is higher [
11,
15,
16,
17,
18].
Streamflow can be measured directly at streamflow stations, but it is difficult to measure baseflow directly. Thus, many methods have been proposed to separate baseflow from streamflow. These methods are usually divided into two types: tracer and non-tracer methods [
19]. The former are based on groundwater and changes in surface water with different chemical characteristics; they are highly accurate but time-consuming and difficult to apply in some basins. To overcome these disadvantages, various non-tracer methods have been proposed. They include the graphical method [
20], water balance method [
21], and numerical simulation [
22], and they have the advantages of versatility, simple operation, and high accuracy. Among them, numerical simulation is not only accurate but also easy to perform; methods include single-parameter digital filtering [
23], recursive digital filtering [
24], HYSEP [
25], and PART [
26], which are widely used in various hydrological analysis [
8,
10,
27,
28,
29].
Baseflow is generated by groundwater or other delayed sources (lakes, wetlands, etc.); thus, baseflow is clearly affected by basin characteristics, climate change, and human activities. Many studies have shown a strong correlation between these factors and baseflow [
7,
15]. The interaction between these factors and baseflow, in addition to the impacts of climate change and intensified anthropogenic activities, has attracted increasing attention. Fan et al. [
15] examined the baseflow variation in the Tarim River Basin of China from 1960 to 2007 and found that the increasing trend in baseflow was related to increased glacial melting upstream caused by rising temperatures. Ahiablame et al. [
13] investigated the impacts of climate change and agricultural land changes on the variation in baseflow in the Missouri River Basin from 1950 to 2014 and observed that increased precipitation resulted in decreased baseflow. Li et al. [
7] studied the baseflow trend in the Poyang Lake Basin of China from 1953 to 2014 and found that climate change had a greater effect on baseflow than land-use changes. Lucas et al. [
28] investigated the reasons for streamflow reduction in the Sao Francisco River Basin in Brazil and found that 86% of the streamflow reduction was attributable to reduced baseflow; increased evaporation and the expansion of irrigated agriculture were also found to be factors in streamflow reduction. Ayers et al. [
10] examined the baseflow trends in the Midwestern United States and observed that baseflow was more significantly correlated with climate change than with land use. In summary, the impacts of climate change and human activities on baseflow have become an important topic in hydrological research.
Southern Taiwan has a tropical monsoon climate. Precipitation is concentrated in spring and summer, including plum rain in May and June, typhoons from July to October, and the irregular southwest monsoon from May to August. These are the main sources of precipitation and water resources in Southern Taiwan. In autumn and winter, precipitation is low because the region is located on the leeward side of the Central Mountains, which block moisture from the northeast monsoon. For these reasons, Southern Taiwan has distinct wet and dry seasons, with a precipitation ratio of approximately 9:1 [
30]. In addition to the strong temporal variation in precipitation, the spatial distribution, large variation in precipitation intensity, and steep terrain result in short, fast-flowing streams; thus, the limited water resources are more difficult to store. Rivers and reservoirs account for approximately 85% of Taiwan’s water resources, and groundwater accounts for the remaining 15% [
31]. In recent years, the dry and wet seasons have become extreme. For example, an extreme drought in May 2021 caused reservoirs to dry up, resulting in a water resource crisis [
32], and a subsequent extreme rainstorm caused flood disasters in many places in Taiwan. Because of the rapid intensification of global climate change and human activities, island countries such as Taiwan face an increasing shortage of water resources. To maintain a stable water supply from rivers in both the dry and wet seasons, it is important to understand the changes in baseflow caused by climate change and human activities. Therefore, the purposes of this study are as follows: (1) analyze the trend of long-term baseflow; (2) identify the controlling factors affecting baseflow; (3) quantify the contribution of human activities and climate changes to the baseflow variation between pre- and post-period; and (4) evaluate the linkages between baseflow and large-scale climate patterns, including the El Niño–Southern Oscillation (ENSO) and Pacific Decadal Oscillation (PDO) in Southern Taiwan. The results related to baseflow of this study are particularly meaningful for Southern Taiwan, where rainfall and streamflow are highly concentrated in a few months. The findings can enhance our understanding of the baseflow variation and related reasons and provide a basis for future water resource management, contributing to the establishment of hydrological policy references.
3. Results and Discussion
3.1. Hydrological Variation Analysis
Streamflow and baseflow were separated by digital filtering, and the variations in streamflow and baseflow over time at eight stations in the Southern Taiwan Basin are presented. The annual average streamflow and baseflow trends were analyzed by Mann–Kendall trend analysis, and the trend slopes were estimated by Theil–Sen estimation. The results are shown in
Figure 2.
The annual average precipitation in the Southern Taiwan Basin is 2203 (mm/year); the annual average precipitation increase is 22 (mm/year), and the precipitation showed an insignificant (
p > 0.05) increasing trend at all stations. The annual average streamflow is 2230 (mm/year), and the annual average streamflow increase is 21 (mm/year). Streamflow showed an increasing trend at all stations except Chungtechou, with significant (
p < 0.05) trends at Chukou and Santimen. The annual average baseflow is 1190 (mm/year), and the annual average baseflow increase is 14 (mm/year). The variation in baseflow is similar to that in streamflow, and the baseflow showed an increasing trend at all stations except Chungtechou, which showed an insignificant decreasing trend. Significant (
p < 0.05) trends were observed at Chukou, Hsinshih, Santimen, Chaochou, and Hsinpei (
Table 3). Previous studies noted that if the change in baseflow is larger than streamflow and exhibits significant variation in the long term, the baseflow is sensitive to changes in natural or human activities in the basin [
8].
This study also considered the annual variation in BFI at each station, as shown in
Figure 3. The average BFI in the Southern Taiwan Basin is 0.52, but it varies over a large range, with the highest BFI at Laonong station (0.70) and the lowest at Tsochen station (0.32). No stations have a high BFI value (BFI > 0.7). Tsochen and Chungtechou have low BFIs (BFI < 0.4), and the streamflow at other stations is a combination of baseflow and runoff. Overall, the main sources of streamflow in the Southern Taiwan Basin vary with location.
The analysis shows that baseflow exhibited a significant increasing trend after 2000. In addition, the baseflow change and its range before and after the change point were examined. The results are shown in
Table 4. All stations except Chungtechou show an increasing trend after the change point, where the smallest change (19.5%) appeared at Tsochen, and the largest (66.5%) appeared at Laonong. The change points of the stations are clustered around 2000, indicating that baseflow shows a significant increasing trend after approximately 2000. Trend analysis shows that the baseflow and streamflow also have increasing trends, indicating that baseflow was significantly affected by natural or human activities during the study period. Overall, the baseflow and BFI at most stations change considerably with time, and the baseflow has a significant increasing trend.
3.2. Partial Correlation Analysis
Partial correlation analysis was used to examine the correlation between hydrometeorological variables and identify controlling factors for streamflow, baseflow, and BFI. The potential climate controlling factors include precipitation and evaporation in this study. The results are shown in
Table 5. Each station shows a significant positive correlation between precipitation and evaporation, and precipitation, evaporation, and streamflow have a significant positive correlation, where the correlation between precipitation and streamflow is greater than that between evaporation and streamflow. Regarding the partial correlations, when evaporation is ignored, precipitation and streamflow show a significant positive correlation at all stations, whereas the correlation between evaporation and streamflow is insignificant when the effect of precipitation is ignored, except at Santimen. Overall, precipitation has a greater effect on streamflow than evaporation.
Baseflow has a significant positive correlation with precipitation, and it shows a significant positive correlation with evaporation only at some stations. Regarding the partial correlations, when the effect of evaporation is ignored, precipitation and baseflow show a significant positive correlation at all stations. By contrast, evaporation and baseflow have an insignificant positive correlation when the effect of precipitation is ignored, except at Santimen and Hsinshih, and Chungtechou and Chaochou show an insignificant negative correlation. Overall, precipitation has a greater effect on baseflow than evaporation.
The BFI is negatively correlated with precipitation at all stations except Laonong and Hsinpei, and it is positively correlated with evaporation at all stations except Chungtechou and Chukou. Regarding the partial correlation, precipitation and BFI are negatively correlated when the effect of evaporation is ignored at all stations except Hsinpei. By contrast, evaporation and BFI are positively correlated when the effect of precipitation is ignored, except at Chungtechou and Chukou stations.
Precipitation and evaporation have a significant positive correlation with streamflow and baseflow. The reason for the positive correlation between evaporation and streamflow (or baseflow) was that precipitation and evaporation have a similar pattern (high in summer and low in winter), and the range of precipitation variability is greater than evaporation within a year. Although higher evaporation reduces streamflow (or baseflow) in summer, a large amount of precipitation compensates for the aforementioned reduction. This observation is related to the obvious dry and wet seasons in Southern Taiwan, where both precipitation and evaporation are concentrated in the wet season. Correlation analysis revealed a significant positive correlation between the climate variables and baseflow. Streamflow and baseflow are most abundant in the wet season; therefore, precipitation and evaporation have a significant positive correlation with streamflow and baseflow. However, partial correlation analysis revealed that precipitation has a more significant effect on streamflow and baseflow than evaporation, indicating that precipitation is the main factor controlling streamflow and baseflow. Because precipitation increases streamflow and baseflow, a certain time is needed for precipitation infiltration to produce baseflow; thus, the increase in streamflow is greater than that in baseflow, resulting in a negative correlation between BFI and precipitation. Evaporation decreases streamflow, including baseflow, but the evaporation of surface runoff is greater than that of baseflow, resulting in a positive correlation between BFI and evaporation. Overall, partial correlation analysis showed that when precipitation has an increasing trend (
Table 2), it has a significant positive correlation with baseflow (
Table 5), resulting in an increasing trend in baseflow. In contrast, evaporation has an insignificant correlation with baseflow, indicating that precipitation is the main factor controlling baseflow in the Southern Taiwan Basin.
3.3. Attribution Analysis of Baseflow
3.3.1. Sensitivity Analysis
Sensitivity analysis was used to investigated the sensitivity of the baseflow to precipitation, evaporation, and human activities. The results are shown in
Table 6. Taking Santimen station as an example, for every 1% increase in precipitation (evaporation), the baseflow increases by 1.18% (2.63%). The mean sensitivities of the baseflow to precipitation and evaporation are 1.03 and 1.87, respectively. The baseflow is more sensitive to evaporation than to precipitation, and increases in precipitation and evaporation significantly affect baseflow, consistent with the results of the partial correlation analysis. The
n values in the Budyko hypothesis are negative at all stations except Wang and Tang [
54] at Chukou, Tsochen, Hsinshih, Laonong, Santimen, and Hsinpei stations, indicating that increasing human activities reduces the baseflow. Overall, evaporation has the greatest impact on baseflow, followed by precipitation and human activities.
3.3.2. Analysis of n Values in Budyko Hypothesis
The study period was divided into pre- and post-periods according to the baseflow change point, and the
n values in the pre- and post-periods were compared. The results are shown in
Figure 4. The
n values at all stations increased significantly after the change point, except those reported by Zhang et al. [
57] at Santimen and Laonong stations, which did not change significantly. These results indicate that human activities tend to increase after the change point. The mean
n value of Fu [
56] is the largest (
n = 4.51), and the smallest is that of Wang and Tang [
54] (
n = 0.78); in addition, Chaochou station has the largest
n value among all the stations. The parameter n and the percentage of the basin area affected by human activities are positively correlated, which greatly affects the characteristics of the basin and hydrological environment [
55]. The possible reasons for changes in basin characteristics, including land-use changes and surface water consumption, are reflected by the parameter
n. Under the same climate conditions, the water demand increases with increasing
n [
60]. The analysis in this study shows that the affected basin area in Southern Taiwan has increased over the past 40 years. Under the increasing trend in human activities, the baseflow still shows an increasing trend (
Table 3), indicating that climate change has a greater effect than human activities. This conclusion will be discussed in terms of the attribution analysis in
Section 3.3.3.
Table 6.
Sensitivity of climatic variables to baseflow.
Table 6.
Sensitivity of climatic variables to baseflow.
| Stations | Precipitation | Evaporation | Budyko Hypothesis n Value |
|---|
| Fu [56] | Zhang et al. [57] | Choudhury [48] | Wang and Tang [54] |
|---|
| Chukou | 0.96 | 1.42 | 0.01 | −0.29 | −0.01 | 0.35 |
| Tsochen | 1.08 | 2.14 | −0.25 | −0.44 | −0.18 | 0.19 |
| Hsinshih | 1.24 | 2.97 | −0.02 | −0.23 | −0.03 | 0.65 |
| Laonong | 1.1 | 2.59 | −0.19 | −0.43 | −0.16 | 0.89 |
| Chungtechou | 1.03 | 0.92 | −0.40 | −0.37 | −0.33 | −0.10 |
| Santimen | 1.18 | 2.63 | −0.07 | −0.39 | −0.07 | 0.68 |
| Chaochou | 0.81 | 0.83 | −0.18 | −0.27 | −0.17 | −0.18 |
| Hsinpei | 0.85 | 1.44 | 0.08 | −0.17 | 0.06 | 0.31 |
Figure 4.
Variation of
n values estimated by four Budyko hypotheses [
48,
54,
56,
57].
Figure 4.
Variation of
n values estimated by four Budyko hypotheses [
48,
54,
56,
57].
3.3.3. Attribution Analysis of Baseflow Change
Figure 5 shows the results of sensitivity analysis, MLR analysis, and the Budyko hypothesis in terms of the attribution of baseflow changes in the Southern Taiwan Basin. Climate change increases baseflow by 75.0%, and human activities decreases it by −2.9%, indicating that climate change has a greater effect on baseflow than human activities. Climate change results in increased baseflow because of increased precipitation (
Table 3), and increases in human activities result in decreased baseflow, but this contribution is insignificant compared with that of climate change. Human activities show an increasing trend at Chungtechou and Chaochou stations after the change point, according to the area of registered land data provided by the Statistical Yearbook of the Interior [
61], published by the Ministry of the Interior. A possible reason for the increase in baseflow is increases in forest land and urbanized areas. Urbanization increases the area of the impervious layer and decreases groundwater recharge, resulting in increased surface runoff and decreased baseflow. However, the increase in forest land area contributes to the infiltration of precipitation and enhances groundwater flow, which strongly affects baseflow [
62].
The results of the analysis based on the Budyko hypothesis are consistent across all the stations, whereas the results of the elastic and MLR methods vary considerably between stations. Although many previous studies have used the elastic and MLR methods to assess the relative contributions of climate change and human activities to hydrological change [
18,
46,
63,
64,
65], some studies have indicated that inaccurate evaporation data may result in large errors [
60,
66]. In addition, the MLR method is more suitable for large-scale basins [
67,
68] and thus may not be applicable to smaller basins such as the Southern Taiwan Basin.
Many studies have discussed the impacts of climate change and human activities on hydrological change, mainly in arid and semi-arid regions [
18,
58,
65,
69,
70]. Because these regions are located inland and have less precipitation, the impact of climate change on the hydrological environment is small, and thus the ecological environment and human daily water use depend strongly on rivers. To ensure sufficient water resources, many water conservancy projects have been implemented to maintain the required water supply, including water for agricultural irrigation and domestic water use. These projects caused significant changes in the local hydrology [
71,
72,
73]; consequently, human activities have had a greater impact on hydrology than climate change. This study considered a region in the coastal area of the Western Pacific Ocean with a tropical monsoon climate, where water vapor easily enters Southern Taiwan, resulting in high precipitation that significantly affects the hydrological cycle. Therefore, climate change has a greater effect on the Southern Taiwan Basin than human activities, as shown in
Figure 5.
The analysis shows that climate change has a greater effect on baseflow than human activities and is the main factor in the increase in baseflow. The reason is that the intensification of climate change in recent years has resulted in increases in precipitation and the frequency of heavy rainfall, which increased the amount of rainfall infiltration and thus the baseflow. Increased human activities resulted in decreased baseflow, mainly because of urbanization, water conservancy projects, and decreased forest land area. Overall, the baseflow variation is more consistent with the pattern of climate change since human activities have relatively less influence on baseflow.
Figure 5.
Attribution analysis of baseflow changes with sensitivity analysis [
44], Budyko hypothesis [
48,
54,
56,
57] and MLR analysis.
Figure 5.
Attribution analysis of baseflow changes with sensitivity analysis [
44], Budyko hypothesis [
48,
54,
56,
57] and MLR analysis.
3.4. Wavelet Coherence of Baseflow and ENSO
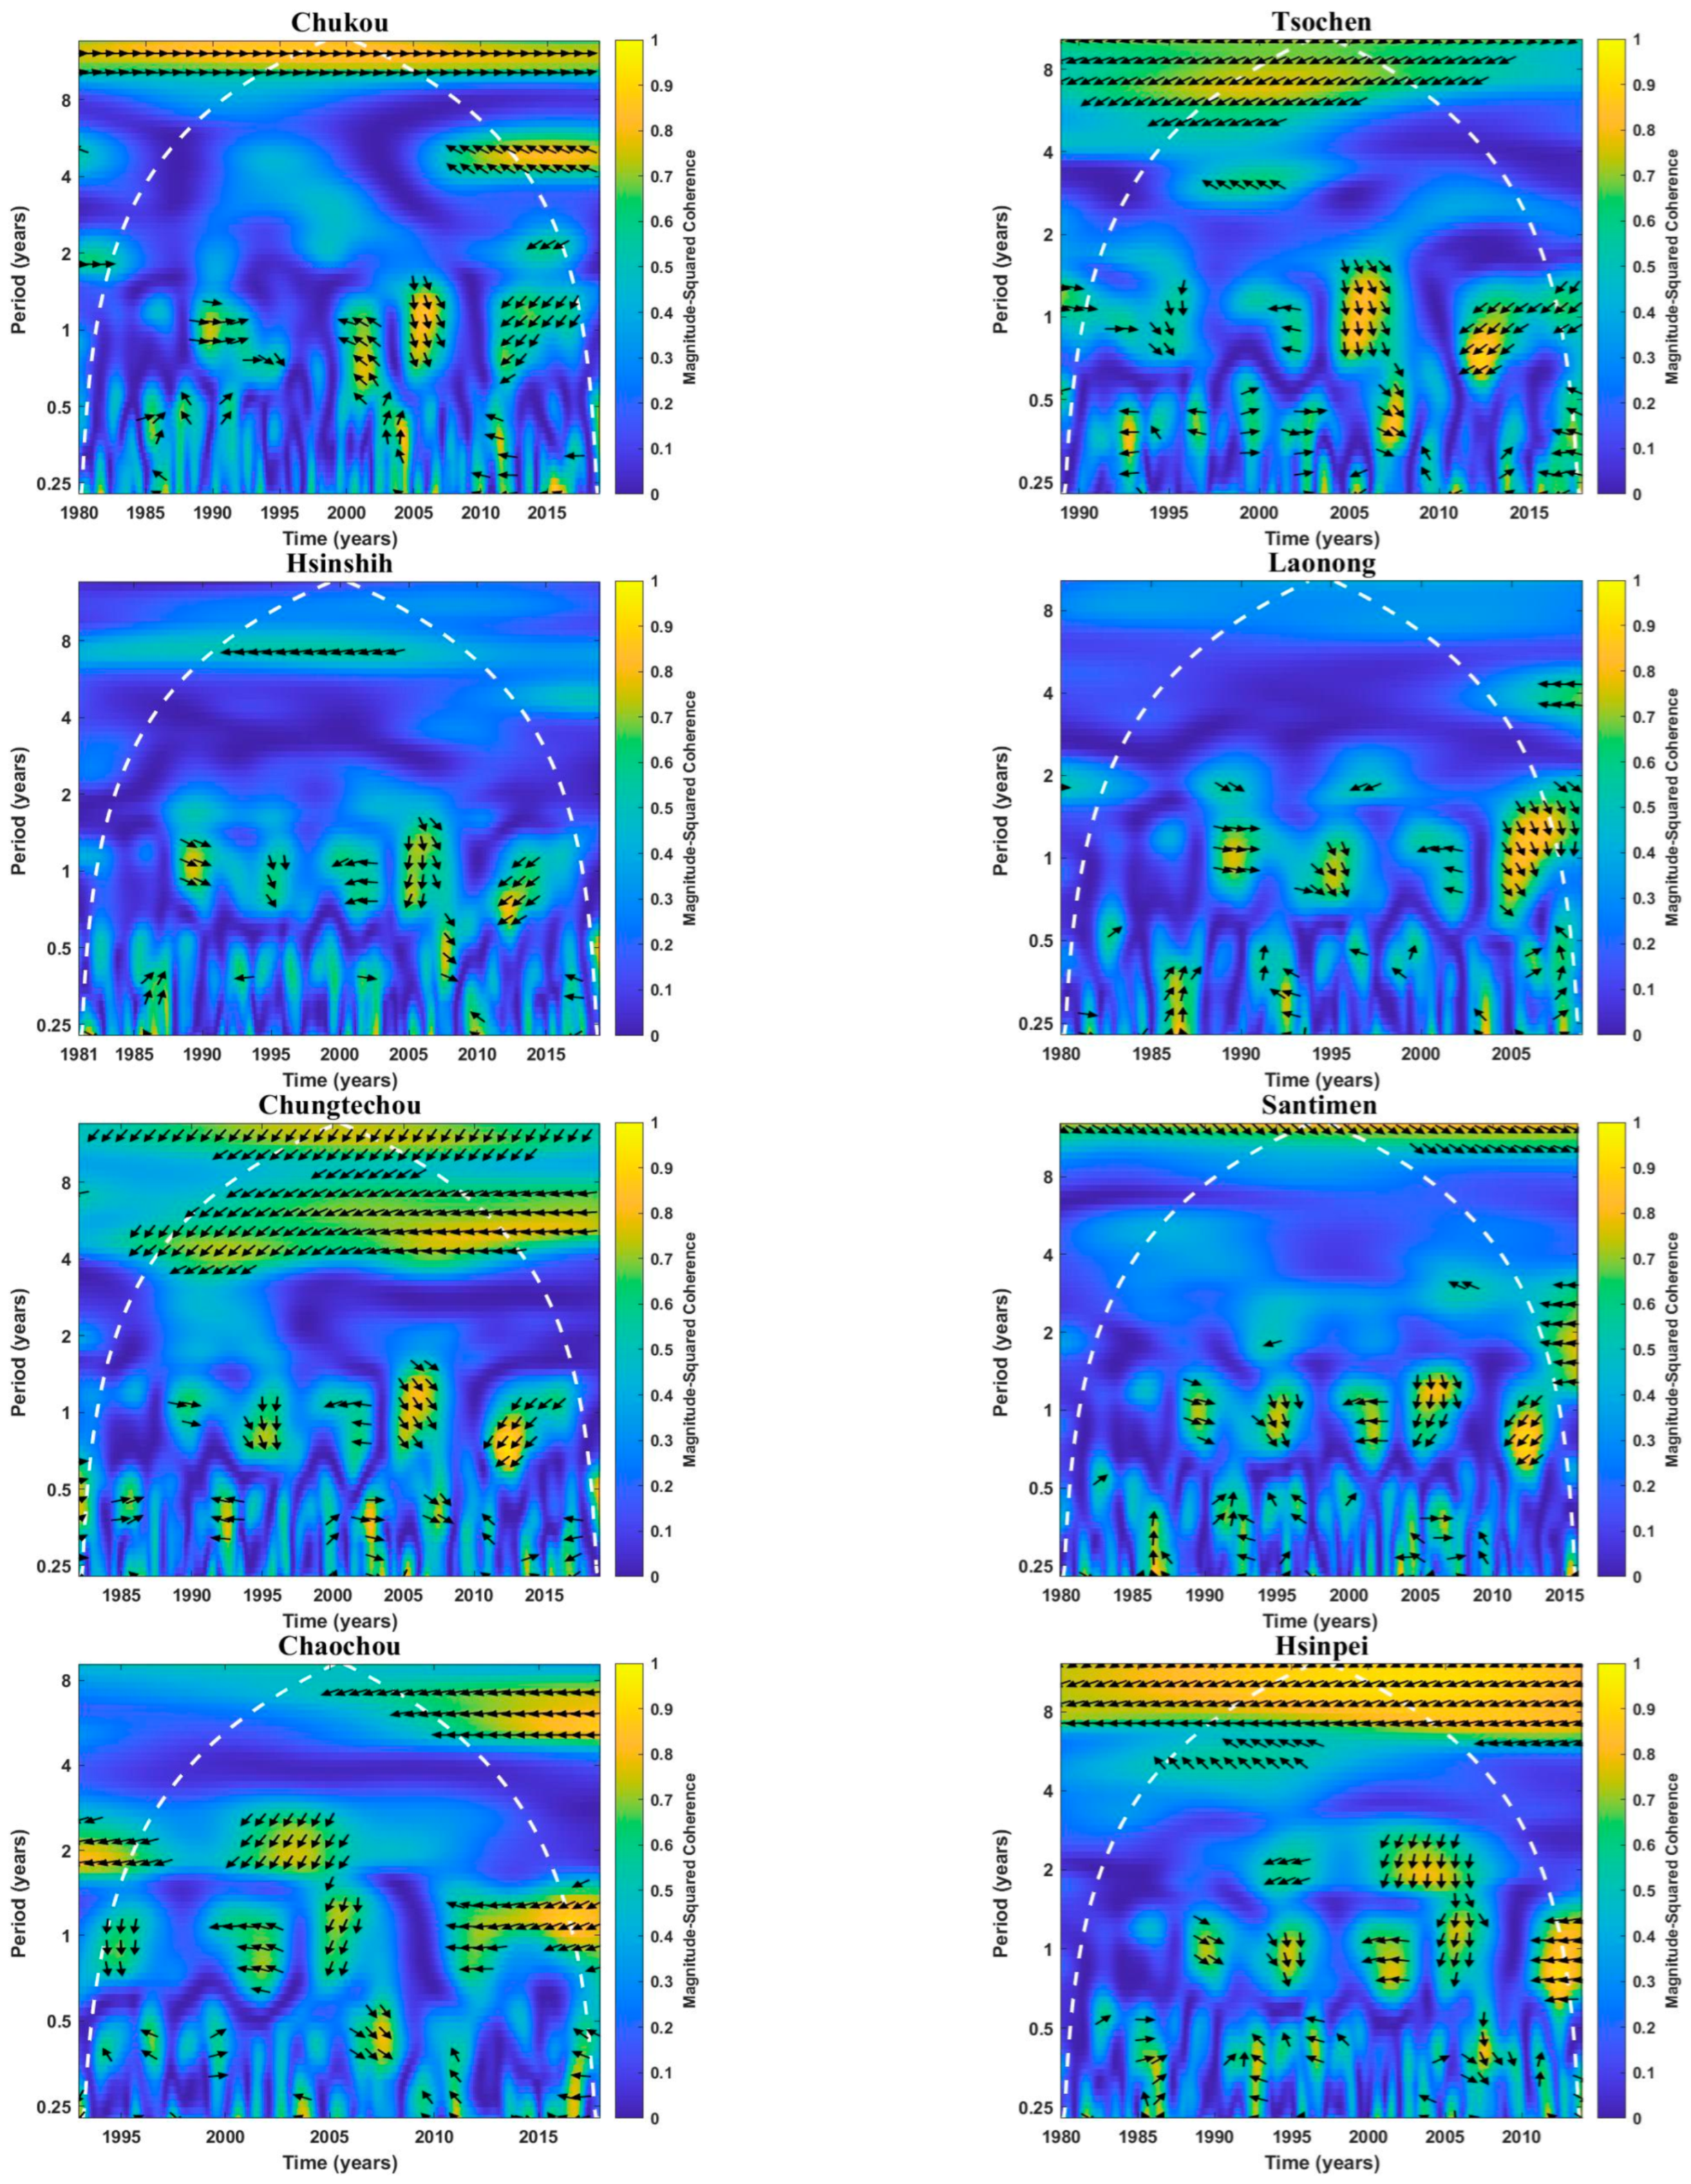
This study considered the effects of large-scale climate patterns on baseflow. The ENSO index and baseflow were analyzed by wavelet analysis, and the temporal correlation between the ENSO and baseflow signals was observed. The wavelet coherence between the ENSO and baseflow is shown in
Figure 6. The baseflow correlated with the ENSO at the 2–4-year band at Hsinshih, Santimen, Tsochen, and Chaochou stations, specifically, with Hsinshih and Santimen around 1980 and Tsochen and Chaochou around 2010. The baseflow correlated with the ENSO at the 4–8-year band at Tsochen, Chungtechou, Santimen, Chaochou, and Hsinpei stations, and the stations, except for Chungtechou, exhibiting moderate coherence in some years. The baseflow correlated with the ENSO at a band above 8 years at the Chukou, Chungtechou, Santimen, Chaochou, and Hsinpei stations, and the stations exhibit high coherence in some years, except for Chukou and Hsinpei. Higher time bands may appear at some stations, but because of the short study period, their phase angles cannot be observed.
The phase angle between the ENSO and baseflow indicates a negative phase (left-pointing arrow, where the phase angle is located at and ), except for Chukou station; that is, when the ENSO index is positive, the baseflow in Southern Taiwan is lower. An angle of indicates that the lead–lag between the ENSO and baseflow is larger. In addition, the correlations at all stations below the 1-year band are more complex; because the ENSO index and baseflow are monthly data, the correlation will exhibit a periodic change at the 1-year band. Overall, the baseflow in Southern Taiwan Basin is affected by the ENSO at two poles. The periodicity of the stations greatly affected by the ENSO is mainly at the 4–8-year band, and a correlation may exist above the 8-year band.
3.5. Wavelet Coherence of Baseflow and PDO
The wavelet coherence between the PDO and baseflow is shown in
Figure 7. The baseflow correlated with the PDO at the 2-year band at Chaochou and Hsinpei stations from 2000 to 2005; correlated with the PDO at the 4–8-year band at Chukou, Tsochen, Hsinshih, Chungtechou, and Chaochou stations. The stations are significantly correlated in some years, except for Tsochen and Chungtechou stations, and the Chukou and Chaochou stations are correlated after 2005. The baseflow correlated with the PDO above the 8-year band at Chukou, Tsochen, Chungtechou, Santimen, and Hsinpei stations, which are moderately or very significantly correlated throughout the study period. In addition, all stations show a periodic change in correlation at the 1-year band.
The phase angles of the PDO and baseflow are similar to those of the ENSO and baseflow, and they show negative phases, except at Chukou station. The baseflow is more strongly correlated with the PDO than with the ENSO, indicating that the PDO has a greater effect on baseflow than the ENSO. However, their impacts on baseflow are similar. The ENSO and PDO are large-scale climate patterns in the Pacific Ocean and are closely related. A change in the PDO may result in an SST anomaly and a change in the relationship with the ENSO [
74]. The PDO is associated with SST fluctuation similar to that of the ENSO in the Pacific, which is more prominent in temperate regions, especially in the North Pacific [
75,
76]. When the ENSO and PDO are in phase, the correlation with the ENSO around the Pacific increases [
77]. In this study, the PDO shows a more significant negative correlation with baseflow than the ENSO. This phenomenon was also reported by Li et al. [
78], who discussed the impact of the PDO on climate change throughout East Asia. Some studies have also shown that climate characteristics in the low-latitude Pacific are more strongly correlated with the PDO than with the ENSO [
79], resulting in changes in the circulation in this area; these results are consistent with those of this study. Gonsamo et al. [
80] reported that the PDO was in a positive phase from 1980 to 2000 and entered a negative phase in early 2000. The PDO has a period of approximately 20–30 years; therefore, before 2030, the SST in the equatorial Eastern Pacific will be high and form an anticyclonic wind field near the Philippine Sea. Taiwan is located on the northwest side of the wind field, and the enhanced southwest wind brings moisture into Taiwan and increases precipitation [
81], consistent with the baseflow increase after 2000 in this study (
Table 4). However, the anticyclonic wind field is unfavorable to typhoon development and thus decreases the precipitation resulting from typhoons in Taiwan. Therefore, the impact of the PDO on precipitation in Taiwan should be studied further.
In addition, because the ENSO and PDO have different periods, they affect the baseflow at different times. Because the study period is short, the analysis of the effects of these two climate patterns on baseflow cannot reveal the phase relationship above the 8-year band, and thus it is difficult to analyze the correlation on longer time scales. Overall, the ENSO and PDO have similar effects on baseflow in Southern Taiwan, but the PDO has a stronger effect on baseflow than the ENSO. The former is at the 4–8-year band, and the latter is at the 8-year band, with a periodic correlation change at the 1-year band.
3.6. Uncertainty Analysis
The significance of long-term baseflow trend analysis was implemented by the Mann–Kendall test without considering the serial correlation in this study. Positive (negative) serial correlation overestimates (underestimates) the significance of the trend if serial correlation is not taken into account [
82,
83]. Therefore, this study may overestimate the significance of the trend since the hydrometeorological variables are often in positive serial correlation. The number of basins with a significant upward trend may be reduced after serial correlation is taken into account. However, the change in results do not have much effect on the final conclusion. The more accurate trend analysis can be obtained by using the pre-whitening Mann–Kendall analysis [
82,
83] in the future study.
The MLR analysis, sensitivity analysis, and Budyko hypothesis (four equations) were used to quantify the relative contributions of climate change and human activities to baseflow variations. Although most basins in this study consistently showed that climate change contributes more than human activities, the quantized results of different methods still showed considerable variation. The reasons for the uncertainty include different considerations of climate change factors, indirect assessments of human activities, and complex interactions among factors driving baseflow variation. Actual evaporation was regarded as the factor affecting the baseflow caused by climate change in the MLR analysis, while the sensitivity analysis and Budyko hypothesis regarded potential evaporation as the factor affecting the baseflow caused by climate change. Therefore, different climate factors that were considered may cause different results. Another related reason resulted from the difficulty of quantifying human activities and the lack of relevant data. The contributions of climate change are often assessed first, and then the remaining changes are regarded as caused by human activities in attribution analysis, Therefore, the contribution of human activities depends on climate change, and the results do not necessarily reflect real human activities. The factors of climate change and human activities are not completely independent; for example, both human activities and climate change will affect vegetation. However, vegetation was regarded as human activities in this study because vegetation is neither precipitation nor evapotranspiration. Therefore, complex interactions lead to uncertainty in the results of the attribution analysis.
4. Conclusions
This study investigated the variation in baseflow in the main Southern Taiwan Basin through: (1) analyzing the trend of long-term baseflow using the Mann–Kendall test and Sen’s slope; (2) identifying the controlling factors affecting baseflow using partial correlation; (3) quantifying the contribution of human activities and climate changes to the baseflow variation using sensitivity analysis, MLR analysis and Budyko hypothesis; and (4) evaluating the coherence between baseflow and large-scale climate patterns using wavelet analysis. The results showed that streamflow and baseflow exhibited a significant increasing trend in the Southern Taiwan Basin. The BFI results show that the baseflow has a smaller effect on streamflow variation than runoff but cannot be ignored. Correlation analysis showed that precipitation and evapotranspiration have similar correlations with baseflow because they are both concentrated in the wet season. In addition, partial correlation analysis showed that the correlation between baseflow and precipitation is much stronger than that between baseflow and evaporation, indicating that precipitation is the main climate variable controlling baseflow in the Southern Taiwan Basin. Baseflow attribution analysis showed that climate change has a much greater effect on baseflow (+75.0%) than human activities (−2.9%), indicating that baseflow is affected mainly by climate change. Climate change increases baseflow because of increased precipitation, and human activities decrease baseflow because of increased urbanization and decreased forest land area. The human activities had relatively less influence on baseflow and the baseflow variation is more consistent with the pattern of climate variation. Wavelet analysis showed that baseflow is correlated with the ENSO at the 4–8-year band and with the PDO at the 8-year band, and the periodic correlation changes at the 1-year band. Baseflow is more strongly affected by the PDO than by the ENSO, and moisture resulting from the anticyclone generated by the negative phase of the PDO after 2000 was consistent with the change points of baseflow. In addition, the phase angles of the ENSO and PDO indicate negative relationships; that is, when the ENSO or PDO is in the positive phase, baseflow decreases, and vice versa. This study clarify the changes in and periodicity of baseflow with time and the relationship between climate characteristics and baseflow. The results are helpful for understanding the baseflow variation trend and possible mechanisms, as well as providing a reference for water resource management in Southern Taiwan, where precipitation and streamflow are highly uneven within a year.


