Abstract
Since 2016, the Hong Kong Stock Exchange (“HKEx”) has required listed companies to issue Environment, Social and Governance (“ESG”) reports annually. The purpose of ESG reports is to inform stakeholders and the general public of listed companies’ performance in ESG aspects. For big corporations, issuing ESG reports and reporting their key performance indicators (“KPIs”) are not a problem because they have been doing so voluntarily for years. Rather, it is a challenge for small and medium-sized listed companies (“SMEs”) to report properly because they may be lacking in knowledge, skills and motivation, etc. In particular, the quality of quantitative measurements on ESG data disclosure remains variable. This research effort adopted a scoring methodology to assess the relevance and completeness of the environmental KPIs, which are semi-mandatory to disclose. A total of 138 SMEs were proportionately selected by a stratified sampling method based on the 11 categories of industries set by the Hang Seng Industry Classification System. The disclosure quality of these selected sample companies’ environmental KPIs was assessed by scoring. We found that the average disclosure quality score was a low 1.98. “Energy Use Efficiency” was the highest-performing KPI, while “The Environment and Natural Resources” was the lowest-performing KPI. Across the different industries, Industrial Goods achieved the highest disclosure quality score, while the Telecommunication industry had the worst score. This research also explored some of the common problems faced whilst reporting environmental KPIs.
1. Introduction
As sustainability becomes more mainstream [1,2], it is now embedded in manufacturing, banking, retailing, catering, education, government and civil society [3,4]. Hong Kong a leading international financial center, has more than 3000 listed companies on the Hong Kong Stock Exchange (“HKEx”) and provides a dynamic platform for companies to secure financing for their business development. Environmental, Social and Governance (“ESG”) reporting is an obligation for all listed companies in Hong Kong for the purpose of clearer disclosure of their performance in sustainability [5].
The extant literature for measuring the quality of ESG reports is mainly either qualitative or merely based on a binary (yes or no) quantitative survey to assess the reporting quality. In recent years, more rigorous methodologies for measuring ESG reporting quality emerged. For example, Badia, Bracci and Tallaki measured the quality and diffusion of social and sustainability reporting in Italian public utility companies by using a point-scoring approach to judge the quality [6]. This research applies a more rigorous five-point scoring methodology against the HKEx’s ESG reporting framework and disclosure requirements to determine the quality of environmental key performance indicators (“KPIs”), which is the key disclosure requirement in ESG reporting [7].
The Values of the Study
Studying ESG reporting disclosure quality can reveal insights to improve the effectiveness of ESG communications between companies and their stakeholders, which may finally lead to more successful business operations satisfying different ESG needs of stakeholders [8,9,10,11]. The readers of ESG reports are mainly the stakeholders of companies, who need to know more about the impact of environmental and social issues on their individual interests. For example, the shareholders (investors) seeking growth in their investments may want to know how the business’s financial performance will be affected by environmental and social activities [12]. As for the customers, they are of utmost importance for companies’ survival [13,14,15]. The presence of other stakeholders actually and ultimately depends on the presence of customers. Customers may want to know they are supporting a business that has a high ethical standard and cares about their interests such as product quality, fair wages and ethical sourcing. Employees are important internal stakeholders. They are generally interested in staff well-being, such as safe working environments and staff welfare. Suppliers may be keen to understand their customers’ concerns on ESG issues; this helps to design and enhance the features of products and services fulfilling customers’ needs in ESG. Finally, the community is also a stakeholder of companies since the operation of the business affects the local community in terms of environmental impact and employment rate. An ESG report with high disclosure quality provides valuable and relevant information that addresses different stakeholders’ concerns on issuers’ performance in environmental and social aspects [16].
Environmental KPIs in ESG reports are semi-mandatory disclosures. If not reported properly, issuers risk losing their listing status. Most importantly, environmental KPIs are directly related to climate change, which is currently the most prominent environmental threat to human existence, with far-reaching implications including extreme weather and the destruction of our habitat. If the environmental KPIs are improved, the positive impact on the environment is direct. The quality of the disclosure reflects the effectiveness of ESG reporting, which may raise awareness of environmental issues for combating climate change. This is timely research to investigate the environmental disclosure problem because the semi-mandatory requirement for disclosing environmental KPIs was implemented for the first time in 2017. The majority of issuers’ ESG reports containing formal environmental KPIs were just published from March 2018 onward. Until the writing of this article, there has been no similar research on this particular topic, especially on the SMEs in Hong Kong.
If the reporting quality issues in environmental KPIs are thoroughly researched, it is not only beneficial to the environment, but this also helps policy makers and regulators to adjust reporting requirements and hold SMEs to better reporting standards. This is also crucial for the overall sustainable development in the commercial world because SMEs account for the largest number of market players, some of which may grow into large corporations.
2. ESG Reporting in Hong Kong
Listed companies in Hong Kong have been reporting their ESG performance annually for seven years now. One of the key drivers for ESG to be integrated into business practice and reporting is the trend of major institutional investors incorporating responsible investment strategies and valuations [17,18]. The role of stock exchanges is also important in facilitating ESG reporting. To this end, many stock exchanges worldwide have already implemented relevant requirements for their stock issuers (i.e., listed companies) to disclose ESG performance by reporting. For instance, in Asia, the stock exchanges of Hong Kong, Singapore, Shanghai, Shenzhen, Malaysia and Australia have adopted various approaches to require issuers to report ESG issues, from voluntary disclosure to mandatory disclosure.
As one of the leading financial centers in the world [19], in December 2011, the HKEx conducted a consultation to introduce ESG reporting as a voluntary practice. As stated in the Consultation Paper on ESG Reporting Guide issued in December 2011, the HKEx’s objectives are to raise the ESG disclosure standards and, at the same time, benefit the listed companies in various ways, e.g., enhancing reputation and trust, meeting the growing needs of responsible investment, etc [17,20,21]. In 2013, the Environmental, Social and Governance Reporting Guide in Appendix 27 of the Main Board’s Listing Rules was finally introduced as a voluntary guide. In order to further promote ESG reporting, beginning in 2016, all listed companies in Hong Kong were required by the HKEx to issue their ESG reports annually [22]. The HKEx has been upgrading the reporting requirements from time to time; the most recent and significant upgrade was in 2021 when the climate change issue was introduced. The purpose of this report is to let stakeholders and the general public know listed companies’ performance in ESG aspects.
2.1. ESG Reporting for SMEs in Hong Kong
There is no uniform definition of small and medium-sized listed companies (“SMEs”) and many definitions are adopted to serve different purposes [23,24,25]. One definition by the European Union states that SMEs are enterprises that have at most 250 employees and an annual turnover not exceeding 50 million euros [26]. These criteria are bound to change over time to adapt to changes in current development. Some would incorporate additional dimensions and values for different sectors [27]. For example, an industry firm is small when it has 50 employees, but a trade business is medium-sized with more than 2 employees. Decker, Schiefer and Bulander commented that using quantitative measurements seems at least to be easy to manage, but it is contended whether this accounts for employees of variable productivity or part-time workers [23]. Many research papers in Hong Kong adopted the Hong Kong Trade Development Council’s definition of SMEs as fewer than 100 employees for manufacturers and fewer than 50 employees for non-manufacturers [28]. Other definitions are also based on qualitative aspects such as the legal form, the role of the firm’s owner, their position in the market, the organizational structure or economic and legal autonomy [27]. In this research, for the feasibility of data collection, SMEs refer to listed companies in the HKEx’s Main Board that do not qualify as constituent stocks in the *Hang Seng Composite Large-Cap. Index and **Hang Seng Composite Mid-Cap. Index. Adopting this constituent stock classification in the Indexing Methodology published by Hang Seng Indexes is convenient and common for conducting research related to Hong Kong listed companies [29].
* The constituent stocks ranked within the top 80% of the cumulative market value will be included in the Large-Cap. Index.(from “Index Methodology”, Hang Seng Indexes)
** The constituent stocks ranked within the next 15% of the cumulative market value will be included in the Mid-Cap. Index.(from “Index Methodology”, Hang Seng Indexes)
Most of the large corporations currently seen today grew from SMEs. According to the 2019 statistics of the Hong Kong Government’s Trade and Development Department, the number of SMEs accounted for 98% of the total number of business establishments in Hong Kong, and they were employing 45% of the total working population in the private sector. Their vitality and business performance are of crucial importance to the development of the Hong Kong economy. By the same token, the listed SMEs in Hong Kong, which are not large- and mid-capitalized listed companies as defined by the HKEx, also constitute more than two-thirds of the total issuers. The significance of SMEs’ contribution cannot be denied.
To date, there is no study exclusively on SMEs’ ESG reporting performance. The HKEx conducted two review reports* in 2018 and 2019, respectively, but the sample issuers were randomly selected, and both large-cap and small-cap companies were likely included. Therefore, the results do not specifically represent the true picture of SMEs’ ESG reporting performance. Furthermore, these two review reports provide only quantitative analysis without a precise measurement of the disclosure quality. The HKEx review purpose was to survey the performance of ESG reporting for adjusting ESG reporting requirements.
* Analysis of Environment, Social and Governance Practice Disclosure in 2016/2017 and Analysis of Environmental, Social and Governace Practice Disclosure in 2018.
2.2. Quality of ESG Disclosure
The ESG reporting quality of SMEs is generally viewed as comparatively inferior to large companies’ reports [30]. This is often asserted but is yet to be rigorously tested, and if it is correct, it remains to be seen to what extent its standard deviates from the acceptable level [31].
According to Romero et al., the main aspects of ESG data quality are timeliness, accuracy, relevance and completeness [32]. This research considered only the relevance and completeness of the SMEs’ ESG reports. Timeliness is mostly achieved by the fact that ESG reports are required to be issued within three months after the release of the annual report. Accuracy is difficult to ascertain because there is no audit requirement. The official document issued by the HKEx “Appendix 2: Reporting Guidance on Environmental KPIs” (the “Guide”) serves as a general reference and guideline for listed companies on what and how to report for the environmental KPIs. This research used the Guide as a benchmark for assessing the relevance and completeness of the environmental KPIs reported by the sample companies.
This research aims to assess the reporting performance of SMEs in environmental KPIs and hence to pave the way for further research on the drivers and barriers for better reporting. In view of the immense collective impact of SMEs on the world’s economy and climate change, the objective to help improve SMEs’ ESG reporting quality may in turn raise the overall effectiveness of ESG reporting and ultimately benefit sustainable development as a whole, as a result of which mankind could live in a more sustainable world [33,34,35]. Why investigate the reporting quality of environmental KPIs? The HKEx’s ESG reporting Guide is not a law but a requirement in the Listing Rules. For the social KPIs, they were just a recommended disclosure, with no consequences even if they were not reported without explanation. However, since the environmental KPIs are semi-mandatory (“comply or explain”) for disclosure, if no legitimate reason is given when not reported, it may be detrimental to the issuers’ listing status. The rationale for making the environmental KPI disclosure semi-mandatory is their close linkage to climate change, a very pressing sustainability issue faced by the world. In fact, the HKEx’s two review reports confirmed that the quality of environmental KPIs in different companies varies due to certain flexibilities in the reporting guidelines. In addition, whether the explanations for the unreported items are legitimate and reasonable is also an important concern to the effectiveness of the “comply or explain” approach. Therefore, it is of interest to assess whether the reporting quality of environmental KPIs achieves a standard conducive to combating climate change.
Lastly, in light of the legitimacy theory, size makes a difference because larger corporations are likely to act more socially responsibly and report more ESG information as they are subject to closer scrutiny [36,37]. Although the size of SMEs varies by their definition, in this research, SMEs are defined as non-large-cap and non-mid-cap companies traded on the Hong Kong Stock Exchange. A common perception prevails that these SMEs seem not to report well, but it is still an assumption; evidence is needed to confirm this perception and to understand the real picture in detail.
3. Literature Review
3.1. General Challenges of ESG Reporting
There are many more companies reporting their ESG activities. Data from the Corporate Register demonstrate that the number of companies producing CSR-sustainability (or ESG) reports has grown from less than 2000 in 2002 to nearly 20,000 in 2019, tenfold in seven years [38]. The increasing number of companies reporting ESG issues clearly shows the general awareness of the “Triple Bottom Line” which includes the environmental, social and economic bottom lines as a mainstream practice, despite a few opposing views such as libertarian and nationalist [39,40,41]. For instance, Friedman thought that the social responsibility of a business is to increase its profits [42]. However, Friedman’s idea was later dominated by the more widely accepted concept promoted by Porter and Kramer that business firms have an even more influential role, to create a better society. The concept of the Triple Bottom Line requires that a company’s responsibility should be expanded to other stakeholders rather than just the shareholders. ESG reporting is a form of commitment made by commercial enterprises toward corporate social responsibility, taking care of social and environmental aspects in addition to economic profit [43,44,45,46]. However, many CFOs and other senior executives are lax about reporting ESG issues. In fact, sustainability reporting has not yet penetrated the corporate world widely or deeply [47]. In Hong Kong, the situation was similar. According to the Consultation Paper on ESG Reporting Guide issued by the Hong Kong Exchange, many Hong Kong listed companies were not yet ready to report ESG issues [17]. Among the 106 responses to the Consultation Paper, only 20 respondents (19%) were from issuers. This represented approximately only 1.3% of Hong Kong issuers in the stock exchange.
Some companies may initiate ESG reporting in order to avoid being perceived as laggards in their sector [48,49]. Others may undertake reporting as a public-relations exercise or because their corporate customers have demanded details regarding ESG performance—these all constitute defensive approaches (ibid). The defensive approaches result in the problem of the perceived need to report not linking to core business strategy that may finally lead to “greenwashing” (pretending to be green for other purposes) [50,51,52,53,54,55,56]. Kim and Lyon commented that corporate greenwash has accelerated in recent years [57]; green claims are getting a growing amount of skepticism from stakeholders. The research found that firm growth leads to greenwash in the disclosure of environmental issues due to an anticipation of increased interactions with stakeholders in the regulatory arena [57,58]. The greenwashing problem in SMEs’ ESG reporting is generally thought to be more serious than in larger corporations. The greenwashing problem for SMEs is merely for appearance sake or another form of marketing [51,59,60,61]. Greenwashing is a practice that is deceptively used to promote the perception that a company’s policies or products are environmentally friendly [62]. One reason is that the data set may not be complete with SMEs, leading them to be prone to the manipulation of the disclosure. Moreover, the chance of being discovered is comparatively less consequential for SMEs in terms of media coverage [63].
Though more and more companies report their ESG issues, the impact might be superficial, not enough to create real change in business discourse and paradigm [64,65,66]. Some people recognize the importance of ESG issues but do not feel the urgency to act on them [67]. The reason is related to the mindset that ESG issues are obstacles to business, creating a deep and structural challenge [67]. Amaeshi and Grayson further criticized that such mindsets are heavily framed by the conventional education system that overemphasizes the economic benefit, i.e., shareholder orientation and short-termism [67,68]. ESG reporting is generally viewed as a longer-term issue, and its urgency is perceived as not as immediate as getting a business deal done for yielding profit. This mentality is especially true for SMEs.
3.2. The Impact of Mandatory ESG Reporting
The general perception may be correct that only very large and media-visible companies issue ESG reports voluntarily [69,70,71,72,73]. The introduction of mandatory requirements could be an effective way to mobilize SMEs to issue ESG reports [74,75,76,77,78]. As per the research conducted by Ioannou and Serafeim, they used both country- and firm-level data for 58 countries for analysis [79]. The results showed that after the adoption of mandatory sustainability-reporting laws and regulations, the social responsibility of business leaders increased and both sustainable development and employee training became a higher priority for companies. In addition, corporate governance and ethical practices were enhanced, and bribery and corruption were reduced. Consequently, managerial credibility was increased [79,80,81]. Dawkins and Ngunjiri conducted a descriptive and comparative analysis of corporate social responsibility reporting at the Johannesburg Stock Exchange in South Africa [82]. The results showed that voluntary sustainability initiatives had not succeeded and compliance with Black Economic Empowerment charters and environmental standards had to be legislated and regulated to achieve compliance. In general, the frequency and level of ESG reporting in South African companies were significantly higher than those of the Fortune Global 100, which indicates a greater willingness to convey social responsibility in their disclosure practices [83,84,85]. The success can be largely attributed to legal and regulatory measures that compose legitimate business practice [82]. This is further echoed by Doane, who believed that reporting should be regulated by the state in order to protect the citizens and to ensure that appropriate information is provided [86]. Finally, the Johannesburg Stock Exchange implemented mandatory ESG reporting in 2010.
Despite the successful implementation of mandatory ESG reporting in South Africa, businesses in South Africa felt that the reporting requirements were too onerous and costly [87,88,89,90]. In addition, some companies were disingenuous about sustainability reporting and provided superficial and/or misleading information, as demonstrated by high-profile scandals; for instance, the Parmalat and Enron cases [82,91,92]. The situation was similar in Hong Kong. Even with the requirement for all listed companies to issue ESG reports in place since 2016, the HKEx’s most recent review report “Analysis of Environmental, Social and Governance Practice Disclosure 2018” found that quite a few issuers were adopting a “box-ticking” approach to reporting. This problem may be more serious for SMEs.
3.3. Specific Challenges for SMEs
ESG reporting became more mainstream in the last two decades, but it has not trickled down to many smaller companies [47,93,94,95]. ESG activities in SMEs have still received relatively little attention, and there is a lack of know-how and experience to support the systematic integration of ESG practices in the management process [96,97,98,99,100]. ESG issues are complex and uncertain in terms of their boundary, i.e., what is in and what is out, which makes them very difficult to articulate [63,67,101]. In addition, as per the Consultation Conclusions on ESG Guide issued by the Hong Kong Exchange, some SMEs did not think ESG issues relate to their core business and may be reluctant to report due to the added costs and administrative burden [102,103,104]. To conclude, SMEs are facing the similar problems of their larger counterparts [105,106,107], but problems such as a lack of expertise, cost concern and confidentiality, etc., may be more serious [108,109,110,111].
Gillan, Hartzell, Koch and Starks found that there was a high correlation between ESG performance and a company’s operating performance and efficiency [112]. Interestingly and contradictorily, through their empirical study, it was found that a company’s valuation (i.e., stock price) will not be enhanced by good ESG performance because institutional investors tend to buy less and sell more of companies with higher scores in ESG (ibid). Gillan, Hartzell, Koch and Starks further claimed that there is evidence showing that institutional investors may avoid firms with more governance concerns [112]. This is controversial and might be outdated. Today institutional investors increasingly prioritize ESG in their screening criteria and seek investment opportunities in top ESG performers. Fidelity International proprietary research published in April 2020 found that, during the COVID-19 pandemic, companies focusing on ESG were rewarded by their stock prices which even outperformed the S&P 500. As such, ESG investment is gaining momentum and attracting both institutional and retail investors.
3.4. Disclosure Quality of ESG Reports
The quality of disclosure is critical to the effectiveness of communication. Poor disclosure quality making communication with stakeholders ineffective is confirmed by analysis [113]. Especially for SMEs, there is a need for more comparable empirical studies for the reality they are facing [114,115]. As this research investigates the reporting quality of environmental KPIs for SMEs in Hong Kong, it is imperative to review the existing literature regarding the disclosure quality of ESG reporting to understand the knowledge gap.
Firstly, the measurement of quality in financial and non-financial reporting is a complex issue as there are many angles to judge the quality according to different dimensions adopted [116]. At a more abstract level, disclosure quality can be defined as the degree of self-interested bias in the disclosure [117]. Based on analytical studies, disclosure quality can be defined in terms of the precision of a Bayesian investor’s beliefs about security value after receiving the disclosure [118]. On a more general level, disclosure quality can be judged by the ease with which investors can read and interpret the information [119]. McInnes and Fearnley commented that a consensus is achieved for a business reporting model that needs to expand to serve the changing information needs of the market and provide the information required for enhanced corporate transparency and accountability [120]. More and more regulators view narrative disclosures as the key to enhancing the quality of corporate reporting [120]. Hence, narrative disclosures are commonly applied in ESG reporting.
The quality of ESG reporting affects the credibility of accountability and building stakeholders’ trust in companies [121,122]. To be more specific to the disclosure quality of ESG, a number of previous studies (e.g., [123,124,125]) were primarily based on a checklist of items that capture the amount and variety of disclosure. However, it was argued that it does not sufficiently capture the complexity of the information that management could communicate on the ESG impact of their corporate activities [126]. In addition, GRI commented that the checklist of items does not fully address the important criteria for determining the quality of ESG information [127].
To overcome this problem, most of the recent studies of ESG reporting quality focused on the amount of space allocated to disclosure and on the type of information provided [128]. Other relevant dimensions were added by researchers to capture the multidimensionality of the informational items [128]. Beretta and Bozzolan articulated a framework for risk disclosure for ESG [129]. It allows the capture of the quantity and the richness of ESG information, which helps users appreciate the impact of corporate activities and infer the management’s approach to ESG. In order to align the reporting quality standard of the non-financial information (ESG information) and the financial information, Chauvery et al. focused on disclosure-quality measures using the accounting principles of relevance, comparability, verifiability, clarity and neutrality [130]. According to Baalouch, Ayadi and Hussainey, there is no universally accepted definition of ESG disclosure quality; it is dependent upon the purpose of the research [131,132,133].
4. Research Methodology
This research assessed the disclosure quality of environmental KPIs in ESG reports using a quantitative measurement methodology, scoring the environmental KPIs to reduce potential subjective judgment [134,135,136,137,138,139,140,141,142]. By using descriptive statistical analysis, the results rigorously and objectively show the environmental KPI disclosure quality of the SMEs in Hong Kong. The research time horizon is cross-sectional to focus on the current reporting quality of ESG reports in Hong Kong. The investigation is concerned with the study of a particular phenomenon at a specific time for the financial year 2017, which was the second year of implementing the semi-mandatory reporting requirement for environmental KPIs.
4.1. Quantitative Method—Scoring Exercise and Descriptive Statistical Analysis
The scoring exercise is used to quantify the disclosure quality of the environmental KPI reporting. As ESG reports must be posted on listed companies’ websites, the actual reported data of environmental KPIs can readily be extracted for analysis. A stratified sampling method is used to represent the sample SMEs.
4.2. Stratified Sampling Methodology
Stratified sampling offers several advantages as a stratified sample can provide greater precision than a simple random sample of the same size [143,144]. Because of its greater precision, it requires a smaller sample and hence saves cost. In addition, a stratified sample can guard against an unrepresentative sample. In this research, proportionate stratification is adopted so the sample size of each stratum is proportionate to the population size of the stratum. This means that each stratum has the same sampling fraction [143].
The HKEx operates two completely segmented markets, namely the Main Board and the Growth Enterprise Market (GEM). Companies can choose either market for listing. The Main Board is a market for well-established companies, while the GEM is mainly for start-up companies with less stringent eligibility criteria but similar continuing obligations. This research only selected smaller companies from the Main Board because their ESG data are relatively more accessible for collection. In addition, it is unambiguous that the Main Board is more regulated than GEM [145]. As of 29 November 2018, the total number of listed securities in HKEx was 2328, from which the target population for the research was derived. In the Main Board, large-cap companies, mid-cap companies and small-cap companies accounted for 96% of the Hong Kong total stock market value. Only small-cap listed companies on the Main Board were selected for study.
4.3. Sampling Procedure
(a) Selecting the small-cap companies (i.e., SMEs) from the listed securities in HKEx to form the target population
- -
- A full list of 2328 listed company stock codes in Hong Kong Stock Exchange was collected from AAStock (a renowned stock information provider in Hong Kong).
- -
- A total of 405 stock codes from Table 1 below were filtered out because they were not company stocks or they were stocks traded on Growth Enterprise Market (GEM).
- -
- The 111 large-cap and 193 mid-cap companies were then removed.
- -
- In the end, 1619 small-cap companies traded on the Main Board remained as the target population.

Table 1.
Stock codes of the securities traded on GEM and non-company stocks.
Table 1.
Stock codes of the securities traded on GEM and non-company stocks.
| Nature | Stock Codes |
|---|---|
| Exchange Traded Funds | 02800–02849 03000–03199 |
| Hong Kong Monetary Authority Exchange Fund Notes | 04000–04199 |
| HKSAR Government Bonds | 04200–04299 |
| Debt Securities to professional investor only | 04300–04329 04400–04599 05000–06029 |
| Professional Preference Share | 04600–04699 |
| Hong Kong Depositary Receipts (HDRs) | 06200–06499 |
| HDRs which are restricted securities under US federal securities laws | 06300–06399 |
| Bonds of Ministry of the Finance of the People’s Republic of China | 06750–06799 |
| Leveraged and Inverse Products | 07200–07399 |
| GEM Securities | 08000–08999 |
| Exchange Trade Funds (Traded in USD) | 09000–09199 09800–09849 |
| Leveraged and Inverse Products | 09200–09399 |
| Total number of stock codes: | 405 |
4.4. Summary of Calculating the Target Population
- -
- A list of a total of 2328 stock codes (i.e., all securities listed on the Main Board and the GEM) in HKEx was retrieved from AAStock as of 29 November 2018.
- -
- All 405 stock codes in the above table were removed.
- -
- All of the 111 large-cap companies were removed.
- -
- All of the 193 mid-cap companies were removed.
- -
- That is, 2328 − 405 − 111 − 193 = 1619 (i.e., the target population for this research is 1619; they are small-cap companies traded on the Main Board of HKEx).
(b) Stratified random sampling and sample size
As the target population size of the qualified listed companies is 1619, due to the limited resource, it is difficult to measure every individual data point in a population, and sampling is needed. Sampling is the selection of a subset of individuals from within a statistical population to estimate characteristics of the whole population [143]. The samples represent the population in question. Data collection conducted through sampling lowers the cost and is faster than measuring the entire population.
HKEx categorized the listed companies into 11 industries based on the Hang Seng Industry Classification System (“HSICS”). In order to maintain the industry proportions of the target population, stratified random sampling (a probability or random sampling method) was adopted. Stratified random sampling allows obtaining a sample population that best represents the entire population being studied, making sure that each subgroup (i.e., industry) of interest is represented [146]. The sample size of 138 was calculated based on 95% confidence level and 8% margin of error (8% falls into an acceptable range for survey, according to DataTips from DataStar Inc. (Waltham, MA, USA). These 138 sample companies were randomly drawn from the target population, i.e., 1619 companies, by using a random table *. A proportional allocation method ** was applied to draw the same proportion of samples from each industry (stratum). As the population size of each industry group varies, a larger number of samples was drawn from the larger industry groups. Table 2 shows the results of the stratified sampling.
Notes:
- -
- Each sample size is rounded up to the integer.
- -
- The original sample size was 137. The sample size of the “Information Technology” industry was 9.4, which was rounded up to 10 for prudence. This resulted in a total of 138 samples.
* Random number table reference: The Rand Corporation, A Million Random Digits with 100,000 Normal Deviates(New York, NY, USA: The Free Press, 1955)
** Proportional allocation formula:
N = total population
n = total sample size
Ni = population of each stratum
ni = sample size in each stratum
For example: in the Services industry, there were 221 small-cap listed companies:
n = 138 (calculated in the earlier section)
N = 1619
Ni = 221
ni = 138 × (221/1619) = 18.83 = ~19
Therefore, 19 samples in the Services industry stratum were selected.
Table 2.
Stratified sampling for small-cap companies.
Table 2.
Stratified sampling for small-cap companies.
| Industry Category | Number of Small-Cap Companies | Sample Size |
|---|---|---|
| Conglomerates | 13 | 1 |
| Consumer Goods | 412 | 35 |
| Energy | 66 | 6 |
| Financials | 146 | 12 |
| Industrial Goods | 140 | 12 |
| Information Technology | 110 | 10 |
| Materials | 121 | 10 |
| Properties and Constructions | 315 | 27 |
| Services | 221 | 19 |
| Telecommunication | 27 | 2 |
| Utilities | 48 | 4 |
| Total | 1619 | 138 |
(c) Measurement of the Quality of ESG reporting
Many different criteria contribute to the quality of reporting. In order to be in line with the quality requirements for financial information, according to Romero et al., the main aspects of ESG data quality are timeliness, accuracy, relevance and completeness [32]. Firstly, to ensure the disclosures are relevant to stakeholders, HKEx’s “Environmental, Social and Governance Reporting Guide” in Appendix 27 of Main Board Listing Rules was issued to specify a set of disclosure requirements. This guide serves as the benchmark because SMEs generally follow it to prepare their ESG reports, and their legal counsels also use it to check whether the reports comply with HKEx’s requirements. Secondly, the guide facilitates an objective assessment of ESG reporting quality in terms of completeness by comparing the actual contents of the report and the required contents in the guide. The guide details the required disclosures on Environmental and Social KPIs. This research focuses on the Environmental KPIs because they are semi-mandatory and expected to be reported by all listed companies, whereas Social KPIs are only listed as recommended disclosure. Lastly, timeliness and accuracy are generally observed. ESG reports are required to be issued within three months after issuing annual reports. The accuracy solely depends on the integrity of listed companies’ board of directors because there is no audit requirement for ESG reports. In order to save costs, most SMEs do not retain external ESG auditors for assurance [147,148]. Because the board is the ultimately responsible party for the accuracy, it could be reasonably assumed that the ESG data are generally genuine unless the board is willing to run the risk of violating the Listing Rules. To conclude, relevance and completeness are the two main issues of ESG disclosure quality for deeper investigation in this research.
From another perspective, Cuesta and Valor defined the quality of information as either the width or depth of disclosure [149]. The width aspect is based on content analysis or counting the number of disclosures against a predetermined set of indicators or content categories, i.e., to examine what dimensions or issues a company should report compared to what they actually present [149,150]. On the other hand, the depth aspect examines the extent to which companies give a comprehensive account of each dimension of content. Ordinal scales are commonly used to measure comprehensiveness in terms of both width and depth [151]. After several revisions, SustainAbility and United Nations Environmental Program (UNEP) proposed a scale based on depth of the information disclosure [152]. It is a 5-point scale scoring system, from 0 to 4, where “0” means that the issue is not discussed at all while “4” means that the issue is fully disclosed in a comprehensive, integrated and particularly innovative manner. A similar scale was adopted in various ESG-related research papers, e.g., [153,154,155].
4.5. Quantifying the Quality Issue
As discussed above, the focus of the ESG reporting quality in this research is mainly on the width and the depth of the ESG information, which can be collectively termed “comprehensiveness”. The width of the disclosure of ESG information, i.e., materiality, is measured against the Guide, and the depth is measured by adopting the scoring framework developed by SustainAbility and UNEP [152]. The level of depth is divided as per the 5-point scale (0 to 4) scoring. The general definitions of each scoring point are as follows:
- 0—No disclosure;
- 1—Only provide anecdotal information (i.e., only provide general description, not specific to the disclosure requirement of the Guide);
- 2—Limited information (i.e., fail to meet all the disclosure requirement of the Guide);
- 3—Complete information (i.e., meet the disclosure requirement of the Guide);
- 4—Beyond disclosure requirement of the Guide.
These general definitions serve as a foundation and a broad principle for further modification to make the scoring of each KPI operational. After careful assessment and reviewed by the thesis supervisors, the definition of each scoring point for each KPI was precisely ascertained to match the general definitions of the scoring system. Table 3 below shows the details of the guide for each scoring point for each KPI.
Table 3.
Scoring guide of KPIs.
4.6. Collection of Data
ESG reporting is mandatory for listed companies in Hong Kong and must be publicly accessible through their websites. A total of 138 sample companies’ ESG reports were downloaded for analysis. To ensure the scoring is as accurate and consistent as possible, there were two rounds of scoring after the training and pilot scoring exercises with feedback sessions. A part-time research assistant (a university final-year student) was recruited and trained to understand the scoring definitions and the methodology of evaluation thoroughly. One randomly selected sample company from each of the 11 industry categories (1 sample company from each category, for a total of 11 sample companies) was used for the pilot scoring exercise to ensure the research assistant’s competence in proper scoring. Each scoring was supported by the evidence found in the contents of ESG reports. The research assistant performed the first round of scoring by assigning a score from 0 to 4 (as in the above Table 3: Scoring guide of KPIs) to each of the 12 environmental KPIs. Then, the authors performed the second round of scoring for checking the alignment of the first round’s scoring results. Regular weekly meetings were held between the research assistant and the authors to discuss the scoring process and reach a mutual consensus if there is any discrepancy in the two rounds of scoring. Through this process, the scoring was improved and homogenized. The following Figure 1 summarizes the process of scoring for data collection.
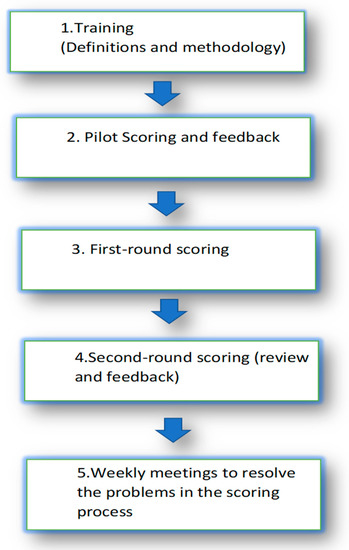
Figure 1.
The process of scoring for data collection.
4.7. Inter-Rater and Intra-Rater Reliability
Two types of rater reliability are intra-rater reliability and inter-rater reliability. Inter-rater reliability refers to the consistency of data recorded by two or more raters, measuring the same subjects over a single trial. In contrast, intra-rater reliability refers to the consistency of the data recorded by one rater over several trials [156]. Actually, each sample ESG report’s inter-rater reliability was ensured by using only one rater (i.e., the research assistant). Then, each sample ESG report was subsequently reviewed by the authors. The inter-rater reliability was further safeguarded through weekly meetings between the rater and the reviewer to discuss and resolve the discrepancies found by the reviewer. As for the intra-rater reliability, a set and clear scoring definitions were adopted to guide both the rater and the reviewer effectively. The definitions of scoring were primarily based on the scoring framework developed by SustainAbility and UNEP on a 5-point scale (0 to 4) scoring [152]; the modifications of the detailed components of the scores applied to this research were mutually discussed and finally agreed upon by the rater and the reviewer. By the same token, the review process and the weekly meeting could further enhance the intra-rater reliability.
5. Data Analysis and Discussion
In Table 4, the ESG disclosure scoring results of all 11 industries show that the overall average for all the 12 KPIs was only 1.98, meaning that SMEs’ overall disclosure performance was below the simple average of 2 (full complete disclosure score is 3). In general, SMEs failed to fulfill the full reporting requirements and only partially reported the required information. The inter-rater and intra-rater reliability is satisfactory, and alignment was reached by two rounds of scoring and regular communication between the raters for the reconciliation of any discrepancies found.
Table 4.
Overall average score and the average score for each KPI.
The scoring results of each KPI are different, and below are the highlights.
- Best reported KPI:
A2.3 Description of energy use efficiency initiatives and results achieved.
Table 4 shows that SMEs performed well in the Aspect “A2 Use of Resources” with a score of 2.35 among all three aspects. Table 5 shows that A2.3 Energy efficiency was the best reported KPI. SMEs obtained scores of 2.49 for both A2.1 Energy consumption and A2.2 Water consumption; while most industries scored above 2.5, the average score was dragged down a little by Telecommunication and Material industries that failed to score above 2.0 in A2.1 Energy efficiency and A2.2 Water consumption.
Table 5.
Average scores for A2 KPIs.
As for A2.3 Energy use efficiency, SMEs recorded a close to full complete disclosure score at 2.85. Since the HKEx’s reporting requirement for A2.3 Energy efficiency is somewhat at a high level, it was easy for SMEs to fulfill this requirement as long as they mentioned their energy-saving practice, and this KPI was already considered to be a complete disclosure.
- 2.
- Worst reported KPI:
A3.1 Description of the significant impacts of activities on the environment and natural resources and the actions taken to manage them.
The average score of A3.1 was only 1.44, reflecting that several SMEs failed to fulfill the HKEx’s requirement. Quite a few companies’ scores on this KPI were either “No disclosure (0)” or “General Mention (1)”. The underlying reason may be that the SMEs were incapable of comprehending the guideline given by the HKEx and they did not assess the impacts of activities. Under “What to report” of A3.1 Environment and natural resources, companies need to report: 1. “Significant impacts of activities on the environment and natural resources” and 2. “Policies and/or measures adopted specific to the environment and natural resources”; therefore, the content should be directly related to assessing the impacts of companies’ activities on the environment and natural resources. The overall disclosure was disappointing as most statements were either over-generalized, irrelevant, incomplete or even missing. In some cases, only the solutions were provided, without assessing the impacts of their proposed solutions. Some of the impact assessments were only based on customer perceptions, not taking the companies’ operations into account.
Most of the report contents were off-topic and only touched on other irrelevant issues, such as the general practices to save energy and water, without specific reference to the assessment of their main operating activities. These results suggest that companies may be confusing guideline A3 with other KPIs, such as A1.5 Emission mitigants, A1.6 Wastes mitigants, A2.3 Energy efficiency and A2.4 Water efficiency (Table 6), which instead relate to general measures to protect the environment.
Table 6.
Overall average score of each industry.
- 3.
- Best performer: Industrial Goods
According to Table 6, companies in the Industrial Goods category performed the best and scored the highest with an overall average of 2.17. The main reason may be that the relevant data such as electricity and water, etc., have been well collected for calculating standard costing and variance analysis for production. In addition, they are used to report production-related environmental data to relevant regulatory bodies.
The Utilities category scored the second best, with an overall average of 2.1. The reasons are similar to the Industrial Goods, as the relevant environmental data are relatively handy for their regular reporting to relevant regulatory bodies and production cost control. Furthermore, utility companies face increasing social pressure on the environmental issues where they operate. Ultimately, a risk of revocation of the operating license may result if they are not transparent enough in their civil monitoring.
The two industries were generally found to report particularly well in the KPIs: A1.1 Air emission, A1.2 Greenhouse gases, A1.3 Hazardous waste, A2.1 Energy consumption and A2.2 Water consumption; all of these were quantitative KPIs. This confirmed that their operational data were well-kept.
- 4.
- Worst performer: Telecommunication
Among the 11 industries, the Telecommunication category was the underperformer, with the lowest overall average score of 1.33. The Telecommunication industry was found to score one standard deviation below the average scores in the KPIs A2.4 Water efficiency and A3.1 Environment and natural resources, confirming that it performed lower than other industries. The companies only reported general information in A2.4 Water efficiency and did not reveal any information in A3.1 Environment and natural resources. One reason for the low score may be the lax attitude caused by the preoccupation of their mindset that Telecommunication was perceived as “cleaner” than other industries, such as manufacturing and construction. However, the result may be biased due to the stratified random sampling, where only two sample companies were selected from the Telecommunication category.
- 5.
- Comparison between Aspect A1 (Emissions) KPIs and Aspect A2 (Use of Resources) KPIs (Figure 2)
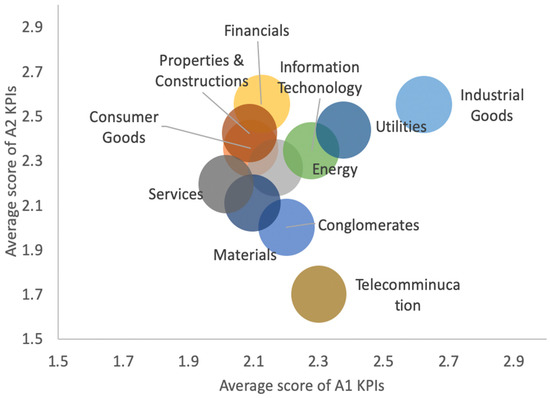 Figure 2. Relationship of average score of A2 KPIs and average score of A1 KPIs.
General interpretation of A1 KPIs and A2 KPIs:
In Figure 2, the average scores for both A1 KPIs and A2 KPIs were close. The variation between A1 KPIs (average score: 2.16) and A2 KPIs (average score: 2.35) was relatively small at 0.19; it means that there is no significant difference in reporting performance among the emissions and the use of resources. The capability of SMEs to report A1 KPIs and A2 KPIs is similar, except for the industry categories Telecommunication and Industrial Goods.
The Telecommunication industry scored particularly low (score: 1) in A2.4 Description of whether there is any issue in sourcing water that is fit for purpose, water efficiency initiatives and results achieved, resulting in a relatively low average score in A2 KPIs. The IT industry usually ignored or did not know how to report A2.4 Water efficiency as they think their business does not need water as a resource. This reflects that the reporting requirement set by the HKEx does not suit individual industries’ characteristics: one size does not fit all. On the other hand, companies in the Industrial Goods industry are comparatively better at emissions, electricity and water-related reporting, scoring comparatively high averages in both A1 KPIs and A2 KPIs than other industries.
Specific interpretation of comparing A1 KPIs and A2 KPIs:
The scores in A1 KPIs were mostly balanced in that different industries received similar scores, except Industrial Goods, which did exceptionally well in A1 KPIs. Most of the Services industry and non-industrial industries did not do well in A1.1 and A1.4 because of not stating any figures. As for A1.1 Air emission, they mostly overlooked and omitted the vehicle fuel consumption part. As for A1.4 Non-hazardous waste, they ignored and did not report the domestic wastes.
Many companies were found with no disclosure in A2.5 Total packaging material used for finished products. Many sample companies did not report water consumption figures as their water consumption was managed by property management companies. Consequently, these companies omitted the disclosure of information related to water saving. In fact, even if the property management company manages water consumption, the companies still bear the ultimate responsibility of reporting their water consumption and conservation. Therefore, most of these industries scored no disclosure/incomplete disclosure in A2.4 Water efficiency.
- 6.
- Quantitative KPIs vs. qualitative KPIs
Referring to Figure 3 and Table 7, the results show that the qualitative KPIs were generally better reported than those of quantitative KPIs. This may not reflect the true picture as the reporting guidelines for qualitative KPIs were usually interpreted as a high-level disclosure. A lighter and vaguer touch on the high-level qualitative KPIs could be deemed as fulfilling the disclosure requirements, but without the details and concrete information provided, stakeholders may find the disclosures counterproductive in understanding the true picture [157]. However, A3.1 Environment and natural resources (qualitative KPI; average score is 1.58) is an exception because its reporting guideline was too vague and hard for SMEs to correctly interpret and fulfill the requirement. The results also imply that quantitative KPIs are more rigorous and objective to reflect the disclosure quality as they provided clear required reporting content.
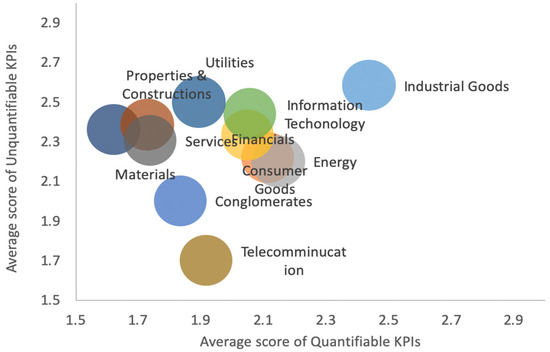
Figure 3.
Relationship of average score of unquantifiable (qualitative) KPIs and average score of quantifiable (quantitative) KPIs.
Table 7.
Scoring details for quantitative and qualitative KPIs.
5.1. Common Problems for Reporting Environmental KPIs
5.1.1. Limited Reporting Scope
Some SMEs selected their reporting scopes that could not cover their core business. Limited reporting scopes may distort the true picture of the disclosure quality if the selected scope was not representative enough. Some SMEs stated the rationales for selecting certain parts of the business to report, which are not convincing. For instance, according to the highest contribution revenue, some SMEs did not provide any rationale. Reasons for not reporting the whole entity’s environmental KPIs are manifold; for example, data were not available for complete disclosure, deliberate reporting of only the better part of the environmental performance, etc. [158].
5.1.2. Insufficient Evidence
Some SMEs only used the wording “insignificant amount” for the reason of not having information to disclose. While they did not reveal the actual figures in their reports, it is hard to judge whether it is “insignificant” [159,160]. Therefore, it is suggested they should at least elaborate on how and why it is too insignificant to report.
5.1.3. Potential Manipulation of the Intensity Calculation
The guideline of the HKEx aimed to provide flexibility to suit the specific needs of the industries; therefore, no rigid calculation on intensity was provided. However, this resulted in using various intensity calculations amongst different industries. The organization-specific metrics used for calculating intensity include per units of product, per production volume (e.g., metric tons, liters or MWh), per size (e.g., square meter of floor space), per employment (e.g., headcount or FTE), per monetary units (e.g., revenue or sales) and per facilities, etc. While this aimed to give more flexibility for choosing the most appropriate intensity base, some SMEs used different organization-specific metrics solely to their benefit for calculating “good-looking” intensity figures [161,162,163,164].
5.1.4. Over-Generalized Presentation
This phenomenon is widespread due to misunderstanding the guidelines, not knowing what to report, missing data, etc. It lowers the overall quality of the report due to vagueness.
5.1.5. Incomplete Disclosure
This is another common phenomenon. Fragmented information distorts the readers’ understanding of ESG performance. SMEs can easily fulfill the requirement with a concise description highlighting “energy saving” as a key word. The words “Insignificant”, “Minimum” and “Immaterial” are used without giving concrete and complete details. They did not elaborate on how insignificant, how minimum and how immaterial.
5.1.6. Irrelevant Information in the Report
Some companies just gave irrelevant information for those KPIs specifically requiring quantitative data [165]. For example, KPI A1.1 Air Emissions requires the disclosure of the types of emissions and respective emissions data. Still, some companies only reported their practices in controlling air emissions for protecting employees’ health [166].
5.2. The Contributions and Implications of the Research
The overall results of this research give strong evidence that SMEs’ disclosure quality is generally inferior and well below the threshold of a complete disclosure. In addition, each environmental KPI of each industry was assessed and analyzed in detail, which casts some insights into the attributes of different industries on different environmental KPIs. These findings have not been studied before, not even in the two authoritative Reviews conducted by the HKEx (Analysis of Environment, Social and Governance Practice Disclosure in 2016/2017 and Analysis of Environmental, Social and Governance Practice Disclosure in 2018).
In Hong Kong, an advanced international financial center, the practice of ESG reporting foreruns many countries in the world. The research findings could alert other lagger regulators to design well a more appropriate ESG reporting framework and guidelines for SMEs. Furthermore, academia may investigate the unexplored areas in this research with a view of understanding more the nature of the deficiencies in SMEs’ ESG reporting to find ways to improve it.
6. Conclusions
Since 2016, the HKEx has required all listed companies to issue annual ESG reports. Although SMEs are large in number and make significant contributions to the economy, there has been little research on the quality of SMEs’ ESG disclosures to date. This research sought to test the general perception that SMEs’ ESG disclosures are inferior to those of larger corporations by utilizing a quantitative methodology. The analysis can provide a direction for further investigation.
A scoring exercise with a five-point scale (0–4) was adopted to assess the relevance and completeness of the environmental KPIs in ESG reports. A total of 138 SMEs were proportionately selected by a stratified sampling method based on the HKEx’s 11 categories of industries. It was found that the general disclosure quality was low at a score of 1.98, while the complete disclosure score was 3. KPI 2.3 “Energy Use Efficiency” was the best reported KPI while KPI 3.1 “The Environment and Natural Resources” was the worst reported KPI. The main reason is the ease of providing a high-level descriptive answer for reporting KPI 2.3. The vagueness of KPI 3 made the reporting difficult. Across the different industries, the Industrial Goods sector was the best reporter, while the Telecommunication industry performed the worst. The nature of the businesses is the probable reason for the variations. The Industrial Goods sector generally has a larger environmental impact; hence, they are used to complying with rigorous reporting requirements for their daily operations. Conversely, due to their smaller carbon footprint, the Telecommunication sector may be paying less attention to environmental disclosure.
This research confirms that SMEs generally did not pass the score of complete disclosure. More importantly, the quantitative scoring results of this research provide a clearer picture of the quality of SMEs’ ESG reporting in detail.
6.1. Limitations of the Study
To mitigate judgment errors, this research used pre-defined standards for each score, reviewed each scoring result and held weekly discussions on specific issues that arose. A minor statistical issue exists because of the small sample sizes of the two industries “Conglomerates” * (one sample) and “Telecommunication” (two samples).
* According to the Hang Seng Industry Classification System, conglomerates are diversified companies engaged in three or more businesses classified into different sectors with each business contributing more than 10% but not substantially to turnover.
6.2. Suggestions for Future Research
The value of this exploratory research project, based on the latest ESG reporting in Hong Kong, is two-fold. First, it provides direction for future research. Second, it indicates how SMEs can improve the quality of ESG reporting, which is inseparable from sustainable development [167,168,169]. The authors recommend that larger-scale quantitative research be conducted to address the previously discussed limitations and provide more accurate and statistically significant results. This is especially important due to the small sample sizes of this research in the two industries “Conglomerates” and “Telecommunication”.
Author Contributions
Conceptualization, A.W.H.Y.; methodology, A.W.H.Y.; software, A.W.H.Y.; validation, W.Y.P.Y.; formal analysis, A.W.H.Y.; investigation, A.W.H.Y.; resources, A.W.H.Y., W.Y.P.Y.; data curation, A.W.H.Y.; writing—original draft preparation, A.W.H.Y.; writing—review and editing, A.W.H.Y., W.Y.P.Y.; visualization, A.W.H.Y., W.Y.P.Y.; supervision, W.Y.P.Y.; project administration, A.W.H.Y.; funding acquisition, A.W.H.Y., W.Y.P.Y. All authors have read and agreed to the published version of the manuscript.
Funding
This research received no external funding.
Data Availability Statement
Upon request, authors will provide data.
Conflicts of Interest
The authors declare no conflict of interest.
References
- Burritt, R.L.; Schaltegger, S. Sustainability accounting and reporting: Fad or trend? Account. Audit. Account. J. 2010, 23, 829–846. [Google Scholar] [CrossRef]
- Cho, C.H.; Laine, M.; Roberts, R.W.; Rodrigue, M. Organized hypocrisy, organizational façades, and sustainability reporting. Account. Organ. Soc. 2015, 40, 78–94. [Google Scholar] [CrossRef]
- Bansal, P.; DesJardine, M.R. Business sustainability: It is about time. Strateg. Organ. 2014, 12, 70–78. [Google Scholar] [CrossRef]
- Ferrell, A.; Liang, H.; Renneboog, L. Socially responsible firms. J. Financ. Econ. 2016, 122, 585–606. [Google Scholar] [CrossRef]
- CSR Asia Advisory. Hong Kong Exchange, Environmental. Social and Governance Reporting Guide; CSR Asia Advisory: Hong Kong, China, 2013. [Google Scholar]
- Badia, F.; Bracci, E.; Tallaki, M. Quality and diffusion of social and sustainability reporting in Italian public utility companies. Sustainability 2020, 12, 4525. [Google Scholar] [CrossRef]
- Buhr, N. Histories of and rationales for sustainability reporting. In Sustainability Accounting and Accountability; Routledge: Oxfordshire, UK, 2007; pp. 57–69. [Google Scholar]
- Barnea, A.; Rubin, A. Corporate social responsibility as a conflict between shareholders. J. Bus. Ethics 2010, 97, 71–86. [Google Scholar] [CrossRef]
- Elkington, J. Enter the triple bottom line. In The Triple Bottom Line: Does It All Add Up; Routledge: Oxfordshire, UK, 2004; Volume 11, pp. 1–16. [Google Scholar]
- Nesbit, J.C.; Adesope, O.O. Learning with concept and knowledge maps: A meta-analysis. Rev. Educ. Res. 2006, 76, 413–448. [Google Scholar] [CrossRef]
- Neu, D.; Warsame, H.; Pedwell, K. Managing public impressions: Environmental disclosures in annual reports. Account. Organ. Soc. 1998, 23, 265–282. [Google Scholar] [CrossRef]
- De Klerk, M.; De Villiers, C.; Van Staden, C. The influence of corporate social responsibility disclosure on share prices. Pac. Account. Rev. 2015, 27. [Google Scholar] [CrossRef]
- Barometer, E.T. The Edelman Trust Barometer. 2009. Available online: http://www.edelman.com/assets/uploads/2014/01/2009-Trust-Barometer-Global-Deck.pdf (accessed on 15 September 2018).
- Boffo, R.; Patalano, R. Esg Investing: Practices, Progress and Challenges. OECD. Available online: https://www.oecd.org/finance/ESG-Investing-Practices-Progress-Challenges.Pdf (accessed on 25 May 2021).
- Ferns, B.; Emelianova, O.; Sethi, S.P. In his own words: The effectiveness of CEO as spokesperson on CSR-Sustainability issues—Analysis of Data from the Sethi CSR monitor. Corp. Reput. Rev. 2008, 11, 116–129. [Google Scholar] [CrossRef]
- Burlea, A.S.; Popa, I. Legitimacy theory. In Encyclopedia of Corporate Social Responsibility; Springer: Berlin/Heidelberg, Germany, 2013; pp. 1579–1584. [Google Scholar]
- Consultation Paper on ESG Reporting Guide (December 2011), Hong Kong Exchange. Available online: https://www.hkex.com.hk/-/media/HKEX-Market/Listing/Rules-and-Guidance/Other-Resources/Environmental-Social-and-Governance/Exchange-Publications-on-ESG/cp201112.pdf?la=en (accessed on 15 September 2018).
- Freedman, M.; Stagliano, M.J. European unification, accounting harmonisation, and social disclosure. Int. J. Account. 1992, 27, 112–122. [Google Scholar]
- The Wall Street Journal (1 December 2015). Hong Kong Is No. 1 again for IPOs Globally. Available online: http://www.wsj.com/articles/hong-kong-is-no-1-again-for-ipos-globally-1449120929 (accessed on 15 September 2018).
- Novak, J.D. Concept mapping to facilitate teaching and learning. Prospects 1995, 25, 79–86. [Google Scholar] [CrossRef]
- Thompson, L., Jr. Toward Better Sustainability Reporting. 2012. Available online: www.complianceweek.com (accessed on 20 December 2022).
- Consultation Paper on Review of ESG Reporting Guide (July 2015), Hong Kong Exchange. Available online: https://www.hkex.com.hk/-/media/HKEX-Market/Listing/Rules-and-Guidance/Other-Resources/Environmental-Social-and-Governance/Exchange-Publications-on-ESG/cp201507.pdf?la=en (accessed on 15 September 2018).
- Decker, M.; Schiefer, G.; Bulander, R. Specific challenges for small and medium-sized enterprises (SME) in M-business. In Proceedings of the International Conference on E-Business (ICE-B 2006), Setúbal, Portugal, 7–10 August 2006; INSTICC Press: Setúbal, Portugal, 2006; pp. 169–174. [Google Scholar]
- El Madani, A. SME policy: Comparative analysis of SME definitions. Int. J. Acad. Res. Bus. Soc. Sci. 2018, 8, 103–114. [Google Scholar] [CrossRef] [PubMed]
- Freeman, R.E. The politics of stakeholder theory: Some future directions. Bus. Ethics Q. 1994, 4, 409–421. [Google Scholar] [CrossRef]
- European Union. Commission Recommendation of 6 May 2003 Concerning the Definition of Micro, Small and Medium-Sized Enterprises, 2003. Available online: https://op.europa.eu/en/publication-detail/-/publication/6ca8d655-126b-4a42-ada4-e9058fa45155 (accessed on 28 September 2020).
- Marwede, E. Die Abgrenzungsproblematik Mittelständischer Unternehmen: Eine Literaturanalyse; Volkswirtschaftliches Institut, Universität Augsburg: Augsburg, Germany, 1983. [Google Scholar]
- Man, T.W.; Lau, T. Entrepreneurial competencies of SME owner/managers in the Hong Kong services sector: A qualitative analysis. J. Enterprising Cult. 2000, 8, 235–254. [Google Scholar] [CrossRef]
- Chan, K.; Yao, C. The Effect of a Closing auction on Market Quality and Market Efficiency in the Stock Exchange of Hong Kong. HKIMR Appl. Res. Pap. 2021. Available online: https://papers.ssrn.com/sol3/papers.cfm?abstract_id=3839185 (accessed on 3 March 2021).
- Ahmad, Z.; Hassan, S.; Mohammad, J. Determinants of Environmental Reporting in Malaysia. Int. J. Bus. Stud. 2003, 11, 69–90. [Google Scholar]
- Alsayegh, M.F.; Abdul Rahman, R.; Homayoun, S. Corporate economic, environmental, and social sustainability performance transformation through ESG disclosure. Sustainability 2020, 12, 3910. [Google Scholar] [CrossRef]
- Romero, S.; Jeffers, A.E.; Aquilino, F.; DeGaetano, L. Using ESG ratings to build a sustainability investing strategy. CPA J. 2018, 88, 36–43. [Google Scholar]
- Fogg, B.J. Persuasive ’09 Proceedings of the 4th International Conference on Persuasive Technology; ACM: New York, NY, USA, 2009. [Google Scholar]
- Michael, S. Job market signaling. Q. J. Econ. 1973, 87, 355–374. [Google Scholar]
- Watson, L.A.; Monterio, B.J. The next stage in the evolution of business reporting-the journey towards an interlinked, integrated report. Chart. Account. 2011, 75–78. [Google Scholar]
- Abdul Rahman, R.; Alsayegh, M.F. Determinants of Corporate Environment, Social and Governance (ESG) Reporting among Asian Firms. J. Risk Financ. Manag. 2021, 14, 167. [Google Scholar] [CrossRef]
- Eccles and Saltzman. Achieving Sustainability through Integrated Reporting, Stanford Social Innovation Review, Summer 2011. Available online: https://studylib.net/doc/10546175/achieving-sustainability-through-integrated-reporting (accessed on 22 August 2020).
- Corporate Register. Available online: http://www.corporateregister.com/ (accessed on 15 September 2018).
- Elkington, J. Cannibals with Forks: The Triple Bottom Line of 21st Century Business; New Society Publishers: Gabriola Island, BC, Canada, 1997. [Google Scholar]
- Kassel, K.; Rimanoczy, I.; Mitchell, S. The sustainable mindset: Connecting being, thinking, and doing in management education. In Proceedings of the Academy of Management Annual Meeting 2016, Anaheim, CA, USA, 5–9 August 2016. [Google Scholar]
- Kolk, A. Trends in sustainability reporting by the Fortune Global 250. Bus. Strategy Environ. 2003, 12, 279–291. [Google Scholar] [CrossRef]
- Le Lievre, R. Friedman was right about the Corporation, but can the free market solve Global Warming? In Proceedings of the 2009 Committee for the Australasian Postgraduate Philosophy Conference Sydney, Sydney, Australia, 15–17 April 2009; p. 30. [Google Scholar]
- Asia, C.S.R. CSR in Asia the Real Picture. 2010. Available online: https://www.elevatelimited.com/ (accessed on 29 April 2019).
- Eliwa, Y.; Aboud, A.; Saleh, A. ESG practices and the cost of debt: Evidence from EU countries. Crit. Perspect. Account. 2019, 79, 102097. [Google Scholar] [CrossRef]
- Environmental Finance, Sustainable Bonds Insights 2021. Available online: https://www.environmental-finance.com/assets/files/research/sustainable-bonds-insight-2021.pdf (accessed on 15 April 2022).
- Healy, P.M.; Palepu, K.G. Information asymmetry, corporate disclosure, and the capital markets: A review of the empirical disclosure literature. J. Account. Econ. 2001, 31, 405–440. [Google Scholar] [CrossRef]
- Hoffelder, K. The value of sustainability. Account. Tax 2012, 17–18. [Google Scholar]
- Dobbs, S.; Van Staden, C. Motivations for corporate social and environmental reporting: New Zealand evidence. Sustain. Account. Manag. Policy J. 2016, 7, 449–472. [Google Scholar] [CrossRef]
- MacLean, R.; Rebernak, K. Closing the credibility gap: The challenges of corporate responsibility reporting. In Environmental Quality Management, Summer; Wiley Periodicals, LLC: Hoboken, NJ, USA, 2007. [Google Scholar]
- Bentham, J. Principles of Penal Law; Tait: Edinburgh, UK, 1843. [Google Scholar]
- Brennan, N.M.; Merkl-Davies, D.M. Rhetoric and argument in social and environmental reporting: The Dirty Laundry case. Account. Audit. Account. J. 2014, 27, 602–633. [Google Scholar] [CrossRef]
- Patten, D.M. The accuracy of financial report projections of future environmental capital expenditures: A research note. Account. Organ. Soc. 2005, 30, 457–468. [Google Scholar] [CrossRef]
- Peng, L.S.; Isa, M. Environmental, Social and Governance (ESG) Practices And Performance In Shariah Firms: Agency or Stakeholder Theory? Asian Acad. Manag. J. Account. Financ. 2020, 16, 1–34. [Google Scholar]
- Poh, J. ESG-Linked Loan Boom Hit by Pandemic Push for Short-Term Funds. Bloom. News 2020. Available online: https://www.bloomberg.com/news/articles/2020-10-20/esg-linked-loan-boom-hit-by-pandemic-push-for-short-term-funds#xj4y7vzkg (accessed on 26 June 2021).
- Prencipe, A. Proprietary costs and determinants of voluntary segment disclosure: Evidence from Italian listed companies. Eur. Account. Rev. 2004, 13, 319–340. [Google Scholar] [CrossRef]
- PRI. Principles for Responsible Investment. 2006. Available online: https://www.unpri.org/about (accessed on 15 September 2018).
- Kim, E.H.; Lyon, T.P. Greenwash vs. brownwash: Exaggeration and undue modesty in corporate sustainability disclosure. Organ. Sci. 2015, 26, 705–723. [Google Scholar] [CrossRef]
- Donaldson, T.; Preston, L.E. The Stakeholder Theory of the Corporation: Concepts, Evidence and Implications. Acad. Manag. Rev. 1995, 20, 65–91. [Google Scholar] [CrossRef]
- Brown, W.O.; Helland, E.; Smith, J.K. Corporate philanthropic practices. J. Corp. Financ. 2006, 12, 855–877. [Google Scholar] [CrossRef]
- Khan, H.Z.; Bose, S.; Mollik, A.T.; Harun, H. “Green washing” or “authentic effort”? An empirical investigation of the quality of sustainability reporting by banks. Account. Audit. Account. J. 2020, 34, 338–369. [Google Scholar] [CrossRef]
- Rensburg, R.; Botha, E. Is Integrated Reporting the silver bullet of financial communication? A stakeholder perspective from South Africa. Public Relat. Rev. 2014, 40, 144–152. [Google Scholar] [CrossRef]
- Shacklett, M. Sustainability, greenwashing, and the road ahead for the supply chain. World Trade 2011, 24, 32. [Google Scholar]
- Becker, G.S. Crime and punishment: An economic approach. J. Political Econ. 1968, 76, 169–217. [Google Scholar] [CrossRef]
- Dye, R.A. Disclosure of nonproprietary information. J. Account. Res. 1985, 23, 123–145. [Google Scholar] [CrossRef]
- Konigs, A.; Schiereck, D. Intangibles reporting—The financial communication challenge in response to corporate responsibility requirements. zfwu Zeitschrift für Wirtschafts-und Unternehmensethik 2008, 9, 193–195. [Google Scholar]
- Rezaee, Z. Business sustainability research: A theoretical and integrated perspective. J. Account. Lit. 2016, 36, 48–64. [Google Scholar] [CrossRef]
- Amaeshi, K.; Grayson, D. The Challenges of Mainstreaming Environmental, Social and Governance (ESG) Issues in Investment Decision, Working Paper, 2009. Available online: https://citeseerx.ist.psu.edu/document?repid=rep1&type=pdf&doi=0660e46c233bc99f28b75c10b3429988a33f7e9d (accessed on 20 December 2022).
- Harte, G.; Lewis, L.; Owen, D. Ethical investment and the corporate reporting function. Crit. Perspect. Account. 1991, 2, 227–253. [Google Scholar] [CrossRef]
- De Villiers, C.; Van Staden, C.J. Where firms choose to disclose voluntary environmental information. J. Account. Public Policy 2011, 30, 504–525. [Google Scholar] [CrossRef]
- Dienes, D.; Sassen, R.; Fischer, J. What are the drivers of sustainability reporting? A systematic review. Sustain. Account. Manag. Policy J. 2016, 7, 154–189. [Google Scholar] [CrossRef]
- Doane, D. Market Failure: The Case for Mandatory Social and Environmental Reporting; Presentation at Institute for Public Policy Research Seminar; New Economics Foundation: London, UK, 2004. [Google Scholar]
- Hossain, M.; Perera, M.H.B.; Rahman, A.R. Voluntary disclosure in the annual reports of New Zealand companies. J. Int. Financ. Manag. Account. 1995, 6, 69–87. [Google Scholar] [CrossRef]
- Watson, A.; Shrives, P.; Marston, C. Voluntary disclosure of accounting ratios in the UK. Br. Account. Rev. 2002, 34, 289–313. [Google Scholar] [CrossRef]
- Cotter, J.; Lokman, N.; Najah, M.M. Voluntary disclosure research: Which theory is relevant? J. Theor. Account. Res. 2011. Available online: https://www.researchgate.net/profile/Norziana-Lokman/publication/281390648_Voluntary_Disclosure_Research_Which_Theory_Is_Relevant/links/588425bc4585150dde41f6dc/Voluntary-Disclosure-Research-Which-Theory-Is-Relevant.pdf (accessed on 6 December 2021). [CrossRef]
- Guthrie, J.; Parker, L.D. Corporate social reporting: A rebuttal of legitimacy theory. Account. Bus. Res. 1989, 19, 343–352. [Google Scholar] [CrossRef]
- Murphy, D.; McGrath, D. ESG reporting-class actions, deterrence, and avoidance. Sustain. Account. Manag. Policy J. 2013, 4, 216–235. [Google Scholar] [CrossRef]
- Nussim, J.; Tabbach, A. Deterrence or avoidance. Int. Rev. Law Econ. 2009, 29, 314–323. [Google Scholar] [CrossRef]
- Rezaee, Z.; Tuo, L. Voluntary disclosure of non-financial information and its association with sustainability performance. Adv. Account. 2017, 39, 47–59. [Google Scholar] [CrossRef]
- Ioannou, I.; Serafeim, G. The consequences of Mandatory Corporate Sustainability Reporting. Harvard Business School Research Working Paper No. 11-100. 2011. Available online: https://www.albertoandreu.com/uploads/2011/05/The-consequences-of-mandatory-corporate-sustainability-reporting.pdf (accessed on 21 November 2021).
- Trevor, D.W.; Geoffrey, R.F. Corporate environmental reporting. A test of legitimacy theory. Account. Audit. Account. J. 2000, 13, 10–26. [Google Scholar]
- Van Zijl, W.; Wöstmann, C.; Maroun, W. Strategy disclosures by listed financial services companies: Signalling theory, legitimacy theory and South African integrated reporting practices. S. Afr. J. Bus. Manag. 2017, 48, 73–85. [Google Scholar] [CrossRef]
- Dawkins, C.; Ngunjiri, W.F. Corporate Social Responsibility Reporting in South Africa. J. Bus. Commun. 2008, 45, 286–307. [Google Scholar] [CrossRef]
- IR Council. The International <IR> Framework; IR Council: Zurich, Switzerland, 2013. [Google Scholar]
- Wang, J.; Song, L.; Yao, S. The determinants of corporate social responsibility disclosure: Evidence from China. J. Appl. Bus. Res. JABR 2013, 29, 1833–1848. [Google Scholar] [CrossRef]
- Watts, R.L.; Zimmerman, J.L. Towards a positive theory of the determination of accounting standards. Account. Rev. 1978, 53, 112–134. [Google Scholar]
- Doane, M.A. The Emergence of Cinematic Time: Modernity, Contingency, the Archive; Harvard University Press: Cambridge, MA, USA, 2002. [Google Scholar]
- Integrated Reporting Committee of South Africa (IRCSA). Framework for Integrated Reporting and the Integrated Report; Integrated Reporting Committee of South Africa: Craighall, South Africa, 2011. [Google Scholar]
- Verrecchia, R.E. Discretionary disclosure. J. Account. Econ. 1983, 5, 179–194. [Google Scholar] [CrossRef]
- Verrecchia, R.E. Information quality and discretionary disclosure. J. Account. Econ. 1990, 12, 365–380. [Google Scholar] [CrossRef]
- Verrecchia, R.E. Essays on disclosure. J. Account. Econ. 2001, 32, 97–180. [Google Scholar] [CrossRef]
- Kent, P.; Monem, R. What drives TBL reporting: Good governance or threat to legitimacy? Aust. Account. Rev. 2008, 18, 297–309. [Google Scholar] [CrossRef]
- Said, R.; Zainuddin, Y.H.; Haron, H. The relationship between corporate social responsibility disclosure and corporate governance characteristics in Malaysian public listed companies. Soc. Responsib. J. 2009, 5, 212–226. [Google Scholar] [CrossRef]
- Condon, L. Sustainability and small to medium sized enterprises-How to engage them. Aust. J. Environ. Educ. 2004, 20, 57–67. [Google Scholar] [CrossRef]
- Jensen, M.C.; Meckling, W.H. Theory of the firm: Managerial behavior, agency costs and ownership structure. J. Financ. Econ. 1976, 3, 77–132. [Google Scholar] [CrossRef]
- Van der Sandra, L. The role of theory in explaining motivation for corporate social disclosure: Voluntary disclosures vs “solicited” disclosures. Australas. Account. Bus. Financ. J. 2009, 3, 15–29. [Google Scholar]
- Jonkutė, G.; Staniškis, J.K.; Dukauskaitė, D. Social responsibility as a tool to achieve sustainable development in SMEs. Environ. Res. Eng. Manag. 2011, 57, 67–81. [Google Scholar]
- Lauterbach, B.; Vaninsky, A. Ownership structure and firm performance: Evidence from Israel. J. Manag. Gov. 1999, 3, 189–201. [Google Scholar] [CrossRef]
- Schein, S. A New Psychology for Sustainability Leadership: The Hidden Power of Ecological Worldviews; Greenleaf Publishing: Austin, TX, USA, 2015. [Google Scholar]
- Schuler, D.A.; Cording, M. A corporate social performance–corporate financial performance behavioral model for consumers. Acad. Manag. Rev. 2006, 31, 540–558. [Google Scholar] [CrossRef]
- Sillanpää, M. The Body Shop values report–Towards integrated stakeholder auditing. J. Bus. Ethics 1998, 17, 1443–1456. [Google Scholar] [CrossRef]
- Audretsch, D.B. Small Firms and Efficiency. In Are Small Firms Important? Their Role and Impact; Acs, Z.J., Ed.; Kluwer Academic Publishers: London, UK, 1999; pp. 21–37. [Google Scholar]
- Consultation Conclusions on ESG Guide (August 2012), Hong Kong Exchange. Available online: https://www.hkex.com.hk/-/media/HKEX-Market/Listing/Rules-and-Guidance/Other-Resources/Environmental-Social-and-Governance/Exchange-Publications-on-ESG/cp201112cc.pdf?la=en (accessed on 15 September 2018).
- George, E. Yes, SMEs Can Be Sustainable—And Here’s How” in the Book “Yes, Business Can”; Llodys Banking Group: Edinburgh, UK, 2021. [Google Scholar]
- Li, Y.; Gong, M.; Zhang, X.Y.; Koh, L. The impact of environmental, social, and governance disclosure on firm value: The role of CEO power. Br. Account. Rev. 2018, 50, 60–75. [Google Scholar] [CrossRef]
- Arend, R.J. Social and environmental performance at SMEs: Considering motivations, capabilities, and instrumentalism. J. Bus. Ethics 2014, 125, 541–561. [Google Scholar] [CrossRef]
- Jo, H.; Harjoto, M.A. The causal effect of corporate governance on corporate social responsibility. J. Bus. Ethics 2012, 106, 53–72. [Google Scholar] [CrossRef]
- Suchman, M.C. Managing legitimacy: Strategic and institutional approaches. Acad. Manag. Rev. 1995, 20, 571–610. [Google Scholar] [CrossRef]
- Anderson, A.B.; Harris, A.R.; Miller, J. Models of deterrence theory. Soc. Sci. Res. 1983, 12, 236–262. [Google Scholar] [CrossRef]
- Beccaria, C. Essays on Crimes and Punishment; Bobbs-Merrill: Indianaopolis, IN, USA, 1809. [Google Scholar]
- Beck, C.T. Qualitative research: The evaluation of its credibility, fittingness, and auditability. West. J. Nurs. Res. 1993, 15, 263–266. [Google Scholar] [CrossRef]
- Kaplan, R.S.; Norton, D.P. The Balanced Scorecard—Measures That Drive Performance; Harvard Business Review: Boston, MA, USA, 1992; pp. 71–79. [Google Scholar]
- Gillan, S.; Hartzell, J.C.; Koch, A.; Starks, L.T. Firms’ environmental, social and governance (ESG) choices, performance and managerial motivation. 2010. (Unpublished Work).
- Vormedal, I.; Ruud, A. Sustainability reporting in Norway—An assessment of performance in the context of legal demands and socio-political drivers. Bus. Strategy Environ. 2009, 18, 207–222. [Google Scholar] [CrossRef]
- Handy, C. Understanding Organizations; Oxford University Press: Oxford, UK, 1976. [Google Scholar]
- Lock, I.; Seele, P. The credibility of CSR (corporate social responsibility) reports in Europe. Evidence from a quantitative content analysis in 11 countries. J. Clean. Prod. 2016, 122, 186–200. [Google Scholar] [CrossRef]
- Allouche, J.; Laroche, P. A meta-analytical investigation of the relationship between corporate social and financial performance. Rev. Gest. Ressour. Hum. 2005, 57, 18. [Google Scholar]
- King, R.R. Reputation formation for reliable reporting: An experimental investigation. Account. Rev. 1996, 71, 375–396. [Google Scholar]
- Diamond, D.W.; Verrecchia, R.E. Disclosure, liquidity, and the cost of capital. J. Financ. 1991, 46, 1325–1359. [Google Scholar] [CrossRef]
- Hopkins, P.E. The effect of financial statement classification of hybrid financial instruments on financial analysts’ stock price judgments. J. Account. Res. 1996, 34, 33–50. [Google Scholar] [CrossRef]
- Beattie, V.; McInnes, B.; Fearnley, S. A methodology for analysing and evaluating narratives in annual reports: A comprehensive descriptive profile and metrics for disclosure quality attributes. In Accounting Forum; Elsevier: Amsterdam, The Netherlands, 2004; Volume 28, pp. 205–236. [Google Scholar]
- Haddock-Fraser, J.; Fraser, I. Assessing corporate environmental reporting motivations: Differences between ‘close-to-market’and ‘business-to-business’ companies. Corp. Soc. Responsib. Environ. Manag. 2008, 15, 140–155. [Google Scholar] [CrossRef]
- Mion, G.; Loza Adaui, C.R. Mandatory nonfinancial disclosure and its consequences on the sustainability reporting quality of Italian and German companies. Sustainability 2019, 11, 4612. [Google Scholar] [CrossRef]
- Cho, C.H.; Patten, D.M. The role of environmental disclosures as tools of legitimacy: A research note. Account. Organ. Soc. 2007, 32, 639–647. [Google Scholar] [CrossRef]
- Cormier, D.; Magnan, M. Environmental reporting management: A continental European perspective. J. Account. Public Policy 2003, 22, 43–62. [Google Scholar] [CrossRef]
- Patten, D.M. The relation between environmental performance and environmental disclosure: A research note. Account. Organ. Soc. 2002, 27, 763–773. [Google Scholar] [CrossRef]
- Michelon, G.; Pilonato, S.; Ricceri, F. CSR reporting practices and the quality of disclosure: An empirical analysis. Crit. Perspect. Account. 2015, 33, 59–78. [Google Scholar] [CrossRef]
- Global Reporting Initiative. Sustainability Reporting Guidelines; GRI: Amsterdam, The Netherlands, 2006. [Google Scholar]
- Michelon, G.; Pilonato, S.; Ricceri, F.; Roberts, R.W. Behind camouflaging: Traditional and innovative theoretical perspectives in social and environmental accounting research. Sustain. Account. Manag. Policy J. 2016, 7, 2–25. [Google Scholar] [CrossRef]
- Beretta, S.; Bozzolan, S. A framework for the analysis of firm risk communication. Int. J. Account. 2004, 39, 265–288. [Google Scholar] [CrossRef]
- Chauvey, J.N.; Giordano-Spring, S.; Cho, C.H.; Patten, D.M. The normativity and legitimacy of CSR disclosure: Evidence from France. J. Bus. Ethics 2015, 130, 789–803. [Google Scholar] [CrossRef]
- Baalouch, F.; Ayadi, S.D.; Hussainey, K. A study of the determinants of environmental disclosure quality: Evidence from French listed companies. J. Manag. Gov. 2019, 23, 939–971. [Google Scholar] [CrossRef]
- Patton, M.Q. Qualitative Evaluation and Research Methods; SAGE Publications, Inc.: Thousand Oaks, CA, USA, 1990. [Google Scholar]
- Patton, M.Q. Qualitative Research & Evaluation Methods: Integrating Theory and Practice; SAGE Publications, Inc.: Thousand Oaks, CA, USA, 2015. [Google Scholar]
- Creswell, J.W.; Hanson, W.E.; Clark Plano, V.L.; Morales, A. Qualitative research designs: Selection and implementation. Couns. Psychol. 2007, 35, 236–264. [Google Scholar] [CrossRef]
- Creswell, J.W.; Poth, C.N. Qualitative inquiry and research design (international student edition): Choosing among five approaches. Language 2018, 25, 23. [Google Scholar]
- Glasser, B.; Strauss, A. The Discovery of Grounded Theory: Strategies for Qualitative Research; Routledge: Oxfordshire, UK, 1977. [Google Scholar]
- Glasser, B.G. Naturalist Inquiry and Grounded Theory; Sociology: Mill Valley, CA, USA, 2004. [Google Scholar]
- Hammersley, M. A historical and comparative note on the relationship between analytic induction and grounded theorising. Forum Qual. Soc. Res. 2010, 11. [Google Scholar] [CrossRef]
- Ho Jennifer, L.C.; Taylor, M.E. An empirical analysis of triple bottom-line reporting and its determinants: Evidence from the United States and Japan. J. Int. Financ. Manag. Account. 2007, 18, 123–150. [Google Scholar] [CrossRef]
- Sandelowski, M. Tables or tableaux? The challenges of writing and reading mixed methods studies. In Handbook of Mixed Methods in Social and Behavioral Research; SAGE Publications, Inc.: Thousand Oaks, CA, USA, 2003; pp. 321–350. [Google Scholar]
- Strauss, A.; Corbin, J. Basics of Qualitative Research Techniques; Sage Publications: Thousand Oaks, CA, USA, 1998. [Google Scholar]
- Timmermans, S.; Tavory, I. Theory construction in qualitative research: From grounded theory to abductive analysis. Sociol. Theory 2012, 30, 167–186. [Google Scholar] [CrossRef]
- Bryman, A.; Bell, E. Business Research Methods 3e; Oxford University Press: Oxford, UK, 2011. [Google Scholar]
- McCallin, A.M. Designing a grounded theory study: Some practicalities. Nurs. Crit. Care 2003, 8, 203–208. [Google Scholar] [CrossRef]
- Kwok, J.K. Does switching trading venues create value? Evidence from Hong Kong. J. Asian Bus. Econ. Stud. 2020, 27, 209–222. [Google Scholar] [CrossRef]
- Sharma, G. Pros and cons of different sampling techniques. Int. J. Appl. Res. 2017, 3, 749–752. [Google Scholar]
- Anzai, Y.; Simon, H.A. The theory of learning by doing. Psychol. Rev. 1979, 86, 124. [Google Scholar] [CrossRef]
- Holloway, I.; Wheeler, S. Qualitative Research for Nurses; Blackwell Science: Oxford, UK, 1996; pp. 115–129. [Google Scholar]
- Cuesta, M.; Valor, C. Evaluation of the environmental, social and governance information disclosed by Spanish listed companies. Soc. Responsib. J. 2013, 9, 220–240. [Google Scholar] [CrossRef]
- Olesen, V.L.; Bryant, A.; Charmaz, K. Feminist qualitative research and grounded theory: Complexities, criticisms, and opportunities. In The SAGE Handbook of Grounded Theory; SAGE Publications Ltd.: Thousand Oaks, CA, USA, 2010; pp. 417–435. [Google Scholar]
- Walton, S.; Tregidga, H.; Milne, M.J. The Triple-Bottom-Line: Benchmarking New Zealand’s Early Reporters; University of Otago: Dunedin, New Zealand, 2003. [Google Scholar]
- SustainAbility and UNEP. The Global Reporters: The 2000 Benchmark Survey; SustainAbility and UNEP: London, UK, 2000. [Google Scholar]
- Guenther, E.; Hoppe, H.; Poser, C. Environmental Corporate Social Responsibility of Firms in the Mining and Oil and Gas Industries: Current Status Quo of Reporting Following GRI Guidelines. Greener Manag. Int. 2007, 53, 7–25. [Google Scholar]
- Holder-Webb, L.; Cohen, J.R.; Nath, L.; Wood, D. The supply of corporate social responsibility disclosures among US firms. J. Bus. Ethics 2009, 84, 497–527. [Google Scholar] [CrossRef]
- Morhardt, J.E.; Baird, S.; Freeman, K. Scoring corporate environmental and sustainability reports using GRI 2000, ISO 14031 and other criteria. Corp. Soc. Responsib. Environ. Manag. 2002, 9, 215–233. [Google Scholar] [CrossRef]
- Scheel, C.; Mecham, J.; Zuccarello, V.; Mattes, R. An evaluation of the inter-rater and intra-rater reliability of OccuPro’s functional capacity evaluation. Work 2018, 60, 465–473. [Google Scholar] [CrossRef]
- Corden, A.; Sainsbury, R. Exploring ‘quality’: Research participants’ perspectives on verbatim quotations. Int. J. Soc. Res. Methodol. 2006, 9, 97–110. [Google Scholar] [CrossRef]
- Gomer, S.; Jones, A. Survey: How Companies Manage Sustainability: McKinsey Global Survey Result; McKinsey & Company: Atlanta, GA, USA, 2010. [Google Scholar]
- Grayson, D. Business-Led Corporate Responsibility Coalitions: Learning from the Example of Business in the Community. 2007. Available online: http://hdl.handle.net/1826/3428 (accessed on 20 December 2022).
- Hill, Z.; Tawiah-Agyemang, C.; Kirkwood, B.; Kendall, C. Are verbatim transcripts necessary in applied qualitative research: Experiences from two community-based intervention trials in Ghana. Emerg. Themes Epidemiol. 2022, 19, 5. [Google Scholar] [CrossRef] [PubMed]
- Gray, R. Thirty years of Social Accounting, Reporting and Auditing: What (if anything) Have We Learnt? Bus. Ethics A Eur. Rev. 2001, 10, 9–15. [Google Scholar] [CrossRef]
- Gray, R.; Owen, D.; Adams, C. Accounting and Accountability; Prentice Hall: Edinburgh, UK, 1996. [Google Scholar]
- Gray, R.; Kouhy, R.; Lavers, S. Constructing a research database of social and environmental reporting by UK companies. Account. Audit. Account. J. 1995, 8, 78–101. [Google Scholar] [CrossRef]
- Kozminsky, L.; Nathan, N.; Kozminsky, E. Using concept mapping to construct new knowledge while analyzing research data: The case of the grounded theory method. In Concept Mapping: Connecting Educators: Proceedings of the Third International Conference on Concept Mapping; Tallinn University: Tallinn, Estonia, 2008; Volume 2, pp. 704–708. [Google Scholar]
- Eccles, R.G.; Krzus, M.P.; Rogers, J.; Serafeim, G. The need for sector-specific materiality and sustainability reporting standards. J. Appl. Corp. Financ. 2012, 24, 65–71. [Google Scholar] [CrossRef]
- Ioannou, I.; Serafeim, G. The power of transparency. Bus. Strategy Rev. 2011. Available online: https://onlinelibrary.wiley.com/doi/abs/10.1111/j.1467-8616.2011.00780.x (accessed on 10 January 2021). [CrossRef]
- Alasuutari, P. Researching Culture: Qualitative Method and Cultural Studies; Sage: Singapore, 1995. [Google Scholar]
- Bryant, A.; Charmaz, K. (Eds.) The Sage Handbook of Grounded Theory; Sage: Singapore, 2007. [Google Scholar]
- Corbin, J.M.; Strauss, A. Grounded theory research: Procedures, canons, and evaluative criteria. Qual. Sociol. 1990, 13, 3–21. [Google Scholar] [CrossRef]


Disclaimer/Publisher’s Note: The statements, opinions and data contained in all publications are solely those of the individual author(s) and contributor(s) and not of MDPI and/or the editor(s). MDPI and/or the editor(s) disclaim responsibility for any injury to people or property resulting from any ideas, methods, instructions or products referred to in the content. |
© 2023 by the authors. Licensee MDPI, Basel, Switzerland. This article is an open access article distributed under the terms and conditions of the Creative Commons Attribution (CC BY) license (https://creativecommons.org/licenses/by/4.0/).