Abstract
There are many logistics nuances specific to bakery factories, making the design of their distribution network especially complex. In particular, bakery products typically have a shelf life of under a week. To ensure that products are delivered to end-customers with freshness, speed, quality, health, and safety prioritized, the distribution network, facility location, and ordering system must be optimally designed. This study presents a multi-stage framework for a bakery factory comprised of a selection methodology of an optimum facility location, an effective distribution network for delivery operations, and a practical ordering system used by related supply chain actors. The operations function and distribution network are optimized using a multi-criteria decision-making method comprised of the Analytic Hierarchy Process (AHP) to establish optimization criteria and Technique of Order Preference Similarity to the Ideal Solution (TOPSIS) to select the optimal facility location. The optimal distribution network strategy was found using an optimization technique. This framework was applied to a real-life problem for a bakery supply chain in the Western Region, Saudi Arabia. Using a real-life, quantitative dataset and incorporating qualitative feedback from key stakeholders in the supply chain, the developed framework enabled a reduction in overall distribution costs by 14%, decreasing the total travel distance by 16%, and decreasing estimated food waste by 22%. This result was primarily achieved by solving the facility location problem in favor of operating two factories without dedicated storage facilities and implementing the distribution network strategy of direct shipment of products from the bakery to customers.
1. Introduction
In the modern era, food supply chains are highly complex—and often global—networks of stakeholders that create pathways from food producers to processors, distributors, retailers, and consumers. Huge amount of food loss and waste occurs in the food supply chain network due to inefficient logistics operations. For instance, Al-Khateeb et al. [1] suggested that about 30% of the total amount of food that is accessible in Saudi Arabia might be lost or wasted along the whole food supply chain, which gives insight into the current state of food loss and waste. Efficient logistics and technology are essential success elements for effective distribution systems to reduce food loss and waste. Their key role is to meet the demand side of the supply chain’s requirements through the delivery of excellent quality items in suitable quantities to the right location utilizing the best path at the right time with optimal costs [2]. This complexity has created new challenges for food supply chain management, optimization, cost-effectiveness, and sustainability. Ekren and Kumar [3] argued that the supply chain network plays an important role in reducing food loss and waste. In creating food supply chains characterized by low cost and high responsiveness, logistics distribution systems, which move products from suppliers to customers, have a key role to play [4]. Furthermore, distribution is a crucial driver of a firm’s total profitability since it directly impacts supply chain costs and customer experience [5]. Given distribution’s contribution to competitive advantage, companies in the same industry frequently utilize dramatically diverse distribution networks [6].
In a distribution network system, when deciding the location of a facility, a company must consider many factors, such as new freight expenses and the cost of a new or leased facility, and factor in the inherent risk and variability that come with facility location and distribution network design decisions [7]. Food distribution management is a particularly challenging area, because of an intrinsic focus on product quality, integrity, and safety due to the perishability, temperature, spacing, and humidity requirements of certain categories of the product, high customer expectations, low profit margins [4], and challenging supplier–customer relationships [8].
For a bakery factory specifically, whose products typically have a very short shelf life, and which relies on transportation to customers (both retailers and end-users) of goods by van and truck, freshness, speed, quality, health, and safety must be prioritized. It is estimated that one-third of the total food produced for human consumption is lost in supply chains or wasted by the consumer [9]. Bakeries are no exception to this rule. Up to 30% of a large bakery’s output may be lost due to never reaching the consumer as it is not sold before the best-before date [10]. Poor design of the distribution network of perishable goods, ineffective inventory management, and uncertain customer demand may contribute to higher food waste due to product expiration resulting from aging inventory [11,12]. Moreover, about a third of the baked goods sold to consumers ends up being thrown away by consumers due to the high perishability of baked goods, which contributes to food waste at the consumer level [13]. In this light, minimizing food loss and waste becomes an important factor in designing a bakery distribution network. Given that extending the product shelf life of baked goods has a direct impact on food waste [14], it is critical to consider how different distribution network options affect the shelf life of bakery products through improved distribution activities and reduced traveled distances and times.
Various parameters affect the efficiency and effectiveness of a newly designed bakery distribution network system. A key factor is the response time, or the time interval between a consumer placing an order and receiving the delivery, which should be as short as possible to preserve the freshness of baked goods. This factor is also critical from the perspective of sustainability. Iqbal et al. [15] proposed a centralized supply chain model to preserve the food cost effectively by defining a nonlinear mathematical model for maximizing total profit through an analytical optimization technique and an algorithm. The Waste and Resources Action Programme (WRAP), a climate-action non-government organization, explicitly recommends that bakeries investigate ways to extend the shelf life of their products as a way to reduce the waste of baked goods [13]. The response time is determined by a combination of product volume and route length and the density of clients in specific locations. Achieving short response times typically necessitates growing the total number of distribution facilities, but operations managers are cognizant of the positive relationship between facility numbers and overall logistics costs. Thus, a company should only expand facility numbers beyond the cost-cutting point if management is satisfied that revenue growth arising from enhanced responsiveness will outweigh the increase in expenses due to the extra facilities [5]. Other factors that need to be considered include responsiveness, or the ability to tailor manufacturing volume and diversity to customer demand, which in turn is driven by the efficiency of the ordering system, costs, including freight expenses, the cost of a new or leased facility, and the costs associated with holding inventory [7], and product quality and safety [4]. Furthermore, the distribution network design directly impacts travel distance and time, affecting greenhouse gas emissions, traffic congestion, and the remaining shelf life of bakery products. Overall, designing an efficient bakery distribution network is highly complex and fraught with challenges.
In this paper, a useful framework is presented first to select the location of a bakery factory among several alternative sites, then to improve the distribution network of this factory and the operations of the delivery and ordering system by using a comprehensive multi-stage approach. The main decision-making techniques employed include AHP to determine suitable selection criteria for optimizing the facility location of a bakery factory and TOPSIS to find the best option for the bakery factory based on the criteria and weights obtained through AHP. In the next stage, an optimization model is solved to find the best distribution network design for the bakery. A framework is introduced to maximize efficiency for both retailers and manufacturers during the ordering process. This approach was applied to a case study using datasets sourced from a bakery factory of a large food company in the Western Region, Saudi Arabia. This case contributes to the literature by demonstrating how an integrated methodological approach can optimize supply chain decision-making and by utilizing both qualitative and quantitative insights in developing a solution to facility location, distribution network, and ordering system decisions. From the practitioners’ perspective, it offers a ready-to-use framework for the distribution network design for a bakery factory. The framework has demonstrated its ability to reduce distribution costs and time and positively impact the firm’s sustainability.
Following this introduction, the rest of the paper is organized as follows. Section 2 presents a literature review focusing on facility location decisions, distribution network design, ordering system efficiencies, and the AHP-TOPSIS methods used in the study. In Section 3, the methodology of the multi-stage framework is explained. In Section 4, the case study results are presented and discussed, with limitations outlined, and further avenues of investigation suggested. Finally, a conclusion is offered.
2. Literature Review
The literature on the optimal location of bakery factories and bakery distribution operations for this industry was reviewed, as well as the methods and techniques typically employed in these studies. This was followed by searching for facility location selection studies, which play a critical role in food supply chains where the location of the factory increases profit and competitiveness and reduces costs. We examined studies on factory distribution network design that aimed to minimize the costs and time of these operations while facilitating food companies’ delivery systems in order to achieve fast order responses while retaining product freshness. The literature on the AHP and TOPSIS methods and their usage in decision making was reviewed, specifically with respect to food supply chains.
2.1. Facility Location Selection
Facility location contributes substantially to an organization’s distribution capabilities and efficiency, and hence to the bottom line [16]. Optimizing location means taking into consideration access to a range of stakeholders, including customers and workers, as well as transportation links, routes to customers, and other factors, making facility location decisions highly complex. Based on a review of 140 articles on dynamic facility location problems, Arabani and Farahani [17] concluded that, given significant capital outlay, facility location decisions are complex and expensive to reverse, especially where costs, demands, and distance required to travel change over time. Accordingly, firms should make facility location decisions very carefully [18].
In a discrete facility location problem, there is a limited number of site locations from which a selection of new facilities should be made [19]. The most basic setup is the p-median problem, in which p facilities need to be chosen to minimize total (weighted) distances or costs in order to meet client demands [18]. There are many different approaches to solving facility location problems (FLPs) in the extant literature [20], including Multi-Criteria Decision Making (MCDM) methods, that enable decision makers to choose the optimum facility location using selected criteria among suitable alternative locations, optimization approaches employing mathematical/algorithmic models [21], geographic information systems-based approaches [22,23], and simulation-based approaches [7,24], which tend to be focused on cost-savings. For example, Afshari et al. [25] examined how to select a facility location to optimize the profitability, customer satisfaction, and sustainability of forward and reverse network distribution streams while minimizing management costs. Agrebi et al. [21] reviewed the literature on urban distribution centers’ location selection problem.
Azadeh et al. [26] proposed a hybrid model consisting of genetic algorithms (GAs) and discrete-event simulation (DES) quantitative methods for the optimization of the facility layout. Mohamadi et al. [27] integrated two mathematical models—genetic algorithm (GA) and particle swarm optimization (PSO)—to solve facility location problems. Khosravian Ghadikolaei and Shahanaghi [28] proposed a simulated annealing-based solution model for the multi-floor dynamic facility layout problem, which also deals with the dynamic concept of flow changes between departments with time. Omrani and Ghiasi [29] solved the facility location problem using a quantitative mixed-integer linear optimization model. Duong and Bui [30] proposed a capacitated facility location model that minimized total costs for opening facilities. Luis et al. [31] also proposed a capacitated multi-facility location-allocation problem that plans multiple facilities using a two-stage method. Yan et al. [32] developed the Dijkstra algorithm, which can find a dynamic location to generate more revenue and lower costs than the previous static location, while various location objectives have a significant impact on location results. A mixed-integer multi-objective integrated mathematical model was suggested by [33] to address the simultaneous optimization of facility location and order allocation in a two-echelon supply chain network. Lou et al. [34] developed a non-linear multi-objective optimization model to minimize operational cost and balance the workloads among employees.
2.2. Multi-Criteria Decision-Making Approaches in Facility Location Problems
Multi-Criteria Decision Making (MCDM) methods optimize facility location decisions by evaluating the benefits and drawbacks of a range of both quantitative and qualitative criteria [19,35]. Typically, the problem is designed to be resolved by a group of experts who also identify the factors for evaluation.
Within the MCDM literature, both multi-objective decision making (MODM) and multi-attribute decision making (MADM) problems co-exist. MODM techniques like the Cuckoo Search (CS) algorithm and Genetic Algorithm approaches [36] consider various interactions within the design constraints which best satisfy the decision maker by way of attaining some acceptable levels of a set of objectives [19]. In MADM problems, there are a limited number of predetermined alternatives that satisfy certain objectives, and the decision maker (DM) chooses the best alternative based on the relative priority assigned to each objective.
Multiple MADM techniques are available to analysts, including simple additive weighting (SAW), hierarchical additive weighting, mixed-integer programming, and others [37]. For instance, Athawele et al. [35] solved the facility location selection problem with the preference-ranking organization method for enrichment evaluation (PROMETHEE II). Dey et al. [38] studied warehouse location selection problems and proposed a fuzzy MCDM methodology consisting of a combination of the additive weighting method and factor rating systems.
Two effective approaches common in the logistics literature are the Analytic Hierarchy Process (AHP) and the Technique of Order Preference Similarity to the Ideal Solution (TOPSIS). Tramarico et al. [39] claim that AHP is the most frequently used multi-criteria decision-making (MCDM) method in supply chain management. Saaty [40] introduced AHP as a decision-making method that derives rankings of priorities from pairwise comparisons of alternatives. TOPSIS, developed in [41], finds and compares the distance of a series of alternatives to the best and worst solutions. In MCDM problems, facility location selection is usually designed as a group decision-making problem. A group of experts may decide the important factors. Common criteria used in facility location decision problems are transportation facilities, investment costs, labor costs, availability of area, availability of production resources, closeness to markets, nearness to suitable utilities, proximity to adjacent facilities, proximity to raw materials, etc. [19,29,35,42,43]. When all of the relevant information regarding alternative locations has been collected, the benefits and drawbacks of each location must be evaluated against one another. Several studies on the facility location decision use AHP alone for MCDM [44,45]. In designing a pharmaceutical supply chain transportation network, Haial et al. [46] concluded that AHP is the most suitable decision-making framework method among all MCDM methods. Others, however, have found it valuable to combine AHP with other methods, including TOPSIS. For instance, Aravind [47] evaluated distribution network alternatives for fast-moving consumer goods using integrated AHP and fuzzy TOPSIS methods. Sopadang and Banomyong [48] combined the AHP and TOPSIS methods to identify a country-level logistic hub in Southeastern Asia. Ertuğrul and Karakaşoğlu [49] used integrated fuzzy AHP-TOPSIS methods for a facility selection problem in a vague environment.
2.3. Redesigning a Distribution Network
Distribution network design involves specifying the locations of warehouses, allocating product volumes to each facility, and planning the cost of transporting products to meet consumer demand while maintaining acceptable service levels [50]. Supply Chain (SC) networks that are efficient and drive competitive advantage enable the production and speedy distribution of a wide range of high-quality products at low cost [51]. However, this is a complex activity. For instance, in their study, Mangiaracina et al. [6] identified 42 separate factors affecting effective distribution network design. Galkin et al. [52] conducted a study to select the best freight transport for delivering food products to ensure freshness and expiration date by considering the major transport challenges such as congestion, narrow ways, and lack of unloading area.
Many researchers examining food supply chains and logistics have studied distribution network design. Arabsheybani and Arshadi Khasmeh [53] proposed a model to coordinate production planning, distribution, vendor selection, and order allocation for a robust and resilient distribution network in the flavor industry. Paz et al. [54] used deterministic and stochastic models to redesign a supply network for a bakery company. Yadav et al. [55] developed a multi-objective and multi-channel food distribution network model minimizing the total cost, emission, and delivery time. Lin et al. [56] proposed a model to optimize the urban distribution routes for delivering perishable food by utilizing a genetic algorithm and tabu search algorithm, which minimized delivery travel distance, cost, and carbon emission. In order to maximize the efficiency of the entire vehicle distribution routing, Chen et al. [57] created an improved ant colony algorithm (IACA) with powerful global search capabilities that reduced total travel distances and carbon emissions by 4.94% and 5.50%, respectively. For the decarbonization of distribution networks, Meneghetti et al. [58] recommended a sustainable rooftop photovoltaic powered vehicle to distribute long-haul refrigerated food deliveries. Furthermore, these studies employed diverse techniques, including Closed-Loop Supply Chain (CLSC) network designs and Data Envelopment Analyses, among others. Paciarotti et al. [59] studied an efficient distribution model for a third-party logistics provider of a food company; they used Data Envelopment Analyses to reduce transport and delivery costs, improve distribution quality, and increase the flexibility of transportation. Shahanaghi and Yazdian [37] work on both facility location and distribution network design. They selected locations of distribution centers, dealt with different transportation modes, researched the opening decision, and designed the network flow. As a method, they used MCDM for location selection and mixed-integer programming for distribution decisions. Overall, these quantitative optimization techniques were found to positively impact cost minimization and distribution network responsiveness and efficiency.
Several studies have highlighted the link between the efficiency of the distribution system and food loss and waste in supply chains of perishable products. According to [60], distribution and logistics are important factors affecting the quality of perishable products. Gaggero and Tonelli [61] develop an optimization model for the distribution network design that explicitly incorporates wasted products. Relying on a discrete-even simulation, Rijpkema et al. [62] showed that models incorporating only standard cost parameters tend to result in a large amount of loss and lower product quality. Akkaş and Honhon [12] studied the effects of different shipping policies on perishable product loss and waste. In conclusion, the recent literature appears to have reached a consensus regarding the importance of incorporating perishable product food loss and waste in supply chain models in general, and distribution network design in particular.
2.4. Ordering System
The ordering function is tasked with gathering and executing customer order information, and thus represents the link between the production, sales, and distribution departments. Accordingly, for manufacturers and retailers to perform effectively, there must be a high degree of coordination across these functions. Furthermore, based on a review of 250 relevant articles, Gu et al. [63] concluded that an effective ordering system should support the addition and revision of customer information, enable static order processes, be compatible with the organization’s inventory management software/system and make a positive contribution to both customer satisfaction, and the bottom line.
Several previous studies have examined how technology can be used to facilitate this harmonization. For example, Alias [64] developed a web-based ordering system to revolutionize the traditionally designed ordering system. Lee et al. [65] proposed an AI-driven Internet of Things (IoT)-based warehouse management system to support Industry 4.0’s move towards smart logistics. Mahalik and Nambiar [66] identified several modern IT tools and techniques designed to improve order systems, such as smart packaging and automation and control technologies. Dey et al. [38] developed FoodSQRBlock to digitize the supply chain of food using Blockchain and QR codes in the cloud. Others, such as Grosse et al. [67], have explored how to improve human efficiency in order picking (OP) systems.
3. Methodology
A multi-stage framework is proposed drawing on AHP-TOPSIS methods to support the optimized selection of a factory, a distribution network, and an ordering system on behalf of the case study factory. Figure 1 provides a detailed description of the multi-staged framework developed and applied in this article. AHP and TOPSIS were selected for this case, as the literature review revealed them to be among the most commonly used methods in the extant literature. The following approach was employed. First, AHP was used to determine the suitable criteria for determining the optimal facility location analysis, and the TOPSIS technique was used to select the best alternative out of the possible options of the facility location. Key design factors were determined for the initial distribution network design, and then an optimization model was developed, focusing on cost minimization while enabling the model to meet customer requirements. The final step was the design of an optimized ordering system with speed and distribution efficacy as the key decision-making factors.
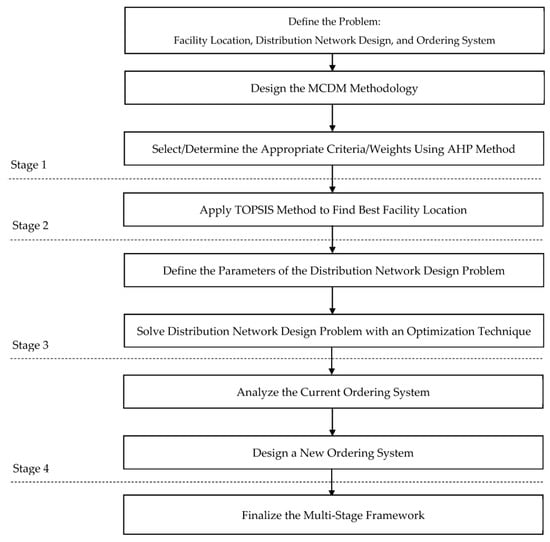
Figure 1.
Methodology of the proposed multi-stage framework.
3.1. AHP Method
The first step in any MCDM process is to outline the decision criteria and to determine their relative weights. In Saaty’s classical model [40], problems are disaggregated and ordered according to their relationship to the process objective. Drawing on the literature [39,40,44], the following steps were identified:
Step 1. Define the problem and determine the aim of the study.
Step 2. Build a decision-making hierarchy that outlines the objectives at the top, places the decision-making criteria in the middle, and outlines the alternative solutions at the lowest level.
Step 3. Build up a series of pairwise comparison matrix sets (size n × n) for the lower levels with one matrix for each element. Each value in the matrix will be obtained as the ratio of the value of the element in Row to the value of the element in Column . Such a matrix is presented in Section 4 (check Table 2). The results of the pairwise comparisons demonstrate the dominance of the criteria.
Step 4. Make judgments on the set of matrices established in Step 3. Reciprocals are determined for each comparison, and hierarchical synthesis is used to determine the relative weight of each criterion.
Step 5. Check for consistency. Since comparisons are based on subjective assessments, the final procedure involves consistency verification—one of the main advantages of the AHP technique.
Step 6. Perform Steps 3–5 for all levels in the hierarchy.
3.2. TOPSIS Method
Using the TOPSIS method, alternatives are ranked based on their distance from the best and worst solutions. The following steps were used [37,41,50]:
Step 1. Build a decision matrix
Construct an evaluation matrix consisting of ‘y’ alternatives and ‘z’ criteria, where each alternative and criterion is denoted by , and hence the decision matrix is . The practical implementation of this step is presented in Table 4.
Step 2. Normalize the decision matrix
Convert the matrix values into matrix using the formula:
The normalized decision matrix with the actual data is presented in Table 5.
Step 3. Build up a weighted normalized decision matrix
where is the normalized weight of Criterion . In its full form, the weighted normalized decision matrix is given as follows:
This matrix with the actual data is presented in Table 6.
Step 4. Calculate the positive and negative ideal solutions
Positive Ideal Solutions are calculated as:
Negative ideal solutions are calculated as:
where
Step 5. Calculate the distances (separation)
Calculate the positive ideal distance:
Calculate the negative ideal distance:
as presented in Table 7.
Step 6. Calculate the relative closeness coefficient value
The relative closeness coefficient ( is calculated to find the optimum alternative using the following formula:
A higher value indicates a better alternative. Table 8 presents the findings based on the data from the case study.
3.3. Distribution Network Design
The key criteria for an efficient distribution network are customer satisfaction and supply chain costs. Thus, the following decision-making factors were identified as model inputs when comparing alternative distribution networks:
3.3.1. Customer Satisfaction Factors
- Response time, defined as the time between a customer placing an order and receiving the delivery. On top of improving customer satisfaction, reducing the response time is critical to decreasing food loss in bakery operations [14].
- Flexibility is the number of different products/configurations that a customer desires from the distribution network. The relationship between flexibility and customer satisfaction is well established in the operations management literature [68].
- Product availability is the probability that a product will be in stock when an order is made. It is an essential attribute of customer satisfaction [69].
- Customer experience includes customers’ experience of placing and receiving their orders. It affects the customer’s attitude toward the firm and, ultimately, their satisfaction [69].
- Order visibility is defined as the ability of the customer to track their order from placement to delivery. While improving customer satisfaction, order visibility might also lower food loss due to a reduced probability of errors in the delivery process [70].
- Returnability describes the ability of the customer to return unsatisfactory merchandise and the ability of the network to handle such returns. It is an important driver of customer satisfaction [71].
3.3.2. Supply Chain Costs
The model incorporates the following supply chain costs:
- Inventory costs
- Transportation costs
- Operational (facilities and handling) costs
- Other costs (including information costs, etc.)
In addition, two key questions are addressed when designing the distribution network:
- Will the product be delivered to the customer’s location or picked up from a preordained site?
- Will the product flow through an intermediary (or intermediate location)?
The selection process of the optimal distribution network strategy takes into consideration the number of customers for each distributor, their locations, expected delivery times, distance traveled, level of involvement of each distributor, and overall costs. Based on these factors, six distribution network designs were proposed, as described in Table 1. As well as considering response time, product availability, product variety, time to market, inventory, facility, handling, and information, to support decision making, insights from knowledgeable stakeholders in the logistics and order fulfillment functions were considered, including the owner, management, and distributors.

Table 1.
Distribution network strategies.
For the selected distribution network strategy, I used a linear optimization technique was used to determine the optimal number of vehicles and their distributors. I defined decision variables for the number of vehicles separately in both Taif and Jeddah. I also defined the capacity of a factory production line as a capacity constraint and 72 h for driving as a time constraint. To determine the optimal number of distribution vehicles in each, an objective function was set up as a minimization of the cost of vehicles or distributors to each city. Denoting the number of vehicles in Taif as and the number of vehicles in Jeddah as , the objective function can be formulated as , where is the total cost associated with operating a vehicle in Region , subject to the constraints outlined above.
It is also worth noting that the direct shipment strategies outlined in Table 1 make it possible to rely on make-to-order production, while the strategies involving intermediaries may require make-to-stock production. Given that the mismatch between supply and demand is the key factor in the food loss of baked goods [10], direct shipment strategies may help reduce food loss.
To assess the effect of different distribution network strategies on food loss, the average shelf life of bakery products was assumed to be six days, or 144 h [13]. Denoting the original average distribution time as and the new distribution time under Strategy (such that ) as , the average relative improvement in the remaining shelf life of bakery products can be found as follows:
Negative values of this ratio would indicate that a strategy decreases the remaining shelf life. Taking into account that 70% of baked goods are wasted due to not being used by the expiry date [10], and assuming uniform consumption of baked goods, the improvement in the amount of loss can be estimated as follows:
Further to food loss, the impact of different distribution network strategies on CO2 emissions would be assessed. Following Browne et al. [71], the average emission of a modern delivery vehicle is assumed to be 147 g CO2/km. Therefore, the emissions of a given strategy in grams can be found as , where is the total travel distance under Strategy .
3.4. Designing an Effective Ordering System
An ordering system is essentially a flow chain of data or information from the logging of an order from a retailer to manufacturers, distributors, and accounting facilities. Thus, the design of an effective ordering system begins by specifying the input, output, and process requirements. Inputs are the data that come from order details, cash data, and personnel information. Output requirements are mostly the report of the activities, requested amount of the goods, and raw materials. Process requirements are order records, reports, workflow processing, and payment information.
To improve the ordering system, the Business Process Management (BPM) method was used, which consists of five stages: analyze, model, implement, monitor, and optimize. To analyze and model the existing system and evaluate its drawbacks, a questionnaire was prepared, designed a draft ordering system, and conducted feasibility analyses, assessing operational, economic, temporal, and technical feasibility. For example, operational feasibility involves checking new systems’ integration and meeting order responsibilities and user needs. Temporal feasibility examines whether the project can be completed within the specified time. Using all these inputs, we sought to design an efficient ordering system coordinating retailers, operators, distributors, and accountants.
3.5. The Case Study
Below, a case study is described to decide the best facility location and design its distribution network for a dual-location bakery factory in the Western Region, Saudi Arabia. Figure 2 shows the map highlighting the operating areas of the bakery. AHP and TOPSIS methods are applied for a facility location decision. Then, a distribution network is determined, and an ordering system is designed. The datasets and responses for the case study application were collected through a survey distributed to the bakery company’s management and operational team, including the managers, operators, and distributors at the bakery company in the case study. The data collection was conducted rigorously to find out the current distribution network and the operations of the bakery company. Overall, 25 responses were received from the company’s personnel, including 5 managers, 5 operators, and 15 distributors. The questionnaire, which included both closed-ended and open-ended questions, was applied because it was relatively inexpensive and enabled the collection of diverse and comprehensive operational information in a timely and cost-effective approach without adversely affecting the bakery’s operations. The survey was followed up with a series of interviews with the company’s management to validate the values of the key model parameters and ensure the suitability and merit of the developed framework in creating efficient and applicable improvements for the bakery factory. Accordingly, after collecting the company information from the respondents, the operational datasets were input into the developed framework for finding optimized facility location, distribution network, and ordering system in the context of the existing scenario of the bakery factory.
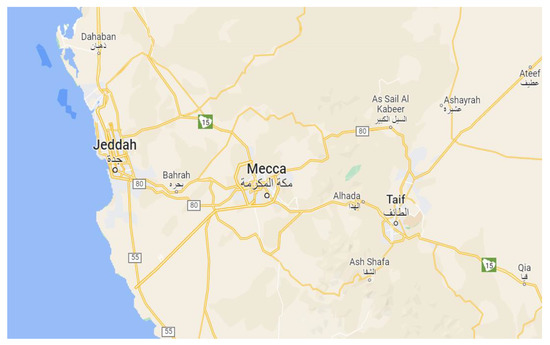
Figure 2.
Operating areas of the case study bakery.
In the first stage, the datasets were used to determine the most important criteria for the factory by constructing the pairwise comparison matrix (as shown in Table 2). In particular, for each pair of criteria, the relative value was calculated based on the responses provided by the interviewees. In the next stage, the criteria weights were used to find the optimal scenario based on the TOPSIS model, for which the optimization model was developed, and the ordering system was designed.
3.5.1. Analyzing the Problem
The company produces hot dog bread on an independent manual line and pita bread on an automated line. It operates two production factories located in Jeddah and Taif. At the time of the case study, the Jeddah factory was closed due to an ongoing cost optimization initiative, leaving only one operating factory, even though there had been no concomitant change in demand. The firm employs 25 to 35 workers and utilizes up to 15 transport vehicles that serve both cities.
After a site survey, two key problems related to rising costs were identified. First, it was observed that ordering relies heavily on paperwork, which is burdensome in terms of time, effort, and costs while increasing the risk of human error. Issues with the facilities and distribution network were also noted. In addition to the inactive factory site, cost ratios were high due to a disorganized, unplanned distribution network. There were also irregularities in distributing goods to consumers, leading to (for example) products being delivered to two separate customers in the same street and area by two distributors. This raised costs, which had to be met through increased prices. Based on these observations, two primary objectives were determined to improve the distribution system of this bakery facility. First, we sought to identify the optimal location for the factory—Jeddah, Taif, or both—before redesigning the distribution network. Location and distribution network alternatives considered were:
- Operations in both Jeddah (factory) and Taif (factory);
- Storage and distribution operations in Jeddah (warehouse) and manufacturing located in Taif (factory);
- Manufacturing located in Jeddah (factory), with storage and distribution operations concentrated in Taif (warehouse).
Second, we sought to establish an ordering system to enhance and be responsive to demand and improve the manufacturing process’s efficiency and productivity.
3.5.2. Application of AHP and TOPSIS Method
Based on the literature review, the following criteria (Xi) are identified:
X1: Fixed Assets.
X2: Sales.
X3: Operational Cost.
X4: Transportation Cost.
X5: Equipment Availability: Availability and Suitability of Equipment and Maintenance Parts.
X6: Qualified Suppliers: Availability and Accessibility to Qualified Suppliers in Local Market.
X7: Staff Quality: The Efficiency and Quality of Human Staff.
X8: Proximity to (Local) Market.
The relative weights of the criteria are calculated based on the results of the AHP analysis. These relative weights are used as an input, and the following three alternatives are evaluated using TOPSIS:
- Scenario 1: Jeddah (factory) and Taif (factory).
- Scenario 2: Jeddah (warehouse) and Taif (factory).
- Scenario 3: Jeddah (factory) and Taif (warehouse).
All steps of the TOPSIS method were applied to find the optimum alternative.
3.5.3. Determination of the Distribution Network
To select the optimal distribution network strategy from the six alternatives mentioned above, the feedback and opinions from the owner, management, and distributors were considered to leverage their deep understanding of the product delivery process in the factory. These alternatives were evaluated using the following criteria: response time, product availability, product variety, time to market, inventory, facility, handling, and information.
3.5.4. Design of the Ordering System
The main requirement for the ordering system is to link consumers with suppliers via the supply chain. In particular, the consumers place orders with the distributors, who bring the orders to the accountant. These orders are handed over to the manufacturer, who will produce goods that are in need and not just guess the required amount in the market. In other words, the intention is to design such an ordering system that will enable the factory to rely on the make-to-order production strategy. Therefore, starting from logging in, all order processes of the bakery distribution network and data relation flow charts among the Retailer, Accountant, Operator, and Distributor are designed.
4. Results and Discussion
4.1. Results
4.1.1. Determination of the Optimal Location
The relative weights are calculated using the AHP method. In the first step, a pairwise comparison matrix (Table 2) for X1–X8 is obtained and normalized (Table 3). These criteria weights are used in the TOPSIS method as input.
Table 2.
Pairwise comparison matrix.
Table 3.
Normalized pairwise comparison matrix and criteria weights.
According to the results of the AHP pairwise comparisons (Table 3), the most important criterion is fixed assets, which, with a priority weight of 36%, is more critical than the total weights of the last five criteria combined (transportation costs, equipment availability, qualified suppliers, staff quality, and proximity to market). The high weight of fixed assets is due to the manufacturing nature of the business, for which fixed assets often account for a substantial part of its total assets. Other important criteria are sales and operational costs (both with priority weights of 18%). It was inferred from this result that the fixed asset value of a facility should be the primary determinant of its location, followed by sales volume and operational costs. Therefore, these first three criteria dominate the evaluation decision.
Using the TOPSIS method, a decision matrix is first formed (Table 4), followed by a normalized decision matrix (Table 5). After criteria weights are multiplied, a weighted normalized decision matrix is built (Table 6). Based on the cost and benefit criteria types, positive and negative ideal solutions are determined (Table 7). Relative distances between alternatives and ideal solutions are calculated, and relative closeness coefficient ) values are obtained (Table 8). Then, Scenarios 1, 2, and 3 are ranked from best to worst. As a result, it was observed that the best alternative scenario is to keep two factories in Jeddah and Taif.
Table 4.
Decision matrix.
Table 5.
Normalized decision matrix.
Table 6.
Weighted normalized decision matrix.
Table 7.
Positive and negative ideal solution values.
Table 8.
Relative distances of alternatives and final results.
When using TOPSIS to evaluate the alternatives, applying these criteria weights, Scenario 1 achieves the highest rank, largely because of better values for fixed assets and operational costs. Scenario 3 shows the worst fit, especially in Si+, which indicates the deviation from the positive ideal solutions. Comparing Scenarios 1 and 2, Scenario 1 has a higher difference in Si− than Scenario 2, meaning it has a greater distance from the worst values. Scenario 1 is also superior in terms of proximity to the positive ideal solution. Therefore, keeping both factories in Jeddah and Taif was calculated as the best option. The key advantage of Scenario 1 is substantially lower fixed assets required as this scenario does not require a purpose-built warehouse. It also allows for lower operational costs, another important decision-making criterion. Even though sales under Scenario 1 fall short of those under Scenario 3, lower fixed assets and operation costs shift the balance in favor of Scenario 1.
Comparing the initial situation and the situation after applying the proposed framework indicates a positive impact on distances traveled, delivery time, and costs (Table 9). The proposed changes would help the firm to realize annual savings of USD 49,320 and 13,320 km of distribution distance traveled. In addition to the cost savings, the proposed changes result in lower CO2 emissions. If using modern delivery vehicles with an average emission of 147 g CO2/km [71], the total reduction is 1,958 kg of CO2 emissions per year. Furthermore, almost 9360 h of time spent in operations could be saved by utilizing the recommended approach prescribed in this article.
Table 9.
The effect of the proposed methodology on delivery time and costs.
Interestingly, this solution not only reduces the cost, it may also contribute to a reduction in the environmental footprint of the distribution operations of the bakery facility, thereby helping break the notorious trade-off between sustainability and profitability [72]. This effect is achieved as the AHP method allocated substantial weights to the criteria for which the desired change is positively correlated with the environmental impact. For example, a decrease in transportation costs results in lower CO2 emissions; similarly, greater proximity to the market leads to lower emissions. Hence, applying the AHP method before TOPSIS could be critical to ensure the sustainability of the optimal solution.
4.1.2. Selecting a Distribution Method
By comparing each alternative with appropriate criteria determined using the literature review, the optimum alternative among the six distribution methods was selected. After rating the six alternative delivery methods on a 6 (weakest) to 1 (strongest) scale and calculating the total value for each alternative (so that a lower total corresponds to a superior option), “Manufacturer storage with direct shipping” was determined to be the most appropriate method for this distribution network (Table 10). While relatively weak on the inventory costs criteria (6), this alternative has the highest value because of superiority on the “response time” (1), “product availability” (1), and “product variety” (1) criteria, in particular.
Table 10.
Evaluation of the distribution methods.
In other words, it can be argued that a concern of the direct shipment approach is that it may require maintaining storage facilities as the product cannot be stored at the distributor’s and retailer’s premises. However, the manufacturer can ensure a very high level of product availability as the product is made to order, unlike the strategies that require storage at third-party facilities. Furthermore, this approach dramatically reduced the response time by eliminating supply chain intermediaries. Overall, combining these factors makes the direct shipping approach the preferred option for the company.
4.1.3. Designing a Distribution Network
It was found that certain irregularities in the existing bakery distribution network were increasing costs unnecessarily. In particular, it was observed that different distributors were delivering to the same shops in the same area. For example, in Taif, three different distributors were serving the old zone 4, with two distributors serving both the old zone 4 and old zone 3. Similarly, in Jeddah, three different distributors were serving the old zone 1 and old zone 2. Duplicating efforts in this way not only creates superfluities, it also increases costs in terms of miles traveled and resources used, reduces the speed with which orders can be delivered to customers (with a concomitant impact on product quality), and causes operational conflicts. Thus, in order to compare different iterations of the distribution network, Taif and Jeddah were divided into six and three non-overlapping customer delivery zones, respectively (Figure 3 and Figure 4).
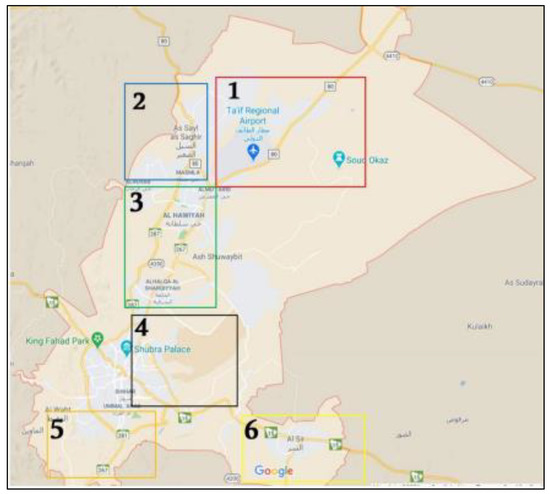
Figure 3.
Taif re-designed distribution network.
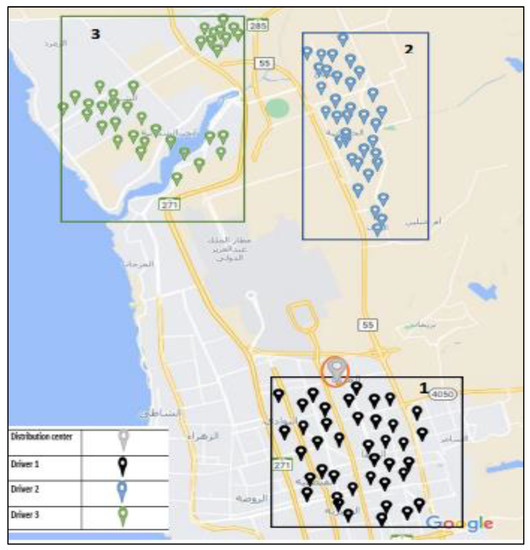
Figure 4.
Jeddah re-designed distribution network.
Table 11 shows the key factors in the distribution network pre-study, while Table 12 shows changes at the post-study design stage. A comparison demonstrates that there are significant differences and improvements in the network design and its associated costs before and after the methodology developed in this article is applied. Although the costs for individual distributors increased in the post-study network design, the overall cost of the distribution operations was reduced from USD 947 to USD 810 (i.e., by 14%), and the number of distributors required decreased from 12 to 9 vehicles. The cost saving was attributed to eliminating overlapping deliveries: the new optimal number of vehicles is one for every six areas in Taif and one for every three areas in Jeddah. The new distribution network design substantially improved the efficiency of delivery vehicles. In the pre-study distribution network, each vehicle served 30.8 customers on average, while this value increased to 41.1 customers in the post-study network, which signifies an improvement in vehicle efficiency by 33%. This might be due to the improved clustering of customers in the new delivery zones in the new distribution network compared to the original distribution network as also several delivery vehicles require less time to complete their daily distribution operations. It can be argued that the unused vehicles may be used at the distribution facility for other purposes or as a relief for the main seven delivery vehicles in case of additional operations or any cases of vehicle breakdown.
Table 11.
Pre-study distribution network design.
Table 12.
Post-study distribution network design.
The distance of the distribution network is reduced from 235 km to 198 km, representing a distance saving of almost 16% saving and a similar saving in CO2 emissions. Similarly, an 18% improvement could be achieved in the duration of the distribution time, to 62 h from 88. This saving results in more than a full-day extension to the product shelf life for consumers, which is a substantial improvement as the average shelf life for bread products is just 144 h [13]. According to Equation (7), this improvement in distribution time results in a increase in the product’s remaining shelf life. Furthermore, given that 70% of bread loss is due to not being used on time, this improvement may lead to a 22% reduction in food loss for the bread before it gets to the consumer level, as per Equation (8).
Similar to the case of the facility location problem in Section 4.1.2, the optimal solution for the distribution network both reduces the cost and improves the environmental sustainability outcome. Uniquely for perishable industries, it is needed to track not only the emission reduction due to a lower traveled distance but also a reduction in food loss and waste due to a lower traveled time. As a result of the application of the methodology developed in this article, the efficiency and sustainability of the distribution network were improved, and significant savings was observed in almost all factors of interest, including cost, distance, time, food loss and waste, emissions, and the number of distribution vehicles used.
4.1.4. Designing an Effective Ordering System
The first step in improving the ordering system was to gather data from existing users that would facilitate the understanding of their experiences of using the current system. After administering a comprehensive survey to managers, operators, and distributors, it was found that 72% of employees use smart devices often and have enough knowledge to follow technology, and 88% of them prefer electronic transactions rather than paper based ones. The training was also provided for those who required it. This information was used to design the new online ordering system. The web page interface was updated with a user-friendly design.
The relationships among all actors in designing the new ordering system are defined and illustrated in the flowcharts below (Figure 5 and Figure 6). These diagrams show how the ordering system becomes systematic, and all tasks are defined and regulated. Figure 5 illustrates the order and transaction relationships between the main actors in the bakery ordering and distribution network, and Figure 6 depicts the flow of data between nodes and entities in the system and how tasks are defined and regulated. Considering the ineffectiveness of the earlier manual, paper-based ordering system, the proposed new design substantially improves the efficiency of the ordering process.
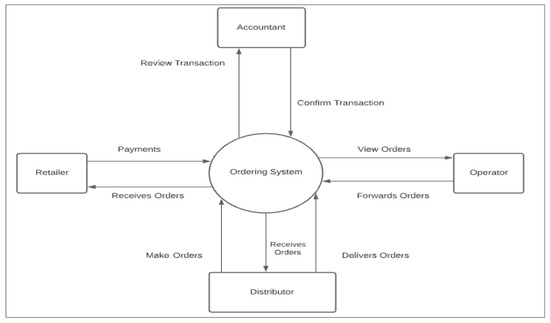
Figure 5.
Context diagram of ordering system.
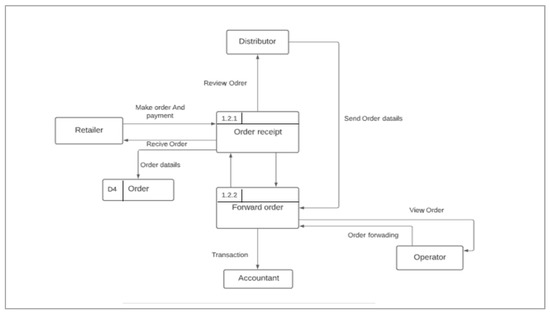
Figure 6.
Data flow diagram.
4.2. Discussion
The case study bakery facility selected for analysis in this paper was experiencing considerable challenges that threatened its operations’ efficacy and ability to deliver customer satisfaction. One of its production facilities had been closed, irregularities and inefficiencies were observed in distribution efforts, ordering was manual and inefficient, and costs were high. A multi-pronged approach was followed to address these issues, informed by gaps in the extant literature and drawing on both quantitative (manufacturing and logistics data) and qualitative (stakeholder insight) data sources. Using this information, six possible distribution networks were identified. Multi-criteria decision methods were integrated relying on AHP and TOPSIS to optimize the facility location and determine an appropriate distribution network, including the minimum number of delivery vehicles needed to meet customer demand. Finally, the analysis was supplemented by redesigning the firm’s ordering system that coordinated key functions and stakeholders (sales, production, accounting, and distribution), enhanced the use of technology, and improved responsiveness.
As a result, it was found that the fixed assets required would be the most important criteria for the bakery facility location optimization problem, followed by sales achieved and operational costs incurred. Based on the eight criteria identified, it would be optimal to operate two manufacturing facilities as opposed to a combination of a manufacturing and storage facility. The two-factory solution reduces required investments in fixed assets, as there is no need to build dedicated warehouses; moreover, it simplifies the distribution network and lowers transportation costs. Furthermore, it was established that a direct shipment strategy for the distribution network is optimal given the facility location decision made in the previous stage. Overall, the proposed changes helped reduce the number of distributors, costs, vehicle numbers, the distance of the distribution network, food loss, CO2 emissions, and time spent in operations. As a result of these changes, each vehicle was able to serve 33% more customers while spending less time on average. Additionally, the improved distribution operations contribute to reducing the operational costs for the vehicles and their drivers, e.g., lower total vehicle operating and maintenance costs and lower drivers’ salaries.
These results have clear practical implications for the case study firm and managers of bakery operations beyond this case. While the specific needs of every business are different, managers, particularly of manufacturing operations in the food industry, should be able to recognize how the seemingly challenging obstacles of high response time, high quality, and flexibility can be overcome through careful supply chain design. For instance, the case study firm in this paper did not recognize the inefficiencies of vehicle deliveries to be a key contributor to its low performance, but the proposed redesign has the capacity to help them reduce the number of vehicles used for delivery, deliver goods to users more quickly and efficiently while saving costs in terms of drivers, gas used, and other resources. Furthermore, these benefits have longer-term positive effects, such as enabling the business to meet its sustainability goals and freeing up cash for new product development.
In addition to smoothing logistics and realizing cost savings, the proposed structure also enhances the sharing of information among key actors in the distribution supply chain, in order to improve organizational efficiency. For instance, using the new ordering system, all stakeholders (distributors, operators, managers) would have access to tailored user interfaces that supply them with the information they need to support efficiency drives in their own departments. Thus, accountants and managers could view details of the quantities of raw materials required due to recent orders, which could be compared with daily demand to track changes in costs. Thus, while this study focused on optimizing the location facility decision, distribution network design, and ordering system, its benefits are likely to be felt more broadly across the organization.
In addition to the benefits for industry, the study makes three key contributions to the academic literature. First, the literature revealed only a few studies in distribution network design, employing both qualitative and quantitative sources of data. For example, Fenies et al. [73] proposed an optimization model, and Paz et al. [54] studied deterministic and stochastic models, which are all quantitative methods. There is a tendency for researchers to approach facility location problems using only quantitative multiple-criteria decision-making methods. By integrating both key actor insight, as well as real-life operational data, this study provides a more comprehensive, realistic, and pragmatic solution to the supply chain inefficiencies that challenge fresh food distributors.
Second, studies tend to focus on just one area of logistic inefficiency, devoting their attention to resolving one area of dysfunction while overlooking the possible impact on other areas of operations. For example, Paciarotti et al. [59] studied only distribution model efficiency, Pourjavad and Mayorga [74] only sought to optimize network design, while Arabsheybani and Arshadi Khasmeh [53] examined only the risks of supply chain network design. Razak et al. [75] focused on only the order confirmation and status notification components of an ordering system, while Jalali et al. [76], Duong and Bui [30], and Luis et al. [31] all proposed models only for addressing facility location problems. This approach fails to recognize the complexities inherent in bakery distribution and the fact that multiple logistics system components are interdependent. By addressing three key elements of the logistics challenge for bakery distributors, a more robust and comprehensive solution was developed to the unique supply chain challenges faced by these firms.
Third, this research proposes a clear way to measure and affect the environmental impact of logistics decisions in perishable goods industries. It captures both a reduction in greenhouse gas emissions achieved through shorter traveled distances and a reduction in food loss and waste achieved through lower traveled times. Using the terminology introduced by Parashar et al. [77] for the food wastage problem, this article identifies specific ‘means’ and ‘ends’ that can be adjusted in the bakery industry to improve the environmental footprint. The facility location, distribution network design, and ordering system was changed at the ‘means’ level, which leads to profound changes in inventory management, storage, and information sharing at the ‘ends’ level. As a result, such a comprehensive approach allows for a substantial reduction in the environmental footprint of the bakery operations.
Finally, this study, unlike the simulated models that dominate the literature, is grounded in real-life business operations and draws on both quantitative logistics data and qualitative insight from key stakeholders. There are nuances of the bakery distribution supply chain that differ from the chain for other food products, largely relating to the need for freshness and distribution speed to minimize food loss and waste. Furthermore, working on a real-life case study enabled the identification of contributing factors that might be overlooked in a simulated model, such as the training needs of workers, their familiarity with smart technologies, and the technical requirements of the ordering system. Identifying the relevance of such factors is key when making recommendations with cost, training, or other business implications. For instance, based on the observations made in this article, it was possible to suggest a GPS tracking system for distributors that might minimize fuel consumption and to advise managers on operators’ continuous training needs.
4.3. Limitations and Future Research
While this study has several advantages, it is not suggested that it is without limitations. These are weaknesses that future researchers should take into consideration when designing their case studies. First, there are factors that may affect logistics performance, such as packaging and distributing materials, that were not considered in this study. Future researchers might establish a mechanism to calculate the time needed by employees to finish their tasks in the production line, especially in packaging. Second, as with any study involving qualitative data sources, there are subject-specific factors that may impact the results. Decision makers’ subjective insights may have shaped criteria weights that determined the optimal distribution network design. Involving multiple stakeholders might help triangulate such insights and strengthen research findings. It would also be meaningful to incorporate sustainability factors directly as decision criteria in the TOPSIS and optimization models and track how the results change as the weights of these criteria increase. Alongside these lines, sensitivity analyses for other decision variables may also help improve the generalizability of insights to other geographical regions and other perishable industries.
Other quantitative methods could also be used for future studies, such as the ELECTRE method and some fuzzy MCDM methods that support decision making in uncertain environments. Future studies could consider adopting a fleet of electric vehicles for a similar distribution problem to explore the sustainability trade-off. On the one hand, electric vehicles could reduce greenhouse gas emissions, while on the other hand, they might increase the delivery time due to a shorter operating range, thereby contributing to higher levels of food loss and waste. Another research direction could be related to comparing the optimal solutions obtained for perishable and non-perishable goods industries to elicit the key optimal features for each type. Finally, the relevance and use of the proposed framework are likely impacted by external factors such as the COVID-19 pandemic, which added new priorities to hygiene in the distribution process and digital illiteracy, which would impact the ability of workers to use a new, digital ordering system. Future researchers should reflect on the relevance of these factors in reporting their results.
5. Conclusions
An efficient bakery supply chain entails a fast, safe, and productivity-enhancing distribution network system that connects a food manufacturer to retailers through an effective and responsive ordering system. The location and distribution network of a bakery factory plays a crucial role in its supply chain delivery operational performance and, therefore, the competitiveness of the firm. There are specificities of the bakery logistics function that have implications for the way in which the distribution network is designed, including the very short life of bakery products and the need for rapid response delivery times. All these aspects add to the complexity of designing a responsive and optimized distribution network. In this real-life case study, the AHP and TOPSIS MCDM methods were employed to determine decision-making criteria and evaluate alternatives for selecting an optimal facility location for a bakery in Saudi Arabia. An accompanying food distribution network was optimized and designed a supporting ordering system. With the addition of qualitative information from key stakeholders in the corporate supply chain and driven by insight from the extant literature, it was possible to propose a logistics design for the case study company that can deliver increased supply chain efficiency and improvements to customer satisfaction, while at the same time significantly lowering costs and realizing savings in time, vehicles, distances, and costs related to bakery delivery operations.
The key contribution of this article is the development of a novel four-stage research framework specifically designed to address logistics optimization for a bakery factory. First, the AHP method is used to identify the most important criteria for the bakery facility location problem and assign weights to these criteria. Second, the TOPSIS method is applied to select the optimal factory location based on the criteria weights assigned in the first stage. Third, an optimization model allows for selecting the optimal distribution network design, given the facility locations from the previous stage. Finally, the new facility location and distribution network design require redesigning the ordering system.
From the practitioners’ perspective, it was found that fixed assets are the most important criterion for the facility location decision of the bakery factory. Furthermore, it was established that it is optimal for the bakery to operate two factories in two locations rather than to combine a factory in one location and a warehouse in another location. Consequently, after solving an optimization model, it was revealed that a distribution network based on direct shipment from the factory to customers delivers the best results in terms of costs, customer satisfaction, food loss and waste, and greenhouse gas emissions. The final contribution was to improve the flow of information by redesigning the ordering system.
While a case study methodology was used, the study makes several contributions to the literature and has generalizable applicability. It demonstrates the value and importance of weaving together both quantitative and qualitative information when developing a supply chain or distribution optimization model, underscores the importance of taking an integrative, holistic approach to logistics decision-making that seeks to address multiple areas of dysfunction and suboptimal performance, and emphasizes the need for real-life data for modeling supply chain solutions. In this sense, the paper offers insights for future researchers in this space addressing similar issues across a wide range of industries and geographical contexts.
Funding
This research received no external funding.
Institutional Review Board Statement
The study was conducted in accordance with the Declaration of Helsinki, and the protocol was approved by the Ethics Committee in the Deanship of Scientific Research at the University of Jeddah in January 2021.
Informed Consent Statement
All subjects gave their informed consent for inclusion before they participated in the study, the details of which have been fully explained to them. No participant’s identifying information was collected in the study to preserve the privacy and confidentiality of the participants. Stringent measures have been taken by the researchers to ensure the privacy and security of the collected data.
Data Availability Statement
Data sharing is not applicable in this article due to confidentiality.
Conflicts of Interest
The author declares no conflict of interest.
References
- Al-Khateeb, S.A.; Hussain, A.; Lange, S.; Almutari, M.M.; Schneider, F. Battling Food Losses and Waste in Saudi Arabia: Mobilizing Regional Efforts and Blending Indigenous Knowledge to Address Global Food Security Challenges. Sustainability 2021, 13, 8402. [Google Scholar] [CrossRef]
- Validi, S.; Bhattacharya, A.; Byrne, P. A case analysis of a sustainable food supply chain distribution system—A multi-objective approach. Int. J. Prod. Econ. 2014, 152, 71–87. [Google Scholar] [CrossRef]
- Ekren, B.Y.; Kumar, V. An overview of reducing food loss and food waste in supply chains. In Agri-Food 4.0; Emerald Publishing Limited: Bingley, UK, 2022. [Google Scholar]
- Akkerman, R.; Farahani, P.; Grunow, M. Quality, safety and sustainability in food distribution: A review of quantitative operations management approaches and challenges. OR Spectr. 2010, 32, 863–904. [Google Scholar] [CrossRef]
- Chopra, S. Designing the distribution network in a supply chain. Transp. Res. Part E Logist. Transp. Rev. 2003, 39, 123–140. [Google Scholar] [CrossRef]
- Mangiaracina, R.; Song, G.; Perego, A. Distribution network design: A literature review and a research agenda. Int. J. Phys. Distrib. Logist. Manag. 2015, 45, 506–531. [Google Scholar] [CrossRef]
- Ridlehoover, J. Applying Monte Carlo simulation and risk analysis to the facility location problem. Eng. Econ. 2004, 49, 237–252. [Google Scholar] [CrossRef]
- Puška, A.; Kozarević, S.; Okičić, J. Investigating and analyzing the supply chain practices and performance in agro-food industry. Int. J. Manag. Sci. Eng. Manag. 2020, 15, 9–16. [Google Scholar] [CrossRef]
- Ishangulyyev, R.; Kim, S.; Lee, S.H. Understanding food loss and waste—Why are we losing and wasting food? Foods 2019, 8, 297. [Google Scholar] [CrossRef]
- Ghosh, R.; Eriksson, M. Food waste due to retail power in supply chains: Evidence from Sweden. Glob. Food Secur. 2019, 20, 1–8. [Google Scholar] [CrossRef]
- Aktas, E.; Sahin, H.; Huda, A.K.S.; Irani, Z.; Topaloglu, Z.; Sharif, A.M.; Kamrava, M.; Oledinma, A. A behavioral approach to food waste issue in Qatar. In Proceedings of the Qatar Foundation Annual Research Conference Proceedings, Doha, Qatar, 19–20 March 2018; Volume 2018, p. EEPD836. [Google Scholar]
- Akkaş, A.; Honhon, D. Shipment policies for products with fixed shelf lives: Impact on profits and waste. Manuf. Serv. Oper. Manag. 2022, 24, 1611–1629. [Google Scholar] [CrossRef]
- WRAP. Reducing Household Bakery Waste; WRAP: Banbury, UK, 2011; p. 151. [Google Scholar]
- Bacenetti, J.; Cavaliere, A.; Falcone, G.; Giovenzana, V.; Banterle, A.; Guidetti, R. Shelf life extension as solution for environmental impact mitigation: A case study for bakery products. Sci. Total Environ. 2018, 627, 997–1007. [Google Scholar] [CrossRef] [PubMed]
- Iqbal, M.W.; Ramzan, M.B.; Malik, A.I. Food Preservation within Multi-Echelon Supply Chain Considering Single Setup and Multi-Deliveries of Unequal Lot Size. Sustainability 2022, 14, 6782. [Google Scholar] [CrossRef]
- Melo, M.T.; Nickel, S.; Saldanha-Da-Gama, F. Facility location and supply chain management—A review. Eur. J. Oper. Res. 2009, 196, 401–412. [Google Scholar] [CrossRef]
- Arabani, A.B.; Farahani, R.Z. Facility location dynamics: An overview of classifications and applications. Comput. Ind. Eng. 2012, 62, 408–420. [Google Scholar] [CrossRef]
- Snyder, L.V. Facility location under uncertainty: A review. IIE Trans. 2006, 38, 547–564. [Google Scholar] [CrossRef]
- Farahani, R.Z.; SteadieSeifi, M.; Asgari, N. Multiple criteria facility location problems: A survey. Appl. Math. Model. 2010, 34, 1689–1709. [Google Scholar] [CrossRef]
- ReVelle, C.S.; Eiselt, H.A. Location analysis: A synthesis and survey. Eur. J. Oper. Res. 2005, 165, 1–19. [Google Scholar] [CrossRef]
- Agrebi, M.; Abed, M.; Omri, M.N. Urban distribution centers’ location selection’s problem: A survey. In Proceedings of the 2015 4th International Conference on Advanced Logistics and Transport (ICALT), Valenciennes, France, 20–22 May 2015; pp. 246–251. [Google Scholar]
- Miller, H.J. GIS and geometric representation in facility location problems. Int. J. Geogr. Inf. Syst. 1996, 10, 791–816. [Google Scholar] [CrossRef]
- Bozkaya, B.; Yanik, S.; Balcisoy, S. A GIS-based optimization framework for competitive multi-facility location-routing problem. Netw. Spat. Econ. 2010, 10, 297–320. [Google Scholar] [CrossRef]
- Tong, L.; Wang, Z.-T. Application of plant growth simulation algorithm on solving facility location problem. Syst. Eng. Theory Pract. 2008, 28, 107–115. [Google Scholar]
- Afshari, H.; Sharafi, M.; ElMekkawy, T.; Peng, Q. Optimizing multi-objective dynamic facility location decisions within green distribution network design. Procedia Cirp 2014, 17, 675–679. [Google Scholar] [CrossRef]
- Azadeh, A.; Roozbahani, M.N.; Moghaddam, M. Optimisation of complex and large-sized single-row facility layout problems with a unique hybrid meta-heuristic framework. Int. J. Oper. Res. 2013, 16, 38–67. [Google Scholar] [CrossRef]
- Mohamadi, A.; Ebrahimnejad, S.; Tavakkoli-Moghaddam, R. A novel two-stage approach for solving a bi-objective facility layout problem. Int. J. Oper. Res. 2018, 31, 49–87. [Google Scholar] [CrossRef]
- Khosravian Ghadikolaei, Y.; Shahanaghi, K. Multi-floor dynamic facility layout: A simulated annealing-based solution. Int. J. Oper. Res. 2013, 16, 375–389. [Google Scholar] [CrossRef]
- Omrani, H.; Ghiasi, F.G. Facility location decisions in supply chain design under uncertainty: A robust optimisation approach. Int. J. Oper. Res. 2017, 30, 391–406. [Google Scholar] [CrossRef]
- Duong, V.H.; Bui, N.H. A mixed-integer linear formulation for a capacitated facility location problem in supply chain network design. Int. J. Oper. Res. 2018, 33, 32–54. [Google Scholar] [CrossRef]
- Luis, M.; Irawan, C.A.; Imran, A. A two-stage method for the capacitated multi-facility location-allocation problem. Int. J. Oper. Res. 2019, 35, 366–377. [Google Scholar]
- Yan, L.; Grifoll, M.; Feng, H.; Zheng, P.; Zhou, C. Optimization of Urban Distribution Centres: A Multi-Stage Dynamic Location Approach. Sustainability 2022, 14, 4135. [Google Scholar] [CrossRef]
- Amin-Tahmasbi, H.; Sadafi, S.; Ekren, B.Y.; Kumar, V. A multi-objective integrated optimisation model for facility location and order allocation problem in a two-level supply chain network. Ann. Oper. Res. 2022, 1–30. [Google Scholar] [CrossRef]
- Lou, Z.; Jie, W.; Zhang, S. Multi-objective optimization for order assignment in food delivery industry with human factor considerations. Sustainability 2020, 12, 7955. [Google Scholar] [CrossRef]
- Athawale, V.M.; Chatterjee, P.; Chakraborty, S. Decision making for facility location selection using PROMETHEE II method. Int. J. Ind. Syst. Eng. 1 2012, 11, 16–30. [Google Scholar] [CrossRef]
- Shimi, A.; Ebrahimi Dishabi, M.R.; Abdollahi Azgomi, M. A Multi-Objective Decision-Based Solution for Facility Location-Allocation Problem Using Cuckoo Search And Genetic Algorithms. J. Adv. Comput. Res. 2020, 11, 121–143. [Google Scholar]
- Shahanaghi, K.; Yazdian, S.A. Facility location and distribution decisions in supply chains with fleet sizing considering both tangible and intangible criteria. Int. J. Manag. Sci. Eng. Manag. 2010, 5, 303–309. [Google Scholar] [CrossRef]
- Dey, B.; Bairagi, B.; Sarkar, B.; Sanyal, S.K. A hybrid fuzzy technique for the selection of warehouse location in a supply chain under a utopian environment. Int. J. Manag. Sci. Eng. Manag. 2013, 8, 250–261. [Google Scholar] [CrossRef]
- Tramarico, C.L.; Salomon, V.A.P.; Marins, F.A.S. Analytic hierarchy process and supply chain management: A bibliometric study. Procedia Comput. Sci. 2015, 55, 441–450. [Google Scholar] [CrossRef]
- Saaty, T.L. Decision making—The analytic hierarchy and network processes (AHP/ANP). J. Syst. Sci. Syst. Eng. 2004, 13, 1–35. [Google Scholar] [CrossRef]
- Hwang, C.-L.; Yoon, K. Methods for multiple attribute decision making. In Multiple Attribute Decision Making; Springer: Berlin/Heidelberg, Germany, 1981; pp. 58–191. [Google Scholar]
- Badri, M.A. Combining the analytic hierarchy process and goal programming for global facility location-allocation problem. Int. J. Prod. Econ. 1999, 62, 237–248. [Google Scholar] [CrossRef]
- Sule, D.R. Logistics of Facility Location and Allocation; CRC Press: Boca Raton, FL, USA, 2001. [Google Scholar]
- Opasanon, S.; Lertsanti, P. Impact analysis of logistics facility relocation using the analytic hierarchy process (AHP). Int. Trans. Oper. Res. 2013, 20, 325–339. [Google Scholar] [CrossRef]
- Weng, J.; Liu, D.; He, W.; Yang, B.; Huang, Y. Multi-objective optimization of distribution network operation mode based on AHP. Dianli Xitong Zidonghua (Autom. Electr. Power Syst.) 2012, 36, 56–61. [Google Scholar]
- Haial, A.; Berrado, A.; Benabbou, L. Redesigning a transportation network: The case of a pharmaceutical supply chain. Int. J. Logist. Syst. Manag. 2020, 35, 90–118. [Google Scholar] [CrossRef]
- Aravind, K. Evaluating Logistics Distribution Network Designs of FMCG Supply Chain. Int. J. Manag. (IJM) 2020, 11, 783–790. [Google Scholar]
- Sopadang, A.; Banomyong, R. Combining AHP and TOPSIS method for logistics hub selection. Int. J. Manag. Decis. Mak. 2016, 15, 134–153. [Google Scholar] [CrossRef]
- Ertuğrul, İ.; Karakaşoğlu, N. Comparison of fuzzy AHP and fuzzy TOPSIS methods for facility location selection. Int. J. Adv. Manuf. Technol. 2008, 39, 783–795. [Google Scholar] [CrossRef]
- Choudhary, D.; Shankar, R. An STEEP-fuzzy AHP-TOPSIS framework for evaluation and selection of thermal power plant location: A case study from India. Energy 2012, 42, 510–521. [Google Scholar] [CrossRef]
- Selim, H.; Ozkarahan, I. A supply chain distribution network design model: An interactive fuzzy goal programming-based solution approach. Int. J. Adv. Manuf. Technol. 2008, 36, 401–418. [Google Scholar] [CrossRef]
- Galkin, A.; Olkhova, M.; Iwan, S.; Kijewska, K.; Ostashevskyi, S.; Lobashov, O. Planning the rational freight vehicle fleet utilization considering the season temperature factor. Sustainability 2021, 13, 3782. [Google Scholar] [CrossRef]
- Arabsheybani, A.; Arshadi Khasmeh, A. Robust and resilient supply chain network design considering risks in food industry: Flavour industry in Iran. Int. J. Manag. Sci. Eng. Manag. 2021, 16, 197–208. [Google Scholar] [CrossRef]
- Paz, J.; Orozco, J.; Salinas, J.; Buriticá, N.; Escobar, J. Redesign of a supply network by considering stochastic demand. Int. J. Ind. Eng. Comput. 2015, 6, 521–528. [Google Scholar] [CrossRef]
- Yadav, V.S.; Singh, A.; Raut, R.D.; Cheikhrouhou, N. Design of multi-objective sustainable food distribution network in the Indian context with multiple delivery channels. Comput. Ind. Eng. 2021, 160, 107549. [Google Scholar] [CrossRef]
- Lin, D.; Zhang, Z.; Wang, J.; Yang, L.; Shi, Y.; Soar, J. Optimizing urban distribution routes for perishable foods considering carbon emission reduction. Sustainability 2019, 11, 4387. [Google Scholar] [CrossRef]
- Chen, J.; Gui, P.; Ding, T.; Na, S.; Zhou, Y. Optimization of transportation routing problem for fresh food by improved ant colony algorithm based on tabu search. Sustainability 2019, 11, 6584. [Google Scholar] [CrossRef]
- Meneghetti, A.; Pagnin, C.; Simeoni, P. Decarbonizing the cold chain: Long-haul refrigerated deliveries with on-board photovoltaic energy integration. Sustainability 2021, 13, 8506. [Google Scholar] [CrossRef]
- Paciarotti, C.; Bevilacqua, M.; Ciarapica, F.E.; Mazzuto, G.; Postacchini, L. An efficiency analysis of food distribution system through data envelopment analysis. Int. J. Oper. Res. 2019, 36, 538–554. [Google Scholar] [CrossRef]
- Durán Peña, J.A.; Ortiz Bas, Á.; Reyes Maldonado, N.M. Impact of bullwhip effect in quality and waste in perishable supply chain. Processes 2021, 9, 1232. [Google Scholar] [CrossRef]
- Gaggero, M.; Tonelli, F. A two-step optimization model for the distribution of perishable products. Networks 2021, 78, 69–87. [Google Scholar] [CrossRef]
- Rijpkema, W.A.; Rossi, R.; van der Vorst, J.G. Effective sourcing strategies for perishable product supply chains. Int. J. Phys. Distrib. Logist. Manag. 2014, 44, 494–510. [Google Scholar] [CrossRef]
- Gu, J.; Goetschalckx, M.; McGinnis, L.F. Research on warehouse design and performance evaluation: A comprehensive review. Eur. J. Oper. Res. 2010, 203, 539–549. [Google Scholar] [CrossRef]
- Alias, A.A. Web-based Online Bakery Ordering System with QR Code. Bachelor’s Thesis, Universiti Teknologi Mara Perlis, Arau, Malaysia, 2021. [Google Scholar]
- Lee, C.K.; Lv, Y.; Ng, K.; Ho, W.; Choy, K.L. Design and application of Internet of things-based warehouse management system for smart logistics. Int. J. Prod. Res. 2018, 56, 2753–2768. [Google Scholar] [CrossRef]
- Mahalik, N.P.; Nambiar, A.N. Trends in food packaging and manufacturing systems and technology. Trends Food Sci. Technol. 2010, 21, 117–128. [Google Scholar] [CrossRef]
- Grosse, E.H.; Glock, C.H.; Jaber, M.Y.; Neumann, W.P. Incorporating human factors in order picking planning models: Framework and research opportunities. Int. J. Prod. Res. 2015, 53, 695–717. [Google Scholar] [CrossRef]
- Zhang, Q.; Vonderembse, M.A.; Lim, J.-S. Manufacturing flexibility: Defining and analyzing relationships among competence, capability, and customer satisfaction. J. Oper. Manag. 2003, 21, 173–191. [Google Scholar] [CrossRef]
- Innis, D.E.; La Londe, B.J. Customer service: The key to customer satisfaction, customer loyalty, and market share. J. Bus. Logist. 1994, 15, 1. [Google Scholar]
- Ganglbauer, E.; Fitzpatrick, G.; Molzer, G. Creating visibility: Understanding the design space for food waste. In Proceedings of the Proceedings of the 11th International Conference on Mobile and Ubiquitous Multimedia, Ulm, Germany, 4–6 December 2012; pp. 1–10. [Google Scholar]
- Browne, M.; Rizet, C.; Allen, J. A comparative assessment of the light goods vehicle fleet and the scope to reduce its CO2 emissions in the UK and France. Procedia-Soc. Behav. Sci. 2014, 125, 334–344. [Google Scholar] [CrossRef]
- Figge, F.; Hahn, T. Is green and profitable sustainable? Assessing the trade-off between economic and environmental aspects. Int. J. Prod. Econ. 2012, 140, 92–102. [Google Scholar] [CrossRef]
- Fenies, P.; Lagrange, S.; Tchernev, N. A decisional modelling for supply chain management in franchised networks: Application in franchise bakery networks. Prod. Plan. Control 2010, 21, 595–608. [Google Scholar] [CrossRef]
- Pourjavad, E.; Mayorga, R.V. An optimization model for network design of a closed-loop supply chain: A study for a glass manufacturing industry. Int. J. Manag. Sci. Eng. Manag. 2019, 14, 169–179. [Google Scholar] [CrossRef]
- Razak, N.F.A.; Mustaffa, N.H.; Radzi, N.H.M.; Sallehuddin, R.; Bazin, E.N. Web based online bakery system with short messaging service and email notification. In Proceedings of the 2017 6th ICT International Student Project Conference (ICT-ISPC), Johor, Malaysia, 23–24 May 2017; pp. 1–4. [Google Scholar]
- Jalali, S.; Pasandideh, S.H.R.; Chambari, A. A joint inventory reliable capacitated facility location problem using a continuum approximation. Int. J. Manag. Sci. Eng. Manag. 2017, 12, 104–110. [Google Scholar] [CrossRef]
- Parashar, S.; Sood, G.; Agrawal, N. Modelling the enablers of food supply chain for reduction in carbon footprint. J. Clean. Prod. 2020, 275, 122932. [Google Scholar] [CrossRef]


Disclaimer/Publisher’s Note: The statements, opinions and data contained in all publications are solely those of the individual author(s) and contributor(s) and not of MDPI and/or the editor(s). MDPI and/or the editor(s) disclaim responsibility for any injury to people or property resulting from any ideas, methods, instructions or products referred to in the content. |
© 2023 by the author. Licensee MDPI, Basel, Switzerland. This article is an open access article distributed under the terms and conditions of the Creative Commons Attribution (CC BY) license (https://creativecommons.org/licenses/by/4.0/).