Article

Climate Change Impacts Quantification on the Domestic Side of Electrical Grid and Respective Mitigation Strategy across Medium Horizon 2030

1
U.S.-Pakistan Center for Advanced Studies in Energy (USPCAS-E), National University of Sciences and Technology (NUST), H-12 Campus, Islamabad 44000, Pakistan
2
Department of Electrical Engineering, College of Engineering, Majmaah University, Al-Majmaah 11952, Saudi Arabia
3
Engineering and Applied Science Research Center, Majmaah University, Al-Majmaah 11952, Saudi Arabia
4
Department of Electrical Engineering, Mirpur University of Science and Technology, Mirpur AJK 10250, Pakistan
5
Department of Electrical Engineering, College of Engineering, University of Ha’il, Ha’il 55476, Saudi Arabia
6
Department of Educational Sciences and Design, College of Education, Majmaah University, Al-Majmaah 11952, Saudi Arabia
*
Authors to whom correspondence should be addressed.
Sustainability 2023, 15(4), 3674; https://doi.org/10.3390/su15043674
Submission received: 30 December 2022 / Revised: 30 January 2023 / Accepted: 10 February 2023 / Published: 16 February 2023
(This article belongs to the Section Energy Sustainability)

Abstract

:
Electrical grids are one of the major sources of emissions of greenhouse gases (GHG), which are harmful to the environment because they contribute to global warming. As the geographical, environmental, political, and policy constraints are different, policies and research frameworks from developed countries cannot be used directly in developing countries. This paper suggests a completely integrated quantification approach (IQA) and sub-methodologies, such as SM1, SM2, and SM3, that consider the limitations, evaluates the effects, and suggest a way to deal with climate change problems on the power grid. From the perspective of renewable energy (RE) integration and GHG emissions (mainly CO2), the proposed approach addresses the limitations in the policy framework extending to 2030. In addition, the effects of the changes in the ambient temperature, from 0.5 °C to 2 °C, have been examined for thermal power generation and transformers. Lastly, the proposed method considers how energy-efficient devices (EEDs) affect the residential load sector. The results show that households used 10.7% less energy and their costs decreased significantly. This work’s quantitative approach gives a specific way to reduce the carbon footprint of the electrical grid.

1. Introduction

Global greenhouse gas (GHG) emissions from various sources result in global warming. The rise in the global temperature and other strange weather patterns upset the life balance on land and water. To keep the temperature rising below two degrees Celsius, researchers are working on methods to reduce CO2 emissions. According to the fourth assessment report of the United Nations Intergovernmental Panel on Climate Change, CO2 equivalents in the atmosphere should be kept between the range of 445–490 parts per million (ppm) if the temperature increase is between 2 °C and 2.4 °C, respectively [1,2]. Electricity generation has a 3–35% share of the total GHG emissions. This is due to the high percentage of fossil fuel-based power generation, which needs to be replaced by more sustainable energy resources and efficient options [2,3].
Pakistan is one of the countries at risk of climate change-based environmental impacts. In addition to the global GHG emission impacts, most of the power in the energy mix of the country comes from the thermal contingent, which further worsens the overall environmental conditions [4]. In this case, the government of Pakistan (GOP) has taken several steps to restructure the energy sector. Pakistan has had a severe electricity crisis for more than a decade. The main causes of this are a considerable increase in electricity demand, fossil fuel-centric energy generation, and poor economic conditions [5]. Thus, policymakers must review the current strategies to minimize the supply-demand gap and develop future strategies while incorporating environmental impact factors to reduce emissions by as much as 20% by 2030 [6].

1.1. Global Energy Trends

Developed countries have introduced policies and guidelines to reduce harmful GHG emissions, increase renewable energy (RE) penetration, and decrease the load demand and associated targets related to GHG emissions [7,8,9,10]. The use of renewable energy sources in future developments is a vital part of the energy systems of the future. In addition, sustainable development goals (SDG) number 7 (clean and affordable energy to all) and number 13 (improve climate change with immediate action) can help countries develop clean power. Moreover, insufficient resources, rising oil prices, rising energy demand, uncertain supplies, and economic growth have made the world aware that fossil fuels cannot guarantee supplies and the sustainability of future generations [11].
The Grid-Wise Program, GRID 2030, NIST IOP Framework Roadmap 1.0, and Microsoft SERA are among the core frameworks of the US. These frameworks help make rules that consider using more renewable energy, protecting the environment (by reducing greenhouse gas emissions from 26% to 28% by 2030), and lowering the cost of electricity. The core focus of all the above initiatives is aimed primarily at smart infrastructure, consumer engagement, and demand-side management (DSM). The European Union (EU) came up with the Vision 2020 plan to cut greenhouse gas (GHG) emissions by 20% through increasing the use of renewable energy (RE) and making energy use more efficient. In addition, the European energy policy framework wants to cut emissions by 40% by 2030 compared to their 1990 levels. Furthermore, the aim is to increase the RE share by at least 27% by 2030 through integrating energy-efficient devices (EEDs) [12,13,14,15].
Japan has set an ambition of a 26% reduction in GHG by 2030 compared to that of 2005 through the “2010 strategic energy plan” and smart grid (SG) policy under the ministry of economy, trade, and industry (METI) frameworks. Furthermore, they also plan to increase the RE penetration levels by 70% [16,17]. South Korea proposed a GHG reduction of 37% and a 10% increase in RE integration through Vision 2012–2022 and smart grid road map frameworks until 2030 [18,19]. Canada’s national smart grid technology and standards task force aim at GHG emission reductions, RE integration, and power quality of the electrical grid [20]. Similarly, the Smart Grid Corporation of China has formulated targets through the 12th five-year plan by the Ministry of Science and Technology for increasing environmental protection schemes, 15% RE integration, SG technology/infrastructure improvement, and increasing efficiency of electrical grid [21,22].
The authors in [23] provide an overview of the Gulf Cooperation Council’s (GCC) potential for adopting renewable energy technologies and propose new policies for implementing clean energy. The study in [24] intends to evaluate the structure of Korea’s previous and present renewable energy policies and the implementation of major drivers. Additionally, the authors proposed the latest policies to achieve the maximum integration of clean energy by 3020; [25] deploys Granger causality methodology to investigate the trends in energy consumption, policies, and the development of renewable energies, and the causal link between economic growth and renewable and non-renewable energy sources for Iran. The researchers in [26] use the unrelated regression (SUR) method to estimate the parameters to maximize the potential for substituting renewable and non-renewable energy sources. [27] investigates the link between sustainable development and renewable energy sources in EU nations and proposes different policies for the proposed group of countries to achieve the 2030 Agenda for Sustainable Development presented by the EU. The researchers in [28] provide an overview of the implementation and capacity calculation of green hydrogen energy as a substitute for non-renewable energy sources in Pakistan by adopting data envelopment analysis (DEA) and the Fuzzy Analytic Hierarchy Process (AHP). Similarly, the authors in [29] provide an overview of the challenges and development of India’s energy sector and compare different methods of output to pave the way for developing energy policies.

1.2. Analysis of Quantification-Based Frameworks

RE integration into the electrical grid is considered one of the most effective solutions for GHG emission reduction. Many countries have made it a core aspect of their planned energy frameworks. The quantification study for a region or area can offer a base case for the performance improvement of a system and further advancements in policy and research frameworks. Using a lifecycle model [30], it talks about the emissions caused by the US’ electricity supply and demand. The benefits from international grid interconnections among countries in the ASEAN region have been investigated in [31], while the electricity dispatch model to quantify the GHG emissions in California, US, has been utilized in [32]. A considerable number of quantification-based studies have been carried out on small islands. This includes (LCCA) as an essential postulate part via the scalability of assets. Graciosa Island, Azores [33], Greek Islands [34,35], French Islands [36], Corvo Island-Azores [37], and Wangan Island, Taiwan [38], have all had studies conducted on the effects of making electricity on the environment and policy solutions for the islands using Promethee II) and HOMER. Using different econometric methods, [39,40,41,42] present several studies on sustainable energy strategies and the control of GHG emissions in China.

1.3. Renewable Energy Policy Frameworks and Limitations in Pakistan

As a developing country, Pakistan needs to be accustomed to quantification. At the constitutional level, different actions are being taken to improve the power sector through the proper planning of developing resources and using energy. Table 1 compares a review of the various power-related policies in Pakistan from the perspective of the core focus: environmental issue limitations and RE generation [43]. The authors in [44] presented the energy generation capability of the Baluchistan province of Pakistan. They deployed Long-range Energy Alternative Planning as an energy demand modeling tool to forecast and plan accordingly between 2018–2030. Pakistan’s energy consumption production prediction clearly shows the country’s reliance on imported fossil fuels, which is a worrying development for the country’s economy [45]. The researchers in [46] proposed different energy-based scenarios for Pakistan to obtain the best economic, environmental, and energy conservation solutions. Additionally, the authors highlighted the internal flaws of the power infrastructure and policies, which leads to poor energy management.
The National Energy Security Plan (NESP) was introduced in 2005 as part of Pakistan’s energy policy. Its objectives were to provide Pakistan with a vision for energy production, to diversify its energy mix, and to increase its capacity for energy storage. Vision 2025, announced in 2014, called for the total power generated from all sources to go up to 45,000 MW. It also called for the public sector to have access to electricity from 67% in 2018 to 90% in 2025, with the share of all indigenous resources increased by 50%. The National Transmission and Dispatch Company developed the National Power System Expansion Plan (NPSEP) to fix and grow the national power grid. The core purpose was to identify new power production facilities and reinforce the transmission and distribution (T and D) grid for future demand. Later, the Pakistan Integrated Energy Model (Pak IEM) was developed to figure out how much energy the country would need to produce and use in all areas for the years to come.
Among the various policies and their respective limitations, as suggested in Table 1, it is prominent that only three of the most recent policies; namely, NESP, Vision 2025, and NPSEP:
  • partially address the environmental concerns from the perspective of RE.
  • have not thought about how climate change will affect the environment because of the electric grid.
  • do not have any studies based on quantitative analysis that show the actual environmental effects of climate change on the power grid and how to fix them.
  • do not specify how a rise in the ambient temperature will affect the grid system.
  • do not use load as an asset, such as putting EEDs in place to improve the load profile with DSM.
The limitations mentioned above serve as the motivation for this study. Furthermore, the ambient temperature impacts power equipment, and the utilization of EEDs for load control as suitable options have been addressed to combat these climatic/environmental impacts by 2030.

2. Methodology

The proposed methodology works as an integrated quantification approach (IQA). Figure 1 illustrates that the IQA encapsulates various contingents to bridge the aspects and limitations. IQA integrates three sub-methodologies, whose core objectives are:
  • The evaluation of data in a real-time regime based on the extrapolation of historical data for future GHG reduction and RE deployment trends for various policies (in comparative analysis).
  • Thermal modeling analysis (TMA) is considered for transformers and thermal power plants concerning 0.5, 1.0, and 2.0 °C increases in ambient temperatures.
  • The incorporation of EEDs through Demand Side Management is conducted for Domestic load profile improvement while considering the plug and play (PnP) algorithm as a sub-methodology.
  • A curtailment in emissions through the comparison of different cases using the proposed policy with the global trends for developed and developing countries.
  • A complete planning algorithm for all three targets to be achieved simultaneously is explained as the impact of policies, analysis of each case, and impact on consumption until 2030 integrated with EED. as shown in Figure 1.
Figure 1 comprises the three targets and techniques required to meet the goals regarding policy data projection, thermal modeling analysis, and PnP-based demand-side management analysis. Overall, data analysis is considered in all three cases. Amendments in these cases are conducted until we obtain the optimal quantification data, as shown in Figure 1.

2.1. Iinitial Quantification and Analysis via Historical Data

The engagement with the historical data through initial quantification offers a base case for future scenarios. The retrospective study using historical information is given in the “Energy Source Book of Pakistan” for 2017 [16]. The book comprises the base data for between 2011 and 2017 for the annual growth in the generation sector, load demand, and the country’s associated GHG emissions.
From the perspective of Pakistan’s present electricity generation profile, as mentioned in Table 2, the share of RE sources in the national power energy mix was nonexistent before 2014–2015. This trend has steadily increased with each passing year, as suggested in Table 2. Most of the efforts in electricity production have been directed toward indigenous thermal resources in recent years. This claim is complimented by Table 3, which indicates the source-wise gross generation share, where the thermal contingent contributes to the maximum energy need in respective units (GWh). Table 4 illustrates the different emissions of gases in kilo-tons per year between 2005 and 2015. CO2 contributed to the highest GHG emissions (~97%). This trend rises drastically every five years.
It is essential to notice that the domestic sector consumes the largest portion of electricity production (46.31% to 51% from 2012 to 2017), with an annual compound growth rate (ACGR) of 6.5%, as is evident in Table 5. Moreover, the T and D losses in the grid are at an alarming figure of approximately 20% of the gross consumption. This study considers the ACGR across five years for the future projections of the respective quantities, each year, until 2030.
Thermal contingency cannot be replaced with RE sources for GHG (mainly CO2) reduction, primarily due to the intermittency issues associated with RE sources. However, it can be reduced to a minimum level, which will be analyzed and quantified by this study. In addition, the domestic sector is usually considered to be a load, but by adding EEDs through DSM, it can be used as an asset. In the initial quantification, the three essential aspects are:
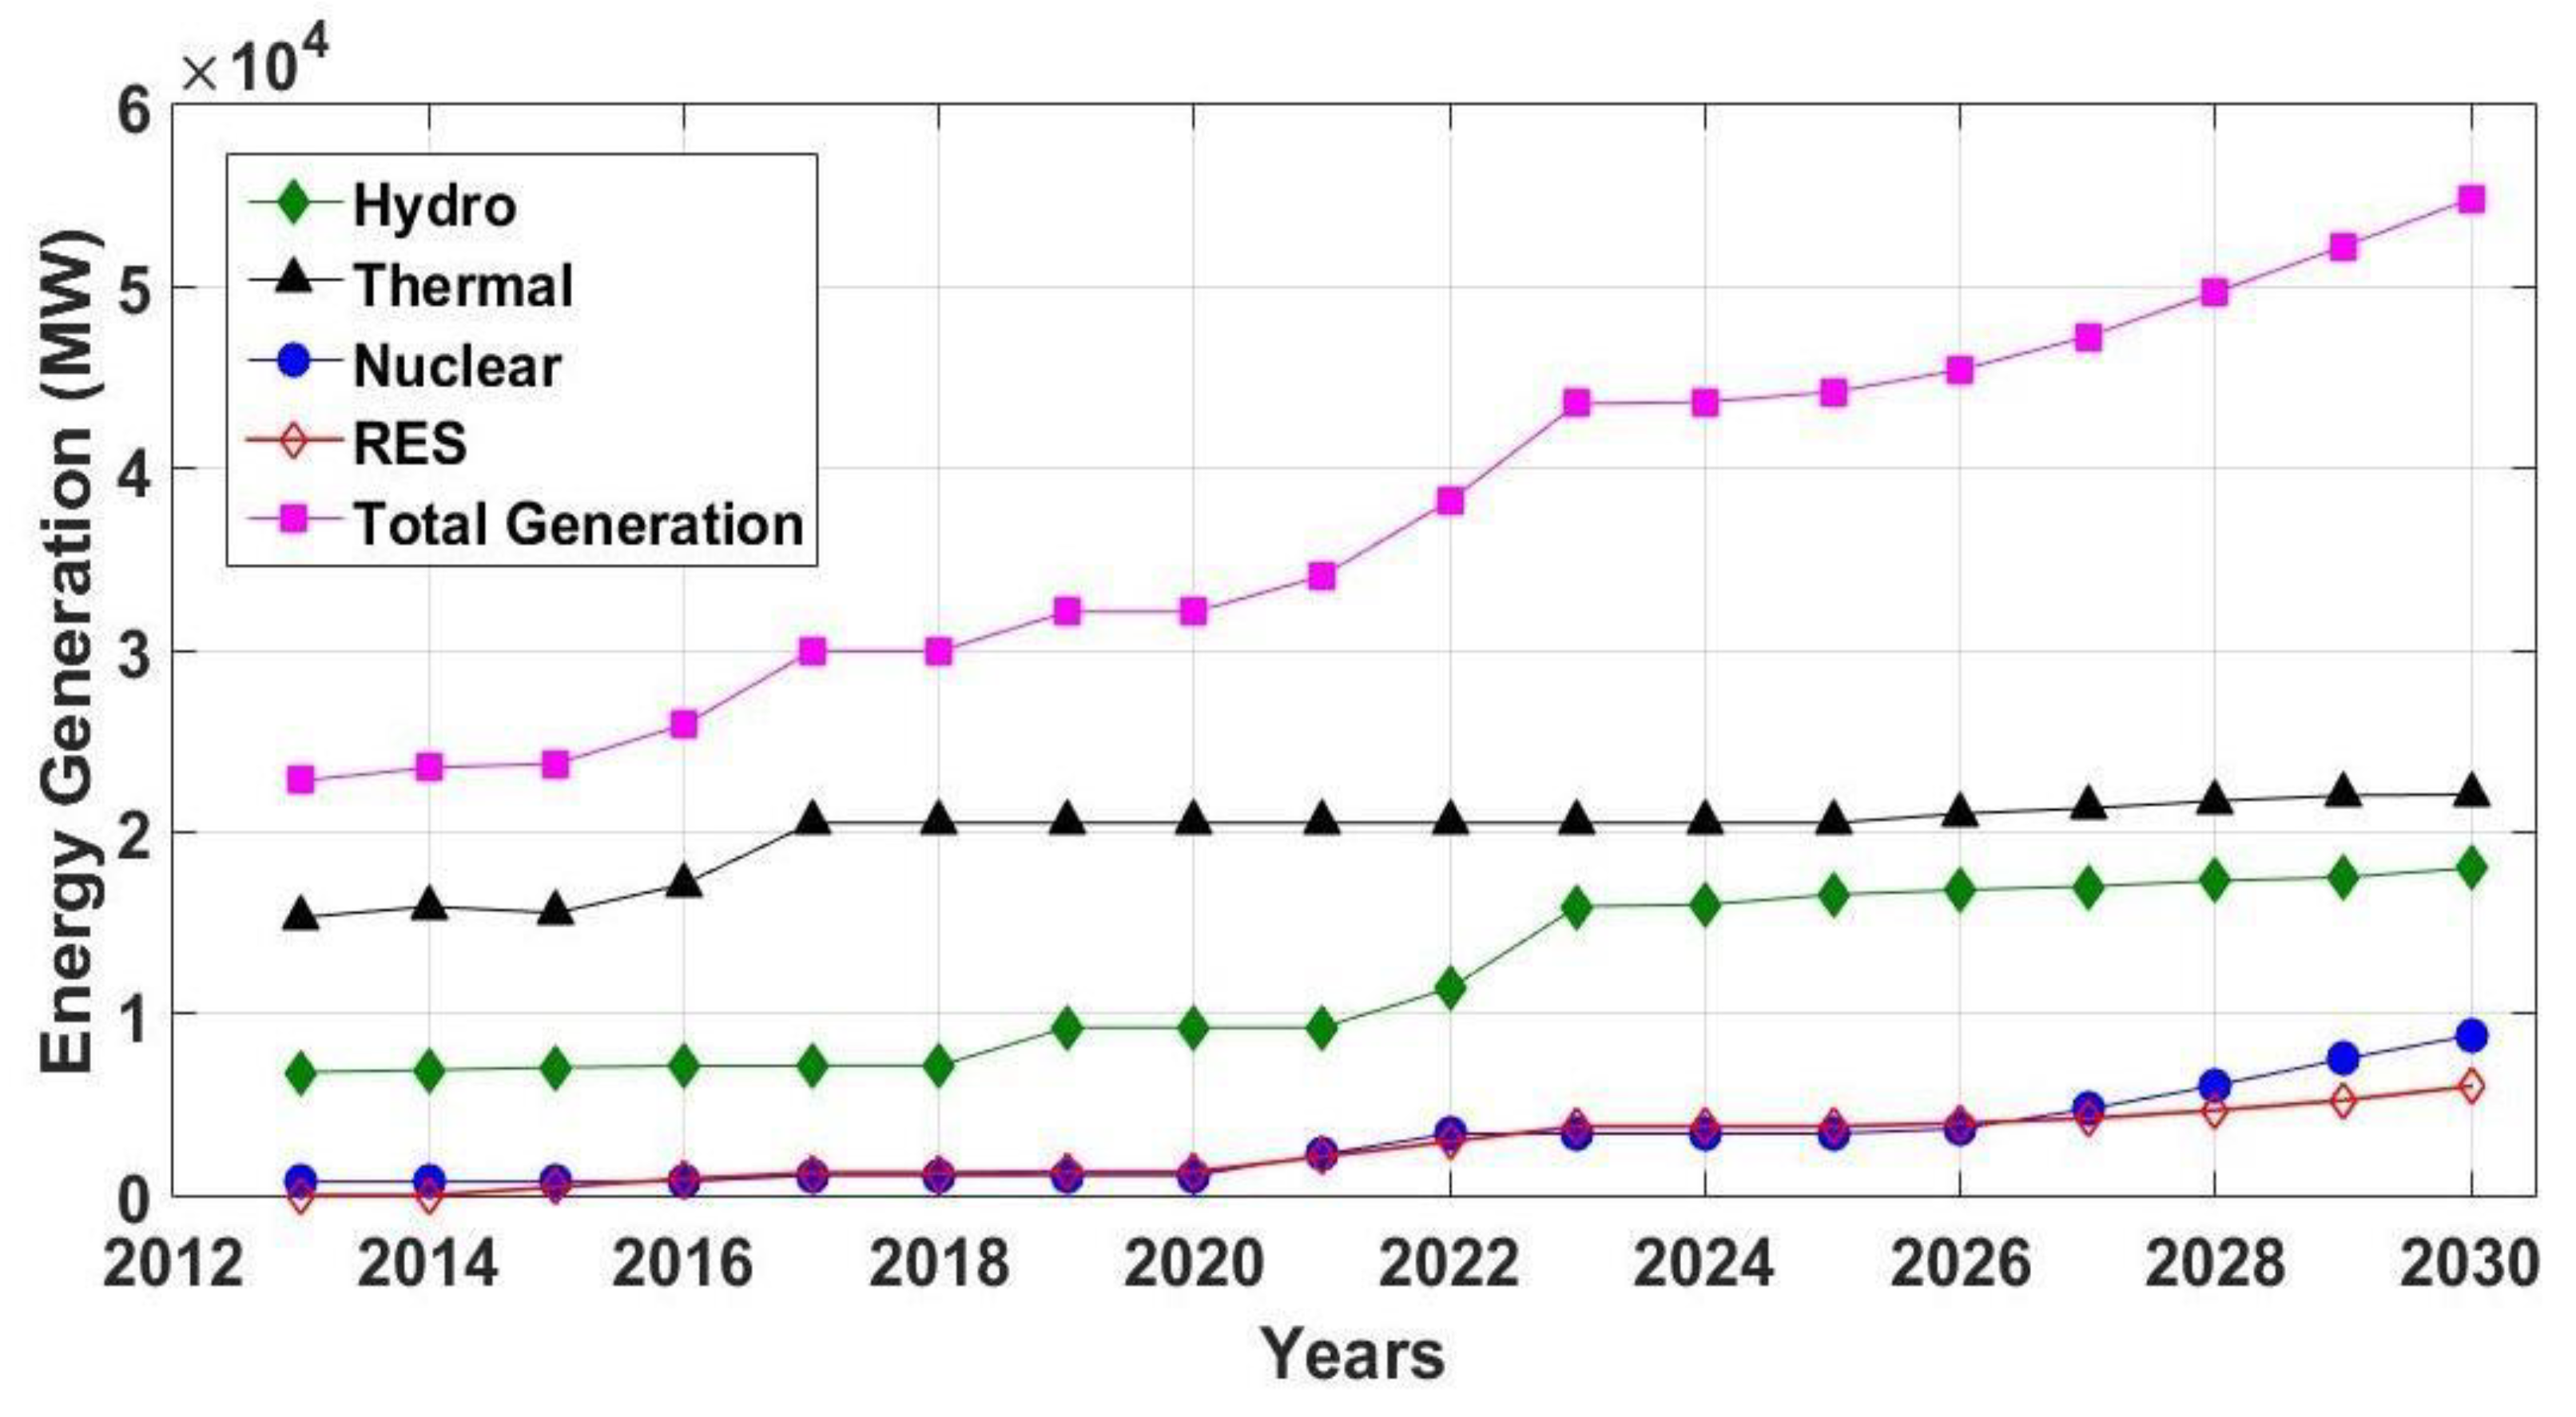
  • Thermal power generation shares the highest portion of the energy mix (~67%).
  • CO2 encapsulates the highest share among GHGs (~97% of the emissions).
  • The domestic/residential sector is the most significant contributor (~50%) of the load consumption.
Considering the aspects mentioned above for the quantification of potential postulates for cost-effective solutions, a legitimate prospect for the proposed methodology is depicted in the next section.

2.2. Description of Sub-Methodologies

2.2.1. Sub-Methodology 1 (SM1)

In this sub-methodology, three of the most relevant policies, i.e., NESP, Vision 2025, and NPSEP, have been considered (refer to Table 1) as they have partially addressed the environmental issues while focusing on increasing RE penetration. The time series-based extrapolation is considered for the quantification-based analysis of the above impacts across the planning horizons for 2025 and 2030.
The projections across these horizons will show how all of the related policies will look. This is our study’s first goal. Once a policy meets its goal, the loop of the sub-methodology starts over for the other policies in the same planning horizon. This continues until it follows all the critical points of the policies. After all the policies have been looked at, the comprehensive data that has been analyzed is saved. This makes it possible to compare the mix of energy sources, demand, and greenhouse gas (GHG) emissions between different future projections that use both planned and existing sources. A time-series-based extrapolation has been conducted to determine how to obtain more power from all of the sources based on the policies listed above. This is shown in Equation (1).
G T = 1 n G n + g n
where G n denotes the existing generation in Pakistan, g n denotes the planned generation in Pakistan, and G T shows the total generation in Pakistan across the planned horizon of each policy. Similarly, the total CO2 emissions are calculated using each resource’s emissions, as shown in Equation (2).
E T = 1 n r n G n
where E T shows the total emissions by the power sector according to the plan, r n shows the emissions from the generation source   G n .
The evaluation of the grid losses has been obtained through the Pakistan Energy Yearbook, and to project the losses in the coming years, Equation (3) can be utilized, where n is the number of years in AGCR, and k is the limit until the year 2030.
P l o s s T = n = 5 k = n + 1   e n d   v a l u e s t a r t   v a l u e 1 n 1 × P l o s s 8760  

2.2.2. Sub-Methodology 2 (SM2)

The Paris climate change agreement stipulates that the global temperature change must be kept below two degrees Celsius above pre-industrial levels [47]. In this part of the method, thermal modeling analysis (TMA) is used to figure out how climate change will affect the main parts of the power grid, such as the transformers and thermal power plants [45,46]. As mentioned above, approximately 67% of Pakistan’s energy mix comes from thermal power generation, but transformers are also a core part of the energy mix in different ways. In the proposed study, the second goal is to determine how the Paris agreement will affect the overall temperature and how electricity is made. An increase in the temperature decreases the efficiency of the transformers. The ambient temperature is directly affected by the change in climate [48]. The difference in the oil temperature due to the ambient temperature is shown in Equation (4).
D θ o i l = D t R o i l C o i l I p u 2 β β + 1 Δ θ o i l R 1 n θ o i l θ a m b 1 n
where θ o i l is the temperature of oil, θ a m b is the ambient temperature, D is the difference operator; Δ θ o i l R is the rated load, the rated ambient value of θ o i l θ a m b ; R o i l is the thermal resistance of the oil under rated conditions. In addition, C o i l is the thermal capacitance of the oil, I p u is the rated load, β is the ratio of heat generated by copper losses and heat generated by iron losses, whilst n is the nonlinearity exponent. The increase in the temperature also harms the thermal plant efficiency. If the ambient temperature increases, the density of the air is reduced. This causes a decrease in the air mass flow entering the turbine compressor, thus reducing the pressure ratio of the overall system cycle. A reduction in the turbine pressure ratio results in an increased exhaust gas temperature. The exhaust temperature rise can be estimated through Equations (5) and (6) and is given in [49]:
T o = T i P i / P o x
x = η t γ 1 γ
where T o is the outlet turbine temperature, T i the inlet turbine temperature, P o is the outlet turbine pressure, P i the inlet turbine temperature, η t is the turbine efficiency, γ is the specific heat ratio of the combustion gases and x is the turbine exponent. Equations (5) and (6) have been implemented to find the projections of the ambient temperature change in the thermal power plants and transformers across the year 2030 [50]. When all of the cases have been evaluated, the analyzed data are stored. These data present the base case for quantification regarding the impact of the temperature change on electrical power in the core, as mentioned above regarding the grid components.

2.2.3. Sub-Methodology 3 (SM3)

In this sub-methodology, the integration of RE resources and the impact of efficient devices on the domestic sector is quantified as the domestic industry consumes a significant portion of the electricity demand. From the point of view of the DSM, the integrated plug-and-play (PnP) algorithm-based methodology is used to compare the impact across the planning horizons with the base case scenario. It has been set as target 3 in our study. Vision 2025 has briefly mentioned energy efficiency for the ease of managing consumption. In this part of the proposed method, the per-home consumption has been looked at in the domestic load analysis. This method will help reduce the load and keep the transmission line from being overloaded, making for a more efficient system. If all the homes in the country were considered, the total energy consumption after EED through DSM deployment would be significantly lowered. Equation (7) shows the case of a single home.
E s = 1 n E o n E e n
where E s is the energy saved by using energy-efficient devices, E o shows the energy used by a device, E e shows the energy consumed by an energy-efficient version of that device and the numbers 1 to ‘n’ denote the various EEDs. The overall analyzed data are stored when all of the cases across the respective horizons have been evaluated. This offers the base case for the quantification of the impact due to efficient devices on the domestic sector of Pakistan across the concerned period.

3. Results

Based on the proposed IQA approach, the targets have been evaluated as mentioned below:
Target 1: Future projection of quantities via Historical data in each policy.
Target 2: Case studies of 0.5 °C, 1.0 °C, and 2.0 °C with TMA.
Target 3: Impact assessment of EEDs with PnP-based methodology until 2030.

3.1. Target 1: Future Projection of Quantities via Historical Data in Each Policy

Table 6 shows the various gas emissions, in kilo-tons per year, for the base case scenario between 2020 and 2030 based on the historical data projection. According to the above, CO2 provides the most significant percentage of GHG emissions (95% for the year 2015) and it follows the same trend as the base case. Every five years, there has been a sharp increase in this tendency. The projected CO2 forecast, which accounts for the highest share of GHG emissions, will reach 210,140.3 kilo-tons per year by 2030.

3.1.1. Projection of Quantities via NESP Policy

Both the current and upcoming electricity projects are considered when modeling for the years from now to 2030. Here, we estimate that the electricity sector accounted for 26% of all national emissions [51]. By multiplying the previously indicated projected sources with the existing sources, as shown in Equation (1), Figure 2 illustrates the increase in the power generation related to the NESP plan. From 17,000 MW in 2000 to 32,000 MW in 2020 and up to 54,000 MW in 2030, the generating trend has consistently grown. According to NESP, the generation capacity will rise to keep up with the anticipated consumption [51]. The generation mix shifts as the generation capacity increases. The share of thermal energy will drop by 46.3% by 2025, while the share of hydropower will rise to 37.4%. The renewable and nuclear energy trends also went up a little, reaching 8.57 and 16.04 percent, respectively. Even though the total amount of energy made from thermal energy will go up by 2030, its share must go down to 40.2% from its 2017 levels. Hydropower would add almost as much power to the country as thermal energy, and it would provide 32.81% of the total amount of energy.

3.1.2. Projection of Quantities via 2025 Policy

The energy part of Vision 2025 is all about expanding and changing the mix of energy sources. Figure 3 shows that the total power generation increases by 47.66% under Vision 2025, from 29,940 MW in 2017 to 44,210 MW in 2025. The load is expected to increase drastically due to population growth and industrialization projects, such as China and Pakistan’s Economic Corridor (CPEC). An evaluation of Vision 2025 is given below.
In this case, the loop in Figure 1 terminates quickly across 2025, rather than 2030, following the horizon of the concerned policy. As the plan focuses on the diversification of the energy mix, the share of generation from RES has increased from 4.13% in 2017 to 8.57% in 2025. With the Diamer Basha dam and the Dasu dam, 8820 MW of clean hydroelectric power will be made [41]. Hydro-based energy production will increase from 23.81% to 37.41% of the total energy mix from 2017 to 2025. The total CO2 emissions projection under each plan is evaluated until 2030, as previously mentioned in Equation (2).
As illustrated in Figure 4, the base case until 2025–2030 comes out to be around 191,800–20,000 kg tons and is a reference for comparison with other policies. As per NESP, the CO2 emissions projection is expected to be around 136,100 kg tons by 2030 compared to the base case scenario. It shows a reduction of 31.95% compared to the respective base case. Similarly, as per Vision 2025, the CO2 emissions are estimated to be around 161,400 kg tons by 2025 and show a reduction of 15.85% during the respective base case. This is because NESP and Vision 2025 will use local resources as an economically viable option in addition to deploying RE projects, which is why the price went up. From the perspective of the base case year 2017 (155,027 kg-tons), the CO2 emissions in NESP have seen a decreasing trend of ~12.21% until the projected year 2030. However, Vision 2025 shows an increasing trend in the projection of ~4.11%, compared with the respective base case, until 2025. The projected downfall in emissions, as per NESP, will favor Pakistan immensely in meeting the intended contribution to the Paris agreement.

3.1.3. Projection of Quantities According to NPSEP Policy

The T and D losses are the focus of the NPSEP, which seeks to reduce them. Therefore, Equations (3)–(6) of sub-methodology 1 were used to compare the T and D losses up to 2025 with the base case and vision 2025 scenarios. This is displayed in Figure 5. The NPSEP reverses the trend of T and D losses even further (in 2020). The loss will eventually drop to 3400 MW in 2030, after continuing to trend downward to 3537 MW in 2025. The T and D losses on the electrical grid rise from 5458 MW (in 2020) to 8400 MW under Vision 2025 (in 2025).

3.2. Target 2: Ambient Temperature (0.5–2.0 °C) Impact on Power Equipment with TMA

For this target, TMA is applied. Figure 6 shows the loss in generation for three scenarios. These losses happen because the temperature change in the first change cause a decline in the transformer’s operation performance. In the first case, there is a temperature increase of 0.5 °C. In contrast to the NESP’s claims, the observed loss in electricity production by 2030 is 0.407%. The second case is for a 1.0 °C change in the ambient temperature, where the loss in generation almost doubles to 0.79%. Finally, the third case is a change in the ambient temperature of 2.0 °C. This is the threshold at which the Paris climate change agreement aims to stop the global temperature rise. The loss in generation becomes more apparent with a 2.0 °C change. The overall generation loss in this scenario is 4% compared to the first case.
An increase in the exhaust gas temperature leads to a reduction in the gas turbine efficiency. Figure 7 illustrates the thermal plant behavior concerning the ambient temperature for three different scenarios. The ambient temperature for a thermal plant to work in an ideal scenario is 15 °C. In Pakistan, the average temperature is 20.1 °C, which results in a 4.89% efficiency loss for thermal power plants. Using the three temperature scenarios for the transformer, the efficiency is already 5 °C above the ambient temperature.

3.3. Target 3: Impact Assessment of EEDs with PnP Based Methodology until the Year 2030

This section applies the PnP algorithm for DSM using EEDs in the domestic/residential sector. Figure 8 shows the total domestic consumption of Pakistan for a typical day in June. The goal is to determine how energy-efficient devices are used and how that affects how much energy is used overall. Fluctuations are seen in the graph due to different load requirements at various times. For the annual comparison and analysis, the difference will be substantial. This can be solved with the assistance of EEDs. The loads have been divided into three categories: flexible time loads, time-inflexible loads, and flexible power loads. To enhance the efficiency, time-flexible loads are assigned a price threshold. A local controller checks the real-time prices and, by comparing them with the threshold value, decides whether the time-flexible loads will be turned on or off, as shown in Equation (8).
s t a t e = O n i f   P u n i t < P t h r e s h   ,     O f f     i f   P u n i t > P t h r e s h
where Punit is the number of units consumed and Pthreshold is the maximum allowable unit consumption (in kWh).
The results show that EEDs reduce consumption from a maximum average load of 54,354 GWh (without EEDs) to 52,058 GWh. Therefore, much electricity can be saved, most of which in Pakistan comes from thermal power, which means fewer greenhouse gas (GHG) emissions. In addition, the emissions from the most common domestic load can be cut by a lot, saving approximately 2250–2350 GWh of electricity.
The total load requirement of Pakistan is approximately 106,927 GWh. About 26% of Pakistan’s emissions come from the power sector, and about 50% of the total load comes from the residential sector. Therefore, the overall reduction in emissions is looked at using a load pattern (2250–2350 GWh) that makes up about 1.2512–1.582% (1.42% on average) of all the emissions made by Pakistan’s electrical sector.
The EEDs will have several secondary effects, including decreased consumption and overall cost reduction. As the consumption decreases, the total demand decreases significantly, resulting in fewer units sold. The results in Figure 9 indicate a decrease in the total units consumed, with a reduction of 10.1% in 2025 and 10.7% in 2030. This is significant compared to the base case study values across the respective horizons, as shown in Table 7.
As the demand and number of units sold decreased, the electricity prices also decreased due to the price elasticity of the demand. It can be seen in Figure 10 that the real-time prices across a day would be much less with the use of EEDs. The reduction in the units consumed and the respective decrease in the average unit prices are shown in Figure 11. It has been found that the average unit prices have decreased by 14.4% in 2020, 12.1% in 2025, and 12.8% in 2030 in comparison with the base case values shown in Table 7.
With the rise in the electricity prices over the years, the increase would have been considerably less with the deployment of EEDs, and has a reduction of 12.73% across the year 2030. This is in comparison with the base case, as there is a reduction in the value of PKR 919 on the monthly bill compared to the base case of PKR 1592. At the time of analysis, 1 USD was equal to 220 PKR. The price decrease is illustrated in Figure 11.

4. Discussion

As per the proposed IQA, 59,699 MW of generation (99.39% increase) will be needed by 2030, with 10.9% of RE in the energy mix, as shown in Table 8. The consumption is reduced with EED to 50,040 MW, with an increase of 59.36% by the same year.
  • Through the integration of our strategy (IQA), the CO2 emissions will have decreased by 89,760 kilo-tons (55%) by 2030. The T and D losses following NPSEP have attained a reduced value of 3400 MW (in the year 2030) compared with 6055 MW in 2017 for maintaining the plan’s sustainability. As an increase in temperature causes a decrease in the efficiency of both the transformers and thermal plants, the overall generation will decrease if the appropriate steps are not taken to combat climate change. TMA, as target 2, is applied to assess the impact of the respective grid components, as mentioned above.
It can be observed from Table 9 that a 0.5 °C change in temperature would result in 1110 MW of thermal electricity generation loss (by 2025), while a 2 °C change, as stipulated by the Paris agreement, would cause 1440 MW of thermal electricity generation loss, and an over 1770 MW loss due to the reduction in the transformer efficiency. Thus, a focus on mitigating a temperature rise should be of paramount importance to policymakers.
Finally, the PnP algorithm is applied as target 3 to evaluate the impact of EEDs/DSM on the domestic load sector of Pakistan. It can be seen from Table 10 that consumption has reduced drastically. Thus, the consumption in our proposed scenario would be much smaller than in the other plans. The EEDs are implemented in a stepwise manner. The first step (converting only time-inflexible loads such as lights and fans) is to reduce consumption by 5478 GWh (~4.7%) by 2020. The second step (both time-flexible and inflexible loads) reduces the overall consumption by 8984 GWh (~6%) by the year 2025. The final step (flexible power loads such as air conditioners) reduces the overall consumption by 12,392 GWh (~7%) by 2030. This decrease in consumption would help significantly in bridging the generation-consumption gap and can be utilized to mitigate the electricity shortages in the country. The EED impacts have also been accompanied by cost-to-benefit analysis in the previous section, which can also be used for energy policy formulation.
Authors should discuss the results and how they can be interpreted from the perspective of previous studies and of the working hypotheses. The findings and their implications should be discussed in the broadest context possible. Future research directions may also be highlighted.

5. Conclusions

The IQA’s evaluation of target one shows that the share of thermal energy in the energy mix will decrease from 68.43% to 40.2% by 2030. Moreover, CO2 emissions from the reference base case are expected to decrease by 46% in 2025 and by 55% in 2030. According to the proposed plan (IQA), the percentage of T and D losses is expected to change slightly, from 6065 MW to 8400 MW per Vision 2025 and from 3537 MW to 3400 MW per NPSEP between the years 2025–2030. According to target 2, the achieved results from the TMA indicate increased losses in the electricity generation for the case of transformers, from 180 MW to 350 MW (years 2020–2025) and 1770 MW (across the year 2030). Similarly, the thermal power plant’s electricity generation losses increase from 1110 MW to 1220 MW (years 2025) and 1440 MW (across the year 2030), respectively. Finally, according to target 3, the evaluation from the PnP algorithm analyzed the impacts of EEDs on the domestic load across the country, which indicates a reduction in the average load from 9370 MW (out of a total of 27,000 MW of country requirement) to 8120 MW. In addition, an average saving of 1250 MW contributes to a reduction in CO2 emissions by 1.42% of Pakistan’s total power grid-based emissions. The cost-to-saving ratio with EED indicates a reduction in the total units (kWh) of consumption by 10.1% and 10.7% across the various horizons (2025–2030) compared to the base case. In addition, the average unit price has decreased by 12.1% and 12.8%. The presented IQA approach will help developing countries carve out policy frameworks and research strategies to combat carbon emission reduction and climatic changes and reduce their impact on the respective electrical grids. The following conclusions were made with the results mentioned earlier:
  • A dedicated policy is needed to mitigate climate change-based environmental impacts on the electrical grid, as suggested through the quantification presented in this paper.
  • New carbon credit mechanisms must be favorable for investors regarding quick payback on their respective investments in renewables and EED installation.
  • Indigenous research and development (R and D) options must be exploited for DSM, in addition to renewable energy options.
Future work will include an analysis of the impacts of climate change on other important sectors, such as the industrial, commercial, and agriculture sectors. Moreover, the socio-economic impacts can also be considered. The cost-to-benefit analysis of various intelligent technologies across planning horizons will be presented in future studies. The value analysis of the payback for the home investment cost of EEDs will benefit from further calculation on the domestic/residential level. Manufacturing EEDs in the local market can reduce additional energy intake, and this will be incorporated into future studies. Furthermore, renewable sources and modern technology with quality index-based evaluation must be indigenized to reduce the cost. Furthermore, tax credits must be improved to encourage the maximum participation of stakeholders.

Author Contributions

Conceptualization, A.A., S.A.A.K. and Z.A.K.; methodology, M.M.M. and A.A.; software, M.M.M., B.A. and S.A.A.K.; validation, Z.A.K., H.A. (Hamoud Alafnan) and S.A.A.K.; formal analysis, M.M.M., B.A., H.A. (Hamoud Alafnan); investigation, M.M.M., S.A.A.K.; resources, A.A., H.A. (Halemah Alshehry), B.A., H.A. (Hamoud Alafnan) and Z.A.K.; data curation, M.M.M. and A.A.; writing—original draft preparation, M.M.M., Z.A.K., B.A., H.A. (Halemah Alshehry) and S.A.A.K.; writing—review and editing, M.M.M., A.A., H.A. (Hamoud Alafnan) and S.A.A.K.; supervision, Z.A.K. and S.A.A.K.; project administration, A.A., B.A. and Z.A.K.; funding acquisition, A.A. and Z.A.K. All authors have read and agreed to the published version of the manuscript.

Funding

The authors extend their appreciation to the Deputyship for research and innovation, ministry education in Saudi Arabia for funding this research work through the project number (IFP-2022–44).

Institutional Review Board Statement

Not applicable.

Informed Consent Statement

Not applicable.

Data Availability Statement

Not applicable.

Conflicts of Interest

The authors declare no conflict of interest.

Abbreviations

EEDsEnergy Efficient DevicesNESPNational Energy Security Policy
IQAIntegrated Quantification ApproachNPSEPNational Power System Expansion Plan
PnPPlug and playBAUBusiness as usual
DSMDemand Side ManagementRE Renewable Energy
LCCALife-cycle cost analysisCPECChina Pakistan Economic Corridor
CCClimate ChangePMParticulate Matter
TSPTotal suspended particlesDSMDemand side management

References

  1. Oreskes, N. Beyond the Ivory Tower: The scientific consensus on climatic change. Science 2004, 306, 1686. [Google Scholar] [CrossRef] [PubMed] [Green Version]
  2. Solomon, S. Intergovernmental Panel on Climate Change; Intergovernmental Panel on Climate Change. In Working Group I. Climate Change 2007: The Physical Science basis: Contribution of Working Group I to the Fourth Assessment Report of the Intergovernmental Panel on Climate Change; Cambridge University Press: Cambridge, UK, 2007. [Google Scholar]
  3. Khan, S.N.; Kazmi, S.A.A. Integrative decision-making framework for techno-economic planning and sustainability assessment of renewable dominated standalone hybrid microgrids infrastructure at provincial scale of Pakistan. Energy Convers. Manag. 2022, 270, 116168. [Google Scholar] [CrossRef]
  4. Kessides, I.N. Chaos in power: Pakistan’s electricity crisis. Energy Policy 2013, 55, 271–285. [Google Scholar] [CrossRef]
  5. das Valasai, G.; Uqaili, M.A.; Memon, H.U.R.; Samoo, S.R.; Mirjat, N.H.; Harijan, K. Overcoming electricity crisis in Pakistan: A review of sustainable electricity options. Renew. Sustain. Energy Rev. 2017, 72, 734–745. [Google Scholar] [CrossRef]
  6. Yasmeen, F.; Sharif, M. Forecasting electricity consumption for Pakistan. Int. J. Emerg. Technol. Adv. Eng. 2014, 4, 496–503. [Google Scholar]
  7. Kazmi, S.A.A.; Shahzad, M.K.; Khan, A.Z.; Shin, D.R. Smart distribution networks: A review of modern distribution concepts from a planning perspective. Energies 2017, 10, 501. [Google Scholar] [CrossRef]
  8. Fang, X.; Misra, S.; Xue, G.; Yang, D. Smart grid—The new and improved power grid: A survey. IEEE Commun. Surv. Tutor. 2012, 14, 944–980. [Google Scholar] [CrossRef]
  9. El-Hawary, M.E. The smart grid—State-of-the-art and future trends. Electr. Power Compon. Syst. 2014, 42, 239–250. [Google Scholar] [CrossRef]
  10. Tuballa, M.L.; Abundo, M.L. A review of the development of Smart Grid technologies. Renew. Sustain. Energy Rev. 2016, 59, 710–725. [Google Scholar] [CrossRef]
  11. Moriarty, P.; Honnery, D. Can renewable energy power the future? Energy Policy 2016, 93, 3–7. [Google Scholar] [CrossRef]
  12. Greer, C.; Wollman, D.A.; Prochaska, D.E.; Boynton, P.A.; Mazer, J.A.; Nguyen, C.T.; Fitzpatrick, G.J.; Nelson, T.L.; Koepke, G.H.; Hefner, A.R., Jr.; et al. NIST Framework and Roadmap for Smart Grid Interoperability Standards, Release 3.0; National Institute of Standards and Technology: Gaithersburg, MD, USA, 2014. [Google Scholar]
  13. Gangale, F.; Mengolini, A.; Onyeji, I. Consumer engagement: An insight from smart grid projects in Europe. Energy Policy 2013, 60, 621–628. [Google Scholar] [CrossRef]
  14. IqtiyaniIlham, N.; Hasanuzzaman, M.; Hosenuzzaman, M. European smart grid prospects, policies, and challenges. Renew. Sustain. Energy Rev. 2017, 67, 776–790. [Google Scholar] [CrossRef]
  15. Newbery, D.M. Towards a green energy economy? The EU Energy Union’s transition to a low-carbon zero subsidy electricity system–Lessons from the UK’s Electricity Market Reform. Appl Energy 2016, 179, 1321–1330. [Google Scholar] [CrossRef]
  16. “Energy Source Book of Pakistan” 2017 Finance Division; Confidentiality of Data; USPCAS-E NUST Library Online, 2017.
  17. Item 4(a) of the Provisional Agenda Durban Platform for Enhanced Action (Decision 1/CP.17) Report of the Ad Hoc Working Group on the Durban Platform for Enhanced Action. Available online: http://unfccc.int/focus/indc_portal/items/9240.php (accessed on 21 October 2022).
  18. Choi, S.J.; Choi, D.G.; Friley, P.; Kim, H.; Park, S.Y. Quantitative Analysis on the Energy and Environmental Impact of the Korean National Energy R&D Roadmap a Using Bottom-Up Energy System Model. Sustainability 2017, 9, 538. [Google Scholar]
  19. Kim, S.T.; Lim, B.I.; Park, W.K.; Kim, M.K.; Son, S.-Y. An analysis on the effectiveness of a smart grid test-bed project: The Korean case. Renew. Sustain. Energy Rev. 2016, 59, 868–875. [Google Scholar] [CrossRef]
  20. Selvam, M.M.; Gnanadass, R.; Padhy, N.P. Initiatives and technical challenges in smart distribution grid. Renew. Sustain. Energy Rev. 2016, 58, 911–917. [Google Scholar] [CrossRef]
  21. Bilgili, F.; Koçak, E.; Bulut, Ü. The dynamic impact of renewable energy consumption on CO2 emissions: A revisited Environmental Kuznets Curve approach. Renew. Sustain. Energy Rev. 2016, 54, 838–845. [Google Scholar] [CrossRef]
  22. Xu, Z.; Xue, Y.; Wong, K.P. Recent advancements on smart grids in China. Electr. Power Compon. Syst. 2014, 42, 251–261. [Google Scholar] [CrossRef]
  23. Elrahmani, A.; Hannun, J.; Eljack, F.; Kazi, M.K. Status of renewable energy in the GCC region and future opportunities. Curr. Opin. Chem. Eng 2021, 31, 100664. [Google Scholar] [CrossRef]
  24. Kim, C. A review of the deployment programs, impact, and barriers of renewable energy policies in Korea. Renew. Sustain. Energy Rev. 2021, 144, 110870. [Google Scholar] [CrossRef]
  25. Solaymani, S. A review on energy and renewable energy policies in Iran. Sustainability 2021, 13, 7328. [Google Scholar] [CrossRef]
  26. Mufutau Opeyemi, B. Path to sustainable energy consumption: The possibility of substituting renewable energy for non-renewable energy. Energy 2021, 228, 120519. [Google Scholar] [CrossRef]
  27. Włodarczyk, B.; Firoiu, D.; Ionescu, G.H.; Ghiocel, F.; Szturo, M.; Markowski, L. Assessing the sustainable development and renewable energy sources relationship in eu countries. Energies 2021, 14, 2323. [Google Scholar] [CrossRef]
  28. Chien, F.S.; Kamran, H.W.; Albashar, G.; Iqbal, W. Dynamic planning, conversion, and management strategy of different renewable energy sources: A Sustainable Solution for Severe Energy Crises in Emerging Economies. Int. J. Hydrogen Energy 2021, 46, 7745–7758. [Google Scholar] [CrossRef]
  29. Saraswat, S.K.; Digalwar, A.K. Evaluation of energy alternatives for sustainable development of energy sector in India: An integrated Shannon’s entropy fuzzy multi-criteria decision approach. Renew Energy 2021, 171, 58–74. [Google Scholar] [CrossRef]
  30. Weber, C.L.; Jaramillo, P.; Marriott, J.; Samaras, C. Life Cycle Assessment and Grid Electricity: What Do We Know and What Can We Know? ACS Publications: Washington, DC, USA, 2010. [Google Scholar]
  31. Matsuo, Y.; Fukasawa, K.; Nagatomi, Y.; Fujisaki, W.; Kutani, I.; Seki, N.; Kubota, Y. Quantitative analysis of effects of international power grid interconnection in ASEAN region. Inst. Energy Econ. Jpn. 2015, 35, 1–35. [Google Scholar]
  32. McCarthy, R.; Yang, C. Determining marginal electricity for near-term plug-in and fuel cell vehicle demands in California: Impacts on vehicle greenhouse gas emissions. J. Power Sources 2010, 195, 2099–2109. [Google Scholar] [CrossRef]
  33. Stenzel, P.; Schreiber, A.; Marx, J.; Wulf, C.; Schreieder, M.; Stephan, L. Environmental impacts of electricity generation for Graciosa Island, Azores. J. Energy Storage 2018, 15, 292–303. [Google Scholar] [CrossRef]
  34. Strantzali, E.; Aravossis, K.; Livanos, G.A. Evaluation of future sustainable electricity generation alternatives: The case of a Greek island. Renew. Sustain. Energy Rev. 2017, 76, 775–787. [Google Scholar] [CrossRef]
  35. Hatziargyriou, N.D.; Anastasiadis, A.G.; Vasiljevska, J.; Tsikalakis, A.G. Quantification of economic, environmental and operational benefits of microgrids. In Proceedings of the 2009 IEEE Bucharest PowerTech, Bucharest, Romania, 28 June–2 July 2009; pp. 1–8. [Google Scholar]
  36. Notton, G. Importance of islands in renewable energy production and storage: The situation of the French islands. Renew. Sustain. Energy Rev. 2015, 47, 260–269. [Google Scholar] [CrossRef]
  37. Parissis, O.-S.; Zoulias, E.; Stamatakis, E.; Sioulas, K.; Alves, L.; Martins, R.; Tsikalakis, A.; Hatziargyriou, N.; Caralis, G.; Zervos, A. Integration of wind and hydrogen technologies in the power system of Corvo island, Azores: A cost-benefit analysis. Int. J. Hydrogen Energy 2011, 36, 8143–8151. [Google Scholar] [CrossRef]
  38. Hua, J.; Shiu, H.-G. Sustainable development of renewable energy on Wangan Island, Taiwan. Util. Policy 2018, 55, 200–208. [Google Scholar] [CrossRef]
  39. Zhidong, L. Quantitative analysis of sustainable energy strategies in China. Energy Policy 2010, 38, 2149–2160. [Google Scholar] [CrossRef]
  40. Zhou, K.; Yang, S.; Shen, C.; Ding, S.; Sun, C. Energy conservation and emission reduction of China’s electric power industry. Renew. Sustain. Energy Rev. 2015, 45, 10–19. [Google Scholar] [CrossRef]
  41. Yao, L.; Chang, Y. Energy security in China: A quantitative analysis and policy implications. Energy Policy 2014, 67, 595–604. [Google Scholar] [CrossRef]
  42. Lindner, S.; Liu, Z.; Guan, D.; Geng, Y.; Li, X. CO2 emissions from China’s power sector at the provincial level: Consumption versus production perspectives. Renew. Sustain. Energy Rev. 2013, 19, 164–172. [Google Scholar] [CrossRef]
  43. Mirjat, N.H.; Uqaili, M.A.; Harijan, K.; das Valasai, G.; Shaikh, F.; Waris, M. A review of energy and power planning and policies of Pakistan. Renew. Sustain. Energy Rev. 2017, 79, 110–127. [Google Scholar] [CrossRef] [Green Version]
  44. Raza, M.A.; Khatri, K.L.; Israr, A.; Haque, M.I.U.; Ahmed, M.; Rafique, K.; Saand, A.S. Energy demand and production forecasting in Pakistan. Energy Strategy Rev. 2022, 39, 100788. [Google Scholar] [CrossRef]
  45. Rafique, M.M.; Ahmad, G. Targeting sustainable development in Pakistan through planning of integrated energy resources for electricity generation. Electr. J. 2018, 31, 14–19. [Google Scholar] [CrossRef]
  46. Perwez, U.; Sohail, A.; Hassan, S.F.; Zia, U. The long-term forecast of Pakistan’s electricity supply and demand: An application of long range energy alternatives planning. Energy 2015, 93, 2423–2435. [Google Scholar] [CrossRef]
  47. Paris Agreement. Proceedings of the Report of the Conference of the Parties to the United Nations Framework Convention on Climate Change (21st Session, 2015), Paris, France, 12 December 2015; Volume 4, p. 2017. Available online: https://heinonline.org/HOL/LandingPage?handle=hein.journals/intlm55&div=46&id=&page= (accessed on 21 October 2022).
  48. Swift, G.; Molinski, T.S.; Lehn, W. A fundamental approach to transformer thermal modeling. I. Theory and equivalent circuit. IEEE Trans. Power Deliv. 2001, 16, 171–175. [Google Scholar] [CrossRef]
  49. González-Díaz, A.; Alcaráz-Calderón, A.M.; González-Díaz, M.O.; Méndez-Aranda, Á.; Lucquiaud, M.; González-Santaló, J.M. Effect of the ambient conditions on gas turbine combined cycle power plants with post-combustion CO2 capture. Energy 2017, 134, 221–233. [Google Scholar] [CrossRef]
  50. National Electric Power Regulatory Authority Islamic Republic of Pakistan Registrar. Available online: www.nepra.org.pk (accessed on 12 October 2022).
  51. Shaikh, F.; Ji, Q.; Fan, Y. The diagnosis of an electricity crisis and alternative energy development in Pakistan. Renew. Sustain. Energy Rev. 2015, 52, 1172–1185. [Google Scholar] [CrossRef]
Figure 1. Integrated Quantification Approach.
Sustainability 15 03674 g001
Figure 2. Generation by resource as per NESP.
Sustainability 15 03674 g002
Figure 3. Generation units by resource as per Vision 2025.
Sustainability 15 03674 g003
Figure 4. Annual CO2 emissions as per planned policies.
Sustainability 15 03674 g004
Figure 5. Transmission and Distribution (T and D) losses for Vision 2025, NSEP and Base Case.
Sustainability 15 03674 g005
Figure 6. Loss in total generation due to temperature change.
Sustainability 15 03674 g006
Figure 7. Thermal plant behavior with respect to ambient temperature for different case scenarios (until year 2030).
Sustainability 15 03674 g007
Figure 8. Total domestic consumption of Pakistan before and after energy-efficient devices.
Sustainability 15 03674 g008
Figure 9. Total units saved by EED across the year 2030.
Sustainability 15 03674 g009
Figure 10. Decrease in monthly bills throughout the year before and after EEDs.
Sustainability 15 03674 g010
Figure 11. Per-hour pricing before and after EEDs.
Sustainability 15 03674 g011
Table 1. A review of policies on the energy and power sector of Pakistan.
YearPolicyCore Theme/FocusesSecondary Focuses and LimitationsEnvironmental and RE-Based ConsiderationGrid Side Prospects
(Climatic)
1967Lifting
Report
New Thermal Power Plants IntegrationThermal Power
Integration only
NilN/A
2006–2008Alternative Energy Development Board (AEDB)Policy for development of RE SourcesRE Sources
for power generation
Partially Addressed.Nil
2005–2030Energy Security Action PlanSecurity of Energy SupplyInstability and pricingN/ANil
2005–2030National Energy Security Plan (NESP)Expansion of Indigenous ResourcesFossil fuel-based energy generationIncrease in RE to 20% of the energy mix by the year 2030Nil
2010–2030Pakistan Integrated Energy Model
(Pak IEM)
Shift to advanced energy systemsLimited focus on Environment IssuesYes
(On overall
energy sector)
Nil
Table 2. Source wise energy mix of Pakistan in MW and respective %.
YearsTotal Installed Capacity (MW)Hydro
(MW)/%
Thermal
(MW)/%
Nuclear
(MW)/%
Renewables
(MW)/%
2011–201222,7976556/28.7615,454/67.79787/3.45-
2012–201322,8126773/29.6915,289/67.02750/3.28-
2013–201423,5306893/29.2915,887/67.51750/3.18-
2014–201523,7597030/29.5815,541/65.41750/3.15438/1.84
2015–201625,8897122/29.5017,115/66.10750/2.89902/3.48
2016–201729,9447129/23.8020,488/68.421090/3.641237/4.13
2017–201829,9447129/23.820,488/68.421090/3.641237/4.13
2018–201932,1049233/28.7520,488/63.811090/3.391293/4.02
2019–202032,1049233/28.7520,488/63.811090/3.391293/4.02
2020–202134,0869233/27.0820,488/60.102240/6.572125/6.23
Table 3. Gross source-wise generation share of Pakistan’s Energy Mix in GWh of units.
YearsThermal (GWh) Hydel (GWh) Nuclear
(GWh)
RE (GWh) Gross Generation
(GWh)
Thermal Share in Energy Mix (%)
2011–201261,30828,5175265-95,09064.473
2012–201361,71129,8574553-96,12164.20
2013–201466,70731,8735090-103,67064.35
2014–201567,88632,4745804802106,96663.47
2015–201670,51232,63346051549109,29964.51
2016–201774,11233,18369992668116,96263.36
2017–201876,10033,75070902999119,93963.45
2018–201977,28834,07470903310121,76263.47
2019–202078,51234,13379413450124,03663.29
2020–202178,80034,18980243570124,58363.25
Table 4. GHG Emission in kilo-tons/year (2005, 2010, 2015, 2017).
YearNOxCO2SO2PM10PM 2.5TSPTotalCO2%
2005640136,6319547335811111140,65097.1426
2010854161,39513818636551430166,55196.90
20151278167,837.6236010647661861175,161.695.82
20171536171,520302411898452103180,21795.17
Table 5. Consumption shares of the electrical grid of Pakistan.
YearsDomestic (GWh)/%Commercial
(GWh)/%
Industrial
(GWh)/%
Other Sectors (GWh)/%Grid Losses (GWh)/%Gross/Net
Consumption (GWh)
2011–201235,590/46.315754/7.521,800/28.413,617/17.7416,054/17.2992,815/76,761
2012–201336,116/47.036007/7.82322,313/29.0612,352/16.1016,372/17.5793,161/76,788
2013–201439,549/47.426335/7.59524,356/29.2013,129/15.7416,932/16.87100,340/83,409
2014–201541,450/48.306512/7.5924,980/29.1112,877/15.0117,627/17.04103,445/85,818
2015–201644,486/49.207181/7.9425,035/27.6813,727/15.1817,209/15.99107,640/90,431
2016–201748,698/50.997856/8.22424,010/26.1314,965/15.6623,582/19.80119,112/95,530
2017–201848,349/50.157322/7.59525,259/26.2015,473/16.0520,931/17.83117,340/96,409
2018–201948,914/49.57500/7.5926,789/27.1115,613/15.816,627/14.40115,445/98,818
2019–202049,515/49.207990/7.9427,587/27.6815,277/15.1815,999/13.71116,640/100,641
2020–202147,402/47.127166/7.12427,292/27.1318,731/18.6215,512/13.35116,112/100,600
Table 6. Base Case Scenario of GHG Emission in kilo-tons/year (2020, 2025 and 2030).
YearNOxCO2SO2PM10PM 2.5TSPTotalCO2 %
20201794175,202.9368713139242344185,26594.57%
20252353183,017.45281162911262924210,140.393.22%
20302957191,198.38255221314774040196,330.490.99%
Table 7. Average unit price and total unit consumption before and after EEDs.
ScenarioTotal Unit Consumption (kWh)Average Unit Price (PKR)
Year2025203020252030
BAU141,000155,6002530
After EEDs126,800139,00021.9726.16
% Reduction10.1%10.7%12.1%12.8%
Table 8. Percentage RE in the energy mix across 2025 and 2030.
ScenarioGeneration (MW) (Value/Percentage)Consumption (MW) (Value/Percentage)
Year2025203020252030
Base Case34,47039,31045,86755,967
NESP44,210/47.6654,850/83.1943,500/38.553,800/68.78
Vision 202544,210/47.66-43,500/38.5-
Proposed IQA46,167/54.1959,699/99.3940,890/30.2250,040/59.36
Table 9. Percentage RE in the energy mix across 2025 and 2030.
TransformersThermal Plant
0.5°1.0°2.0°0.5°1.0°2.0°
202520302025203020252030202520302025203020252030
Other Plans------------
IQA (MW)1802203504302170438011107301220239014402710
Table 10. Comparison of quantification and proposed reductions.
StrategiesDecrease in Consumption with EEDs (GWh)Emissions
(Kilo-Tons CO2)
T and D Losses (MW)
Year202520302025203020252030
Base Case149,989 149,989 191,800199,988990312,720
NESP--102,80089,760--
Vision 2025--124,700-8400-
NPSEP----35373400
Proposed IQA8984
(~6%)
8984
(~6%)
102,800
(46%)
89,760
(55%)
3537
(64%)
3400
(73%)
Disclaimer/Publisher’s Note: The statements, opinions and data contained in all publications are solely those of the individual author(s) and contributor(s) and not of MDPI and/or the editor(s). MDPI and/or the editor(s) disclaim responsibility for any injury to people or property resulting from any ideas, methods, instructions or products referred to in the content.

