Article

Process Cooling Market in Europe: Assessment of the Final Energy Consumption for the Year 2016

1
Institute for Renewable Energy, European Academy of Bolzano (EURAC Research), Viale Druso 1, 39100 Bolzano, Italy
2
Directorate-General for Energy (DG Energy), European Commission, Unit B3: Buildings and Products, 1049 Brussel, Belgium
3
Center for Energy Efficient Systems (CES), Department of Energy and Processes (DEP), Mines ParisTech, PSL University, 60 Boulevard Saint-Michel, CEDEX 06, 75272 Paris, France
4
Energy Economics Group, Institute of Energy Systems and Electric Drives, TU Wien, Gusshausstrasse 25-29/370-3, 1040 Vienna, Austria
5
Planetek Italia, Via Massaua 12, 70132 Bari, Italy
*
Author to whom correspondence should be addressed.
Sustainability 2023, 15(4), 3698; https://doi.org/10.3390/su15043698
Submission received: 9 January 2023 / Revised: 31 January 2023 / Accepted: 3 February 2023 / Published: 17 February 2023
(This article belongs to the Special Issue Heating and Cooling: Mapping and Planning of Energy Systems)

Abstract

:
This study analysed one of Europe’s most unexplored energy fields: process cooling (PC). The work assessed the final energy consumption (FEC) for PC of the European Union (and United Kingdom) with a 2016 baseline. An extensive literature review of datasets and journal papers was performed to address knowledge gaps by creating a high-quality dataset with factual accuracy, reliability, and completeness. Installed cooling units, equivalent full load hours, energy efficiency levels (seasonal energy performance ratio), and capacities installed were the essential investigated parameters to perform the FEC calculations. The latter were referred to as vapour compression (VC) chillers (air-to-water or water-to-water). Overall, the results of the EU (plus UK) FEC for the PC sector resulted in more than 110 TWh/year, accounting for around 10% of the total energy consumption for electricity in Europe. It is worth mentioning that several non-VC technologies are utilized for PC purposes in various sectors and subsectors primarily in the industry and the tertiary sectors, which are rapidly growing and, therefore, their cooling consumption is increasing. The current research paper aimed to raise awareness of the PC sector by supporting the European Union policies toward a more sustainable and decarbonized industry in the upcoming decades.

1. Introduction

The European Union (EU)—please see Table A1 in the Appendix A for all abbreviations utilized—focused its central efforts on achieving shifting goals by 2020, such as a 20% increase in energy efficiency, a 20% in greenhouse gas (GHG) emissions decrease, and a 20% renewable energy sources (RES) share increase in comparison with 1990 levels. Mainly, the energy efficiency targets were initially established in the Energy Efficiency Directive (EED) in 2002 (revised in 2018). The latter resulted in the EED II being updated from 20 to 32.5%, with possible revision in 2023 [1]. More efficient energy use can lead to lower utility bills, decrease the EU’s dependence on external oil and gas suppliers, and improve adaptability to climate change. Additionally, the EU intends to drop its emissions by 55% by 2030. In 2018, GHG emissions decreased by 23% from 1990 levels [2]. The EU ambitiously aims to become the first region to reach carbon neutrality by 2050, with a reduction in GHG emissions by at least 80–95% [3]. The Emission Trading System (ETS) is a promising tool that utilizes the “cap and trade” scheme. The ETS covers 45% of GHG emissions in the EU while the remaining 55% of emissions are addressed through country-level emission reduction targets (e.g., through the buildings, agricultural, waste management, and transportation sectors [3]). The Renewable Energy Directive (RED-2009/28/EC), which initially put the mentioned goals into legislation, has been recently revised in 2018 (RED II) for the period 2021–2030 by increasing the RES share target of at least 32% [4]. The RED II envisages a possible revision of that EU goal in 2023 [5]. By 2050, the EU intends to generate in excess of 80% of electricity from RES, which would require a 250% increase versus current levels [1]. Furthermore, the RED II calls for the EU member states (MSs) to increase annual RES shares in the heating and cooling (H&C) sector by an average of 1.3 percentage points (ppt) for the period 2021–2030 [5]. The attention of the RED II to the latter is mainly justified by the fact that, in 2018, it was observed that the largest portion of the EU’s primary energy consumption (PEC) was demanded by the H&C sector [5,6,7]. This large share includes space heating (SH) and space cooling (SC) for buildings comfort, domestic hot water (DHW), and process cooling (PC), accounting for about 800 Mtoe/y, while the EU’s total PEC was about 1600 Mtoe/y in 2016. The transportation sector follows with around 490 Mtoe/y, followed by the electricity sector with approximately 310 Mtoe/y. Notably, oil and gas sources are used to produce around 85% of H&C, while RES is only used to produce 15% [8]. Overall, cooling demand is anticipated to rise in the upcoming decades.
Apart from the previously mentioned RED II, EED II, and the European Green Deal aims to reduce GHG by 55% by 2030, the EU MSs are responsible for acting decisively concerning the directives [9]. Therefore, proper energy usage quantification has become an impending necessity resulting in considerable investments from the EU MSs [9,10,11]. Notably, the EU MSs encountered remarkable data reliability and availability issues during the collection phase in the H&C sector. The encountered issues are of significant concern for SH, DHW, SC, and PC. Research on the EU cooling sector has not been investigated as much as its heating counterpart [12], and there is a lack of information on SC and even more so for PC, the focus of this paper. Based on the study accomplished in the “ENER/C1/2018-493 Renewable cooling under the Revised Renewable Energy Directive” project, a more in-depth analysis has been carried out [13]. In detail, we provide the context of the investigation, an interpretation of the main findings, and a discussion on the barely explored topic of cooling in industry.
The term “cooling” refers to the removal of heat against the second law of thermodynamics. In the following text, the terms SC and PC are used to distinguish one from the other since both contain “cooling”. While SC is referred to as ensuring the enclosed space occupants’ thermal comfort conditions by removing an amount of heat, PC is referred to as removing heat from processes (e.g., plastic mould cooling [14]), products, or an enclosed spaces that regulate the indoor temperature [13,14]. If SC and PC were summed up together, they solely count for around 4% of the EU’s final energy consumption (FEC), which is the total energy consumed by end-users, accounting for around 1200 Mtoe/y [2,15]. It has been estimated that the FEC for SC falls in the range of 134–192 TWh/y and 152–192 TWh/y for PC [16,17,18]. Overall, PC involves a number of sectors, including industrial buildings, transport (e.g., cooled containers), commercial buildings (e.g., cooled chests in supermarkets), greenhouses, data centres, cold storage, and hospitals (e.g., cooled medical equipment and laboratories), and agriculture applications. Per the limited data mentioned above, little information can be found in the scientific literature regarding PC. Significant retrieving information difficulties have been experienced throughout this analysis. It should be noted that, currently, in the present work, a significant portion of the cooling market in EU27+UK is estimated [16,17,18,19,20,21,22].
A number of previous studies evaluated PC energy consumption throughout their research. Notably, in their study, Fleiter et al., 2016 [16] accounted that the FEC for PC could have been in a range of approximately 100 to 160 TWh/y [23,24,25]. The current study aims to better define the quantification of the FEC for PC in the E27+UK with a specific background dataset from which the parameters essential in the input of the computation can be extracted and further utilized in future research.
Per the fact highlighted above, the PC sector must be further explored through scientific research to raise more awareness of how much the European FEC is dedicated to this sector. The current study has aimed to quantify the PC FEC of the EU (and the UK). The year 2016 has been referenced as a baseline for this study due to the ready access to information for this year. To pursue the aim mentioned above, different objectives have been set, such as investigating and gathering essential data and information to create a high-quality dataset for PC throughout the EU. Therefore, to ensure adequate accuracy, reliability, and completeness, the following aspects have been considered essential to conduct the analysis:
  • Data inventory;
  • Data reliability;
  • Data definition and comparability.

1.1. Data Inventory

The vital phase of establishing an inventory of PC in the EU27+UK data consists of the list creation of all existing information. Notably, if the data are collected on an EU-wide level, they can offer advantages thanks to the extensive territorial view (e.g., EUROHEAT&POWER [26]). However, it is impossible to ensure data completeness. Moreover, large online datasets (e.g., Copernicus Global Land Operations [27], Zambelli et al., 2019 [28], IGA [29], EHPA Stats Tool [30], EUROVENT 2020 [31]) were consulted to close data gaps by an extrapolating and assembling process. In addition, projects (e.g., Horizon 2020 Heat Roadmap Europe 4–HRE4 [32], H2020 HotMaps [33]) were consulted. Besides, for a precise approach, the desk research involved a scouting source-by-source of scientific journal papers (e.g., Evans et al., 2012 [34], Kapoor et al., 2013 [35], Popov et al., 2019 [36], Ebrahimi et al., 2017 [37], Ko et al., 2019 [38], Best et al., 2013 [39], Howard et al., 2023 [40], States et al., 2019 [41]) and industry applications (e.g., SURNA 2016 [42], Stiavelli 2020 [43], UN 2020 [44]) regarding the topic. Further details on which data and information were used in this paper were presented in Section 2.1. Moreover, essential data such as the number of installed cooling units, equivalent full load hours (EFLH), peak capacities installed of the cooling equipment in the industry, and their energy efficiency levels were further discussed in Section 2.2.

1.2. Data Reliability

During the data collection phase, the reliability of the latter was considered. It is worth mentioning that only scientific sources were considered in the current study as the base for the literature review. This premise already enhanced the quality of the sources scouted during the collection phase. Moreover, assessing the collected data’s reliability and filling the current studies’ gaps with an in-depth investigation required significant efforts. It is essential to mention that data that are lacking or had uncertainties were not considered when creating the dataset. Although the EU27+UK SH market has been broadly researched, there is a need for further data and information regarding the cooling sector. There were significant issues in finding data and information for PC since the most considerable portion of the data regarding the cooling market in the EU27+UK is based on estimated values. Moreover, certain data were retrieved in an aggregated form to recover certain values that are mathematically necessary to filter the latter. The collected information on PC (i.e., the amount of installed capacity values, energy efficiency values, and EFLH per country) was appropriately filtered and statistically evaluated as detailed in Section 2. Besides, additional sources were used to critically validate the outcomes presented in Section 3 and discussed in Section 4 for the EU27+UK to investigate their reliability.

1.3. Data Definition and Comparability

Despite the fact that most data sources present common values, units, and models, the latter could encounter comparability issues. Therefore, the entire data elaboration process necessitates harmonising the results that were produced from varying methods, time references, specifications, measures, and assumptions [45]. It is essential to underline that data over a decade old were collected and processed, and only the most recent records were considered in the present study. The reference year of 2016 was selected for this study to improve the quality and value of existing data and provide the required data for monitoring the development of the EU27+UK’s PC market. The latter resulted in being the largest source of information compared to other possible reference years for the barely explored PC sector in the EU27+UK.
Furthermore, once the high-quality dataset for PC based on data inventory, reliability, definition, and comparability was assessed, a precise calculation methodology was established to process the input to obtain the PC FEC assessment regarding the EU27+UK, country-by-country with 2016 as the baseline. Further details on the scouted sources investigated throughout the literature review and the assumed methods in this work were presented in Section 2.
Overall, the given piece follows Section 2 which includes materials and the methodology supporting the study with detailed data and information gathering. Section 3 specified the most important findings and figures. Section 4 provided a critical evaluation of the top results, and Section 5 provided the conclusions and the potential future implications and recommendations.

2. Materials and Methods

2.1. Materials

A thorough bibliographical review was performed for the EU27+UK PC sector. Although this sector is barely analysed in the scientific literature, recent studies’ main findings are detailed in this section.
Attention was turned to heat removal methods to cool information technology (IT) equipment and remove heat from the indoor environment. Evans et al., 2012 [34] investigated direct and indirect air methods, which rely on external conditions. Remarkably, the latter was pointed out as the primary means of cooling, and therefore making them more efficient was a requirement. The study aimed to support IT professionals with precision cooling solutions in line with objectives. Notably, the latter involved studies on chiller technologies whose capacities were collected in the present research. In addition, creating an ideal strategy for cooling processes was highlighted by Kapoor et al., 2013 [32]. A mixed-integer nonlinear model was used to estimate the optimal chiller loading strategy. The latter was not considered in the current study due to the hypothetical scenario which does not reflect the current energy market. Besides, Popov et al., 2019 [36] focused their study on cryogenic technologies used for industrial processes, highlighting the advantages of refrigerating food and pharmaceutical warehousing. Although the latter entails the industry sector, attention was turned to refrigeration applications, and therefore it has not been considered useful for this study. Also, with regards to performance and efficiency improvements of cooling fans, the best method to control the latter was proposed by Ko et al., 2019 [35] in their study. This work’s primary concerned Industry 4.0. In the latter, a significant number of digital data were used, and therefore data centres regularly handle this large number. Data centres are formed by several components: IT equipment, power systems, and cooling systems, which consume a notable energy amount. A proper method to reduce energy and improve the cooling systems’ temperature control performance was investigated in the paper. Best et al., 2013 [39] paid attention to promoting solar energy for cooling in the Agro-Food Industries (AFI). Throughout the simulated-construction model of a case study, they calculated energy savings of around 19% of the total FEC. Also, SURNA 2016 [42] defined the difference between comfort cooling and PC by stating that PC is less familiar to typical consumers. Mainly, the intended use of a PC is to process and remove large amounts of heat from a space, often using a chiller system. The latter is usually found in data centres, plastic injection moulding, airports, and hospitals.
Notably, the sources mentioned above face the topic of PC for certain technical issues, while almost no FEC quantification does. However, the latter provided insights into which types of cooling technologies are most applied in the industry sector: chiller (air-to-water) and chiller (water-to-water). The number of machinery types deployed in the PC sector was collected from the studies by Dittman et al., 2017 [34] and Fleiter et al., 2016 [16] per EU27+UK country [46]. Concerning energy efficiencies, Bertoldi et al., 2021 provided different energy efficiencies and peak capacities values for different types of chillers [25]. Regarding the operative hours of the cooling systems by which it is possible to obtain the yearly FEC, a different methodology apart from data collection was found crucial, presented in Section 2.2.

2.2. Methods

As mentioned above, to assess the PC FEC per technology and EU27+UK MS, a breakdown of vapour compression (VC) technologies, suggested by Dittman et al., 2017 [46] and presented in the Horizon 2020 (H2020) HRE4 project, was followed. The latter-mentioned source was assessed as the most reliable and precise study among scientific literature reports as well as providing data for the PC sector, and thus the classification for the given investigation for this work is as follows:
  • Chiller (air-to-water) < 400 kW;
  • Chiller (air-to-water) > 400 kW;
  • Chiller (water-to-water) < 400 kW; and
  • Chiller (water-to-water) > 400 kW.
It is necessary to mention that VC systems provide around 99% of the EU’s cooling needs. Regarding the thermally driven heat pumps (TDHPs), it should be noted that the actual market penetration is negligible compared to VC technologies [16,20]. Nonetheless, EUROVENT 2020 [31] data suggested that TDHPs account for around 1% of the EU’s cooling market. Based on the VC technology breakdown, further investigation of the PC cooling market was carried out by researching the following for the EU27+UK:
  • Number of installed cooling units;
  • Equivalent full load hours (EFLHs);
  • Installed capacity; and
  • Energy efficiency levels (Seasonal energy performance ratio-SEPR).
It is worth mentioning that, with regard to heat load, there is a lower dependence on outdoor temperatures for PC than SC. Therefore, evaluating the seasonal performance of PC equipment is linked to a different set of conditions than the Seasonal energy efficiency ratio (SEER)-Regulations (EU) 1095/2015 [47] and 2281/2016 [48]. The current metric is named the Seasonal energy performance ratio (SEPR). Like the SEER metric, factors such as heat rejection and chilled water temperatures can cause a high degree of variation in SEPR values. The primary advantage of the SEPR metric is that it allows for the comparison of performances on a more representative basis versus using standard rating conditions. Besides, the work input (electricity) for each cooling type was processed, and the average capacities for each PC equipment were categorized for each respective SEPR mean value. Moreover, to acquire dependable data, it is necessary to perform a detailed scientific literature review, although an insignificant amount of information on the PC sector was located. The identified information was filtered and statistically evaluated. The data which lay outside one standard deviation from the assessed data were removed. This analysis could not be performed for at least two data per value due to a lack of data. To conclude, the FEC for PC for each EU27+UK MS was calculated. To obtain the FEC for the year 2016, Equation (1) presents the product of the quantity (number-Nr.) of PC units and average EFLHs (time–T) within a year and the work input (W-electricity):
F E C c o o l i n g = N r u n i t s × T e q u i v a l e n t   f u l l   l o a d   h o u r s × W e l e c t r i c i t y
where:
  • Nrunits is intended as the number of installed units at EU MS, in the industry sector for a certain type of machinery for PC purposes;
  • Tequivalent full load hours are intended as the yearly (2016) operative hours of a certain PC system;
  • Welectricity is considered as the work input of the space PC system. Notably it is considered as the fraction of the system power capacity and its respective energy efficiency level. It is worth noting that electricity is the energy input that allows the cold as output.
The following text aimed to explain how EFLHs were calculated in four steps (i.–iv.), which is the core information for performing the calculations mentioned above.
In the present section, the calculation of the PC’s EFLHs was presented. The land surface temperature (LST) hourly profiles for a whole year (8760 h) at the NUTS2 level were used. A constant-linear-constant law was then applied to derive PC EFLHs [49]. The following points expressed the method in detail:
(i.)
The LST data were retrieved using the Copernicus Global Land Service [50]. The data collection was based on instantaneous observations. Therefore, the product was computed globally every hour and made available to the user within 4 h. The LST product user manual can be found in further detail [27]. Cloud cover and data consistency issues that affect the LST information were filtered, and only cloud-free areas were selected. Moreover, the CDD (cooling degree days) data were acquired at the NUTS2 resolution from the H2020 HotMaps project’s public repositories and were clustered into five different sets to fill incomplete data [28]. The clustering was performed using the k-means algorithm [51]. If no data were available for a defined hour (h) and a specific NUTS2 (NUTS2i), then the missing LST data was estimated by considering the median value of obtainable LST values (for h, i) according to its cluster.
(ii.)
The following measures were applied since data related to the elaborated temporal series were missing:
  • The missing LST values were identified.
  • The average value substituted the identified missing values, for the same hour of the day, before and after.
  • A 7-h window and a polynomial order equal to 2 were applied to the Savitzky-Golay filter [52], which was used to create a continuous LST time series.
(iii.)
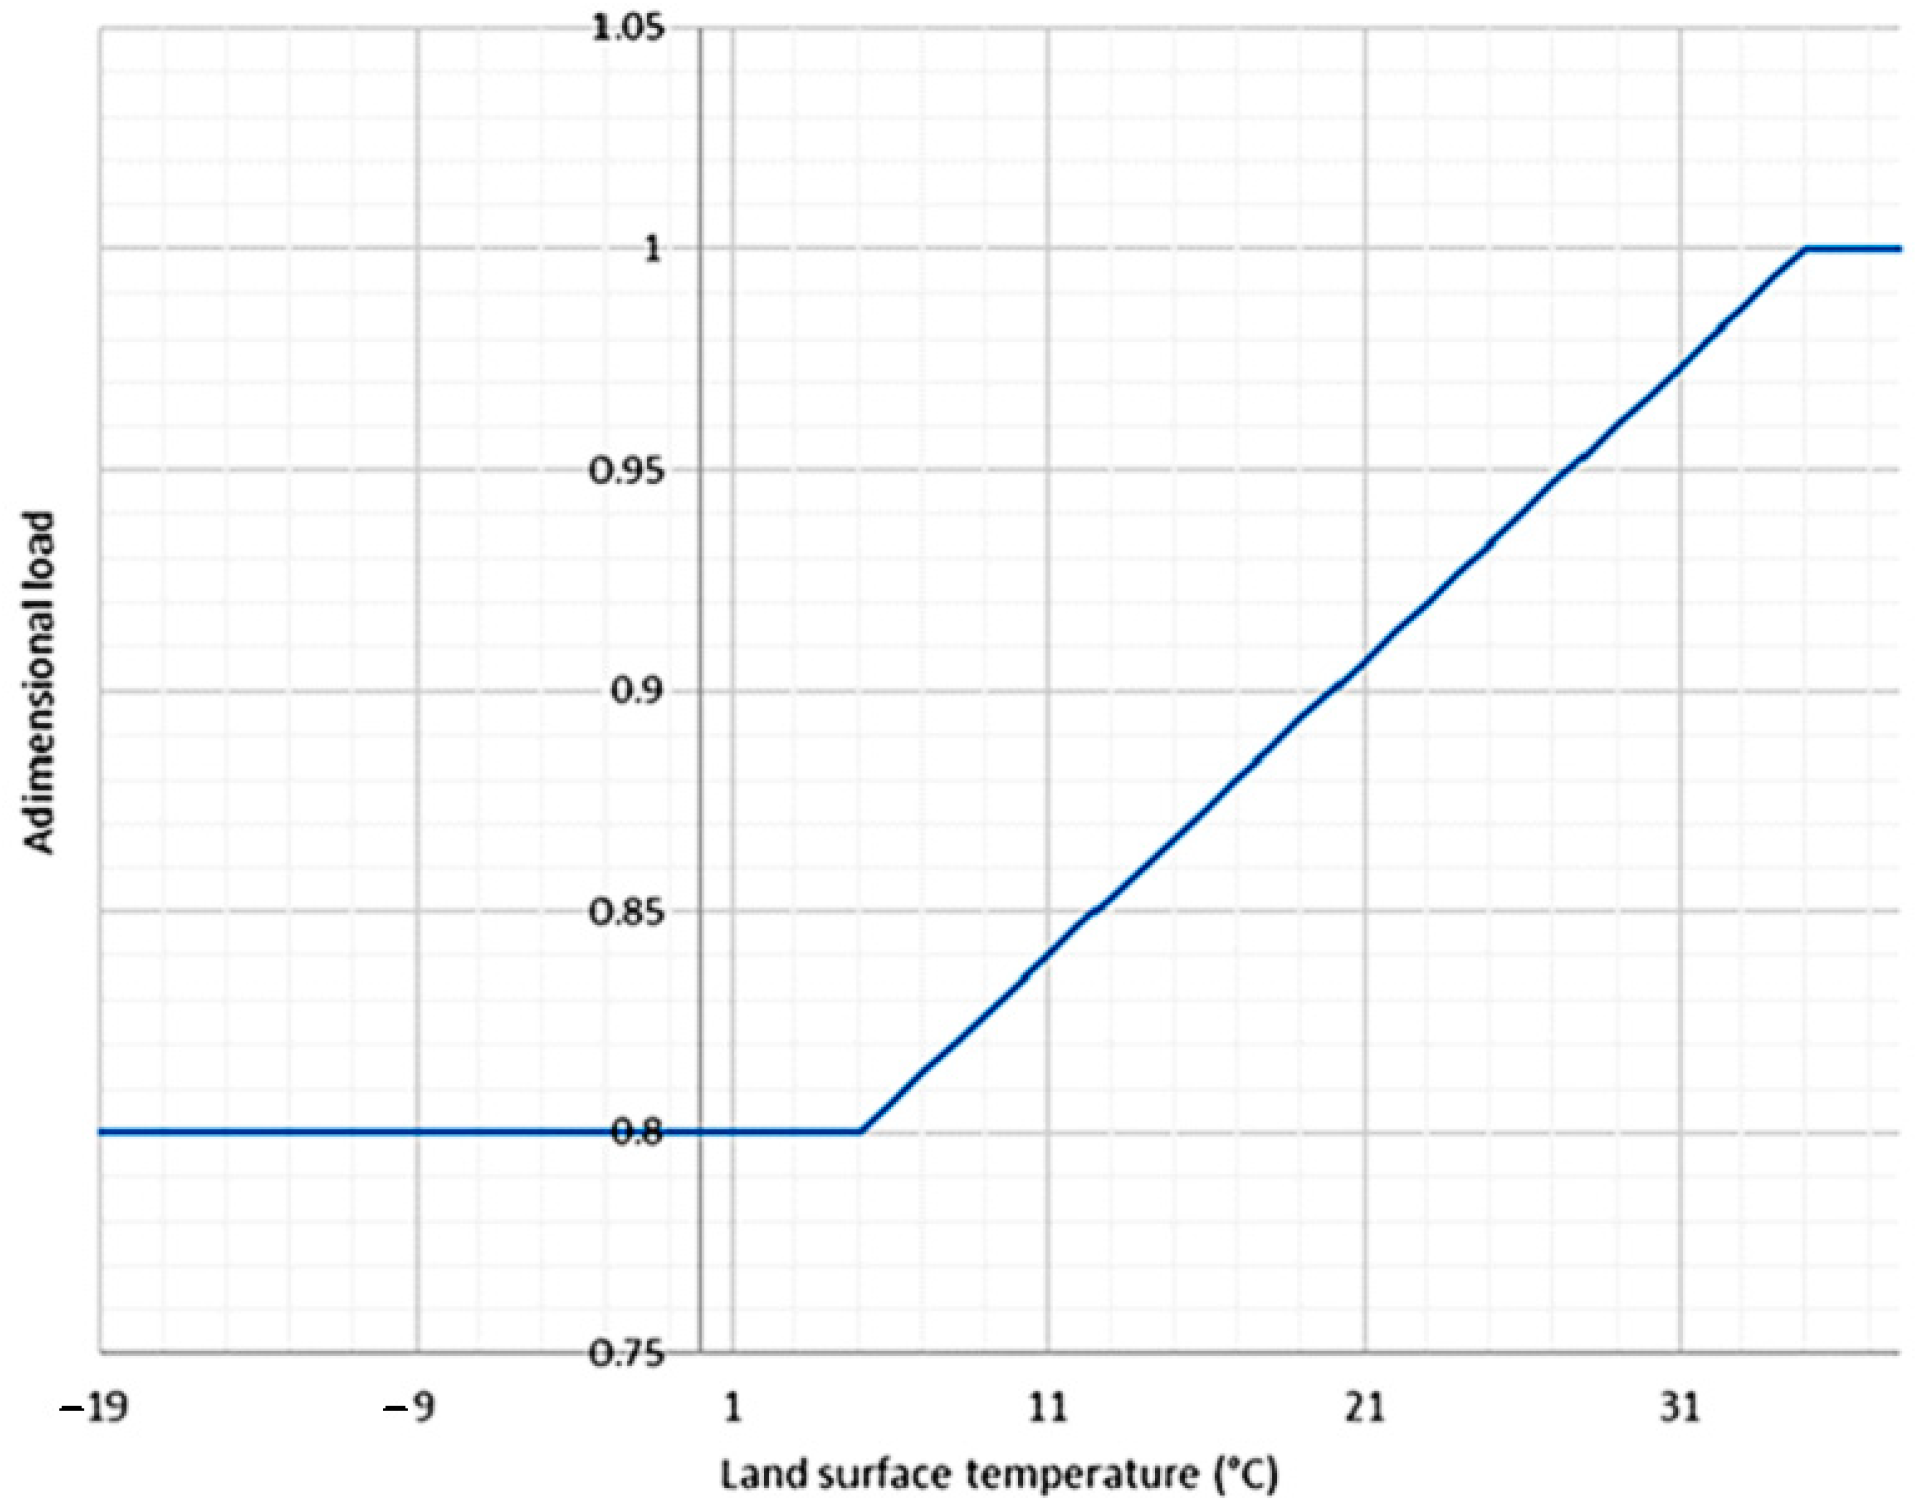
A complete hourly LST dataset was available at each (i) NUTS2 level (LSTNUTS2). These data were used to calculate a normalized hourly time series for each (i) NUTS2 (LOADNUTS2). A constant-linear-constant hourly load law was utilized, with LST (temperature and temperature levels) expressed in degrees Celsius (°C) as presented in Equation (2) [49] results in Figure 1.
L O A D N u t s 2 i = 0.8   i f   L S T N u t s 2 i < 5   ° C L O A D N u t s 2 i = 0.8 + 0.2 30   x   L S T 5   i f   5   ° C     L S T N u t s 2 i < 35   ° C L O A D N u t s 2 i = 1   i f   L S T N u t s 2 i > 35   ° C
(iv.)
Besides, by applying Equation (3) with 8760 (the number of hours in a year), the EFLHs at each (i) NUTS2 level (EFLHsNUTS2) were derived:
E F L H s N u t s 2 i = i 8760 L O A D N u t s 2 i
A national value for each MS was determined (EFLHsNational) upon the acquisition of the EFLHs values for each (i) NUTS2 region of the EU27+UK (EFLHsNUTS2). NUTS2 level values of the EFLHs (EFLHsNUTS2i) were weighed according to the gross domestic product (GDP) at each (i) NUTS2 level (GDPNUTS2i) since cooling can be linked to GDP, according to Equation (4) [53].
E F L H s N a t i o n a l = i ( E F L H s N u t s 2 i × G D P N u t s 2 i ) G D P N a t i o n a l
The PC sector’s EFLH results at the MS level for the EU27+UK are shown below. Moreover, the average European value was calculated by weighing all national EFLHs using national GDP. The SEPR values were retrieved by following the methods described in the European Standards EN 14825 [49].

3. Results

According to Figure 2, chiller (air-to-water) < 400 kW accounted for most PC units per type with almost 0.5 mil. installed devices; followed by Chiller (water-to-water) < 400 kW, with around 0.08 mil. units. Then, chiller (air-to-water) > 400 kW and chiller (water-to-water) > 400 kW came next with about 0.06 and 0.03 mil. units each.
Moreover, Figure 3 shows the average installed capacity per PC in kW.
According to Figure 3, chiller (water-to-water) > 400 kW resulted in the largest installed mean value: more than 700 kW, followed by Chiller (air-to-water) > 400 kW with about 600 kW. Then, it was chiller (water-to-water) < 400 kW with a value greater than 160 kW. Chiller (air-to-water) < 400 kW resulted in having an average installed capacity greater than 130 kW.
Figure 4 demonstrates a visual description of the SEPR values.
It is worth mentioning that the chiller (water-to-water) > 400 kW resulted as the most efficient PC technology with an SEPR value equal to 7.5. Chiller (water-to-water) < 400 kW ranked next with an SEPR value of 6.5. Chiller (air-to-water) > 400 kW then followed the previous one with a value of 5 and, finally, chiller (air-to-water) < 400 kW came in as the least efficient technology with an SEPR of 4.5. The electricity input values were calculated in kW using average capacities and SEPR values per PC type.
Besides, Figure 5 presents information concerning the equivalent full load hours (EFLHs) of the EU27+UK’s industrial sector per country.
As shown in Figure 5, the EFLHs of the EU27+UK’s industrial sector were all over 7000. Malta and Cyprus provided peaks. Spain, Portugal, and Greece led all countries. There are no significant differences among the EFLHs of European states, with the exception of Malta and Cyprus, which have higher values than the industrial sector means (about 7450 EFLHs-please see the horizontal line in Figure 5 above).
Furthermore, integrating the values, MS by MS, from Figure 1, Figure 2, Figure 3, Figure 4 and Figure 5, in Equation (1), results in Figure 6 and Table 1.
As shown in Figure 6 and Table 1, the most energy-intensive PC type was chiller (air-to-water) < 400 kW with more than 41 TWh/y. The next most energy-intensive PC type was chiller (air-to-water) > 400 kW with almost 40 TWh/y. Chiller (water-to-water) > 400 kW came next with nearly 20 TWh/y and, finally, chiller (water-to-water) < 400 kW was last with almost 9 TWh/y. The total amount of final PC consumption in Europe’s industrial sector was estimated to be greater than 110 TWh/y.
Lastly, Figure 7 and Table 2 show the FEC PC share per EU MS.
As shown in Figure 7 and Table 2, just a few MSs made up most of the PC FEC for the entire EU27+UK. Italy, France, Spain, Germany, United Kingdom, Netherlands, Greece, Poland, Belgium, Austria, Sweden, Cyprus, Hungary, Finland, and Portugal accounted for more than 90% of the EU27+UK PC FEC. Thus, the remaining 13 countries accounted for the remaining 10%.
The calculation used to estimate the contribution of PC in the EU27+UK included chiller (air-to-water) or chiller (water-to-water) with more or less than 400 kW capacity installed applied to the industrial sector. These chiller’s central applications are pharmaceutical, automotive, plastic, bakeries, and process industries related to construction, such as cement, plastic, and glass industries, and the fish and meat industries. In addition, process chiller technology began to be used in close control technologies, such as computer and network rooms in banks, company headquarters, and government departments, for the cooling of IT equipment [57,58,59,60].
Nevertheless, different other technologies were utilized for PC purposes in different sectors and subsectors, not solely the industrial sector [58,59,60,61,62,63]. It follows Table 3, regarding VC technology’s further applications in various sectors and subsectors.
Moreover, in Appendix A, Table A2 provides a complete list by entailing non-VC technologies and different sectors, subsectors, and processes.
It is worth mentioning that the FEC PC values present in each sector and subsector are significant. For instance, Castellazzi et al., 2017 [69] indicated that the FEC for cooling in European data centres was greater than 40 TWh/y [70,71,72]. However, due to missing data, the quantification of the FEC for PC in the EU27+UK in the sectors and subsectors specified in Table 3 and Table A2 was not possible at a greater detail. Besides, regarding the agriculture sector, PC applications are getting a more and more critical need [70,71,72,73].

4. Discussion

This study assessed the FEC for the PC sector for the reference year 2016.
While in the H&C sector, SH and DHW were widely investigated in academic literature, PC remained mostly unexplored, and very little information was found regarding the sector. The most essential sources were Copernicus Global Land Operations, which provided LST data, and the H2020 HotMaps project for CDD. The latter was critical for the calculation of the EFLHs. Simultaneously, the study by Dittmann et al., 2017 [46], included in the H2020 HRE4 project, had the highest accuracy for data on the number of cooling units and installed capacity for the PC sector for the EU27+UK. Moreover, the SEPR values were acquired using the calculation methodology indicated in the European Standards EN 14825 [49].
The input data gathered from the above sources were used for Equation (1), which was used to calculate the PC FEC for the EU27+UK, resulting in more than 110 TWh/y in 2016. The EU27+UK countries, listed from the most to least energy consuming, were Italy, France, Spain, Germany, United Kingdom, Netherlands, Greece, Poland, Belgium, Austria, Sweden, Cyprus, Hungary, Finland, and Portugal. They accounted for around 90% of the total FEC, while the other 13 countries made up the remaining 10%.
These calculations mainly entailed chiller (air-to-water) or chiller (water-to-water) equipment with more or less than 400 kW capacity installed since their applications can be found in several industries such as automotive, plastic moulding, pharmaceutical, bakeries, and process industries related to construction, such as cement, plastic, and glass industries. However, several other sectors and subsectors utilize PC in their processes, such as wineries, tobacco, paper, pulp, and printing. In the tertiary sector, PC is utilized, among others, in telecommunications, warehouses, supermarket freezers, and cells and, most importantly, in data centres for electronic equipment cooling. However, the latter mentioned sectors (industry as well as tertiary) involve cooling equipment technologies, such as small split (<5 kW) and big split (>5 kW), packaged, rooftop, VRF, and packaged computer room air conditioners (CRAC), and thus have been excluded from the EU27+UK FEC calculations. The latter also applies to the agriculture sector. It is worth mentioning that the FEC values indicated above do not entail freezing since being out of this study’s scope. Therefore, it has not been included in the present work. Overall, in Appendix A, Table A2 provides a complete and precise list by entailing non-VC technologies and different sectors, subsectors, and processes. Potential future studies on this topic might include cooling technologies other than VC for each sector and subsector and refrigeration, although data and information are few. Moreover, regarding the data centres sector, it has to be underlined that the EU27+UK FEC for PC is rapidly growing in need, mainly due to the significant growth of this field [72]. In 2016, the whole EU27+UK industrial sector consumed around 1155 TWh/y of electricity [74,75,76,77]. PC accounted for almost 10% of the total electricity consumption. Moreover, final energy consumption affects the prices of the consumables, goods, and services since the electricity (specially purchased from other states) utilized for powering the PC technologies in the industry sector influences the inflation of the prices in a certain country. As described in Section 1, the work by Fleiter et al., 2016 [16] computed that the FEC for PC results fell approximately a limit from 100 to 160 TWh/y [25]. The current research positioned its outcome in that range with a certain value (approximately 110 TWh/y). The results indicated that cooling equipment producers are vital to market participants and that there is a need for higher-quality datasets of the technical parameters of their products. Gathering information from the private sector is often impeded by accessibility issues [78], and smoother accessibility is necessary for research purposes.
The current research was positioned in a context where the aggregation of escalating temperatures, evolving industrial processes, and the increase in demand for goods by the population due to a rise in welfare throughout the EU27+UK, resulted in an increase in PC energy requirements. The PC sector is not a statistically modest operator of electricity; instead, it is an improving sector that provides almost 10% of the general electricity consumption of the whole EU27+UK industrial sector. Therefore, in terms of policies, the EU and its Member States aim to improve the connection between RES and the PC sector under Article 7 (3) of the 2018 Renewable Energy Directive through the renewable cooling calculation methodology, as presented in Section 1. The “renewable cooling” topic is still under development both in terms of definition and quantification. Particularly, regarding the latter, the current paper played an important role as input for understanding how much energy the EU27+UK industry sector spent in 2016 [13].
Lastly, in terms of possible recommendations, cooling in industry, as previously mentioned, entails a large part of the FEC in the EU27+UK, and therefore it can be considered a potentially useful sector for decarbonization. Renewable energy technologies can be better linked to the latter, as well as energy efficiency can be further implemented in the type of machinery utilized in the processes. The combination of new carbon-free technologies with an improvement in the energy efficiency of the current ones can significantly reduce the dependency on the fossil fuel energy supply of the EU27+UK.

5. Conclusions

This section summarizes the primary outcomes of the study. with the European final energy consumption for process cooling in 2016 being the most significant result. Moreover, the present research aims to increase research on the largely unexplored subject of process cooling which can contribute to the assessments for the coming sustainable pathways that the European Union is going to meet in the upcoming decades. The following bullet points are the major findings discovered throughout the present research on the process cooling sector:
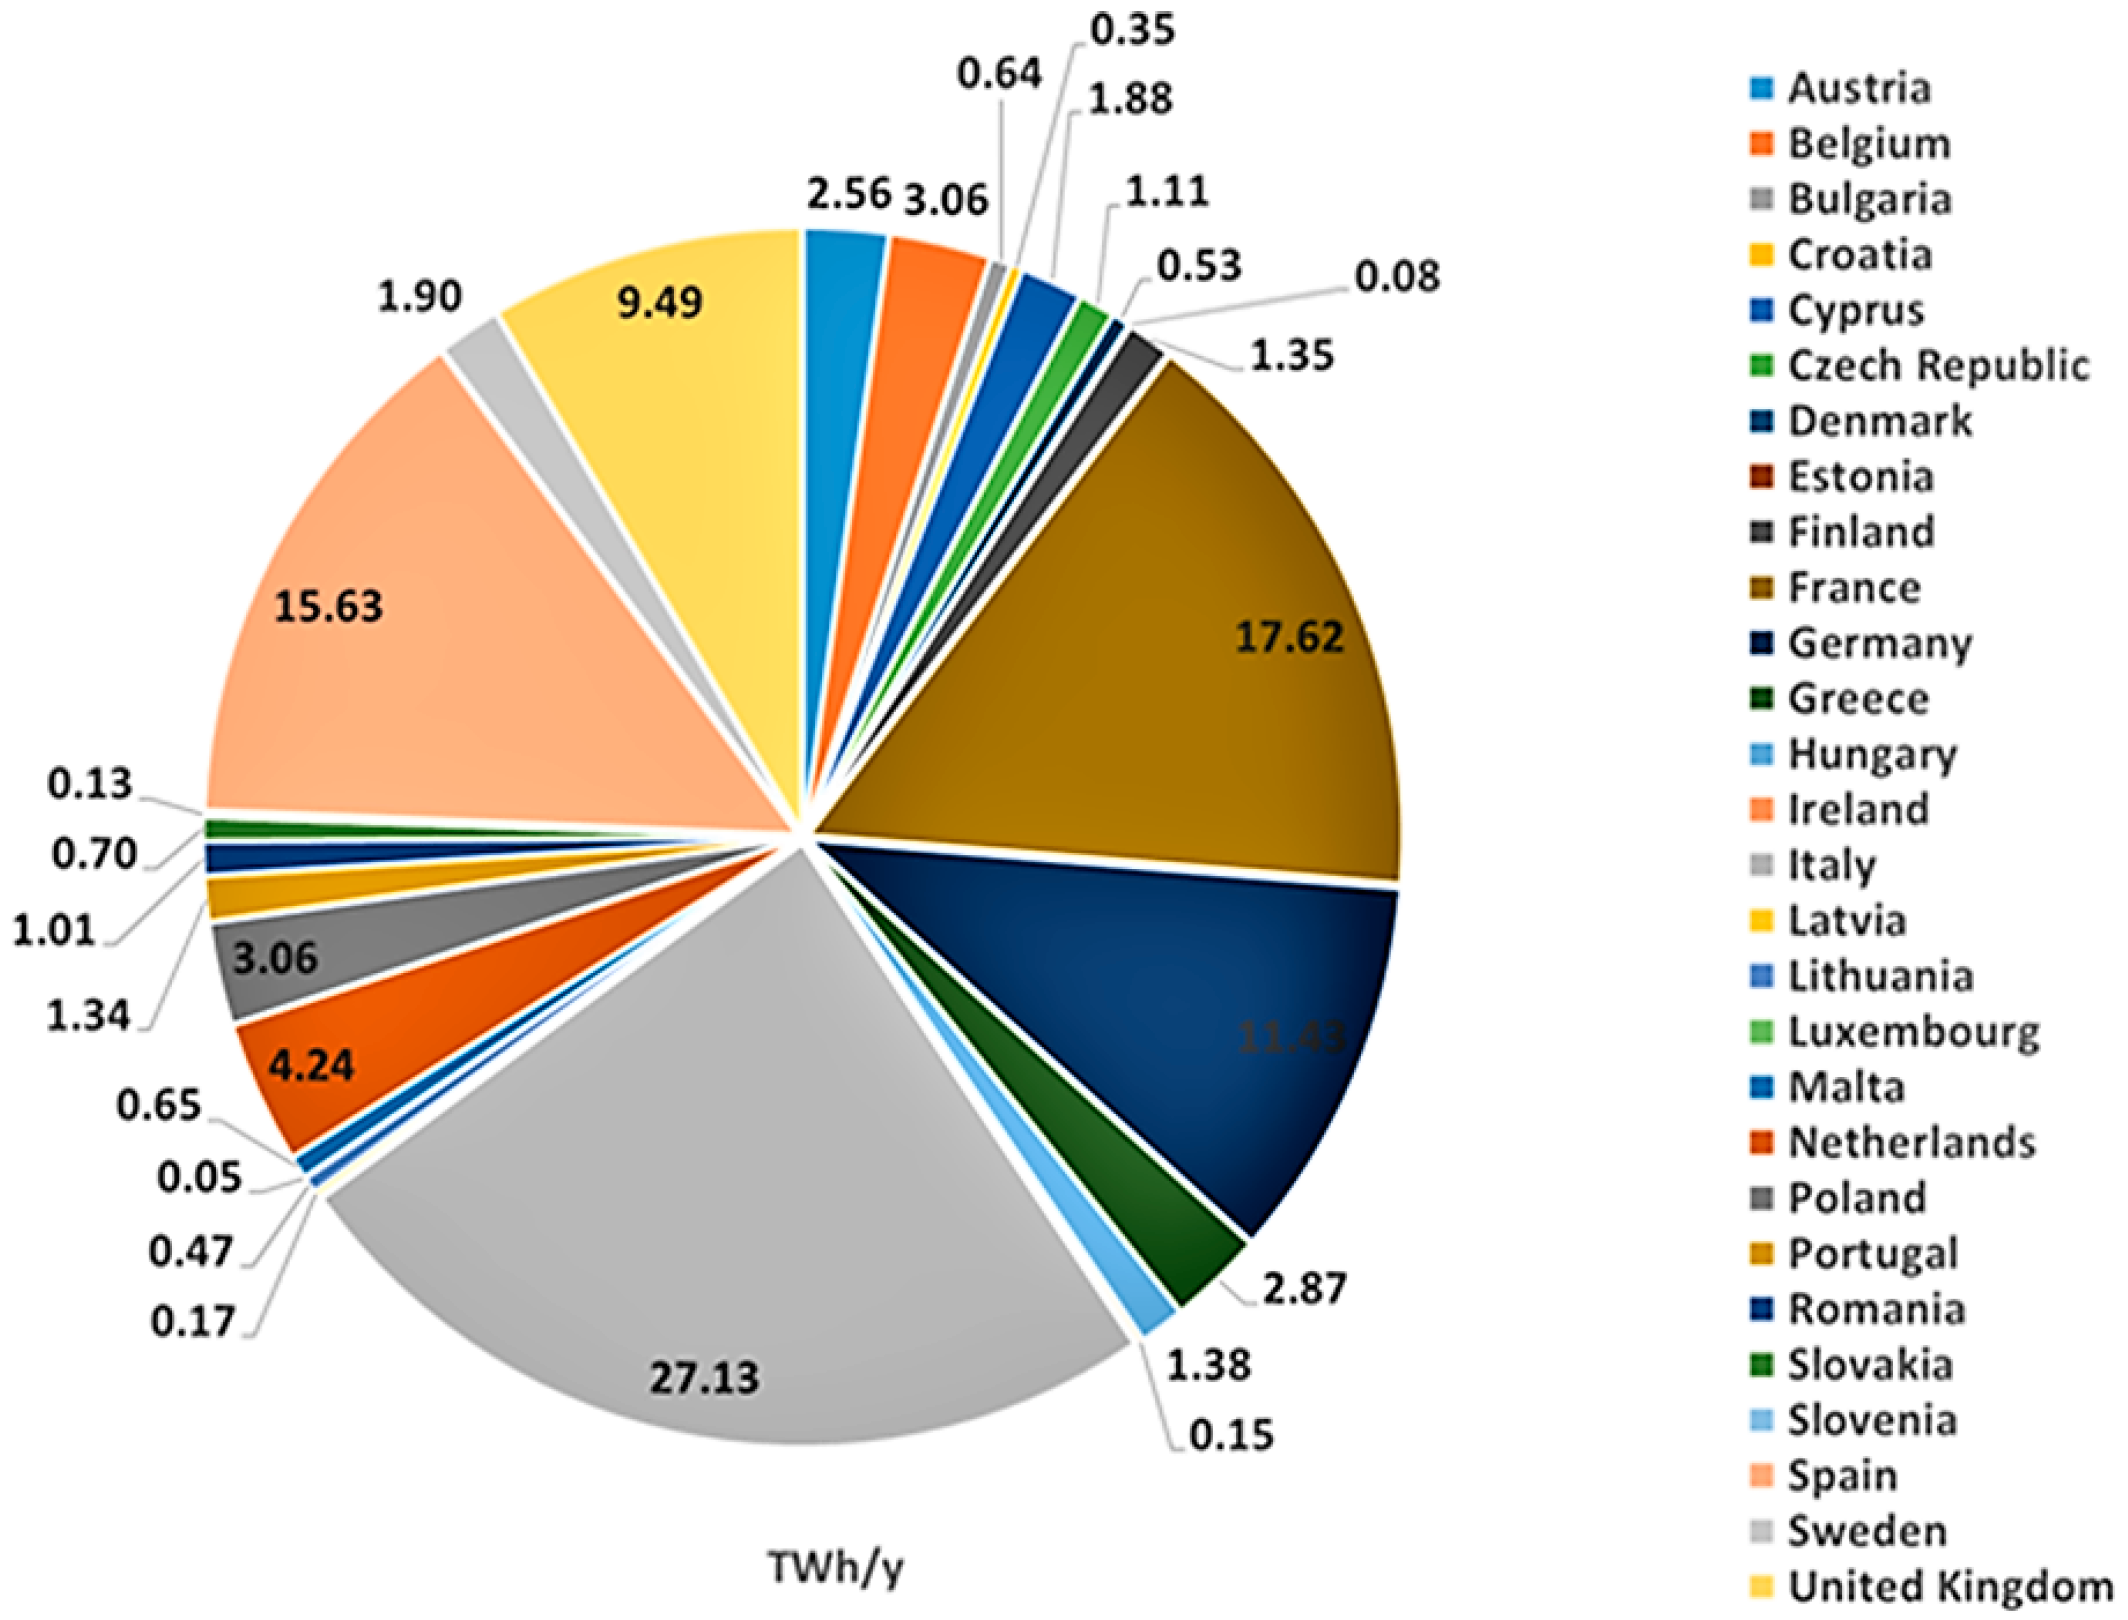
  • The final energy consumption in the European process cooling sector accounted for more than 110 TWh/year. It is important to state that around half of the European member states make up nearly the entire final energy consumption for process cooling. Notably, the highest percentage, which is about 90%, is detained by Italy, France, Spain, Germany, the United Kingdom, Netherlands, Greece, Poland, Belgium, Austria, Sweden, Cyprus, Hungary, Finland, and Portugal. The remaining 13 member states share the residual of 10%.
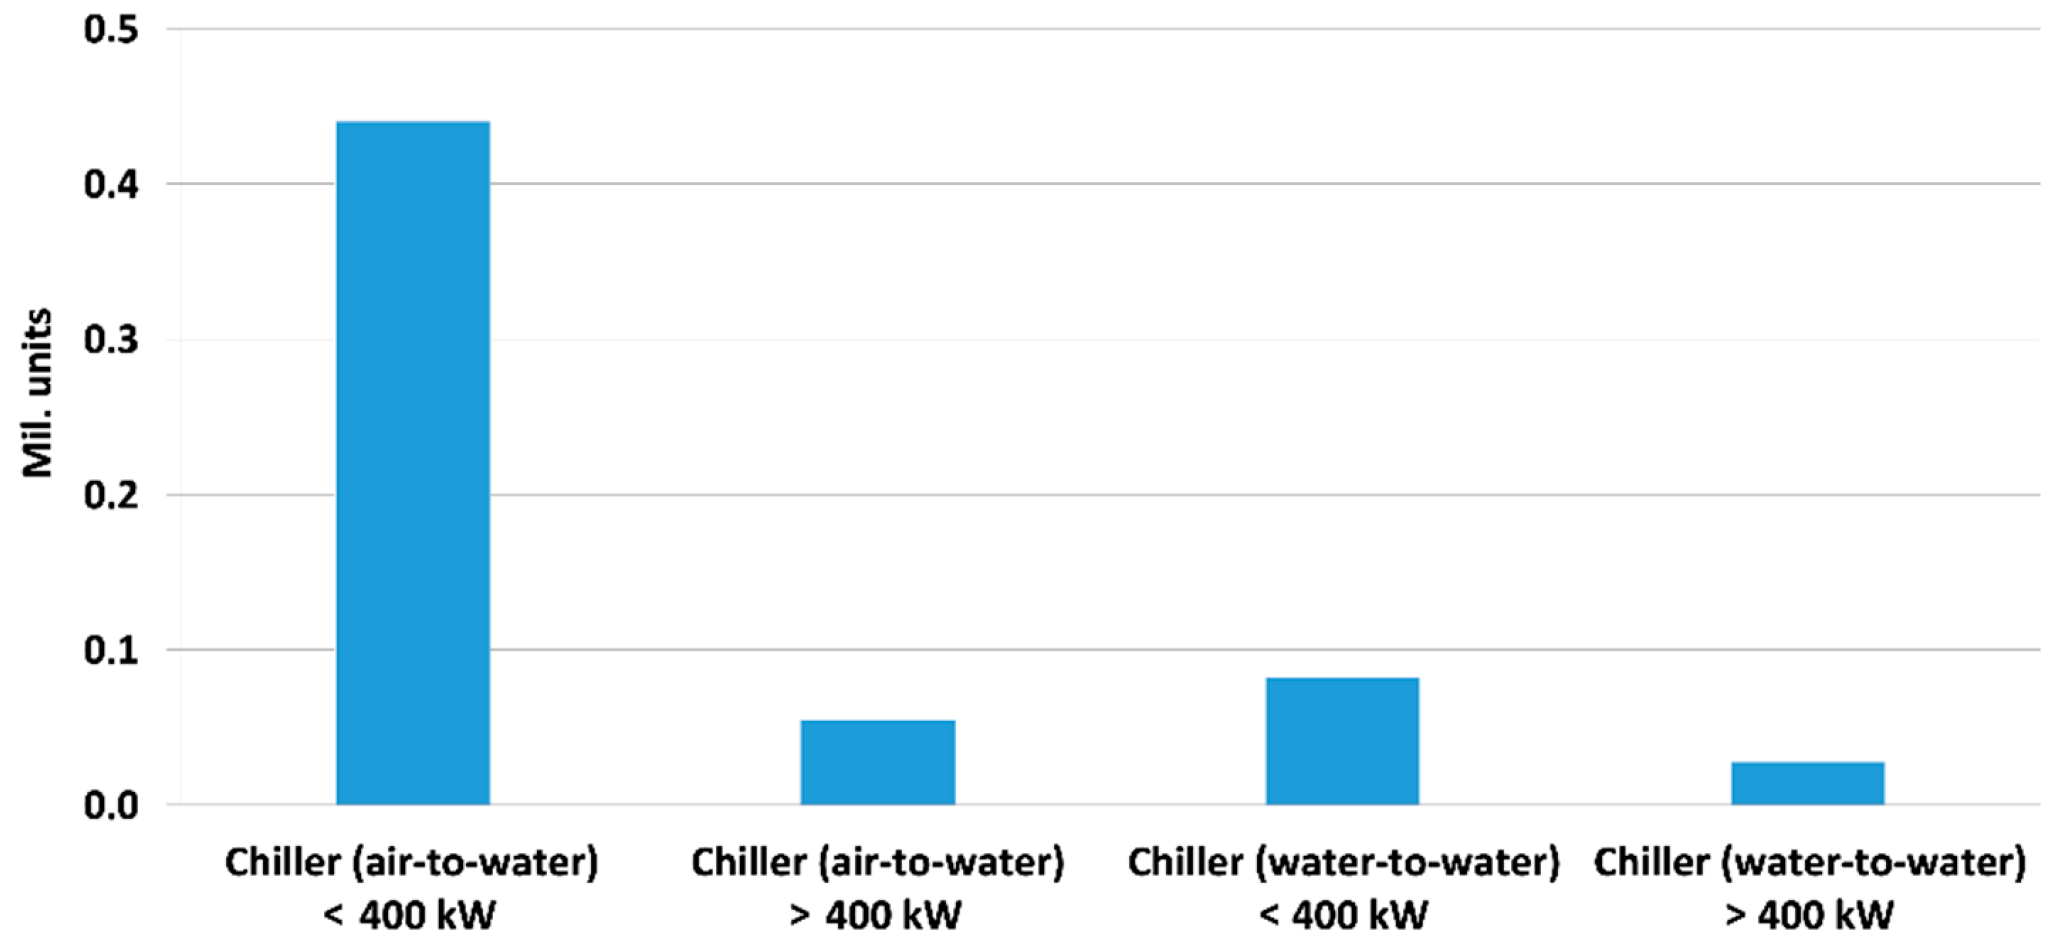
  • In regard to the applied cooling technologies in the process cooling sector, chiller (air-to-water) < 400 kW accounts for the greatest part of the European process cooling sector with almost 0.5 million installed devices.
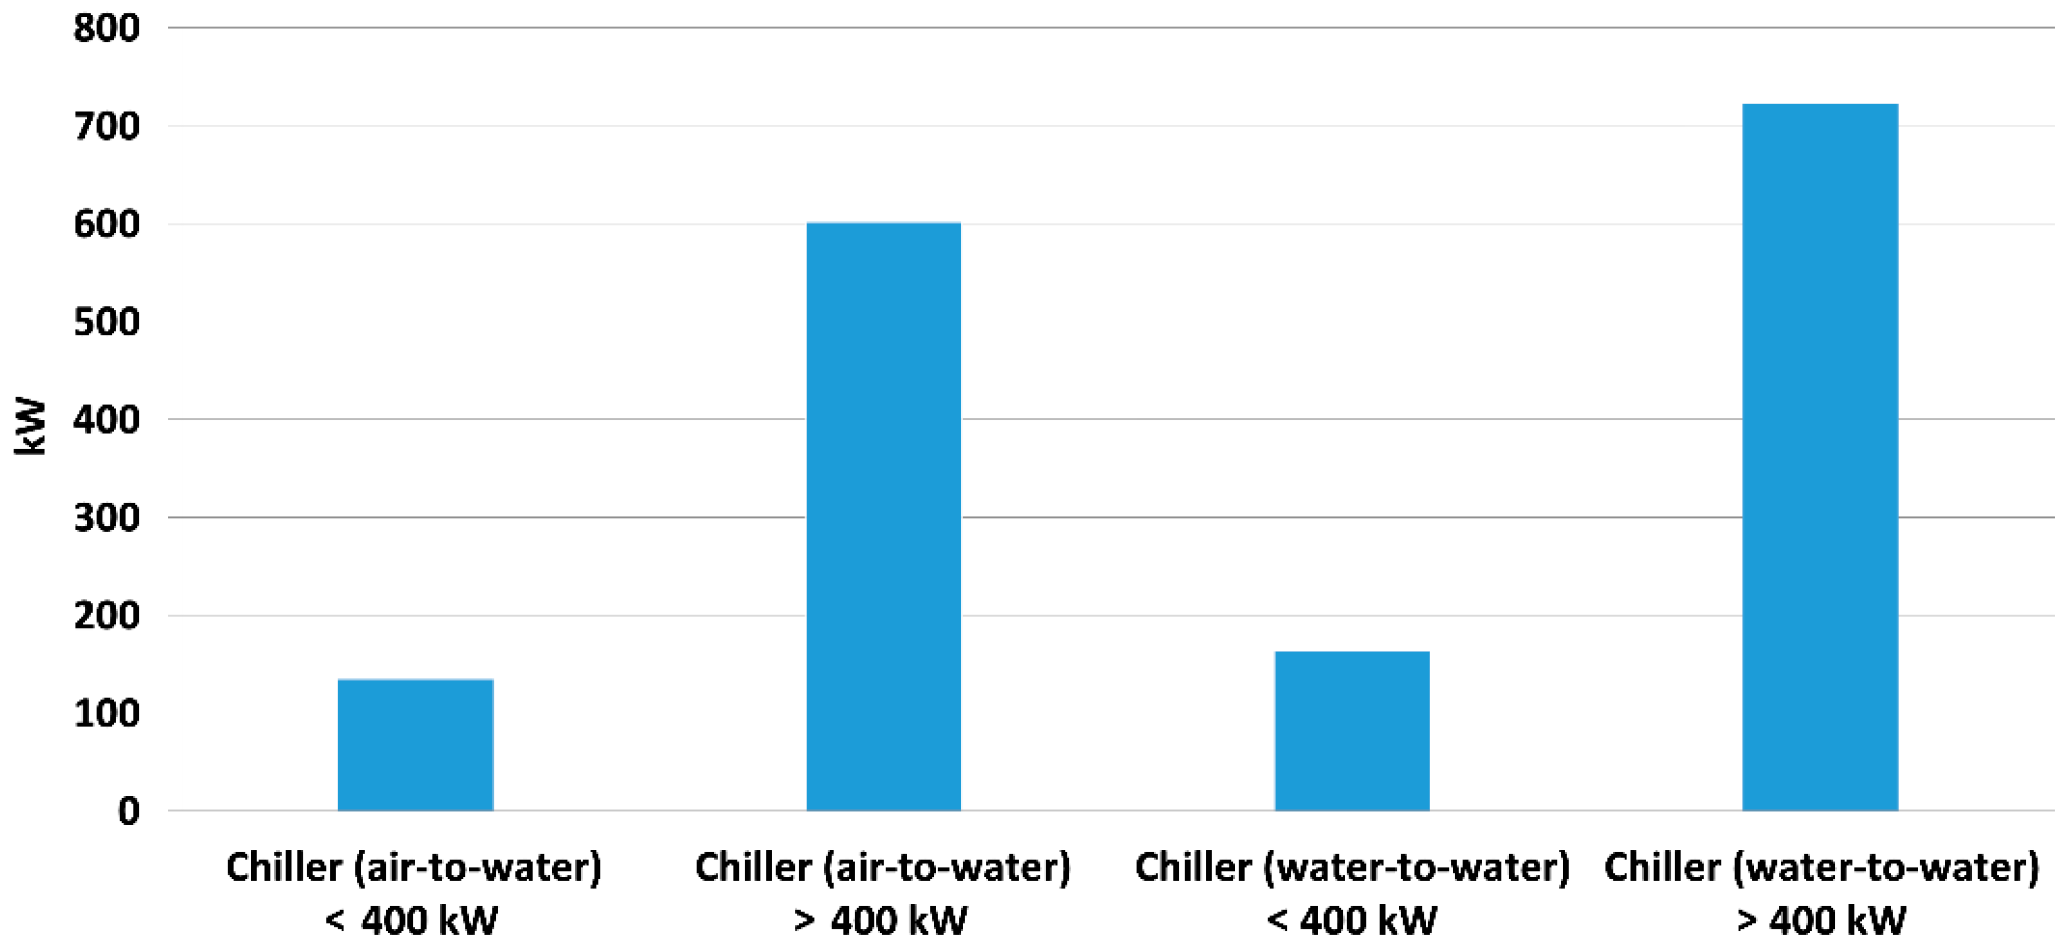
  • Moreover, chiller (water-to-water) > 400 kW results in having the most considerable installed mean value with more than 700 kW.
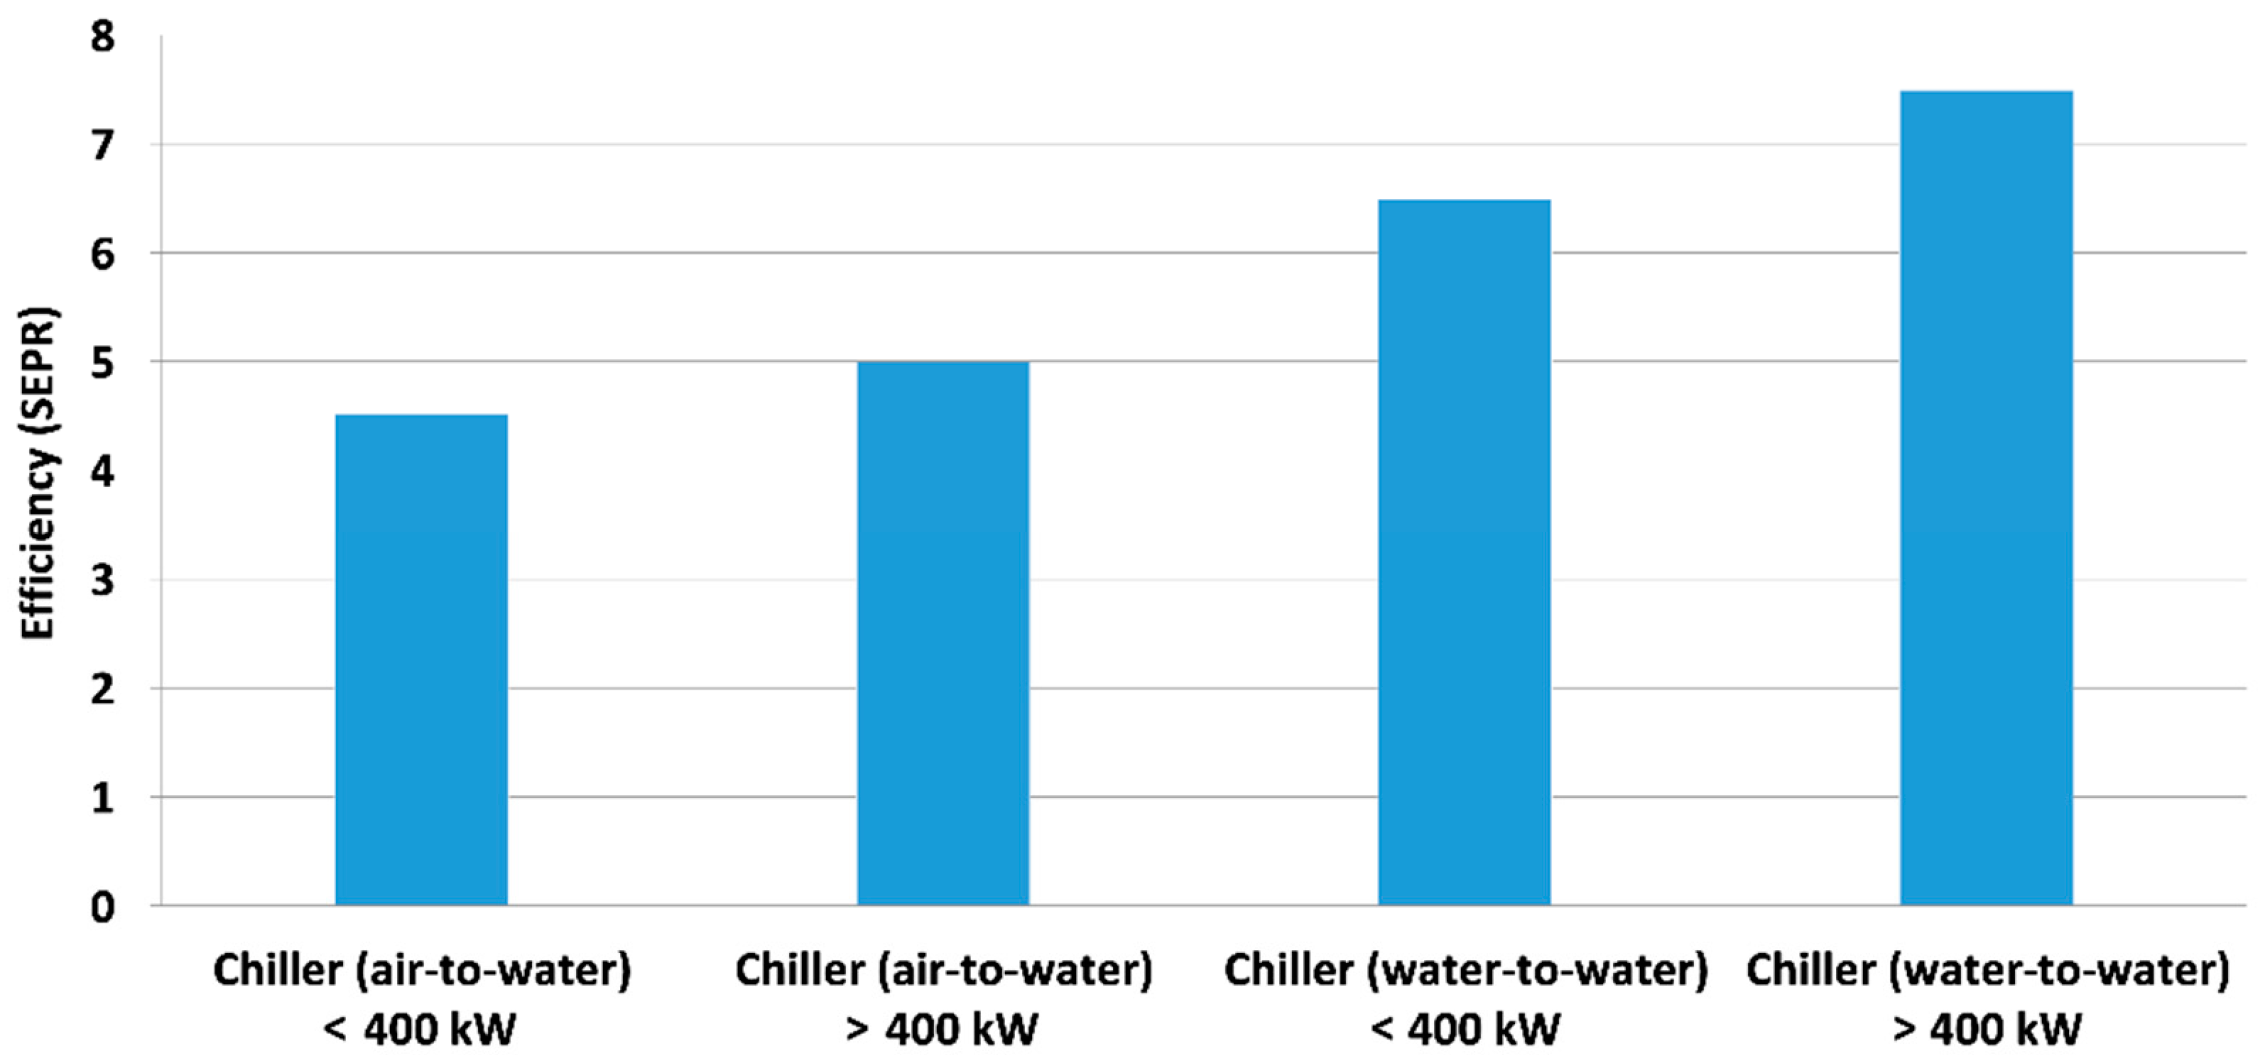
  • In addition, the most efficient process cooling technology type in this study emerges to be chiller (water-to-water) > 400 kW with a seasonal energy performance factor value of 7.5.
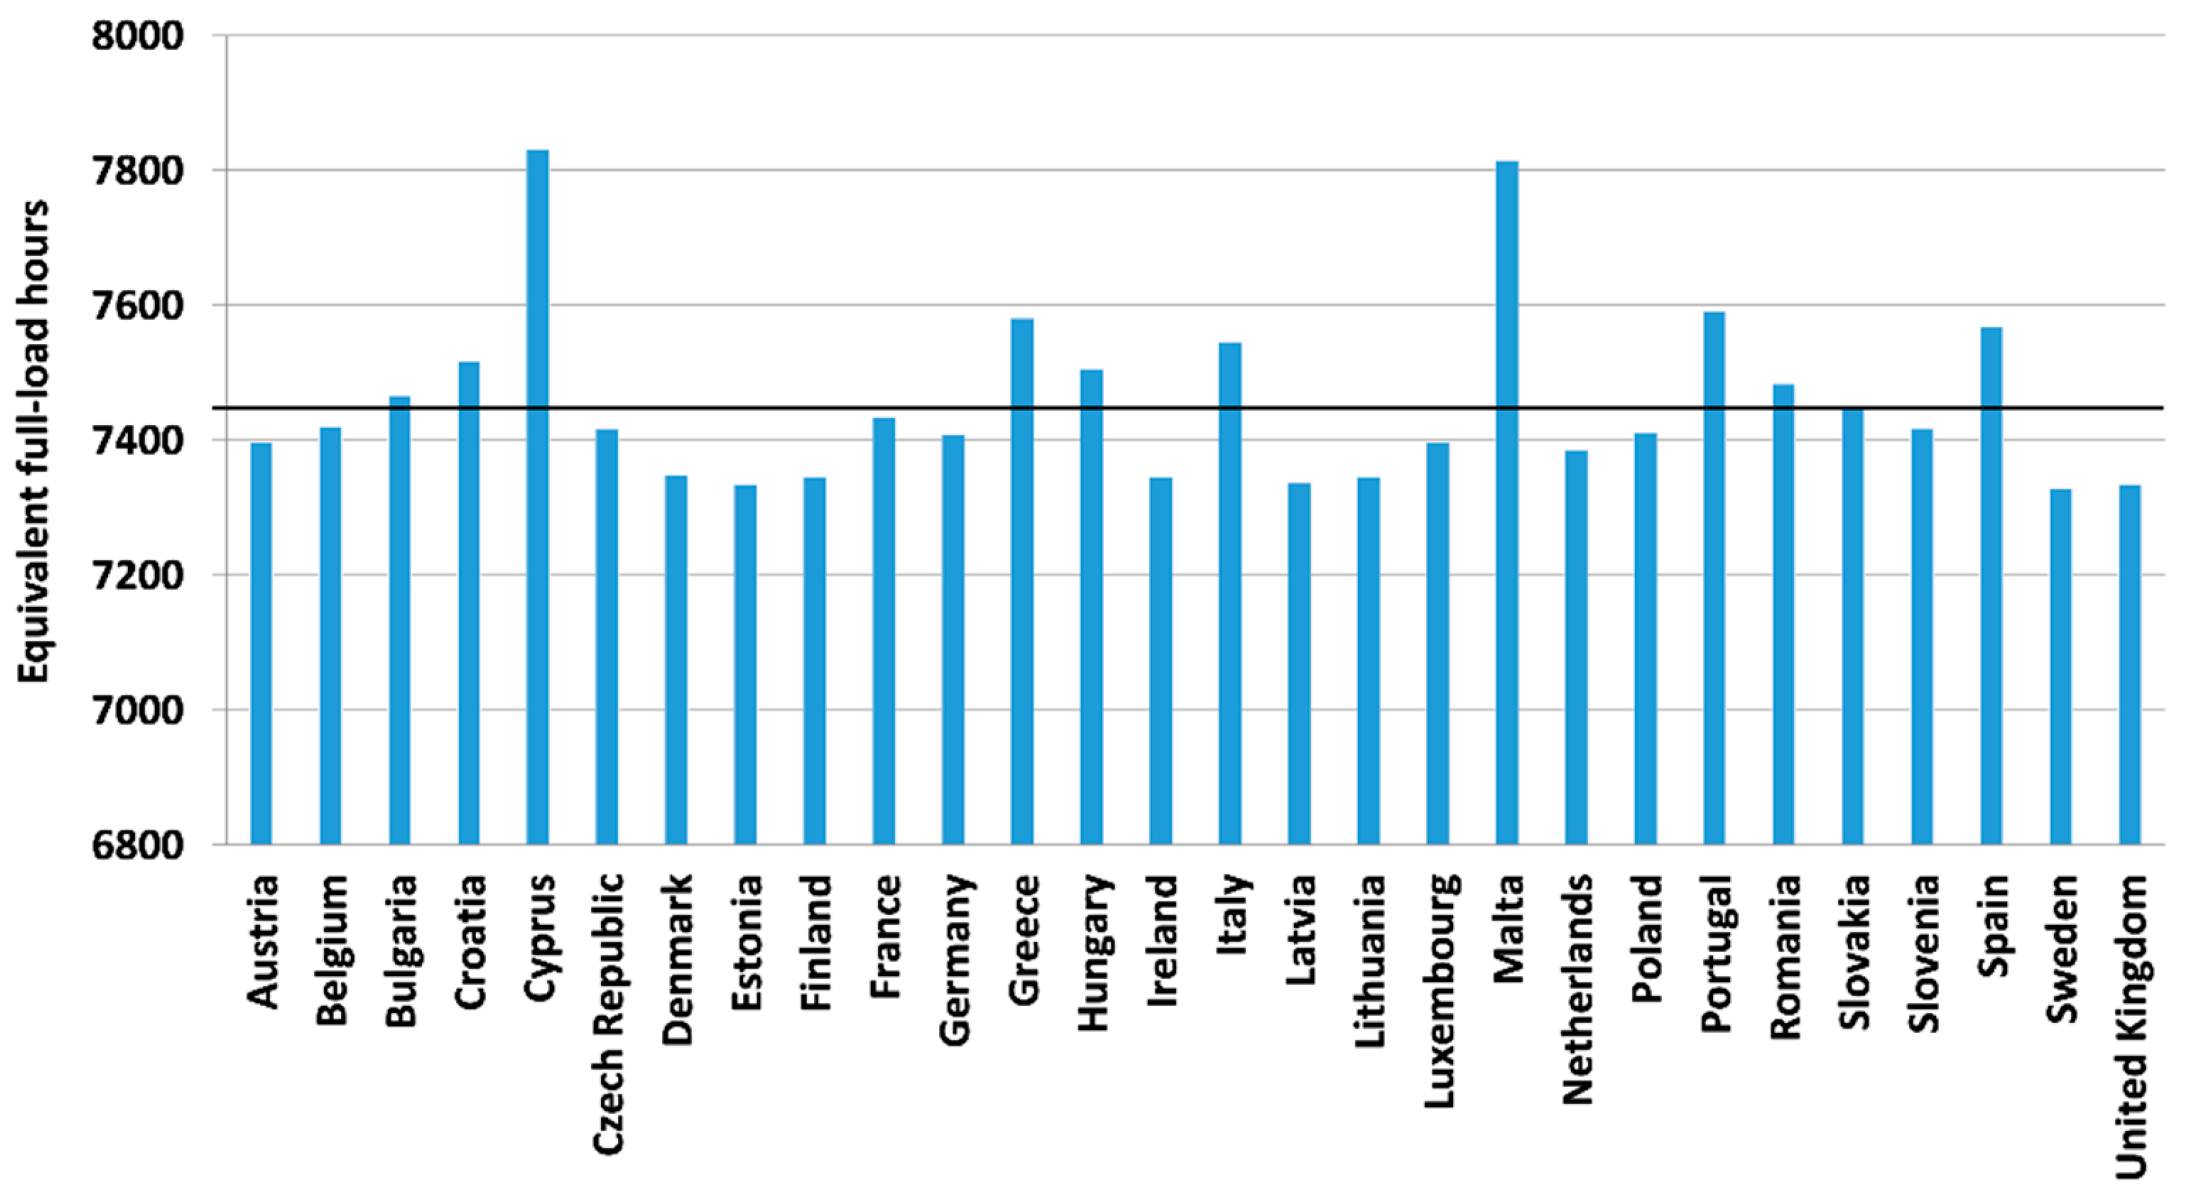
  • Lastly, the EFLH of the industrial sector are all over 7000 for each European member state, particularly with peaks reached by Cyprus and Malta.
It is worth stating that the given study encountered significant issues retrieving data and information since data and information was not available or fragmented, contained outdated information, or were inaccessible. The data assembly at the core of the study and its insights showed specific limitations, which were the result of the assumptions mentioned in Section 2. Improved accessibility, reliability, and comparability of data and information on cooling are auspicial in the future, supported by private companies as well as the public sector, on which the funding for further research on process cooling will be a common object of study by the scientific community.
To conclude, it would be interesting to discover the extent that process cooling in the European Union influences the employment rate in the industrial sector since energy expenditures surely influences the final prices of the products. Again, it would be significant to understand its influence on the European Union’s severe weather occurrences’ impact on the development of the process cooling market. An absence of accurate information was disclosed by the authors regarding this possible research topic.

Author Contributions

Conceptualization, S.P., L.K., P.R. and G.Q.; Data curation, S.P., G.Q. and A.Z.; Writing, G.Q and S.P.; Supervision, P.R. and L.K.; Validation, P.R., L.K., L.B., A.N. and E.W. All authors have read and agreed to the published version of the manuscript.

Funding

This research was financed by the Directorate-General for Energy of the European Commission, service contract number ENER/C1/2018-493/SI2.813961.

Institutional Review Board Statement

Not applicable.

Informed Consent Statement

Not applicable.

Acknowledgments

We are thankful to Amy Segata (Eurac Research) for contributing to the elaboration of the figures of the study. The authors thank the Department of Innovation and Research of the Autonomous Province of Bozen/Bolzano for covering the Open Access publication costs.

Conflicts of Interest

The information and views set out in this article are those of the author and do not necessarily reflect the official opinion of the European Commission.

Appendix A

Table A1. Nomenclature.
AcronymName
ACAir conditioning
ASHRAEAmerican Society of heating, refrigerating and air-conditioning engineers
CACsCentralized air-conditioners
CDDCooling degree day
DCDistrict cooling
DHWDomestic hot water
EEAEuropean Environment Agency
EEDEnergy Efficiency Directive
EEREnergy efficiency ratio
EFLHsEquivalent full load hours
EqEquation
ETSEmission trading system
EUEuropean Union
FECFinal energy consumption
GHGGreenhouse gas
H&CHeating and cooling
H2020Horizon 2020
HDDHeating degree day
IDSIntegrated surface database
NUTSNomenclature of territorial units for statistics
PCProcess cooling
R&DResearch and development
RACsRoom air-conditioners
REDRenewable energy directive
RESRenewable energy sources
SCSpace cooling
SEPRSeasonal energy performance ratio
TDHPThermally driven heat pump
UEDUseful energy demand
VCVapour compression
VRFVariable refrigerant flow
WhWatt-hour
Table A2. Sectors, subsectors, processes, and technologies utilized for process cooling purposes.
SectorSubsectorProcessTechnology
INDUSTRYFood & Beverages dataFreezeMechanical vapour compression freezing [79]
Cryogenic freezing [79]
Cold StorageMechanical vapour compression refrigeration [80]
Cooling of productsAbsorption (TDHP) [81]
CondensationCryogenic freezing process [82]
RefrigerationRapid evaporative cooling (Vacuum systems) [83]
WineriesAmbient air coolingChiller (water-to-water) [14]
HumidificationEvaporative cooling [84]
Ambient air coolingAbsorption (TDHP) [85]
Small split (>5 kW) and Big split (<5 kW) [64]
TobaccoAmbient air controlPackaged [65]
Cooling hydrocarbon rundownCooling tower [86]
Shall and plate heat exchanger [86]
Plastic mouldingSystem or infrastructure coolingChiller (air-to-water) [87]
Evaporative cooling [88]
Plastic machine cooling–Hydraulic coolingChiller (water-to-water) [83,84]
Chiller (water-to-water) [83,84]
Plastic mould or tool coolingChiller (air-to-water) [83,84]
Chiller (water-to-water) [83,84]
Plastic product coolingChiller (air-to-water) [83,84]
Chiller (water-to-water) [83,84]
Iron & SteelWater coolingCooling tower [89]
Waste gas energy recoveryWaste gas cooling plant Hisarna process [90]
Cooling plants for converter waste gases oxygen steel plants [90]
Sinter cooler for energy recovery sintering plants [90]
Waste heat boilers in coke dry quenching plants [90]
Cooling stack for Hismelt plants [90]
AutomotiveTemperature control of laser machinesChiller (air-to-water) [91]
Chiller (water-to-water) [91]
Thermostatic control of painting bathsChiller (air-to-water) [91]
Chiller (water-to-water) [91]
CementCompressors coolingChiller (air-to-water) [92]
Heat neutralizationChiller (air-to-water) [92]
Cooling of excess gasesCooling tower [93]
GlassBlowingBlowers (ventilation) [94]
Paper, pulp, and printingCooling of printing machineryMechanical ventilation [95]
Evaporative cooling [95]
Packaged [96]
PharmaceuticalPreservation of thermolabile materialsEvaporative cooling [97]
Absorption (TDHP) [63,94]
TERTIARYTelecommunicationsShelter coolingNatural convection [98,99]
Vortex tube [99]
Small split (<5 kW) and Big split [67]
Internal racks coolingMechanical ventilation [99]
WarehousesAmbient air coolingEvaporative cooling [76]
Mechanical ventilation [100]
Adiabatic coolingAdiabatic cooling [100]
Ambient air coolingVariable refrigerant flow systems [81]
Rooftop [69]
Supermarket freezers and cellsRefrigeration and freezingSmall split (<5 kW) and Big split [70]
Data centresElectronic equipment coolingIndirect evaporative cooling [71]
Natural conduction (heat exchanger) [71]
Natural convection [71]
Immersion cooling [71]
Packaged computer room air conditioners (CRAC) [34]
TRANSPORTATIONMarineCooling of batteriesAbsorption (TDHP) [100]
Engine coolingNatural conduction (heat exchanger) [100]
Natural conduction–Raw water cooling system [100]
AGRICULTUREGreenhousesHumidificationEvaporative cooling & fans [73]
Ambient air coolingNatural ventilation [74]
Cooling of indoor greenhouse temperatureAbsorption (TDHP) [75]
Ambient air coolingMechanical ventilation [76]

References

  1. European Commission. L 328. Off. J. Eur. Union 2018, 61, 1–230. [Google Scholar]
  2. Energy Efficiency Targets. Available online: https://ec.europa.eu/energy/topics/energy-efficiency/targets-directive-and-rules/eu-targets-energy-efficiency_en (accessed on 1 January 2023).
  3. 2020 Climate & Energy Package. Available online: https://ec.europa.eu/clima/policies/strategies/2020_en (accessed on 1 January 2023).
  4. European Union. Directive (EU) 2018/2001 of the European Parliament and of the Council on the Promotion of the Use of Energy from Renewable Sources. Off. J. Eur. Union 2018, 2018, 82–209. [Google Scholar]
  5. Pezzutto, S.; Toleikyte, A.; De Felice, M. Assessment of the Space Heating and Cooling Market in the EU28: A Comparison between EU15 and EU13 Member States. Int. J. Contemp. Energy 2015, 1, 39–52. [Google Scholar] [CrossRef]
  6. Pezzutto, S.; Fazeli, R.; De Felice, M.; Sparber, W. Future Development of the Air-Conditioning Market in Europe: An Outlook until 2020. Wiley Interdiscip. Rev. Energy Environ. 2016, 5, 649–669. [Google Scholar] [CrossRef]
  7. Primary Energy Consumption. Available online: https://ec.europa.eu/eurostat/databrowser/view/t2020_33/default/table?lang=en (accessed on 1 January 2023).
  8. A European Green Deal. Available online: https://ec.europa.eu/info/strategy/priorities-2019-2024/european-green-deal_en (accessed on 12 October 2020).
  9. International Energy Agency (IEA). Data Service. Available online: http://wds.iea.org/WDS/Common/Login/login.aspx (accessed on 19 November 2020).
  10. Vinnova. H2020 Visualization. Available online: https://h2020viz.vinnova.se/#/ (accessed on 19 November 2020).
  11. European Commission. Energy Research and Innovation. Available online: https://ec.europa.eu/info/research-and-innovation/research-area/energy-research-and-innovation_en (accessed on 19 November 2020).
  12. Rehfeldt, M.; Fleiter, T.; Toro, F. A bottom-up estimation of the heating and cooling demand in European industry. Energy Effic. 2018, 11, 1057–1082. [Google Scholar] [CrossRef]
  13. Pezzutto, S. Analysis of the Space Heating and Cooling Market in Europe. Int. J. Contemp. Energy 2014, 2, 6652. [Google Scholar]
  14. Pezzutto, A.S.; Sparber, W.; Fedrizzi, R. Analysis of the Space Heating and Cooling Market in Europe. Int. J. Contemp. Energy 2020, 2012, 6652. [Google Scholar]
  15. Energy Savings Statistics. Available online: https://ec.europa.eu/eurostat/statistics-explained/index.php/Energy_saving_statistics#Final_energy_consumption_and_distance_to_2020_and_2030_targets (accessed on 13 October 2020).
  16. Fleiter, T.; Steinbach, J.; Ragwitz, M.; Arens, M.; Aydemir, A.; Elsland, R.; Frassine, C.; Herbst, A.; Hirzel, S. Mapping and Analyses of the Current and Future (2020–2030) Heating/Cooling Fuel Deployment (Fossil/Renewables); European Commision: Brussels, Belgium, 2016. [CrossRef]
  17. Braungardt, D.S.; Bürger, D.V.; Zieger, J.; Kenkmann, T. Contribution of Renewable Cooling to the Renewable Energy Target of the EU; Ministry of Foreign Affairs: Berlin, Germany, 2018; pp. 16–24.
  18. Mantzos, L.; Matei, N.A.; Mulholland, E.; Rózsai, M.; Tamba, M.; Wiesenthal, T. JRC-IDEES 2015. Available online: https://data.jrc.ec.europa.eu/dataset/jrc-10110-10001 (accessed on 19 November 2020).
  19. Pezzutto, S.; De Felice, M.; Fazeli, R.; Kranzl, L.; Zambotti, S. Status Quo of the Air-Conditioning Market in Europe: Assessment of the Building Stock. Energies 2017, 10, 1253. [Google Scholar] [CrossRef] [Green Version]
  20. Pezzutto, S. Analysis of the Space Heating and Cooling Market in Europe; Universität f. Bodenkultur Wien: Vienna, Austria, 2014. [Google Scholar]
  21. Pezzutto, S.; Zambotti, S.; Croce, S.; Zambelli, P.; Scaramuzzino, C.; Pascuas, R.P.; Zubaryeva, A.; Eurac, D.E.; Müller, A.; Tuw, M.H.; et al. HOTMAPS D2.3 WP2 Report—Open Data Set for the EU28; European Commision: Brussels, Belgium, 2019.
  22. Energy Efficiency and Certification of Central Air Conditioners. Available online: https://www.researchgate.net/publication/274048785_Energy_Efficiency_and_Certification_of_Central_Air_Conditioners (accessed on 15 February 2023).
  23. Euroheat & Power. District Heating and Cooling—Country by Country—2015 Survey. Available online: http://www.euroheat.org/wp-content/uploads/2016/03/2015-Country-by-country-Statistics-Overview.pdf (accessed on 23 November 2020).
  24. Martins, J.P.; Trigo, I.; Freitas, S.C.E. Copernicus Global Land Operations “Vegetation and Energy” “CGLOPS-1”; Copernicus Global Land Operations: Brussels, Belgium, 2020; pp. 1–93. [Google Scholar]
  25. Zambelli, P. Climate Context—Heating Degree Days and Cooling Degree Days. Available online: https://gitlab.com/hotmaps/climate/climate_heating_cooling_degreeday (accessed on 23 November 2020).
  26. International Geothermal Association. Our Databases. Available online: https://www.geothermal-energy.org/explore/our-databases/ (accessed on 23 November 2020).
  27. European Heat Pump Association. The Online Stats Tool. Available online: http://www.stats.ehpa.org/hp_sales/country_cards/ (accessed on 23 November 2020).
  28. EUROVENT. Market Intelligence. Available online: https://www.eurovent-marketintelligence.eu/ (accessed on 15 October 2020).
  29. HRE4 Project. Horizon 2020 Heat Roadmap Europe 4—HRE4—Project. Available online: https://heatroadmap.eu/ (accessed on 25 November 2020).
  30. European Union’s Horizon 2020. HotMaps—The Open Source Mapping and Planning Tool for Heating and Cooling. Available online: https://www.hotmaps-project.eu/ (accessed on 21 November 2020).
  31. Evans, T. The Different Technologies for Cooling Data Centers. Schneider Electr. White Pap. 2012, 59, 1–16. [Google Scholar]
  32. Kapoor, K.; Powell, K.M.; Cole, W.J.; Kim, J.S.; Edgar, T.F. Improved Large-Scale Process Cooling Operation through Energy Optimization. Processes 2013, 1, 312–329. [Google Scholar]
  33. Popov, D.; Fikiin, K.; Stankov, B.; Alvarez, G.; Youbi-Idrissi, M.; Damas, A.; Evans, J.; Brown, T. Cryogenic Heat Exchangers for Process Cooling and Renewable Energy Storage: A Review. Appl. Therm. Eng. 2019, 153, 275–290. [Google Scholar] [CrossRef]
  34. Ebrahimi, M. The Environ-Thermo-Economical Potentials of Operating Gas Turbines in Industry for Combined Cooling, Heating, Power and Process (CCHPP). J. Clean. Prod. 2017, 142, 4258–4269. [Google Scholar] [CrossRef]
  35. Ko, J.S.; Huh, J.H.; Kim, J.C. Improvement of Energy Efficiency and Control Performance of Cooling System Fan Applied to Industry 4.0 Data Center. Electronics 2019, 8, 582. [Google Scholar] [CrossRef] [Green Version]
  36. Best, R.B.; Aceves, J.M.H.; Islas, J.M.S.; Manzini, F.L.P.; Pilatowsky, I.F.; Scoccia, R.; Motta, M. Solar Cooling in the Food Industry in Mexico: A Case Study. Appl. Therm. Eng. 2013, 50, 1447–1452. [Google Scholar] [CrossRef]
  37. Meijer, G.I. Cooling Energy-Hungry Data Centers. Science 2010, 328, 318–320. [Google Scholar] [CrossRef] [PubMed]
  38. States, E.U.M. Competitiveness of Renewable Heating and Cooling Industry and Services Annex B to Part 1 of the Study on the Competitiveness of the Renewable Energy Sector Overview of the 2030 Targets and Policies of the EU Member States in the Context of Heating and Coo; European Commision: Brussels, Belgium, 2019; pp. 1–39.
  39. Surna Cultivation Technologies. Comfort Cooling vs Process Cooling: What you Need to Know. Available online: https://surna.com/comfort-cooling-vs-process-cooling-what-you-need-to-know/ (accessed on 23 November 2020).
  40. Howard, D.A.; Jørgensen, B.N.; Ma, Z. Multi-Method Simulation and Multi-Objective Optimization for Energy-Flexibility-Potential Assessment of Food-Production Process Cooling. Energies 2023, 16, 1514. [Google Scholar] [CrossRef]
  41. UN Environment Programme. Cooling Industry Supports Fight against COVID-19, Steps Up Climate Action. Available online: https://www.unenvironment.org/news-and-stories/story/cooling-industry-supports-fight-against-covid-19-steps-climate-action (accessed on 23 November 2020).
  42. Nouvel, R.; Zirak, M.; Coors, V.; Eicker, U. The Influence of Data Quality on Urban Heating Demand Modeling Using 3D City Models. Comput. Environ. Urban Syst. 2017, 64, 68–80. [Google Scholar] [CrossRef]
  43. Dittmann, F.; Rivière, P.; Stabat, P. Space Cooling Technology in Europe; European Commision: Brussels, Belgium, 2017.
  44. European Union. Commission Regulation (EU) 2015/1095 of 5 May 2015 Implementing Directive 2009/125/EC of the European Parliament and of the Council with Regard to Ecodesign Requirements for Professional Refrigerated Storage Cabinets, Blast Cabinets, Condensing Units and Process Chillers. Available online: http://data.europa.eu/eli/reg/2015/1095/oj/eng (accessed on 18 December 2020).
  45. European Union. Commission Regulation (EU) 2016/2281 of 30 November 2016 Implementing Directive 2009/125/EC of the European Parliament and of the Council Establishing a Framework for the Setting of Ecodesign Requirements for Energy-Related Products, with Regard to Ecodes. Available online: http://data.europa.eu/eli/reg/2016/2281/oj/eng (accessed on 18 December 2020).
  46. CEN—EN 14825; Air Conditioners, Liquid Chilling Packages and Heat Pumps, with Electrically Driven Compressors, for Space Heating and Cooling—Testing and Rating at Part Load Conditions and Calculation of Seasonal Performance. European Commision: Brussels, Belgium, 2018.
  47. Copernicus. Copernicus Global Land Services. Available online: https://land.copernicus.eu/global/products/lst (accessed on 26 November 2020).
  48. SciPg.org. scipy.cluster.vq.kmeans. Available online: https://docs.scipy.org/doc/scipy-0.14.0/reference/generated/scipy.cluster.vq.kmeans2.html (accessed on 26 November 2020).
  49. SciPg.org. scipy.signal.savgol_filte. Available online: https://docs.scipy.org/doc/scipy-0.16.1/reference/generated/scipy.signal.savgol_filter.html (accessed on 26 November 2020).
  50. Eurostat. Regional Gross Domestic Product (PPS per Inhabitant) by NUTS 2 Regions. Available online: https://ec.europa.eu/eurostat/web/products-datasets/-/tgs00005 (accessed on 26 November 2020).
  51. EUSTACE. E-OBS Gridded Dataset. Available online: https://www.ecad.eu/download/ensembles/download.php (accessed on 25 November 2020).
  52. Bansal, P.; Vineyard, E.; Abdelaziz, O. Status of Not-in-Kind Refrigeration Technologies for Household Space Conditioning, Water Heating and Food Refrigeration. Int. J. Sustain. Built Environ. 2012, 1, 85–101. [Google Scholar] [CrossRef] [Green Version]
  53. Schulz, M.; Kourkoulas, D. Regulation (EU) No 517/2014 of the European Parliament and of the Council of 16 April 2014 on Fluorinated Greenhouse Gases and Repealing Regulation (EC) No 842/2006. Off. J. Eur. Union 2014, 2014, L150/195-230. [Google Scholar]
  54. Commission, E. Communication from the Commission to the European Parliament, the Council, the European Economic and Social Committee and the Committee of the Regions on an EU Strategy for Heating and Cooling. J. Chem. Inf. Model. 2016, 2016, 101. [Google Scholar] [CrossRef]
  55. Kühnbach, M. Load Profile Tertiary Cooling Yearlong 2010. Available online: https://gitlab.com/hotmaps/load_profile/load_profile_tertiary_cooling_yearlong_2010 (accessed on 26 November 2020).
  56. Hechavarría, R.; López, G. Review of Available Information—EU Strategy for Heating and Cooling—Part 2. J. Chem. Inf. Model. 2016, 53, 1689–1699. [Google Scholar]
  57. BSRIA. European Market for Air Conditioning Chillers—Spain, Report 50572/5A; BSRIA: Bracknell, UK, 2019. [Google Scholar]
  58. Arora, C.P. Refrigeration and Air Conditioning; McGraw-HIll International Editions: Mechanical Technology Series; Tata McGraw-Hill: New York, NY, USA, 2000. [Google Scholar]
  59. Daikin. Process Cooling Systems. Available online: https://www.daikin.eu/en_us/solutions/industrial-process-cooling.html (accessed on 27 November 2020).
  60. Mitsubishi Electric Hydronics & IT Cooling Systems S.p.A. Products. Available online: https://www.melcohit.com/en/products (accessed on 25 November 2020).
  61. Montec. Bacco—The Wine Cellar Cooling Unit. Available online: http://www.mon-tec.it/en/bacco-the-wine-cellar-cooling-unit/ (accessed on 25 November 2020).
  62. Lingdo Industrial Limited. R407 Air Cooled Scroll Chiller, Air Cooled Packaged Chiller Unit for Tobacco Factory. Available online: http://industriallingdo.sell.everychina.com/p-107233510-r407-air-cooled-scroll-chiller-air-cooled-packaged-chiller-unit-for-tobacco.html (accessed on 25 November 2020).
  63. ScienceDirect. Absorption Cooling. Available online: https://www.sciencedirect.com/topics/engineering/absorption-cooling (accessed on 25 November 2020).
  64. Mitsubishi Electric. IT Cooling. Available online: https://www.melcohit.com/EN/Products/3/ITCooling/ (accessed on 25 November 2020).
  65. Melograno, P.N.; Pezzutto, S. IEA ANNEX 34 Italian Country Report; EURAC Research: Bolzano, Italy, 2010. [Google Scholar]
  66. Daikin. Rooftop. Available online: https://www.daikin.eu/en_us/solutions/rooftop.html (accessed on 25 November 2020).
  67. Karampour, M.; Sawalha, S.; Arias, J. Eco-Friendly Supermarkets—An Overview; European Union: Brussels, Belgium, 2016. [Google Scholar] [CrossRef]
  68. Research, G. Europe Data Center Cooling Market. Available online: https://www.graphicalresearch.com/industry-insights/1127/europe-data-center-cooling-market (accessed on 25 November 2020).
  69. Castellazzi, L.; Maria, A.; Bertoldi, P. Trends in Data Centre Energy Consumption under the European Code of Conduct for Data Centre Energy Efficiency. Energies 2017, 10, 1470. [Google Scholar] [CrossRef]
  70. Euro Cooling Systems. Greenhouse Humidification. Available online: https://www.eurocooling.it/en/index.html (accessed on 25 November 2020).
  71. Benni, S.; Tassinari, P.; Bonora, F.; Barbaresi, A.; Torreggiani, D. Efficacy of Greenhouse Natural Ventilation: Environmental Monitoring and CFD Simulations of a Study Case. Energy Build. 2016, 125, 276–286. [Google Scholar] [CrossRef]
  72. Vox, G.; Blanco, I.; Scarascia Mugnozza, G.; Schettini, E.; Bibbiani, C.; Viola, C.; Campiotti, C.A. Solar Absorption Cooling System for Greenhouse Climate Control: Technical Evaluation. Acta Hortic. 2014, 1037, 533–538. [Google Scholar]
  73. EcoCooling. Warehouse Cooling. Available online: https://www.ecocooling.co.uk/applications/warehouses/ (accessed on 25 November 2020).
  74. De Negri, J.F.; Pezzutto, S.; Gantioler, S.; Moser, D.; Sparber, W. A Comprehensive Analysis of Public and Private Funding for Photovoltaics Research and Development in the European Union, Norway, and Turkey. Energies 2020, 13, 2743. [Google Scholar] [CrossRef]
  75. Mallett, C.P. Frozen Food Technology/by CP Mallett; Springer: Berlin/Heidelberg, Germany, 1993. [Google Scholar]
  76. Brown, D.; Stout, T.B.; Dirks, J.; Fernandez, N. The Prospects of Alternatives to Vapor Compression Technology for Space Cooling and Food Refrigeration Applications. Energy Eng. 2012, 109, 7–20. [Google Scholar] [CrossRef] [Green Version]
  77. Carrier Corporation. Integrating VRF Systems for Improved Efficiency and Comfort; Carrier Corporation: Palm Beach Gardens, FL, USA, 2014; Volume 2. [Google Scholar]
  78. Stipp, G.K. Direct Condensation of Food Volatiles onto a Food Substrate at Cryogenic Temperatures. U.S. Patent 4335149A, 15 June 1982. [Google Scholar]
  79. McDonald, K.; Sun, D.-W. Vacuum Cooling Technology for the Food Processing Industry: A Review. J. Food Eng. 2000, 45, 55–65. [Google Scholar] [CrossRef]
  80. MGF. Humidification in Cellars and Barrel Room: The Right Humidity for Wine. Available online: https://www.nebulizzare.com/en/fields/misting-agriculture/395-humidification-cellars-barrel-room-humidity-wine (accessed on 25 November 2020).
  81. Cardemil, J. Combined Generation of Heat and Cooling for a Winemaking Process Using a Solar-Assisted Absorption Chiller. Available online: http://proceedings.ises.org/?doi=swc.2015.10.43 (accessed on 25 November 2020).
  82. Aggreko. Cooling to Meet Increased Market Demand during Warmer Summer Weather. Available online: https://www.aggreko.com/en-gb/case-studies/petrochemical-and-refining/cooling-tower-to-meet-increased-market-demand-during-warmer-summer-weather (accessed on 25 November 2020).
  83. MTA. Process Cooling Solutions for Plastics—MTA. Available online: https://www.mta-it.com/eng/applications/process-cooling-solutions/plastics.php (accessed on 25 November 2020).
  84. British Plastic Federation. Process Cooling. Available online: https://www.bpf.co.uk/plastipedia/processes/Process_Cooling.aspx (accessed on 25 November 2020).
  85. Boldrocchi, T.E. Cooling Towers in Steel Plant: How They Work? Available online: https://www.btetorri.com/cooling-tower-in-steel-plant.php (accessed on 25 November 2020).
  86. Oschatz Christof Industries. Cooling Systems for Steel Plants. Available online: https://www.oschatz.com/en/sector/mining-metals/steel-works/ (accessed on 25 November 2020).
  87. MTA. Process Cooling Solutions for Automotive. Available online: https://www.mta-it.com/eng/applications/process-cooling-solutions/automotive-1.php (accessed on 25 November 2020).
  88. Daikin. Holcim Cement Plant. Available online: https://www.daikin.eu/en_us/about/case-studies/holcim.html (accessed on 25 November 2020).
  89. Boldyryev, S.; Mikulčić, H.; Krajačić, G.; Duić, N. Waste Heat Utilisation of Croatian Cement Industry Accounting Total Site Demands. In Proceedings of the 26th European Symposium on Computer Aided Process Engineering, Portoroz, Slovenia, 12–15 June 2016; Kravanja, Z., Bogataj, M., Eds.; Elsevier: Amsterdam, The Netherlands, 2016; Volume 38, pp. 2223–2228. [Google Scholar] [CrossRef]
  90. Stiavelli. Glass Industry Applications—Catalogue. Available online: https://www.stiavelli.com/prds/industrial-fans-manufacturers-and-blowers-for-glass-industry-and-tempering/ (accessed on 25 November 2020).
  91. ScienceDirect. Chiller. Available online: https://www.sciencedirect.com/topics/engineering/chiller (accessed on 25 November 2020).
  92. United Nations Environment Programme. Environmental Management in the Pulp and Paper Industry; UNEP: Nairobi, Kenya, 1996. [Google Scholar]
  93. Carel. Evaporative Cooling; Carel: Padova, Italy, 2020. [Google Scholar]
  94. EcoCooling. Pharmaceutical Cooling. Available online: https://www.ecocooling.co.uk/applications/pharmaceutical/ (accessed on 25 November 2020).
  95. EBMPapst. Telecommunication Base Station Cooling; EBMPapst: Mulfingen, Germany, 2016. [Google Scholar]
  96. Broughton Electro Air Products Ltd. Warehouse Fans & Ventilation. Available online: https://www.broughtoneap.co.uk/products/fans-ventilation/ (accessed on 25 November 2020).
  97. BV, O.F.A. Adiabatic Cooling. Industrial Climate Control. Available online: https://www.oxy-com.com/en/solutions/intrcooll/?gclid=EAIaIQobChMI3pmYyuH56AIVArd3Ch1vbAxKEAMYASAAEgL96fD_BwE (accessed on 25 November 2020).
  98. Cool4Sea. Marine Air-Conditioning Technology Powered by Waste Heat. Available online: https://www.cool4sea.com/ (accessed on 25 November 2020).
  99. CP Performance. Marine Closed “Freshwater” Cooling Systems. Available online: https://www.cpperformance.com/t-marine-closed-cooling-systems.aspx (accessed on 25 November 2020).
  100. Boatbuy. Marine Cooling Systems—What You Need to Know About Your Boat. Available online: https://boatbuy.com.au/marine-cooling-systems/ (accessed on 2 January 2023).
Figure 1. Load curve law for process cooling.
Sustainability 15 03698 g001
Figure 2. Number of installed units per process cooling type (industrial sector), EU27+UK, the reference year 2016 [16,43,51].
Sustainability 15 03698 g002
Figure 3. Average installed capacity per process cooling type (industrial sector), EU27+UK, the reference year 2016 [16,43,51].
Sustainability 15 03698 g003
Figure 4. Seasonal energy performance ratio per process cooling type (industrial sector), EU27+UK [54,55] (indicated values refer to the weighted mean per final cooling consumption).
Sustainability 15 03698 g004
Figure 5. Equivalent full load hours (industrial sector), EU27+UK, the reference year 2016 [20,52,53].
Sustainability 15 03698 g005
Figure 6. Final energy consumption for process cooling per type (industrial sector), EU27+UK, the reference year 2016 [29,54,55].
Sustainability 15 03698 g006
Figure 7. Final energy consumption for process cooling per country (industrial sector), EU27+UK, the reference year 2016 [29,54,55,56].
Sustainability 15 03698 g007
Table 1. Final energy consumption for process cooling per type (industrial sector), EU27+UK, the reference year 2016 [29,54,55].
TechnologyFinal Energy Consumption [TWh/y]
Chiller (air-to-water) < 400 kW41.47
Chiller (air-to-water) > 400 kW40.97
Chiller (water-to-water) < 400 kW8.79
Chiller (water-to-water) > 400 kW19.75
Table 2. Final energy consumption for process cooling per country (industrial sector), EU27+UK, the reference year 2016 [29,54,55,56].
TWh/y per EU27+UK MS–PC–Industrial SectorPercentage
Austria2.562.31%
Belgium3.062.76%
Bulgaria0.640.57%
Croatia0.350.32%
Cyprus1.881.70%
Czech Republic1.111.00%
Denmark0.530.48%
Estonia0.080.07%
Finland1.351.22%
France17.6215.88%
Germany11.4310.30%
Greece2.872.58%
Hungary1.381.24%
Ireland0.150.13%
Italy27.1324.44%
Latvia0.170.15%
Lithuania0.470.42%
Luxembourg0.050.04%
Malta0.650.59%
Netherlands4.243.82%
Poland3.062.76%
Portugal1.341.21%
Romania1.010.91%
Slovakia0.700.63%
Slovenia0.130.12%
Spain15.6314.09%
Sweden1.901.71%
United Kingdom9.498.55%
EU27+UK110.98100%
Table 3. Sectors, subsectors, processes, and technologies (vapour compression technologies, besides chiller air-to-water or water-to-water) utilized for process cooling purposes.
SectorSubsectorProcessTechnology
INDUSTRYWineriesAmbient air coolingSmall split (<5 kW) and Big split (>5 kW) [64]
TobaccoAmbient air controlPackaged [65]
Paper, pulp, and printingCooling of printing machineryPackaged [66]
TERTIARYTelecommunicationsShelter coolingSmall split (<5 kW) and Big split (>5 kW) [67]
WarehousesAmbient air coolingVariable refrigerant flow systems [68]
Rooftop [69]
Supermarket freezers and cellsRefrigeration and freezingSmall split (<5 kW) and Big split [70]
Data centresElectronic equipment coolingPackaged computer room air conditioners (CRAC) [31,68]
Disclaimer/Publisher’s Note: The statements, opinions and data contained in all publications are solely those of the individual author(s) and contributor(s) and not of MDPI and/or the editor(s). MDPI and/or the editor(s) disclaim responsibility for any injury to people or property resulting from any ideas, methods, instructions or products referred to in the content.

