Abstract
Recent studies show that decision making in Business Process Management (BPM) and incorporating sustainability in business is vital for service innovation within a company. Likewise, it is also possible to save time and money in an automated, intelligent and sustainable way. Robotic Process Automation (RPA) is one solution that can help businesses improve their BPM and sustainability practices through digital transformation. However, deciding which processes to automate with RPA technology can be complex. Consequently, this paper presents a model for selecting indicators to determine the profitability of shifting to RPA in selected business processes. The method used in this work is the Performance Analysis Method, which allows for predicting which processes could be replaced by RPA to save time and money in a service workflow. The Performance Analysis Method consists of collecting data on the speed and efficiency of a business process and then using that data to develop discrete event simulations to estimate the cost of automating parts of that process. A case study using this model is presented, using business process data from an international utility company as input to the discrete event simulation. The model used in this study predicts that this Electric Utility Company (EUC) will save a substantial amount of money if it implements RPA in its call center.
1. Introduction
Modern technological advances in simulation, robotics, machine learning and data analytics have recently been adapted for use in business and industry (often referred to as Industry 4.0 [1]). Currently, automation is based on robots, and at an industrial level, there is a demand for robots with increasingly advanced and robust capabilities. These requirements can be implemented using advances in control theories [2,3] and artificial intelligence (AI) [4]. Control theories help reduce trajectory errors and improve the precision of industrial robots [5] through controllers, as well as the use of intelligent systems to obtain high precision, for example, incorporating Fuzzy Logic when useful [6,7]. Moreover, AI is essential to train robots; their use is varied [8,9], whether in physical or software robots. On the other hand, the digitization and automation of processes in different business areas is a trend that evolves [10] and positively impacts customers’ well-being [11]. Companies use Business Process Management (BPM) approaches [12] to continuously improve their business processes and incorporate sustainability as an essential strategy [13,14,15].
One of the ways to improve and optimize business processes considering sustainability is by automating processes through Robotic Process Automation (RPA) technologies. For example, workforce efficiency can be improved by replacing repetitive technical work with automation, simulating different process workflows and analyzing the data to predict the most cost-effective organizational method [16]. The business processes best suited for RPA have low complexity, high error rates when performed by humans and are highly valuable to the enterprise [17,18]. RPA can be seen as an alternative to outsourcing, which reduces costs by shifting jobs to countries that can perform tasks with less effort. Therefore, RPA is often referred to as insourcing and can be seen as a less controversial and easier to control method of cost savings [19,20]. Ideally, RPA would allow companies to cut costs, reduce errors and reserve employees for more complex tasks and face-to-face customer interactions. Recent technological developments have unlocked the ability of RPA to handle more complex tasks that are not governed by well-defined business rules. However, there is still a gap in the literature related to when we want to decide what to automate [21].
Desai (2020) [22] indicates that many organizations need help deciding if they require RPA; this work proposes prerequisites for the organization to have RPA. These consist of selecting the primary business process and analyzing each level. These levels answer four questions: "Q1. Is the Business Process eligible for RPA?, Q2. How to asses RPA possibility and business process/use case?, Q3. How to assess if RPA is appropriate? and Q4. Can we allocate the assessment to categories if one can proceed/reject RPA?" A confusion matrix is used to evaluate the acceptance or rejection; if the levels’ results are equal to 1, the organization can select the RPA. In another work, Yi-Wei et al. (2019) [23] propose a cyclical method of eight steps to evaluate the benefits RPA offers to help decision-making in an organization. The first step is planning the project, evaluating and selecting resources, and labor for the execution. Although the method presents the design and implementation of RPA based on agile development, it does not present details on how to conduct this planning and decide which business processes to implement without taking significant risks. Asatiani’s (2023) [24] work notes that organizations must carefully determine which business processes to automate with RPA before implementation. Nevertheless, the model presented is operational, based on a decision checklist helping the model’s decision-making process that best suits the organization’s needs. This list focuses on the implementation of RPA, leaving an open question of how to determine which processes to automate.
Determining which tasks can be automated is often quite tricky, as decision making is required to identify and select the most beneficial plans. It usually helps to start with a simple filter to exclude processes that require complex decision making. The next step is to evaluate the potential performance of the RPA process. The process of evaluating performance is currently something of an art that requires the input of humans and extensive data gathering [25]. This is because there are many ways to evaluate performance, which change from task to task and depend on the organization’s priorities. Performance evaluations require a thorough knowledge of the processes involved and a careful selection of methods, volume constraints and analytical tools. With these constraints in mind, we attempt to evaluate the performance of a specific business process within a utility company. In this way, the work answers questions such as: Can we estimate the cost savings from switching to RPA for a specific business process using simulations based on employee performance and cost data?
It is often difficult to analyze the performance of real-world processes because they cannot be easily stopped or changed to gather data. This is one of the reasons why RPA capacity planning is essential to avoid financial losses, ensure user satisfaction and maintain a company’s external image. This often requires detailed studies of all business layers affected by a process, as the consequences of a process change cannot be foreseen directly. Thus, this work contributes to a method proposal (cyclical and evolutionary method) that establishes steps and models to be adopted in order to perform the selection of processes and performance analysis, identifying, for example, business objectives, metrics and performance indicators, the impact of the implementation of RPA, and predicting the performance of the implementation of RPA.
The objective of this work is to present a method of analysis of the performance of robotic process automation that should work for any generation of robots (G1, G2 and G3+ generation robots). This methodology establishes phases for process selection, techniques that can be used to filter out possible tasks and metrics and performance indicators that can be used to evaluate the impact of shifting to RPA for the selected processes, including barriers and bottlenecks that could limit efficiency. Figure 1 presents the robot generations based on the EY concepts—the first generation (G1) features rule-based automation of processes previously performed by humans. The second generation (G2) has improved process automation—robots can process unstructured data and use cloud technologies. The new generation of RPA, called G3+, can make decisions using artificial intelligence (AI) and machine learning (ML) to increase automation efficiency and scope [26,27,28,29,30]. The RPA G3+ architecture has a robotic intelligence component [31] that requires either a model that has been previously trained using data gathered for the business process in question or by linking the model to a database that can be quickly updated as new information emerges [32,33].
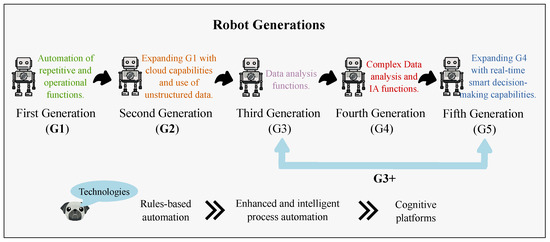
Figure 1.
Classification of robot generations G1, G2 and G3+ for RPA.
2. Related Works
Simulation models represent a system abstraction, which aims to describe the system with a focus on performance analysis. These models can be classified according to their characteristics and purposes for which they are intended. The two types are the semi-formal descriptive models and the formal models. Semi-formal descriptive models describe the computational system without the need for simulation but with the fundamental concern of documentation and communication between different actors involved in the modeling. In this model, we have modeling languages, such as Icam Definition for Function Modeling (IDEF0), a functional modeling language for analysis, development, information integration, systems integration and business processes [34]; Unified Modeling Language (UML), which is a modeling language used on software engineering [35]; Business Process Model and Notation (BPMN)—a graphical notation to represent business processes [36]. This technique has the advantage of being standardized, thus allowing a unique understanding of complex business semantics and workflows, and Value Chain represents a set of activities to perform or deliver a service or product. It has an essential role in representing business processes in a global way of companies.
Formal models describe the computational system to allow its simulation in real time and dynamically. That is, their values change over time. Within this classification [25], we have the Discrete Simulation Model, which uses variables that assume discrete values in a certain period; Deterministic Simulation Model, in which the results of the models (variables) can be accurately determined; and the Stochastic or Probabilistic Simulation Model, in which the variables occur according to a probabilistic distribution. Vergidis et al. (2008) [37] review and classify the main techniques for modeling business processes concerning their analysis and optimization capabilities. Three primary groups are identified, and a selection of representative business process modeling techniques are classified based on them. The main contribution of the work is that it identifies which types of business process models are suitable for analysis and optimization.
Within the formal models focused on simulation, we can have [38] (1) Queuing Networks, a technique used for analytical modeling and simulation of computational systems. Through it, it is possible to evaluate the performance of a system, identify bottlenecks and estimate essential performance measures, such as predicting waiting times and queue sizes. (2) Petri Nets is a mathematical model for describing of distributed systems. A Petri Net is a directed bipartite graph in which the nodes represent transitions (events that may occur, represented by squares) and places (conditions, represented by circles). It has been applied in modeling and simulating dynamical systems and discrete events, for example, in software projects process automation, workflow management, data analysis, concurrent programming and reliability engineering).
A performance case study, considered relevant for the survey of this work, was conducted by Menascé (2002) [39]. Menascé presents a case study of modeling simulation of an e-commerce application, establishing four distinct and integrated performance models at the levels of business, services, user behavior and infrastructure. The business model uses metrics defined from the current financial profit of a fictitious company and the financial goal for the next year, discussing how this new goal should influence performance at other levels, particularly the impacts on the system’s infrastructure. The services responsible for generating the primary business goals are defined in the Service Model. For example, the services considered are sales of products and advertisements (banners) on the site. To represent the User Behavior Model, they used the Customer Behavior Model Graph (CBMG) model [40,41]. The graph nodes represent site pages, and the arcs are the navigation probabilities between the pages. The infrastructure model represents computational elements (web servers, networks, database servers, application servers) through Queue Networks. This model is integrated with the other models through performance goals (response time), evaluating which changes are necessary for the infrastructure to guarantee the business performance goals, including bottleneck analysis and the demands of each element, among others.
In the case of call centers, performance indicators are fundamental. It is essential to monitor the quality of this service and customer satisfaction. In addition, as there is an associated high cost, it is necessary to monitor the resources involved in detail. Effective management and optimization of resources are crucial to avoiding unnecessary costs. In general, the Queuing Network model is adopted, which allows its simulation, representing each system element (attendant, Audible Response Unit, computational support systems, among others) as a Queue [42]. Karakus et al. (2016) [43] define a Big Data infrastructure for call centers monitoring analytics, analyzing all recorded calls and measuring the performance of a customer service representative or agent.
In this work, unlike other works, the novelty is a proposed methodology for the selection of indicators and performance analysis of already existing robots/RPAs (monitoring) to specify possible implementations of new RPAs in a company. As a case study, we present the case of a large electric company in Brazil to guide the evaluation of the G1, G2 and G3+ robots. The method was defined based on previous work applied by Ernst & Young (EY) in the project. The predictions of this research were presented to the EUC and were taken into account according to the results obtained. In this way, they led to the decision to implement a "Proactive Notification" RPA that is capable of alerting with high precision customers with a higher probability of complaining; the work was published by Vajgel et al. (2021) [33].
EUC collected data on the number of customers using each of the services within the flowchart representing electrical damage reimbursement services, such as the average amount of employee time that must be spent servicing each customer at each step of the process, among other useful variables. Finally, a User Experience (UX) study with RPA after 18 months of adoption was conducted to capture the multifaceted experience of workers. RPA provided a positive user experience mainly because of the significant time saved. The work was recently published by Filgueiras et al. (2022) [44]. Thus, we can highlight the importance of the throughput analysis method for RPA.
3. Methodology
The methodology used consists of a set of steps (see Figure 2). These steps were developed based on a previous work with RPA system development by Ernst & Young (EY) [45] and on the related works in [25,40,46].
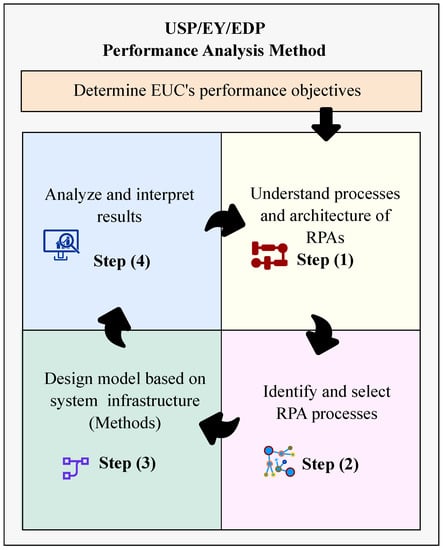
Figure 2.
USP/EY/EDP Performance Analysis Method with each of the steps.
Figure 2 illustrates the USP/EY/EDP Performance Analysis Method, which comprises four steps. Step (1) Understand processes and architecture of RPAs; Step (2) Identify and select RPA processes: Step (3) Design model based on system infrastructure; and Step (4) Analyze and interpret results. Each of these steps is described below:
- Step (1)
- The RPA system must be studied in detail. The boundaries that delimit the system (main processes) and its interfaces with external systems, the leading current performance indicators and expected performance targets must be determined.
- Step (2)
- In this step, the target processes are listed, identifying their indicators, business metrics, computational infrastructure and personnel involved, according to Figure 3.
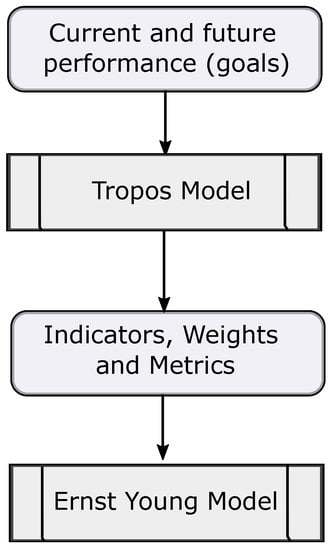 Figure 3. Process Identification and Selection Stage.Figure 3 shows the process identification and selection step through a sequence. First, current and future performance (goals)—the indicators are based on the previous step’s business goals. Second, to map business goals into indicators and find their weights, the Tropos Model is used [47]. Third, mapping indicators into metrics is applied to the proposal by Barone et al. (2012) [48]. Furthermore, finally, the generated indicators, weights and metrics are used as parameters for the Ernst & Young Model (EY Model), which aims to support the preliminary selection of processes to be considered for robotization.
 - Step (3)
- Using the information obtained in the previous steps, a document is elaborated with the conceptual model of the system that specifies the conception that one has of the system and everything that was assumed. The model details depend on project objectives, performance measures, data availability, issues of credibility of the information obtained, limitations of computing resources, opinions of experts in the business areas and time and financial limitations. In this stage, the Performance Analysis Models are defined using metrics obtained in the previous stages and the new measures collected in the existing computational systems or through estimates. The models considered are the Service Utilization Model Based on User Behavior (CBMG) and the Queuing Network Simulation Model. Experiments are planned and executed from the finished model to perform measurements on the models. The experiments should involve varying levels (or values) of factors that affect system performance, including the workload to be put through the system regularly and in peak situations.
- Step (4)
- The results of the experiments are random quantities that require a statistical analysis for their correct interpretation. The results will be used in decision-making processes if they are valid and credible.
RPA performance analysis cannot be performed in one step. Constant feedback and iterative optimization are required to achieve good results. The entire automation process must be thoroughly analyzed with two questions in mind: (1) “Where are we?” and (2) “Where do we want to go?”.
The first question helps determine which processes we want to automate, and the second question determines which indicators can be used to determine whether the automation method serves the company’s goals. Iterations of the process (Figure 2) may change the answers to these two questions somewhat, but the questions serve as a general guide for future refinements.
3.1. Performance Analysis Models in Consideration
The generalized cycle of performance analysis in Figure 2 can be refined to meet the purposes of the entire business, specific services, customers, or resources. As previously discussed, the computational systems’ modeling and capacity planning process is defined by several steps to generate Performance Analysis models. The generated models can be classified into four types, as outlined in Figure 4.
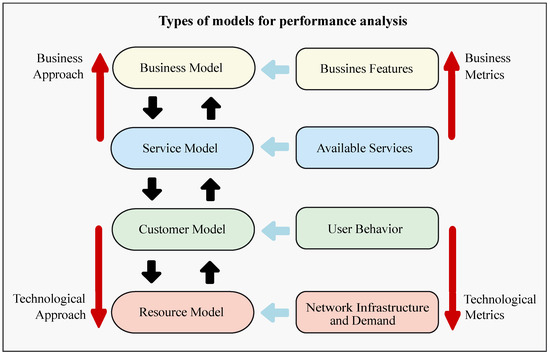
Figure 4.
Relationships between different applications of performance analysis.
Figure 4 provides a graphic showing how the performance analysis applications are related. In this relationship, four models (business, service, customer and resource model) with approaches and metrics at the business and technological levels can be observed. The upward pointing arrows indicate a higher level of sophistication and interoperability of the components of a business process. Fully integrating and accounting for the impact of process changes requires consideration of more complex variables, such as user behaviour, the services offered by the business and the unique features of the business. Iterations of the performance analysis process should attempt to include these higher-level features. This can be accomplished by using standard metrics that serve as indicators of technical efficiency, user behaviour and desired business features.
The four types of applications for performance analysis are the following: (1) Business model, which provides a global vision of results that includes financial expenditures, social and environmental benefits, employee performance, and other factors relevant to the business as a whole. These metrics are fundamental for supporting mid and long-term process optimizations; (2) Service model, which addresses services that support the ultimate goals of the business, such as e-commerce, website efficiency, or service/product catalog for customers; (3) Customer/user model, which addresses issues of customer usage and satisfaction with business services and products; (4) Resource model, which defines the resource usage of the system in question and considers how to properly allocate those resources.
These models require the use of calculations and simulations that incorporate values based on service and usage data, such as the number of customers relative to the number of employees, customer service rates, error rates, and customer satisfaction rates. Statistical distributions with random variables and stochastic processes are used to represent the inputs and outputs of system processes about service time.
3.2. Metrics and Indicators for Process Selection
This subsection describes the metrics and indicators used for the performance analysis of a business process. Indicators refers to outcomes that allow evaluation of business processes (e.g., customer satisfaction, the efficiency of employee–customer interaction, product distribution), and metrics refers to the actual numerical values calculated for evaluation (e.g., percentage of satisfied customers, client interaction rate, employee error rate, products distributed per day). The indicators in this section are based on the work of Lacity et al. [49]. Table 1 lists the indicators to be considered for the first and second generations (G1 and G2) of the RPA process. The first column contains nine indicators, followed in the second column by a brief description.

Table 1.
Indicators for Process Automation based on Lacity et al.
Table 2 lists the indicators used in the suggested model for selecting Project Processes. Fifteen indicators are described; note that the indicators adopted in the Project Model correspond to the indicators for Process Automation for RPA G1 and G2 (see Table 1). However, the need to include cost indicators that can be used to assess the impact or even the Return on Investment should be emphasized. Another indicator for RPA G1 and G2, which are fundamental for G3, is the process reliability performance indicator.
Table 2.
Indicators for selection of processes considered by Ernst & Young.
These indicators are essential for evaluating the performance of machine learning algorithms. In the case of machine learning, the following indicators can be considered: Error rate and accuracy are two metrics commonly used for clustering algorithms and mean square error and average absolute distance are commonly used for regression algorithms [50].
Other indicators could be considered in later iterations within the Performance Analysis Model for G3+ RPA and refined based on the initial results. The ability of a robot to handle exceptions when processes require decisions is an example of a G3+ RPA indicator. Monitoring these indicators is essential for optimizing business process simulations. Tracking specific metrics during modeling is necessary to obtain information transferable to a real-world scenario. Business process data should inform these metrics. The robot-level metrics tracked in this work were velocity, reliability and availability.
- Velocity is a measure of how long it takes to complete a process. This metric can be subdivided into three parts:
- (a)
- Throughput is the number of executed requisitions per unit time. This unit of time depends on the request types that are sent to the system. For example, for a web server, the unit could be access requests per second;
- (b)
- Use refers to the percentage of time a resource set is busy. This is measured by comparing the time usage of a process to the time it takes to complete the entire process;
- (c)
- Response time is the time from the beginning to successful completion of an available service within a business process. The response time can be decomposed into service time and queue time:
- i.
- Service time refers to the time each resource (i.e., humans, robots or machines) is in use;
- ii.
- Queue time refers to the waiting time required to access each resource;
- Reliability is the probability of failure and the time interval between failures. A failure has occurred when a function of the business process could not be completed properly;
- Availability refers to times when the system cannot complete a service, which is called a fault. The types of faults depend on the process, but each one must be classified, monitored and assigned a probability in order to solve problems with the model.
Figure 5 shows a schematic representation of the workflow for the performance analysis process and associated metrics. The possible results for executing an order (request to a system) can be classified as follows [25,46]:
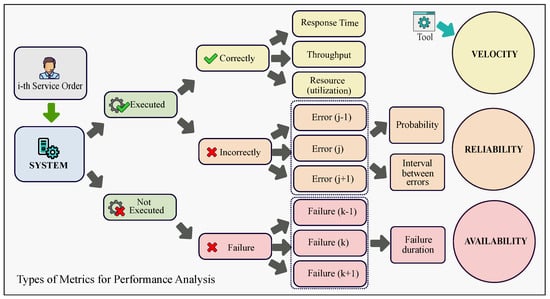
Figure 5.
Some applied metrics for performance analysis: possible results and metrics to be obtained from requests made to the systems.
- Correct execution;
- Incorrect execution due to the occurrence of an error. An error occurs when the expected result of a particular functionality is not fulfilled due to a functional failure of the system;
- Lack of execution due to a failure occurring. A fault occurs when something unexpected happens in the environment, preventing the execution of a specific functionality or system.
Table 3 organizes information about the metrics to be identified at different model levels.
Table 3.
Services mapped to metrics of interest.
Metrics applied to different levels of models are listed below:
- Hits/sec: number of requests for objects (infrastructure).
- Page Views/Day: number of pages per day (Infrastructure).
- Unique Visitor: how many different visitors accessed a site in a period (user behaviour).
- Revenue Throughput: measures return in monetary values per unit of time (business).
- Potential Loss Throughput: measured in monetary values per unit of time of purchases not made, that is, customers who gave up completing a purchase service (user behavior).
- User response time: total time the user waits for the service to run (user behaviour).
- Service probability: probability of a service being requested by a user (user behaviour).
- Full-Time Equivalent (FTE) or Whole Time Equivalent (WTE): indicates a person’s workload in order to make workloads comparable in various contexts (business).
3.3. Finding Indicators by Analyzing Company Data
The goal of an analytic process is to discover the patterns and anomalies that exist in a collection of data. An analytic process can be applied in any of the RPA development phases, including data preprocessing, model construction and RPA implementation. For example, analytics can be used for data preprocessing to extract features that can be used as input to the robotic process model. During construction, model analytics can be used to refine parameterization. In the production phase, analytics can be used to monitor the performance of each robot or the process to determine operational efficiency.
Analytics can also be applied to the entire RPA process to determine the potential for implementation in a broader business process. For performance monitoring that is intended to evaluate a single system, it is essential to communicate information to the data analyst through a dashboard of some sort so that metrics and systems can be changed or moved. Monitoring and diagnosing issues with the robot in the post-implementation phase is also an important step in the parameter refinement process.
Some important considerations for performing analytics during iterations of the RPA process are:
- Data availability, which refers to the proportion of data that can actually be systematically monitored and used in the modeling process. How much company data can be accurately monitored and how accurate are these data?
- Is it possible to process unstructured data? Can customer behavior, employee morale or word analysis be performed and used as the basis for a simulation?
- Input/output relationships—can the changes that the product or service undergoes be known at each stage of the process?
- What is the exception rate for this process? How often do exceptions to the rules of the system occur?
- When is judgment/decision making required? When and how often does the process require judgment, input and decision making by human or artificial intelligence?
4. Case Study
The purpose of this case study is to demonstrate the viability of the performance analysis method defined outlines in the previous sections. To this end, discrete process modeling and queueing theory were used to describe and investigate the potential of RPA implementation in the call center of an EUC and to outline future interaction goals between the EUC and the University of São Paulo (USP). We follow the iterative steps shown in Figure 2: (1) Determine performance objectives, (2) Understand process and architecture, (3) Identify and Select RPA Processes, (4) Design Model and (5) Analyze and Interpret results.
4.1. Determining Performance Objectives
The business process considered in this paper is used to compensate EUC’s customers for electrical damage to their property. The goals of EUC in optimizing this process are:
- Minimize in-person damage inspections through remote technical analysis with an equipment availability database and visit scheduling algorithms;
- Complete pricing analyses based on equipment availability surveys and replacement/repair costs;
- Approve compensation payments;
- Request new budgets from customers.
These improvements should cover more than 90% of the current workflow and directly impact the speed of the electrical damage compensation process, the number of customer complaints, the number of technical visits and the Full Time Equivalents (FTEs) required to provide each customer service. The estimated cost to implement this plan is for three months of RPA development, for monthly hardware and software costs and for maintenance. EUC and EY helped develop three different scenarios to model the potential cost savings of investing in these improvements (Table 4).
Table 4.
Three example scenarios that could help predict the potential cost savings of an investment in RPA. Net Present Value (NPV) is the difference between the present value of cash inflows and the present value of cash outflows over a period of time.
4.2. Understand Process and Architecture
A detailed flowchart of the electrical damage reimbursement process for the EUC call center and back office workers was provided as a guide for developing a discrete process model. A simplified version of the flowchart can be found in Figure 6. This flowchart provided the basic structure of the model.
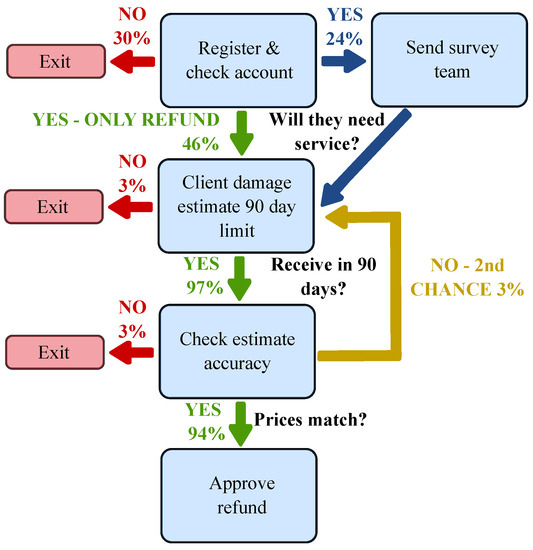
Figure 6.
Simplified flowchart outlining the basic steps for the electrical damage reimbursement process in the EUC.
Figure 6 shows the main services in the process and the percentage of customers using each service. The service that takes the longest time is estimated to be the one checking the cost estimate accuracy, which takes approximately one hour on average. The remaining services take approximately 40 min of employee time to complete. The client damage estimate represents the period when the client must determine how much replacement parts they need and provide that information to EUC. These estimates are based on data from EY, collected from monitoring EUC’s call center operations.
The EUC and EY also provided 2017 call center data that included an estimate of customer throughput (11,000 customers per year from the first state: State-A; 4000 from the second state: State-B) and overall customer service time. State-A and State-B each require two FTEs to complete these tasks. Employees from the EUC call center are paid an average of per month. The cost to dispatch an electrical damage repair team is per day in State-A and per day in State-B. Some of the important statistics on customer service time for each service and the percentage of customers using each service are not yet known, but in many cases estimates have been provided.
4.3. Identify and Select RPA Processes
Most of the processes in this flowchart will be affected by the adoption of this RPA process to optimize business operations and reduce costs. The number of employees needed to complete the process will likely decrease for almost all services. For example, determining whether a customer needs service and estimating the damage and validity of the claim will be replaced largely, but some employees should remain for exceptional cases. The number of teams dispatched to inspect and repair damages for customers will decrease by , and as a result of automation (Table 4).
4.4. Model Design
The model in this paper was developed using the discrete event simulation software Anylogic 8.0. Queues and delays were assigned to services that involve interaction between customers and employees. Delays were assigned to services that involve only system checks by computer software. The flowchart designed by the EUC and EY was used to structure this model, and statistics provided by the EUC and EY were inserted into the appropriate services to calculate predictions. The statistics for State-B and EY were calculated separately to account for the different service costs, service times and service rates of customers. The simulation ran until the relevant metrics reached equilibrium so that the mean approximation could be used to derive results comparable to the predictions in EUC’s scenarios from Table 4.
Data provided by EUC and EY were averaged over thousands of callers. In this work, a triangular distribution was used to model delay times for all services because the only inputs required were the mode and range of possible outcomes. For example, EUC reported an average service time for performing a price check after the customer estimated the cost of damages to be one hour. This value was used as the mode for this service and lower and upper bounds of 30 min and 2 h were set around this value. These values can be changed in future models to optimize results or reflect new information from the EUC.
The equations used to derive the cost savings of the three scenarios outlined by the EUC establish a relationship between the cost savings from reducing the number of FTEs and the number of surveys that must be sent out to inspect electrical damage. The equation used to calculate employee cost per unit time for the State-A and State-B models is given by Equation (1).
Here, is the cost of employees per unit time, N is the number of employees, is the utilization of those employees, is the average time spent on work tasks and S is the salary paid to employees over time .
The cost of paying workers to investigate the electrical damage claims of customers can be calculated using Equation (2).
where is the cost of paying the teams from State-A or State-B, C is the number of customers served by the workers, is the average time spent on the work tasks and S is the salary paid to the work teams over time .
4.5. Analyze and Interpret Results
Since model optimization is an iterative process, this step will primarily serve to lay the groundwork for future models. The first model will provide guidance on which system metrics need to be changed and what data are needed from the EUC and EY. The data gathering and analysis process for this project is ongoing. EUC and EY are still negotiating the steps they will take to reduce costs and are gathering information about their call center infrastructure and the software and hardware that would be required to replace these services. The current model will essentially show whether the methodology in this work can be predictive for the complex processes used within EUC.
The data used for this first stage are from EUC during 2017 and 2018 on business characteristics, available services, customer behavior and infrastructure. In customer services, through the UCI call center, there are 263 thousand incoming calls/month, in Sao Paulo (State-A) and in Espirito Santo (State-B), of which of calls are answered. Service is also provided through 22 social media attendants (Facebook, Twitter, Instagram, Claim Here, Contact Us, EDP Online, SMS, and others). Monthly online media calls are Tablet Store—8306, Totem—108,546, Web Chat—16,689, Internet—1,245,950, Mobile—546,649, SMS—3570, and others—5767. There are 30 agencies in State-A and 69 agencies in State-B. The most requested services in State-A based on quantity are Shipping/Billing Issue, Change Data Partner, Change/Termination Contract, information, Payment agreement, New connection, reconnections; the most requested services in State-B are Shipping/Billing Issue, Change Partner data, Payment agreement, response change, Review Billing and information. Moreover, other services related to the call center are Electrical Damage Remedy (PID).
5. Result and Discussion
The results of this work were obtained from the first iteration of the model shown in Figure 2 and therefore should not be considered quantitative. These results need to be compared with further analysis performed by EUC and EY and then refined to make clear predictions. Results for the three scenarios described can be found in Table 5.
Table 5.
Predicted reduction in electric reimbursement costs over one year—A is Utilization (%), B is Employee Pay (R$), C is Survey Cost (R$) and D is Total Savings (R$).
The EUC and EY predicted that it would take 31, 19 and 16 months, respectively, to make the RPA investments in Scenarios 1, 2 and 3. This model predicts that it will take 46, 35 and 32 months, respectively. These values suggest that the cost savings are significantly underestimated, but one should not place too much weight on the absolute values predicted by this preliminary version of the model. However, the proportion of money saved by State-A and State-B can be used to make predictions that could guide the EUC in their first implementation of RPA. The values of $120,000 per year for the initial employee salary are based on EUC’s estimated average salary data (Table 5). The values for Scenarios 1, 2 and 3 were calculated based on the percentage of hours spent on these tasks by the employees in the back office and the call center.
This model predicts that EUC is likely to save more money if it invests in RPA, particularly in the State-A branch. EUC stated that two FTEs are needed in State-A’s and State-B’s call centers, but State-B’s call center and back office have fewer callers per year. State-B reduces its costs more than State-A only for Scenario 1 because State-B has fewer inspections and repairs of electrical damage due to its higher price ( per day). For Scenarios 2 and 3, State-A saves more money overall because employees have to spend less time cuts (Table 5). It should be noted that this difference in savings could be due to State-B employees performing other duties that are not included in this model.
It appears that Scenario 3 is likely to have the highest return on investment according to the model developed in this paper. This does not take into account the difficulties of integrating the RPA hardware and software with other services within this particular process. It may be advantageous for EUC to start using RPA slowly to prevent unforeseen challenges from adding costs. This model predicts that adding RPA to the suite of services offered by State-B will likely save EUC more money. Therefore, a modest introduction of RPA services in both states would likely be the best step for the first iteration.
The practical/professional consequences, according to the results of this study, have a corporate impact. With the insertion of the methodology, decision making for implementing RPAs can increase the assertiveness in its adoption and application. The economic impacts in the distribution will happen through the reduction of costs and minimizing investments. The operational efficiency results obtained can be replicated in other companies in the electricity sector since the same regulations permeate their processes. The decision to implement RPA could be the answer to more complex and costly business problems in the electricity sector, impacting customer satisfaction. Regarding the impact on the workforce, there will be the possibility of experiencing the ideal profile for the new area in practice, re-qualifying the leaders to manage and act with this new digital workforce.
From the socio-environmental point of view, the construction of successful RPAs will reduce the waste of inputs and greater availability of the electrical system to benefit the population. Proper routing of network services could help reduce emissions. On the other hand, the academic consequences have a perspective of the evolution of a methodology for selecting impact activities in energy generation and distribution companies, oriented towards possible robotizations.
Consequently, periodic monitoring and critical analysis of the performance of the technologies is expected through the methodology developed to monitor market innovations, maintaining a minimum alignment of performance. This is also the case supporting the definition of policies, development standards, robot performance monitoring, governance, ethical behavior issues, and digital performance. The limitations and scenarios in which it could not be applicable at a corporate level are related to factors that may prevent its implementation, such as, for example, regulatory changes, the company’s cultural resistance to adopting new technologies, unavailability of corporate systems and the lack of cooperation.
6. Conclusions
This paper presented a method for indicator selection for business services modeling with G1, G2 and G3+ robots. The proposal was created through meetings and studies carried out by USP, EY and EDP teams with data provided by EUC and EY from 2017 and 2018. The method allows to establish scenarios and propose simulations for performance analysis to generate more detailed and accurate models for the different generations of RPA. In terms of sustainability, the method can be adapted for the Management of Information and Communication Technologies (ICT) Projects. The process of selecting indicators for the EUC call center was described, and the results of the first iteration were provided. This method allowed us to make reasonable predictions with a first-generation RPA model based on the direct evaluation.
Compared with other works from the literature, the novelty of this work is a method of indicator selection and RPA performance analysis to guide the evaluation of robots (robots G1, G2 and G3+). The methodology is described within a set of steps called the USP/EY/EDP Performance Analysis Method. The Performance Analysis Method is a cyclical and evolutionary process, allowing, in each of its iterations, to establish increasingly reliable models, indicators and metrics of business processes and computational systems, to support decision making. Iterative optimization of parameters through cyclic testing is sometimes referred to as a continuous evolution method, where each iteration can serve as input to the next set of parameters. The values, variables and system arrangement itself can be changed based on the results of one iteration of this process. The next step in this research will be to gather more detailed data on employee behavior and workflow efficiency to improve the current method of performance analysis. The speed of response of employees and the computer system to customer needs is critical to predicting which services could be replaced by automation.
The generalizability and adaptability of this performance analysis method are its most important characteristics. The process can be adapted to narrow, technical business processes or to comprehensive, company-wide services. The iterative nature of the process allows easy incorporation of data collected on employee behavior, total expenditure and customer satisfaction. In future iterations of the project, we hope to expand the scope to include business-wide processes that could be organized more effectively and what aspects of those processes could be automated.
Theoretically, the word “robot” used in this work means software, not physical robots. The result of the work is the explanation of the criteria suitable to the company for the future selection of robots (continuous scalability). The managerial and practical implications can be created as an “Observatory of Disruptive Technologies”, which will coordinate the development of robots of different generations for key activities of the company. This Observatory is responsible for following up and monitoring technological evolution, creating and monitoring the methodology for aligning and standardizing robotic development in the organization, and developing rules for information security and training, among other related responsibilities.
The selection of which process will be automated with RPA has application in company activities that impact the operation and are relevant to the company. This involves its customers, regulatory bodies and society, covering activities in the commercial areas, operation and asset management, among other possible and applicable areas. The Observatory will provide constant monitoring and evaluation of processes that may impact the company, providing a methodology for selecting activities, monitoring, and critical analysis of the selection performance through the methodology developed. The limitation of the work is that it are based on metrics generation strategies (performance measurements) obtained through simulation models, analytical modeling and measurements of the real system.
In future work, one should consider performance analysis under different orders of magnitude by combining the relevant system performance analysis experiments under different levels of request data volume in real application scenarios. Other simulation techniques could also be applied, for example, the Petri Net model, to simulate the conduct of customers/users in concurrent scenarios. It is also possible to incorporate different machine learning models, such as deep learning, within the methodology for data training and performance comparisons.
Author Contributions
Conceptualization, R.V.E.Q., F.V.d.A., J.B., P.L.P.C. and B.V.; methodology, R.V.E.Q., P.L.P.C., V.R.d.S.D., J.A.R.B. and B.V.; software and validation, R.V.E.Q., F.V.d.A., V.R.d.S.D., J.A.R.B. and B.V.; investigation, R.V.E.Q., J.B., P.L.P.C., L.V.L.F., J.M., G.M.d.A., E.T.M., V.R.d.S.D., J.A.R.B. and B.V.; writing—original draft preparation, R.V.E.Q., F.V.d.A. and J.B.; writing—review and editing, R.V.E.Q., F.V.d.A., J.B., P.L.P.C. and J.M.; supervision, P.L.P.C., L.V.L.F., G.M.d.A., E.T.M., V.R.d.S.D. and B.V.; project administration, P.L.P.C.; funding acquisition, P.L.P.C. All authors have read and agreed to the published version of the manuscript.
Funding
This work was supported by the Brazilian National Energy Power Agency (ANEEL)’s R&D program. Research funded by FAPESP (2019/21693-0 and 2020/03514-9).
Acknowledgments
This work was partially supported by the ANEEL (Brazilian Electrical Energy Agency) Research & Development Program. Thank you to the staff and faculty of the University of São Paulo for providing guidance and assistance with this research experience. Thank you to Suzanne Allard and Carol Tenopir from the University of Tennessee for their help in initiating this collaboration. Thanks to Denis Mollica and Bruna Vajgel for their participation during the initial project. Thank you to São Paulo Research Foundation (FAPESP): grant #2019/21693-0 and #2020/03514-9. The authors also would like to thank Brazilian National Council for Scientific and Technological Development (CNPq) grant number 140253/2021-1.
Conflicts of Interest
The authors declare no conflict of interest.
References
- Lasi, H.; Fettke, P.; Kemper, H.G.; Feld, T.; Hoffmann, M. Industry 4.0. Bus. Inf. Syst. Eng. 2014, 6, 239–242. [Google Scholar] [CrossRef]
- Sahu, V.S.D.M.; Samal, P.; Panigrahi, C.K. Modelling, and control techniques of robotic manipulators: A review. Mater. Today Proc. 2022, 56, 2758–2766. [Google Scholar] [CrossRef]
- Yin, X.; Pan, L. Direct adaptive robust tracking control for 6 DOF industrial robot with enhanced accuracy. ISA Trans. 2018, 72, 178–184. [Google Scholar] [CrossRef]
- Javaid, M.; Haleem, A.; Singh, R.P.; Suman, R. Artificial Intelligence Applications for Industry 4.0: A Literature-Based Study. J. Ind. Integr. Manag. 2022, 7, 83–111. [Google Scholar] [CrossRef]
- Yin, X.; Pan, L. Enhancing trajectory tracking accuracy for industrial robot with robust adaptive control. Robot. Comput.-Integr. Manuf. 2018, 51, 97–102. [Google Scholar] [CrossRef]
- Yin, X.; Pan, L.; Cai, S. Robust adaptive fuzzy sliding mode trajectory tracking control for serial robotic manipulators. Robot. Comput.-Integr. Manuf. 2021, 72, 101884. [Google Scholar] [CrossRef]
- Kahraman, C.; Deveci, M.; Boltürk, E.; Türk, S. Fuzzy controlled humanoid robots: A literature review. Robot. Auton. Syst. 2020, 134, 103643. [Google Scholar] [CrossRef]
- Zhao, Z.; Ma, Y.; Mushtaq, A.; Rajper, A.M.A.; Shehab, M.; Heybourne, A.; Song, W.; Ren, H.; Tse, Z.T.H. Applications of Robotics, Artificial Intelligence, and Digital Technologies During COVID-19: A Review. Disaster Med. Public Health Prep. 2022, 16, 1634–1644. [Google Scholar] [CrossRef]
- Vrontis, D.; Christofi, M.; Pereira, V.; Tarba, S.; Makrides, A.; Trichina, E. Artificial intelligence, robotics, advanced technologies and human resource management: A systematic review. Int. J. Hum. Resour. Manag. 2022, 33, 1237–1266. [Google Scholar] [CrossRef]
- Fülöp, M.T.; Topor, D.I.; Ionescu, C.A.; Căpușneanu, S.; Breaz, T.O.; Stanescu, S.G. Fintech accounting and Industry 4.0: Future-proofing or threats to the accounting profession? J. Bus. Econ. Manag. 2022, 23, 997–1015. [Google Scholar] [CrossRef]
- Akram, U.; Fülöp, M.T.; Tiron-Tudor, A.; Topor, D.I.; Căpușneanu, S. Impact of digitalization on customers’ well-being in the pandemic period: Challenges and opportunities for the retail industry. Int. J. Environ. Res. Public Health 2021, 18, 7533. [Google Scholar] [CrossRef]
- Santos, F.; Pereira, R.; Vasconcelos, J.B. Toward robotic process automation implementation: An end-to-end perspective. Bus. Process Manag. J. 2019, 26, 405–420. [Google Scholar] [CrossRef]
- Houy, C.; Reiter, M.; Fettke, P.; Loos, P. Towards Green BPM—Sustainability and Resource Efficiency through Business Process Management. In Business Process Management Workshops; zur Muehlen, M., Su, J., Eds.; Springer: Berlin/Heidelberg, Germany, 2011; pp. 501–510. [Google Scholar] [CrossRef]
- Cleven, A.; Winter, R.; Wortmann, F. Process Performance Management as a Basic Concept for Sustainable Business Process Management—Empirical Investigation and Research Agenda. In Business Process Management Workshops; zur Muehlen, M., Su, J., Eds.; Springer: Berlin/Heidelberg, Germany, 2011; pp. 479–488. [Google Scholar] [CrossRef]
- Mohamed, S.A.; Mahmoud, M.A.; Mahdi, M.N.; Mostafa, S.A. Improving Efficiency and Effectiveness of Robotic Process Automation in Human Resource Management. Sustainability 2022, 14, 3920. [Google Scholar] [CrossRef]
- Gupta, S.; Rani, S.; Dixit, A. Recent Trends in Automation-A study of RPA Development Tools. In Proceedings of the 2019 3rd International Conference on Recent Developments in Control, Automation Power Engineering (RDCAPE), Noida, India, 10–11 October 2019; pp. 159–163. [Google Scholar] [CrossRef]
- Kobayashi, T.; Arai, K.; Imai, T.; Watanabe, T. RPA Constitution Model for Consumer Service System based on IoT. In Proceedings of the 2019 IEEE 23rd International Symposium on Consumer Technologies (ISCT), Ancona, Italy, 19–21 June 2019; pp. 82–86. [Google Scholar] [CrossRef]
- Xue, C. A Task Parallel Processing Technology for Robot Process Automation. In Proceedings of the 2019 4th International Conference on Mechanical, Control and Computer Engineering (ICMCCE), Hohhot, China, 25–27 October 2019; pp. 543–5432. [Google Scholar] [CrossRef]
- Willcocks, L.; Lacity, M.; Craig, A. Robotic process automation: Strategic transformation lever for global business services? J. Inf. Technol. Teach. Cases 2017, 7, 17–28. [Google Scholar] [CrossRef]
- Asatiani, A.; Penttinen, E. Turning robotic process automation into commercial success—Case OpusCapita. J. Inf. Technol. Teach. Cases 2016, 6, 67–74. [Google Scholar] [CrossRef]
- Van der Aalst, W.M.; Bichler, M.; Heinzl, A. Robotic process automation. Bus. Inf. Syst. Eng. 2018, 60, 269–272. [Google Scholar] [CrossRef]
- Desai, P. Robotic process automation: RPA Pre-requisite and pivotal points: Special Issue: Special issue:IAISCT(SS4). In Proceedings of the 2020 International Conference on Smart Technologies in Computing, Electrical and Electronics (ICSTCEE), Bengaluru, India, 9–10 October 2020; pp. 446–451. [Google Scholar] [CrossRef]
- Ma, Y.; Lin, D.; Chen, S.; Chu, H.; Chen, J. System Design and Development for Robotic Process Automation. In Proceedings of the 2019 IEEE International Conference on Smart Cloud (SmartCloud), Tokyo, Japan, 10–12 December 2019; pp. 187–189. [Google Scholar] [CrossRef]
- Asatiani, A.; Copeland, O.; Penttinen, E. Deciding on the robotic process automation operating model: A checklist for RPA managers. Bus. Horizons 2023, 66, 109–121. [Google Scholar] [CrossRef]
- DeGlopper, D.R. The Art Of Computer Systems Performance Analysis: Techniques for Experimental Design, Measurement, Simulation and Modeling; Jain, R., Ed.; John Wiley & Sons: New York, NY, USA, 1991; p. 720. [Google Scholar] [CrossRef]
- Coglianese, C.; Lehr, D. Regulating by robot: Administrative decision making in the machine-learning era. Geo. LJ 2016, 105, 1147. [Google Scholar]
- Gotthardt, M.; Koivulaakso, D.; Paksoy, O.; Saramo, C.; Martikainen, M.; Lehner, O. Current state and challenges in the implementation of robotic process automation and artificial intelligence in accounting and auditing. ACRN Oxf. J. Financ. Risk Perspect. 2019, 8, 31–46. [Google Scholar] [CrossRef]
- Mendling, J.; Decker, G.; Hull, R.; Reijers, H.A.; Weber, I. How do machine learning, robotic process automation, and blockchains affect the human factor in business process management? Commun. Assoc. Inf. Syst. 2018, 43, 19. [Google Scholar] [CrossRef]
- Madakam, S.; Holmukhe, R.M.; Jaiswal, D.K. The Future Digital Work Force: Robotic Process Automation (RPA). JISTEM—J. Inf. Syst. Technol. Manag. 2019, 16, e201916001. [Google Scholar] [CrossRef]
- Ling, X.; Gao, M.; Wang, D. Intelligent document processing based on RPA and machine learning. In Proceedings of the 2020 Chinese Automation Congress (CAC), Shanghai, China, 6–8 November 2020; pp. 1349–1353. [Google Scholar] [CrossRef]
- Ribeiro, J.; Lima, R.; Eckhardt, T.; Paiva, S. Robotic Process Automation and Artificial Intelligence in Industry 4.0—A Literature review. Procedia Comput. Sci. 2021, 181, 51–58. [Google Scholar] [CrossRef]
- Siderska, J. Robotic Process Automation—A driver of digital transformation? Eng. Manag. Prod. Serv. 2020, 12, 21–31. [Google Scholar] [CrossRef]
- Vajgel, B.; Corrêa, P.L.P.; Tóssoli De Sousa, T.; Encinas Quille, R.V.; Bedoya, J.A.R.; Almeida, G.M.D.; Filgueiras, L.V.L.; Demuner, V.R.S.; Mollica, D. Development of Intelligent Robotic Process Automation: A Utility Case Study in Brazil. IEEE Access 2021, 9, 71222–71235. [Google Scholar] [CrossRef]
- Grover, V.; Kettinger, W.J. Process Think: Winning Perspectives for Business Change in the Information Age; IGI Global: Hershey, PA, USA, 2000. [Google Scholar] [CrossRef]
- Jacobson, I. Object-Oriented Software Engineering: A Use Case Driven Approach; Addison Wesley Longman Publishing Co., Inc.: Boston, MA, USA, 2004; Available online: https://dl.acm.org/doi/10.5555/993806 (accessed on 5 September 2022).
- OMG Consortium. Documents Associated With Business Process Model And Notation (BPMN) Version 2.0. 2011. Available online: http://www.omg.org/spec/BPMN/2.0/ (accessed on 5 September 2022).
- Vergidis, K.; Tiwari, A.; Majeed, B. Business Process Analysis and Optimization: Beyond Reengineering. IEEE Trans. Syst. Man Cybern. Part C (Appl. Rev.) 2008, 38, 69–82. [Google Scholar] [CrossRef]
- Durrett, R.; Durrett, R. Essentials of Stochastic Processes; Springer: New York, NY, USA, 2012; Volume 1. [Google Scholar] [CrossRef]
- Menasce, D. Load testing of Web sites. IEEE Internet Comput. 2002, 6, 70–74. [Google Scholar] [CrossRef]
- Menasce, D.A.; Almeida, V. Capacity Planning for Web Services: Metrics, Models, and Methods, 1st ed.; Prentice Hall PTR: Upper Saddle River, NJ, USA, 2001; Available online: https://dl.acm.org/doi/10.5555/560806 (accessed on 5 September 2022).
- Menasce, D.A.; Dowdy, L.W.; Almeida, V.A.F. Performance by Design: Computer Capacity Planning By Example; Prentice Hall PTR: Upper Saddle River, NJ, USA, 2004; Available online: https://dl.acm.org/doi/10.5555/995032 (accessed on 5 September 2022).
- Brown, L.; Gans, N.; Mandelbaum, A.; Sakov, A.; Shen, H.; Zeltyn, S.; Zhao, L. Statistical Analysis of a Telephone Call Center. J. Am. Stat. Assoc. 2005, 100, 36–50. [Google Scholar] [CrossRef]
- Karakus, B.; Aydin, G. Call center performance evaluation using big data analytics. In Proceedings of the 2016 International Symposium on Networks, Computers and Communications (ISNCC), Yasmine Hammamet, Tunisia, 11–13 May 2016; pp. 1–6. [Google Scholar] [CrossRef]
- Filgueiras, L.V.L.; Corrêa, P.L.P.; Alves-Souza, S.N.; Teodoro, S.M.; Silva, M.S.P.d.; Encinas Quille, R.V.; Demuner, V.R.d.S. Working with robotic process automation: User experience after 18 months of adoption. Front. Comput. Sci. 2022, 4. [Google Scholar] [CrossRef]
- Young, E. Robotic Process Automation—White Paper. 2015. Available online: http://www.ey.com/Publication/vwLUAssets/ey-robotic-process-automation/\protect\T1\textdollarFILE/ey-robotic-process-automation.pdf (accessed on 17 April 2019).
- Gregg, B. Systems Performance: Enterprise and the Cloud, 1st ed.; Prentice Hall Press: Upper Saddle River, NJ, USA, 2013; Available online: https://dl.acm.org/doi/10.5555/2568162 (accessed on 5 September 2022).
- Bresciani, P.; Perini, A.; Giorgini, P.; Giunchiglia, F.; Mylopoulos, J. Modeling Early Requirements in Tropos: A Transformation Based Approach. In Agent-Oriented Software Engineering II, Second International Workshop, AOSE 2001, Montreal, Canada, May 29, 2001, Revised Papers and Invited Contributions; Springer: Berlin, Heidelberg, Germany, 2001; pp. 151–168. [Google Scholar] [CrossRef]
- Barone, D.; Jiang, L.; Amyot, D.; Mylopoulos, J. Reasoning with Key Performance Indicators. In The Practice of Enterprise Modeling; Johannesson, P., Krogstie, J., Opdahl, A.L., Eds.; Springer: Berlin/Heidelberg, Germany, 2011; pp. 82–96. [Google Scholar] [CrossRef]
- Lacity, M.; Willcocks, L.P.; Craig, A. Robotic Process Automation at Telefonica O2; LSE Research Online Documents on Economics 64516; London School of Economics and Political Science, LSE Library: London, UK, 2015. [Google Scholar]
- Khan, S. Ethem Alpaydin. Introduction to Machine Learning (Adaptive Computation and Machine Learning Series). Nat. Lang. Eng. 2008, 14, 133–137. [Google Scholar] [CrossRef]


Disclaimer/Publisher’s Note: The statements, opinions and data contained in all publications are solely those of the individual author(s) and contributor(s) and not of MDPI and/or the editor(s). MDPI and/or the editor(s) disclaim responsibility for any injury to people or property resulting from any ideas, methods, instructions or products referred to in the content. |
© 2023 by the authors. Licensee MDPI, Basel, Switzerland. This article is an open access article distributed under the terms and conditions of the Creative Commons Attribution (CC BY) license (https://creativecommons.org/licenses/by/4.0/).