Abstract
Root–soil mechanical interactions are of vital importance in soil reinforcement by plant roots. However, it is unclear how the angles of the roots in the soil affect the root–soil mechanical interactions. To better understand the effect of this factor on root–soil mechanical interactions, pullout tests were conducted on alfalfa (Medicago sativa L.) roots with five root diameter groups (0.10–0.30 mm, 0.31–0.50 mm, 0.51–0.70 mm, 0.71–0.90 mm and 0.91–1.10 mm) and four embedding angles (30°, 45°, 60° and 90°) in sandy loam soil. Root tensile tests were also carried out to understand the process of root failure in the pullout tests. The results showed that the roots had two failure modes, slippage failure and breakage failure. The critical diameter of the two failure modes was 0.35 mm. Peak pullout force and pullout energy were positively related to the root diameter in power functions. Displacement was negatively related to the root diameter and embedding angle in exponential functions. Peak pullout force, root–soil friction coefficient and pullout energy all increased and then decreased with increasing embedding angles. The peak pullout force and root–soil friction coefficient reached their maximum values under an embedding angle of 60°, and pullout energy reached the maximum value under an embedding angle of 45°. Pullout energy was suggested as a preferred index of root–soil mechanical interactions for both thick/fine roots and inclined/upright roots.
1. Introduction
Long-term soil erosion causes serious problems such as a decline in soil fertility and soil water retention, slope instability and crop yield reduction. These pose not only a threat to human life and property safety but also obstacles to economic development. Vegetation can exert hydrological and mechanical effects to prevent soil erosion and improve slope stability [1,2]. The hydrological effect of roots in semi-arid environments is relatively small due to the temporal disappearance of the above-ground biomass of plants [3]. Because soil has a strong capacity for compressive stress and plant roots have a great tolerance to tensile stress, roots in soil, acting like steel in concrete, can greatly improve slope stability [4,5,6]. In the early stage of a landslide, the root–soil composite is subject to shear, tension and compression failures [5]. Previous studies have concentrated on the contribution of root reinforcement under the condition of shear failure [7,8]. Schwarz et al. [5] studied the strength properties of reinforced soil by plant roots during the process of compression failure. However, very few systematic investigations have been conducted on the root–soil mechanical interactions of pullout roots during root reinforcement.
When a root–soil composite experiences high tensile or shear stress, the roots in the soil will completely slip out or be broken into two segments [9]. Root failure modes depend largely on the root–soil interaction. The interaction is affected by many factors, including soil conditions (confining pressure, soil type and soil moisture content) and root morphological characteristics (root length, root tortuosity, root spacing, root branching pattern and root diameter) during the root pullout process [10,11,12,13]. These factors could result in variations in the interaction characteristics between the roots and soil. For example, a study by Liang et al. [14] on root analogs showed that the maximum pullout force increased with confining stress. Roots in sandy soils have a very different uprooting performance from those in clay soils [15]. In clay soils, peak pullout forces decrease slightly with increasing soil water content, and force–displacement curves for dry soils are steeper and more fluctuations occur after the peak pullout force than in wet soils. Conversely, peak pullout forces in wet sands are three to five times larger than those in dry sands, and force–displacement curves after peak pullout force are smoother in dry sands than in wet sands [11]. Additionally, roots in wet clays show smaller peak pullout forces and greater pullout displacements than in dry clays [10]. Small roots (diameter < 2 mm) tend to break under dry soils and to slip out under wet soils [4,11].
The parameters of root morphological characteristics usually include root diameter, root length, root curvature and root branching pattern, and they are closely related to each other. Generally, thicker roots are longer than thin roots and have a greater root curvature. Consequently, more branches could occur on the thicker roots. The relationship between root length and root diameter could be a positive power function [10,12]. Previous studies focused on the qualitative and quantitative analyses of the relationship between root diameter/length and pullout force. Root pullout resistance increases linearly with root length [16], and linearly [17,18] or as a power function [11,19,20] with root diameter. The Root Bundle Model (RBM), a model established recently for estimating root reinforcement, considers pullout force and deformation of roots with different diameters, lengths, tortuosity and branching patterns [10]. It shows that the peak pullout force and displacement at the maximum pullout force increase with increasing tortuosity and branch and root diameter [11]. FBMs-W, another model for root reinforcement, considers pullout energy (joining both pullout force and displacement) as a criterion to determine the root failure order and provides a relatively conservative estimation of soil reinforcement by plant roots [21]. However, few quantitative studies are carried out on the mechanism of root–soil interactions, including the peak pullout force, displacement at maximum pullout force, and pullout energy of roots with different diameters and embedding angles. Moreover, the root–soil interface friction coefficient could largely affect the failure modes of pullout roots, which can determine the activated root length during root pullout tests [22]. However, the root–soil interface friction coefficient under various root diameters and embedding angles is rarely reported. In addition, a critical root diameter exists between slippage failure and breakage failure for the roots of woody plants, which has a certain influence on the shear strength of the root–soil composites. Roots larger than the critical diameter are likely to break, while roots smaller than the critical diameter tend to be pulled out [4]. It remains unclear whether the critical root diameter exists in herbaceous plants.
Therefore, the main objectives of this study were (1) to explore the process properties of slippage failure and breakage failure, (2) to check the critical root diameter of herbaceous plants, (3) to quantitatively analyze the effect of the root embedding angle on root–soil interaction properties, and (4) to discuss the frictional characteristics of root–soil interactions.
2. Materials and Methods
2.1. Study Area
The study area is located in Taiyuan City (111°30′–113°09′ E, 37°27′–38°25′ N), Shanxi Province, China. The average elevation is about 800 m. There are distinct four seasons with hot and rainy summers and cold and dry winters. The climate is northern temperate continental with an annual average temperature of 9.5 °C and an annual average sunlight of 2808 h. Monthly average temperatures range from −6.4 °C in January to 23 °C in July. The area is on the east wing of the Loess Plateau of China, which is surrounded by mountains to the west, north and east of the city and is flat in the middle and south. Annual average precipitation is 456 mm, and annual average evaporation is 1720 mm. The precipitation is mainly concentrated from June to August. The study area is in the semi-arid and severe soil loss region.
2.2. Preparation of Roots
Alfalfa (Medicago sativa L.) is a perennial herbaceous legume with dense and small leaves. It can effectively trap rainwater, and its thick and developed roots can penetrate deeply into the soil. Due to its strong resistance to low temperatures and drought, it is widely planted and has become a pioneer plant for ecological protection and water and soil conservation. In this experiment, alfalfa was planted in 500 × 500 × 500 mm chambers under the natural environmental conditions at the experimental base in the College of Water Resource Science and Engineering, Taiyuan University of Technology (Figure 1a). Grown for 4 months, alfalfa roots were collected with water jetting method. Diameters at five different positions of the roots were measured with three replicates for each position using a vernier caliper (0.01 mm accuracy), and the average diameter of the five positions was taken as root diameter value D. The plant height of alfalfa was 80–220 mm, measured with a tape measure. Healthy and intact root samples were selected to be sealed into sealing bags and stored in a refrigerator at 4 °C to maintain root freshness [23]. The preservation time did not exceed 8 h (generally less than 4 h). Some root samples were scanned and analyzed with LA-S plant root analysis system (Hangzhou WSeen Detection Technology Co. Ltd., Hangzhou, China) to obtain root morphological properties. Some samples were used to obtain root biomass with the oven method. The remaining roots were then used for the preparation of soil samples. The total root length was 200–400 mm. Root diameter of taproots was 0.20–1.00 mm. The underground dry biomass was 0.09 g per plant and the aboveground dry biomass was 0.08 g per plant. The root system of alfalfa was a taproot type (Figure 1b), having a strong and long main root with very few fibrous roots and lateral roots. To remove the influence of lateral roots on the results, these alfalfa roots were pruned to remove lateral roots. During the preparation of soil samples with roots for root pullout tests, the roots were then trimmed to a length of 200 mm (40 mm free outside soil + 160 mm buried in soil) and buried into the soil. In order to decrease rupture and slippage at clamping position during root pullout tests, 20 mm-wide medical pressure-sensitive adhesive tape was bound to the free end of the roots.
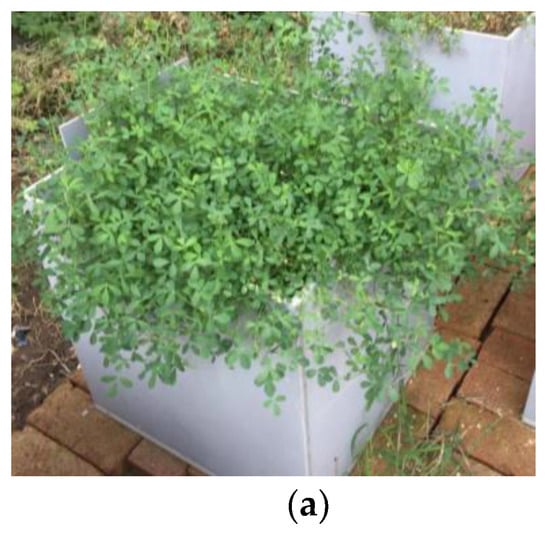
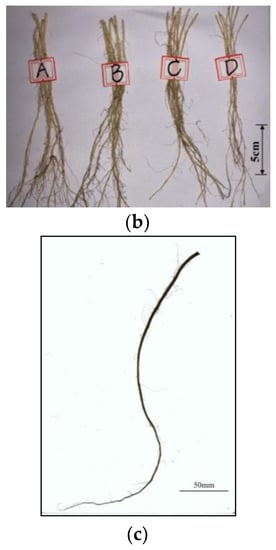
Figure 1.
Partial alfalfa plants cultured in a chamber (a) and alfalfa roots collected and grouped into A–D by diameter (b) and scanned (c).
2.3. Preparation of Soil
Soil was sampled from the top 20 cm in the north suburb of Taiyuan City. After sampling, the soil was air-dried and passed through a 3 mm sieve, and then stored at 4 °C. The soil was a sandy loam (Table 1). Due to the dry soil conditions in the study area, the soil was wetted to 9.89% gravimetric water content (35 kPa soil water potential) and then compacted in cubic iron boxes of 200 × 200 × 200 mm (length × width × depth) for root pullout tests. The boxes had two removable plates, one of which had a narrow gap (60 × 10 mm) in the center for exposing roots. The compaction of soil samples was divided into five layers using the WDW-5 electronic universal testing system (Changzhou Sanfeng Instrument Technology Co., Ltd., Changzhou, China) (Figure 2). Each soil layer had 2800 g wetted soil. The loading pressure was 3604 N (90.10 kPa), and the compaction speed was 50 mm·min−1. Soil bulk density of the samples was then controlled at 1.43 g·cm−3. During the compaction, two 200 mm-length roots were placed into the narrow gap of the soil boxes with a spacing of 60 mm when the soil samples were loaded into the second layer. The neighboring roots do not interact with each other mechanically if root spacing is more than 15 mm [12]. To make the roots and the soil bond well, the preceding layer of soil was roughened before each new soil layer was added. The test boxes with roots were placed in sealed bags to stand for 24 h at 4 °C before root pullout tests.

Table 1.
Characteristics of the experimental soil.
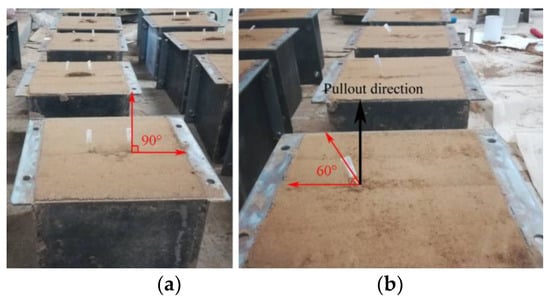
Figure 2.
Embedding angles and pullout direction of root samples in the soil-filled iron boxes ((a) embedding angle 90°; (b) embedding angle 60°).
2.4. Root Pullout Tests
Root pullout tests were carried out on roots with five groups of root diameter, 0.10–0.30 mm, 0.31–0.50 mm, 0.51–0.70 mm, 0.71–0.90 mm and 0.91–1.10 mm, at an embedding angle of 90°, and roots in four embedding angles, 30°, 45°, 60° and 90°, with root diameter 0.44–0.94 mm (Figure 2). In the pullout tests, the root section with the medical tape was first fixed in the upper clamp of the WDW-5 and then pulled at a speed of 100 mm·min−1. Real-time data from the tests were recorded using the SH-200 digital force gauge (SUNDOO, Foshan Zhunce Electronics Co., Ltd., Foshan, China) (Figure 3). After the root was completely pulled out or broken (fractured in the soil), data including peak pullout force, duration of peak pullout force and force–displacement curve were recorded and saved.
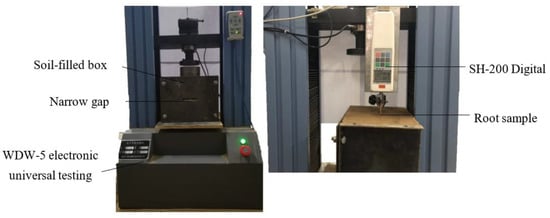
Figure 3.
Pullout test equipment (WDW-5 electronic universal testing machine and SH-200 digital pullout machine).
Pullout energy is the work of external force on root–soil composite when the load reaches peak pullout force, which is:
where F(x) is curvilinear relationship between pullout force and displacement before peak pullout force, and x is displacement before peak pullout force.
Root–soil interface friction coefficient () during the pullout process was obtained with this formula [24]:
where F is peak pullout force (N); is soil bulk density (g·cm−3); L is total root length (cm); D is average root diameter (cm); θ is embedding angle of the root system (rad).
2.5. Root Tensile Tests
To know the mechanical properties of alfalfa roots and understand the process of root failure in the pullout tests, root tensile tests were conducted using the WDW-5. At the beginning of the tests, 20 mm-wide medical pressure-sensitive adhesive tape was bound to each end of the roots to decrease rupture and slippage at the clamping positions. Root gauge length between the clamps was 160 mm, measured with a tape measure (accuracy of 1 mm). The tensile rate was 100 mm·min−1. Only the data of roots broken away from the clamps were regarded as valid data, and other failures such as slippage and breakage at the clamps were considered invalid. Root length and root diameter at the failure point were measured after the root failed. A total of 60 samples were conducted in the tensile tests, and 21 samples were successfully tested. Root tensile strength and elongation were calculated with the following formula:
where FT is peak tensile force (N); T is root tensile strength (MPa); D is average root diameter (mm); ΔL is deformation when the root is broken (mm); L is original gauge length (160 mm); is root elongation (%).
2.6. Data Analysis
The One-Way ANOVA in SPSS20 was used to analyze the significant differences in root diameter, displacement at peak pullout force, duration of peak pullout force, pullout energy, root–soil interface friction coefficient and peak pullout force under different root diameters and embedding angles. Once it was determined that there was a difference between the mean values of a parameter at different root diameters or embedding angles, LSD/Tamhane’s T2 (M) was used as a pairwise comparison test to determine which mean values were different. The variables were described as mean ± standard error in this paper. Figures were drawn with OriginPro 2016.
3. Results
3.1. Root Morphological Properties
According to the investigation into the root morphological character of 21 alfalfa plants, alfalfa showed obvious taproots (Figure 1c). The root length of the taproot was 322.9 ± 10.0 mm, and the root diameter was 1.76 ± 0.11 mm. The number of first-order lateral roots was 29 ± 3. The first-order lateral roots had a length of 458.4 ± 53.3 mm, which was 41.96% higher than that of the taproot, and a mean root diameter of 0.30 ± 0.19 mm, which was 82.95% smaller than that of the taproot.
3.2. Different Failure Modes of Pullout Tests
Two failure modes of root pullout tests, slippage failure and breakage failure, were observed in this study. The relationship between pullout force and displacement is shown as L–S curves in Figure 4 and Figure 5. The L–S curves were divided into three stages under slippage failure (Figure 4): (1) The elastic deformation stage (OA). Root displacement was mainly caused by the tensile deformation of the root. (2) The root–soil interfacial debonding stage (AB). The mechanical function of the whole root was exhausted, and the root–soil connection effect was weakened. Pullout force decreased and fluctuated rapidly with the increase in root displacement. (3) The post-debonding friction stage (BC). After the maximum pulling load (point A), the pullout force decreased due to strain-softening of the smaller displacement and then due to the reduction in the contact area between soil and root. The L–S curve changed exponentially (AC). The L–S curves of root breakage failure included two different types. The first type (Figure 5a) was determined by the maximum tensile force. When the root–soil friction was greater than the maximum tensile force, the root system was broken. The L–S curve of this type was divided into the elastic deformation stage (OM), the plastic deformation stage (MK) and the root fracture stage (KP). The second type (Figure 5b) was determined by the ultimate tensile deformation. It was divided into the elastic deformation stage (OM), the root–soil interfacial debonding stage (MK) and the root system fracture stage (KP). In this type, when the load reached the maximum pullout force (point M), the force between the root and soil changed from static friction to sliding friction, and the whole root began to slide. The soil around the root was in a state of semi-fastening and semi-relaxation. The internal structure of the root was damaged, which resulted in weak points along the root. The displacement in the OM stage increased sharply, while the fluctuation range of the pullout resistance was small. The root was broken when it reached its limit of deformation (KP). The displacement of OK was the sum of the ultimate tensile deformation and slip displacement.
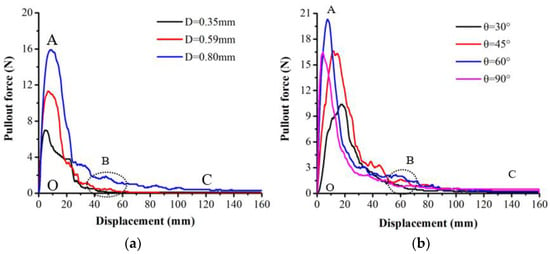
Figure 4.
Pullout force–displacement (L–S) curves of root slippage failure ((a) embedding angle 90°; (b) root diameter = 0.85–0.88 mm; D is root diameter; θ is embedding angle; O, A, B and C are positions of the curves).
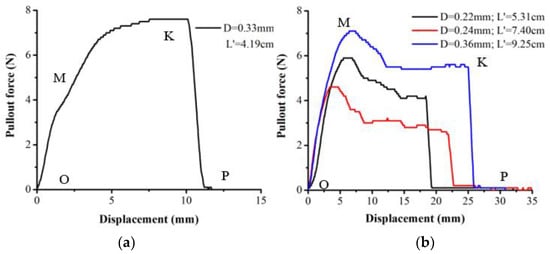
Figure 5.
Pullout force–displacement (L–S) curves of root breakage failure ((a) root breakage failure determined by the maximum tensile force in case of embedding angle 90°; (b) root breakage failure determined by the ultimate tensile deformation in case of embedding angle 90°; D is root diameter; L’ is pullout root length; O, M, K and P are positions of the curves).
Root diameter was related to peak pullout force in the positive power functions under the two failure modes (Slippage: F = 19.74D1.005, R2 = 0.933; Breakage: F = 12.71D0.587, R2 = 0.657; Figure 6). The slope of the curve under the slippage failure was greater than that under the breakage failure, and the root diameter at the intersection of the two curves was 0.35 mm. When the root diameter was less than 0.35 mm, the root tensile strength was too small to overcome the root–soil friction. Consequently, the roots were easily broken. When the root diameter was greater than 0.35 mm, the pullout force was smaller than the tensile force, and the roots tended to be pulled out (Figure 6). The critical root diameter of the two failure modes was 0.35 mm.
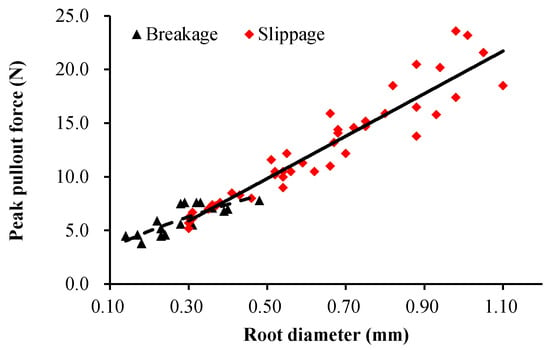
Figure 6.
Positive power functions between peak pullout force and root diameter under different failure modes (Slippage: F = 19.74D1.005, R2 = 0.933; Breakage: F = 12.71D0.587, R2 = 0.657) (embedding angle 90°).
3.3. Duration, Displacement and Pullout Energy
The duration of peak pullout force, displacement at peak pullout force and pullout energy of roots under slippage failure and breakage failure were divided into five diameter groups: 0.10–0.30 mm, 0.31–0.50 mm, 0.51–0.70 mm, 0.71–0.90 mm and 0.91–1.10 mm (Table 2). The average root diameters of the five groups were significantly different (p < 0.05). The duration of the peak pullout force and displacement at the peak pullout force decreased gradually with root diameter. The maximum decrease was 55.9% (duration of peak pullout force) and 27.3% (displacement at peak pullout force) in slippage failure when the root diameter increased by 170.3% from 0.37 mm to 1.00 mm. The displacement at peak pullout force accounted for 5.95–6.87% and 3.22–4.43% of the total displacement for breakage failure and slippage failure, respectively. The displacement at peak pullout force was significantly different between the root diameter groups of 0.30–0.50 mm and 0.91–1.10 mm. In addition, the pullout energy of breakage failure was greater than that of slippage failure at the same root diameter level. Pullout energy was significantly related to root diameter in a power function (Vɛ = 78.38D0.71, R2 = 0.999, p < 0.05), and displacement at peak pullout force was linked with root diameter in a negative exponential function (x = 8.35e−0.47D, R2 = 0.961, p < 0.05) (Figure 7).

Table 2.
Duration of peak pullout force, displacement at peak pullout force and pullout energy of different root diameter levels under slippage failure and breakage failure.
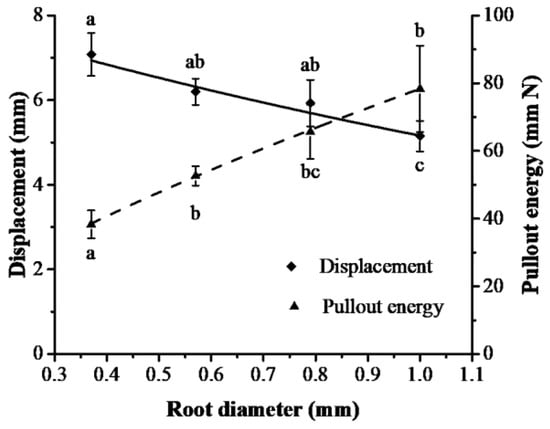
Figure 7.
Relationships between pullout energy and displacement at peak pullout force and root diameter in slippage failure (different lowercase letters in the figure show significant difference in pullout energy and displacement between root diameter groups at level p < 0.05).
When the average root diameters were not significantly different between the four embedding angles, 30°, 45°, 60° and 90°, the roots in embedding angles 30° and 60° were easier to break, and the breakage rate was 10% and 20%, respectively (Table 3). The change in the duration of peak pullout force with the embedding angle was not obvious. The maximum duration of peak pullout force was 0.50 ± 0.09 s under 45°, which was 4.0–34.0% bigger than those under other embedding angles. Moreover, pullout energy increased and then decreased with the embedding angle. Pullout energy was significantly smaller at 90° than those at the other three angles. The maximum pullout energy was 103.16 ± 11.17 mm·N under 45° (Figure 8).

Table 3.
Failure modes and pullout energy of roots in different embedding angles.
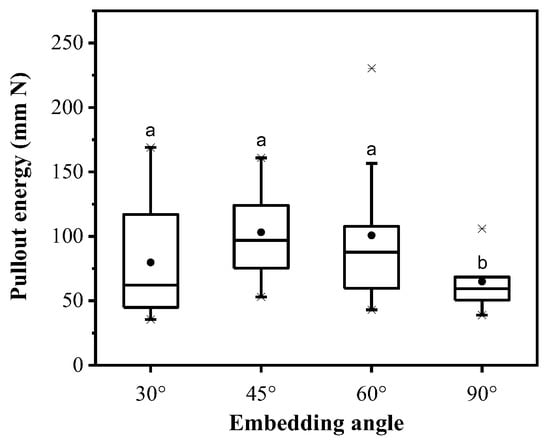
Figure 8.
Pullout energy variations under different embedding angles of roots (different lowercase letters show significant difference in pullout energy between embedding angles at level p < 0.05).
Displacement at peak pullout force under the four embedding angles was significantly different (p < 0.05), and it was related to the embedding angle in a negative exponential function (x = 22.59e−0.014θ; R2 = 0.997). The maximum displacement was 14.25 ± 3.26 mm under 30° and the minimum displacement was 6.33 ± 0.64 mm under 90° (Figure 9). Displacement at peak pullout force accounted for 3.96–8.91% of the total displacement for all embedding angles.
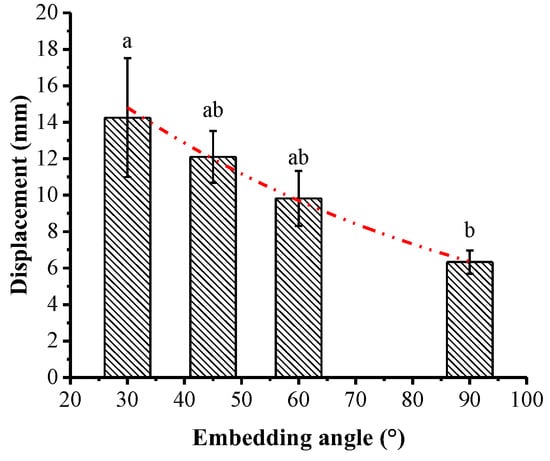
Figure 9.
Pullout displacement at peak pullout force under different embedding angles (different lowercase letters show significant difference in displacement between embedding angles at level p < 0.05).
3.4. Peak Pullout Force and Root–Soil Interface Friction Coefficient
The peak pullout force increased significantly with the root diameter (p < 0.01). The average root–soil friction coefficient was slightly greater in the thick root diameter group than in the fine root diameter group, but the difference was not significant (p > 0.05, Table 4), demonstrating that the friction coefficient between the roots and soil was not obviously affected by the thickness of the roots.

Table 4.
Peak pullout force and root–soil interface friction coefficient of different root levels under slippage failure.
The embedding angle of roots significantly affected the peak pullout force and root–soil interface friction coefficient. The peak pullout force and root–soil friction coefficient first increased and then decreased with an increasing embedding angle. Compared with the embedding angle of 90°, which was usually used in root pullout tests, the minimums of peak pullout force and root–soil friction coefficient decreased by 28.1% and 60.2% under 30°, and the maximums of peak pullout force and root–soil friction coefficient increased by 15.1% and 7.3% under 60° (Figure 10).
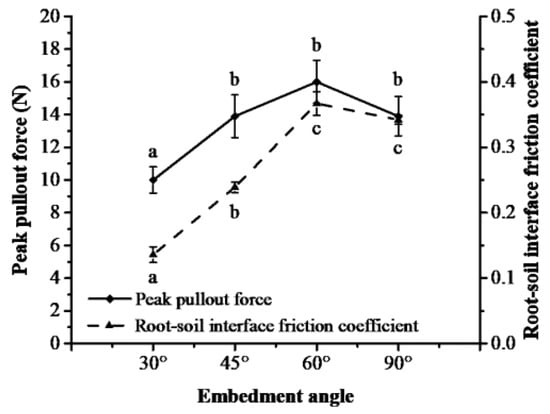
Figure 10.
Peak pullout force and root–soil interface friction coefficient under different embedding angles (different lowercase letters show significant difference in peak pullout force and root–soil interface friction coefficient between embedding angles at level p < 0.05).
3.5. Tensile Mechanical Property of Alfalfa Roots
In the tensile test, the ultimate deformation, ultimate elongation and tensile strength decreased while the peak tensile force increased with the root diameter (Table 5). When the root diameter increased by 0.2 mm, the ultimate deformation decreased by 10.0–11.7%, tensile strength decreased by 10.2–41.6% and peak tensile force increased by 27.1–75.2%.

Table 5.
Tensile mechanical property of alfalfa roots at different diameter levels.
4. Discussion
4.1. Failure Modes
When the 160 mm-long alfalfa roots were pulled vertically from the sandy loam soil with a soil water content of 9.89% and a soil bulk density of 1.43 g·cm−3, the critical diameter of the alfalfa roots was 0.35 mm, which indicated that roots smaller than 0.35 mm were prone to breakage while roots larger than 0.35 mm were easy to slip out. The phenomenon was also observed by Guo et al. [25] and [26]. In our study, to investigate the effect of root diameter on root pullout properties, the root length of all roots was controlled at 160 mm. Similarly, root length in the above-mentioned studies was also controlled in the same way. Small roots are usually weaker than large roots in tensile force [27,28]. Therefore, the small roots were easy to break in these studies because their tensile forces could not overcome the maximum friction between the roots and soil. Some research shows different results for root failure modes. They indicate that fine roots tend to be pulled out and coarse roots tend to break [4,10,11]. The soil conditions in these studies are different from ours. Soil water content and soil texture affect the pullout force of roots in pullout tests and would affect the value of the critical root diameter [11,29,30]. However, the root failure modes corresponding to different root diameters will not be reversed [31]. The most likely reason for the different results is the effect of root length. Pullout tests of these studies were conducted on naturally growing roots in the field or un-trimmed roots in the laboratory. In most cases, the root diameter is positively correlated with the length for naturally growing roots [10,12,31,32]. Stokes et al. [33] showed that roots with more length embedded in soil could result in greater anchoring performance. Moreover, longer roots, having a higher root tortuosity, number of branches, root hairs, and biological exudates, can produce greater root–soil interfacial friction [12]. Consequently, long roots tend to break due to high friction with the soil, and short roots tend to slip because of low friction with the soil [10]. In summary, root length is a non-negligible factor affecting the failure modes of root pullout tests.
4.2. Frictional Characteristics between the Roots and Soil
The result that peak pullout force increases with root diameter in a power function is consistent with the studies by Li et al. [20] and Fan et al. [31]. Liang et al. [14] also indicated that the maximum root pullout force is not linearly proportional to the root diameter. The root diameter had no significant effect on the root–soil friction coefficient in this study. The main reason for the increase in peak pullout force with root diameter in the form of a power function is that the contact area between the root and soil increases with the root diameter. Some researchers showed contrasting results for the positive linear relationship between peak pullout force and root diameter on tree roots [17,18]. This difference is most likely due to the species difference because peak pullout force depends heavily on plant species [34,35,36,37]. In this study, because alfalfa roots belong to the taproot type, the effect of root branches was ignored. Several studies on simple and complicated branching patterns using model roots have shown that the presence and position of branch roots strongly affect the peak pullout resistance [1,33]. Generally, deeper branch roots can result in greater pullout resistance. Some studies even show that the pullout resistance of branched roots is 1.5–2 times greater than that of unbranched roots [11,12].
Peak pullout force and root–soil friction coefficient increased to their maximum values under an embedding angle of 60° and then decreased with an increasing embedding angle. The inclined burial roots are mainly affected by root–soil friction (f), vertical shear force (τ1) and horizontal shear force (τ2) (Figure 11a). Root–soil friction is mostly affected by the vertical embedding depth of the root system, which is increased with the root embedding angle in the tests. The friction anchoring performance of the roots increased with the embedded depth of the roots [33]. Therefore, the peak pullout force of the alfalfa roots increased with the embedding angle primarily. In addition, the shear forces (τ1 and τ2) between the obliquely embedded roots (30°, 45° and 60°) and the soil were generated during the pullout tests and increased continuously with root vertical embedding depth due to the need to overcome greater self-weight and confining pressure. However, no such shearing force exists under 90° (Figure 11b). The peak pullout force under 90° was consequently less than that under 60°.
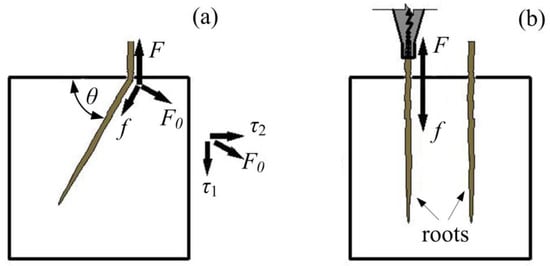
Figure 11.
Force analysis diagram of vertical embedding and inclined embedding (a. inclined burial roots; b. vertical burial roots; θ is embedding angel; F is pullout force; f is root-soil friction; τ1 is vertical shear force; τ2 is horizontal shear force; F0 is the resultant force of τ1 and τ2).
The displacement at peak pullout force of alfalfa roots decreased with the increasing root diameter and embedding angle in exponential functions. The behavior of alfalfa roots is not consistent with that of spruce (Picea abies L.) roots horizontally pulled out of loamy soil, as reported by Schwarz et al. [11]. The good performance of thinner roots and branch roots (30°, 45° and 60°) on displacement at peak pullout force suggested that they should have a strong traction effect on the slope soil. Normally, ultimate tensile deformation and Young’s modulus of roots gradually decrease with root diameter due to the enhanced degree of lignification in roots [38]. Afterward, the overall stiffness of the root–soil composite is increased. Therefore, thick roots begin to slide when the bond between the roots and soil is destroyed in the pullout process, and they need more energy and less deformation than thin roots to destroy the bond anchorage of soil to the roots. The root deformation caused by the slippage failure was only 55–61% of the ultimate deformation (Table 2 and Table 5), while it was 81.7% of the ultimate deformation caused by the breakage failure. In laboratory tests, the ratios may be underestimated because root–soil adhesion could be reduced to some extent during the preparation of soil samples in comparison with measured in situ values [12].
Pullout energy considers the influence of both pullout force and displacement on root–soil mechanical interactions. The relationship between pullout energy and root diameter was presented as a power function. It increased to the maximum value under 45° and then decreased with the increases in the embedding angle (Figure 7 and Figure 8). Our results were similar to the research by Fu and Lauke [39] in which a large fiber diameter is beneficial to high fiber pullout energy. Therefore, when a landslide occurs, the thicker roots could dissipate more of the kinetic energy of the sliding soil, and the thinner roots could have a greater traction effect on the slope soil through their high root deformation propensity. In addition, the failure mode of the root system was also the main factor affecting soil reinforcement by plant roots. Slippage failure of roots occurs when the root pullout force is less than the root tensile force. Once the root pullout force is high enough to exceed the root peak tensile force, roots will break before the pullout [14]. Thus, roots with slippage failure cannot reach the full potential of tensile mechanical property, and they result in a lower contribution to soil reinforcement than those with breakage failure [21]. The pullout energy of the breakage failure was greater than that of the slippage failure (Table 2). The maximum tensile force and ultimate elongation leading to break failure of roots are used to determine root breakage orders in the FBMs models [40,41,42]. The FBMs overestimate the root reinforcement compared with the observed values, but the FBMs-W with energy as the driving root system failure mode can be relatively conservative and stable to estimate the effect of roots on soil reinforcement [21]. Therefore, pullout energy is an excellent index for root–soil mechanical interactions with different root morphologies and is suggested for the study of root–soil mechanisms. The root diameter and embedding angle were the main focus of this study, and only one type of soil was considered. It should be noted that the effects of soil physical characteristics, such as soil texture, bulk density, and water content, on root pullout properties could be complicated, and need more in-depth exploration.
5. Conclusions
Based on the laboratory pullout tests and tensile tests, this study specified the influence of root diameter and embedding angle on root–soil interaction. Root diameter affected the failure models of alfalfa roots in the pullout tests. Roots smaller than 0.35 mm were prone to breakage, while roots larger than 0.35 mm were prone to slippage. The L–S curves of the two failure modes were significantly different. The critical root diameter, 0.35 mm for alfalfa roots in this study, should be affected not only by plant species but also by soil conditions such as bulk density and water content. The state of the root system in the soil (root diameter and embedding angle) had a great influence on soil–root mechanical interactions. The root diameter positively affected peak pullout force and pullout energy. The root diameter and embedding angle both had negative effects on pullout displacement. Roots embedded obliquely had a greater peak pullout force, root–soil friction coefficient and pullout energy than roots embedded nearly horizontally (30°) or vertically (90°). Plants with thick, vertical roots were suggested for anchoring slopes, while plants with fine, sloping roots had a greater traction effect on slope soil due to their high root deformation propensities. Compared with the root pullout force usually used, pullout energy was suggested as a more expedient parameter of both thick/fine roots and inclined/upright roots for indicating root–soil mechanics. The results provided a strong basis for root–soil mechanical interactions and soil reinforcement models. Although root length was not the focus of this study, it is a non-negligible factor affecting failure modes of root pullout tests. In addition, the effects of soil characteristics on root pullout properties may be more complicated and need more in-depth exploration.
Author Contributions
Conceptualization, C.Z.; data curation, C.Z. and G.Q.; formal analysis, Q.Y.; funding acquisition, C.Z. and Q.Y.; methodology, G.Q.; software, X.F.; validation, X.F.; visualization, Q.Y. and J.J.; writing—original draft, C.Z. and X.F.; writing—review and editing, C.Z. All authors have read and agreed to the published version of the manuscript.
Funding
This research was supported by the CRSRI Open Research Program (Program SN: CKWV20221006/KY), the Natural Science Foundation of Shanxi Province of China (20210302123105) and the Shanxi Scholarship Council of China (2020-054).
Institutional Review Board Statement
Not applicable.
Informed Consent Statement
Not applicable.
Data Availability Statement
Some or all data, models, or code generated or used during the study are available from the corresponding author by request. (Zhang C. zhangchaobo@tyut.edu.cn).
Acknowledgments
We thank Dongrong Li, Pengchong Liu and Yating Liu for the technical work during the experiment.
Conflicts of Interest
The authors declare no conflict of interest.
References
- Kamchoom, V.; Leung, A.K.; Ng, C.W.W. Effects of root geometry and transpiration on pull-out resistance. Geotech. Lett. 2014, 4, 330–336. [Google Scholar] [CrossRef]
- Arnone, E.; Caracciolo, D.; Noto, L.V.; Preti, F.; Bras, R.L. Modeling the hydrological and mechanical effect of roots on shallow landslides. Water Resour. Res. 2016, 52, 8590–8612. [Google Scholar]
- De Baets, S.; Poesen, J.; Reubens, B.; Wemans, K.; De Baerdemaeker, J.; Muys, B. Root tensile strength and root distribution of typical Mediterranean plant species and their contribution to soil shear strength. Plant Soil 2008, 305, 207–226. [Google Scholar] [CrossRef]
- Pollen, N. Temporal and spatial variability in root reinforcement of streambanks: Accounting for soil shear strength and moisture. Catena 2007, 69, 197–205. [Google Scholar] [CrossRef]
- Schwarz, M.; Rist, A.; Cohen, D.; Giadrossich, F.; Egorov, P.; Buettner, D.; Stolz, M.; Thormann, J.J. Root reinforcement of soils under compression. J. Geophys. Res.-Earth 2015, 120, 2103–2120. [Google Scholar] [CrossRef]
- Giadrossich, F.; Cohen, D.; Schwarz, M.; Ganga, A.; Marrosu, R.; Pirastru, M.; Capra, G.F. Large roots dominate the contribution of trees to slope stability. Earth Surf. Proc. Land 2019, 44, 1602–1609. [Google Scholar] [CrossRef]
- Wei, Y.J.; Wu, X.L.; Xia, J.W.; Miller, G.A.; Cai, C.F.; Guo, Z.L.; Arash, H. The effect of water content on the shear strength characteristics of granitic soils in South China. Soil Till. Res. 2019, 187, 50–59. [Google Scholar] [CrossRef]
- Pallewattha, M.; Indraratna, B.; Heitor, A.; Rujikiatkamjorn, C. Shear strength of a vegetated soil incorporating both root reinforcement and suction. Transp. Geotech. 2019, 18, 72–82. [Google Scholar] [CrossRef]
- Cohen, D.; Schwarz, M.; Or, D. An analytical fiber bundle model for pullout mechanics of root bundles. J. Geophys. Res.-Earth 2011, 116, 40–48. [Google Scholar] [CrossRef]
- Schwarz, M.; Cohen, D.; Or, D. Root-soil mechanical interactions during pullout and failure of root bundles. J. Geophys. Res.-Earth 2010, 115, 256–271. [Google Scholar] [CrossRef]
- Schwarz, M.; Cohen, D.; Or, D. Pullout tests of root analogs and natural root bundles in soil: Experiments and modeling. J. Geophys. Res.-Earth 2011, 116, F02007. [Google Scholar] [CrossRef]
- Giadrossich, F.; Schwarz, M.; Cohen, D.; Preti, F.; Or, D. Mechanical interactions between neighbouring roots during pullout tests. Plant Soil 2013, 367, 391–406. [Google Scholar] [CrossRef]
- Zhang, C.B.; Zhang, Q.; Jiang, J.; Yang, Q.H. Pullout properties of Hippophae rhamnoides L. roots in the loess area. Arch. Agron. Soil Sci. 2022. [Google Scholar] [CrossRef]
- Liang, T.; Knappett, J.A.; Leung, A.; Carnaghan, A.; Bengough, A.G.; Zhao, R. A critical evaluation of predictive models for rooted soil strength with application to predicting the seismic deformation of rooted slopes. Landslides 2020, 17, 93–109. [Google Scholar] [CrossRef]
- Dupuy, L.; Fourcaud, T.; Stokes, A. A numerical investigation into factors affecting the anchorage of roots in tension. Eur. J. Soil Sci. 2005, 56, 319–327. [Google Scholar] [CrossRef]
- Ennos, A.R. The anchorage of leek seedlings: The effect of root length and soil strength. Ann. Bot.-Lond. 1990, 65, 409–416. [Google Scholar] [CrossRef]
- Norris, J.E. Root reinforcement by hawthorn and oak roots on a highway cut-slope in Southern England. Plant Soil 2005, 278, 43–53. [Google Scholar] [CrossRef]
- Ji, X.D.; Cong, X.; Dai, X.Q.; Zhang, A.; Chen, L.H. Studying the mechanical properties of the soil-root interface using the pullout test method. J. Mt. Sci.-Engl. 2018, 15, 882–893. [Google Scholar] [CrossRef]
- Docker, B.B.; Hubble, T.C.T. Quantifying root-reinforcement of river bank soils by four Australian tree species. Geomorphology 2008, 100, 401–418. [Google Scholar] [CrossRef]
- Li, Y.P.; Wang, Y.Q.; Wang, Y.J.; Ma, C. Effects of Vitex negundo root properties on soil resistance caused by pull-out forces at different positions around the stem. Catena 2017, 158, 148–160. [Google Scholar] [CrossRef]
- Ji, J.N.; Mao, Z.; Qu, W.B.; Zhang, Z.Q. Energy-based fibre bundle model algorithms to predict soil reinforcement by roots. Plant Soil 2020, 446, 307–329. [Google Scholar] [CrossRef]
- Waldron, L.; Dakessian, S. Soil reinforcement by roots: Calculation of increased soil shear resistance from root properties. Soil Sci. 1981, 132, 427–435. [Google Scholar] [CrossRef]
- Tosi, M. Root tensile strength relationships and their slope stability implications of three shrub species in the Northern Apennines (Italy). Geomorphology 2007, 87, 268–283. [Google Scholar] [CrossRef]
- Xie, M. A study on the soil mechanical role of tree roots in the stability of slopes. Acta Conserv. Soli Aquae Sinica 1990, 4, 7–14, 50. [Google Scholar]
- Guo, H.; Wang, Y.Q.; Wang, Q.; Zhang, H.L.; Wang, B.; Zhu, J.Q. Change of soil fixation effects in the process of gradual damage. J. Beijing For. Univ. 2015, 37, 85–92. [Google Scholar]
- Guan, S.; Hu, W.; Xia, Z.; Xu, W.; Zhang, L.; Zhang, S. Pull-out test of Indigofera amblyantha Craib root under horizontal load. J. Yangtze River Sci. Res. Inst. 2016, 33, 24–28. [Google Scholar]
- Genet, M.; Stokes, A.; Salin, F.; Mickovski, S.; Fourcaud, T.; Dumail, J.F.; van Beek, R. The influence of cellulose content on tensile strength in tree roots. Plant Soil 2005, 278, 1–9. [Google Scholar] [CrossRef]
- Zhang, C.B.; Chen, L.H.; Jiang, J. Why fine tree roots are stronger than thicker roots: The role of cellulose and lignin in relation to slope stability. Geomorphology 2014, 206, 196–202. [Google Scholar] [CrossRef]
- Zhang, C.B.; Liu, Y.T.; Liu, P.C.; Jiang, J.; Yang, Q.H. Untangling the influence of soil moisture on root pullout property of alfafa plant. J. Arid Land 2020, 12, 666–675. [Google Scholar] [CrossRef]
- Zhu, J.Q.; Mao, Z.; Wang, Y.Q.; Wang, Y.J.; Tong, L.; Wang, K.; Langendoen, E.J.; Zheng, B.F. Soil moisture and hysteresis affect both magnitude and efficiency of root reinforcement. Catena 2022, 219, 106574. [Google Scholar] [CrossRef]
- Fan, C.C.; Lu, J.Z.; Chen, H.H. The pullout resistance of plant roots in the field at different soil water conditions and root geometries. Catena 2021, 207, 105593. [Google Scholar] [CrossRef]
- Zhang, C.B.; Liu, Y.T.; Li, D.R.; Jiang, J. Influence of soil moisture content on pullout properties of Hippophae rhamnoides Linn. roots. J. Mt. Sci.-Engl. 2020, 17, 2816–2826. [Google Scholar] [CrossRef]
- Stokes, A.; Ball, J.; Fitter, A.H.; Brain, P.; Coutts, M.P. An experimental investigation of the resistance of model root systems to uprooting. Ann. Bot.-Lond. 1996, 78, 415–421. [Google Scholar] [CrossRef]
- Burrall, M.; DeJong, J.T.; Martinez, A.; Wilson, D.W.; Huang, L. Bio-Inspiration through tree root pullout tests for innovative anchorage design. Geotech. Sp 2020, 320, 233–242. [Google Scholar]
- Lee, J.T.; Shih, C.Y.; Wang, J.T.; Liang, Y.H.; Hsu, Y.S.; Lee, M.J. Root traits and erosion resistance of three endemic grasses for estuarine sand drift control. Sustainability 2022, 14, 4672. [Google Scholar] [CrossRef]
- Liu, S.S.; Ji, X.D.; Zhang, X. Effects of soil properties and tree species on root-soil anchorage characteristics. Sustainability 2022, 14, 7770. [Google Scholar] [CrossRef]
- Ruan, S.H.; Tang, L.X.; Huang, T.L. The pullout mechanical properties of shrub root systems in a typical karst area, Southwest China. Sustainability 2022, 14, 3297. [Google Scholar] [CrossRef]
- Cislaghi, A.; Bordoni, M.; Meisina, C.; Bischetti, G.B. Soil reinforcement provided by the root system of grapevines: Quantification and spatial variability. Ecol. Eng. 2017, 109, 169–185. [Google Scholar] [CrossRef]
- Fu, S.; Lauke, B. The fibre pull-out energy of misaligned short fibre composites. J. Mater. Sci. 1997, 32, 1985–1993. [Google Scholar] [CrossRef]
- Pollen, N.; Simon, A.; Collison, A. Advances in Assessing the Mechanical and Hydrologic Effects of Riparian Vegetation on Streambank Stability; Amer Geophysical Union: Washington, DC, USA, 2004; Volume 8, pp. 125–139. [Google Scholar]
- Thomas, R.E.; Pollen-Bankhead, N. Modeling root-reinforcement with a fiber-bundle model and Monte Carlo simulation. Ecol. Eng. 2010, 36, 47–61. [Google Scholar] [CrossRef]
- Schwarz, M.; Cohen, D.; Or, D. Spatial characterization of root reinforcement at stand scale: Theory and case study. Geomorphology 2012, 171, 190–200. [Google Scholar] [CrossRef]
Disclaimer/Publisher’s Note: The statements, opinions and data contained in all publications are solely those of the individual author(s) and contributor(s) and not of MDPI and/or the editor(s). MDPI and/or the editor(s) disclaim responsibility for any injury to people or property resulting from any ideas, methods, instructions or products referred to in the content. |
© 2023 by the authors. Licensee MDPI, Basel, Switzerland. This article is an open access article distributed under the terms and conditions of the Creative Commons Attribution (CC BY) license (https://creativecommons.org/licenses/by/4.0/).