Abstract
The global trend of increasing urbanization and motorization represents a major obstacle in the sustainable development and planning of cities. This trend did not bypass the city of Novi Sad (Serbia), which, despite good cultural and historical preconditions for the development of sustainable forms of transport, did not resist the sudden increase in the degree of motorization. The aim of this work is to present how favorable the existing structure of the city is for the development of sustainable types of traffic (mainly walking and cycling). Furthermore, this research aims to establish the link between bikeability and walkability and walking and cycling in the city through a survey questionnaire thus aiming to show how much the planned land use affects the increase or decrease in walkability and bikeability in the city of Novi Sad in order to establish whether the planning documents respect the principle of sustainability defined by law. The methodological procedure is adapted to European cities and the information base available in the researched area is based on the walkability and bikeability index. The results showed that the city of Novi Sad has the potential and morphology to support sustainable modes of transport, but the planning documents do not recognize the imperative of change towards sustainability.
1. Introduction
In urban areas, the quality of life of citizens is significantly threatened by the constant growth in the number of motor vehicles. Many admit that these problems cannot be effectively controlled with the help of new technologies that can significantly contribute to the reduction of certain negative aspects of motor vehicles [1,2]. However, the use of such technologies cannot eliminate the problem completely. Changes in the form of reducing the volume of car traffic are also necessary [3,4,5]. With all of this in mind, the state and city policy must be aimed precisely at reducing the need for motor vehicles, especially private cars. More than 50 years have passed since the beginning of the implementation of sustainable city planning measures [6], so experiences and examples of good practice are widely available to city authorities.
Both walkability and bikeability indices can be used to measure the increase in the possibility of using sustainable modes of transport [7]. The concept of walkability refers to the extent to which a certain urban area is suitable for walking as a mode of transport [8,9]. Walkability can also be defined as a measure of how well an urban environment is adapted to people [10] for going to work, for sports and recreation activities, or access to any services [11]. In recent decades, the quality of a walkable urban environment has become a key element of urban planning and design [12]. More and more results indicate that the current urban forms and land use are not favorable for walking and therefore for sustainable social, economic, and especially ecological development of the city [9]. Due to these facts, research in recent years has largely been directed towards this topic [13]. Another important reason for this research is because of the health benefits that walking has on people due to the reduction in obesity, diabetes, heart, and other problems [9]. Cities with high walkability promote balanced development of all urban areas and services, and provide a better place to live for all residents. In these cities, residents are more satisfied with living conditions [14]. Although the methodologies for calculating this index differ, research has shown that the presence of good quality pedestrian infrastructure and its connectivity, high concentration of different functions, and high population density lead to greater suitability for walking [9].
Similar to the walkability index, a bikeability index was also developed. Although definitions of bikeability vary depending on the purpose of the research, it can generally be defined as the level of suitability of the urban structure for bicycle travel, considering indicators such as bicycle infrastructure, land use, topography, and traffic network connectivity [15,16]. Apart from the mentioned criteria, some studies such as Porter et al.’s [17], consider indicators such as air quality and other indicators of environmental pollution in order to establish the possibilities of using bicycles for performing daily activities.
Research on walkability and bikeability has been mostly focused on North American and Australian cities [18], but it is also beneficial for cities in Europe [19,20]. Although the problem of motorization and walking and cycling is more present in North American cities, the European cities face the same problem which needs to be addressed. It may be challenging to use the same methodology for Europe’s more historic cities due to their more heterogeneous layout than that typical of the United States and their historically more segregated land use patterns. To capture the geographic variances and provide a better walkability and bikeability evaluation, measuring methods need to be improved [20]. This was carried out in many European [21,22,23] and even Asian countries and cities [24].
The topic of walkability and bikeability has been highly researched in the world and has so far been applied for various purposes, primarily the health of people, increasing liveability and similar concepts [25]. A large number of authors have established a link between walkability and bikeability and the built environment [16,17,26,27], which is the basis for further analysis for the needs of urban planning, but only the use of these two indexes for the purpose of developing plans and checking planning solutions does not sufficiently appear in the literature. Regarding the link between the walkability and bikeability index and spatial and urban planning, studies conducted in Olomouc (Czech Republic) should be mentioned, where the precise use of these methods for checking planning solutions in order to determine how much future developments will affect walking in the case of Olomouc is stated [19].
There have been no studies of this kind in Serbia. Much more attention has been given to smart city planning and transport and this trend is evident in Novi Sad as well [28].
The principles of sustainable development for planning and land use are an integral part of the legislation of the Republic of Serbia [29]. The law defines the Spatial Plan of the local self-government unit as a planning document that is adopted for the territory of the local self-government unit and determines the guidelines for the development of activities and the use of areas, as well as the conditions for sustainable and even development in the territory of the local self-government unit.
The city of Novi Sad has a culture of cycling and walking, which makes the transition and even the return to sustainable modes of transportation particularly easy. The city of Novi Sad is the second largest city in the Republic of Serbia and the capital of the Autonomous Province of Vojvodina. As such, it represents an important administrative, business, and educational center. A significant increase in the number of inhabitants and the level of urbanization raises the question of the city’s sustainable development. With the new planning cycle in the Republic of Serbia, it is necessary to pay great attention to the sustainability of planning solutions, especially in terms of promoting sustainable and reducing unsustainable modes of transport.
The aim of this work is to present how favorable the existing structure of the city is for the development of sustainable types of traffic (mainly walking and cycling). Additionally, one of the goals is to establish the link between bikeability and walkability and walking and cycling in the city through a survey questionnaire. Finally, the aim is to show how much the planned land use affects the increase or decrease in walkability and bikeability in the city of Novi Sad in order to establish whether the planning documents respect the principle of sustainability defined by law.
2. Study Area
The city of Novi Sad is a local self-government unit (municipality) in the Autonomous Province of Vojvodina, of which it is also the capital (Figure 1). The Danube River morphologically separated the city of Novi Sad into two parts, the northern Bačka plain part of the city, which is represented by the alluvial plain of the Danube, and the southern Srem part of the city, characterized by the northern slopes of the Fruška Gora Mountain with its morphological diversity. The altitude of the Bačka side ranges from 72 to 80 m above sea level, while the Srem side is characterized by altitudes up to 350 m above sea level.
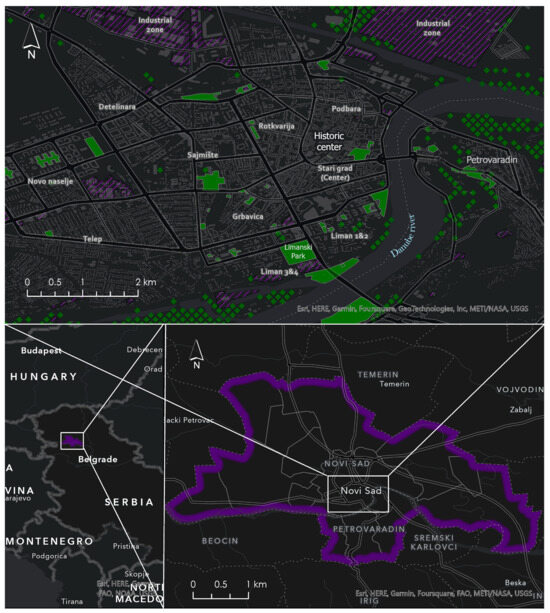
Figure 1.
The location of the city of Novi Sad.
The average annual temperature in Novi Sad in 2021 was 12.5 °C, and has been showing an increasing trend in the last 30 years. In terms of monthly temperatures, the lowest values occur in January and February, and the highest temperatures occur in July and August [30].
In addition to the air temperature, a particularly important indicator for traffic is also the amount of precipitation. The average annual rainfall in the last 30 years is 655 mm. The highest amounts of precipitation are present in May and June, while the lowest amount of precipitation is recorded in January and February. Snowfall is a regular occurrence in the winter months.
According to data from PUC Informatika Novi Sad [31], 406,655 inhabitants currently live in the City, which represents an increase of 19% compared to 2011 [32]. More significant increases occurred in the settlements of Petrovaradin (2728 inhabitants, 18.42%), Veternik (1634 inhabitants, 9.36%), Futog (1272 inhabitants, 6.82%), and Sremska Kamenica (1015 inhabitants, 8.27%).
The network of settlements of the city of Novi Sad consists of the following settlements: Novi Sad, Petrovaradin, Sremska Kamenica, Futog, Veternik, Kać, Begeč, Budisava, Bukovac, Čenej, Kisač, Kovilj, Rumenka, Ledinci, Stari Ledinci and Stepanovićevo. The settlements of Novi Sad, Petrovaradin, and Sremska Kamenica represent one conurbation, i.e., have a continuous urban fabric. The Veternik neighborhood has a growth trend that will make this neighborhood a part of the urban fabric of Novi Sad in the coming years. According to the spatial plan of the city [33], in addition to the mentioned conurbation, settlements with pronounced urban characteristics are also distinguished: Futog, Veternik and Kać. The settlement of Novi Sad with Petrovaradin and Sremska Kamenica is also the center of a functional urban area which, due to its almost comprehensive functions, has a strong attractive power that goes beyond the borders of the city. Apart from the wide gravity area that includes most of the Vojvodina province, a functional connection with the urban agglomeration of Belgrade via Inđija, Ruma and Stara Pazova is also important, which is additionally made possible by good traffic connections between the two cities.
All settlements of the city, without exception, gravitate to the Novi Sad agglomeration, which generates massive daily population migrations towards Novi Sad. Interconnections between settlements (secondary centers) are functionally and traffic wise less developed.
Novi Sad’s road network was formed in response to high levels of motorization and was often unable to respond to the challenges which is reflected in the quality of the road infrastructure [34].
Traffic in the city is mainly carried out by private motor vehicles, with the help of public city transport, the system of which includes only buses, and by bicycle (and other non-motorized means of transport) and on foot. In 2020, 120,469 passenger cars were registered on the territory of the city of Novi Sad [35].
Novi Sad has a steady growth in the number of registered cars in the city [35]. If we compare the number of cars with the total number of inhabitants (JKP Informatika), we ascertain that almost every third resident of Novi Sad owns a passenger car, while the situation was significantly different in 2011, when every fourth resident of Novi Sad owned a passenger car.
According to the analyses carried out for the preparation of the Novi Sad traffic study, the share of daily trips by passenger car increased from 23.31% in 2009 to 33.12% in 2017 [28]. By measuring the load on the traffic network of Novi Sad for the purposes of the NOSTRAM study [34,36], it was concluded that in a relatively short period, there was a significant increase in traffic at almost all intersections in the city. The biggest increase was recorded at the intersection of Bulevara Oslobođenja and Narodni Front Street, where the flow increased by 400% in a period of 3 years.
According to research carried out for the purposes of creating the Smart Plan for transport [28], out of the total number of daily trips by all means of transport, 8.84% were made by bicycle, while 39.98% were made on foot. Residents of Novi Sad travel on average 12.79 min on foot and 15.63 min by bicycle.
3. Materials and Methods
For the purpose of this research, a survey was conducted in the territory of the city of Novi Sad from April to September 2022. The time of conducting the research was largely determined by the time that was needed to pass from the cancellation of preventive measures related to the COVID-19 pandemic in order for the citizens to establish their habits without the need to apply legally prescribed emergency measures.
The survey of the population of Novi Sad was conducted both in person and by distributing questionnaires over the Internet. The distribution of the questionnaires was carried out over the Internet via e-mail addresses, Civic Facebook groups as well as by sharing on other social networks. In the city, the questionnaire was also distributed via leaflets with a QR code that led to the survey. The same QR code was placed on the bulletin boards of institutions and residential buildings in the zones where respondents were lacking, as well as at more frequently used public transport stops. Due to the elderly citizens and all those who are not at the appropriate level of computer literacy, live surveys were conducted, especially in the vicinity of city markets, shopping centers, and pedestrian zones. The questionnaire itself was compiled using the ArcGIS Survey 123 software due to the advanced capabilities of collecting spatial data and integrating them into appropriate databases. ArcGIS Pro 3.0 and Excel software (Version 2301 Build 16.0.16026.20002) were used to analyze the survey. Both software are compatible in terms of data format, so information transfers and integration are instantaneous. The survey questionnaire was compiled in such a way that it does not process the attitudes but instead processes the habits of the inhabitants and establishes the trends in relation to the place of residence, i.e., how often and for which activities residents use different forms of transport. The survey questionnaire consisted of 122 questions divided into 6 segments. The first segment concerned the socio-demographic characteristics of respondents and was mandatory for all respondents. The second part of the questionnaire was related to general traffic habits and commitments. This part of the questionnaire was mandatory for all respondents. The third, fourth, and fifth segments were conditional in character. The third segment was for motor vehicle users, the fourth for bicycle and scooter users, and the fifth for public transport users. Before the opening of each segment, there was a conditional question, “Do you ever use a car or a motorcycle/bicycle or a scooter/public transport as a means of transport?” The sixth segment was mandatory for all respondents and related to activities that respondents performed on foot. The desired sample should correspond to the basic structures and number of people according to the statistical circles of the city for which the census data are kept. In the last month, only surveys of those population groups that were missing in order to achieve the desired sample were conducted. After removing all suspicious and incorrectly filled questionnaires, a sample of n = 1164 subjects entered further analysis.
Walkability analysis is a widely researched topic throughout the world, and accordingly, there are many methodological approaches. In general, research has shown that a high degree of street connectivity, a large number of different ways of using land in one location, as well as high population densities increase walkability [9,26,27,37].
Perhaps the best-known methods are Walk Score™ (https://www.walkscore.com/, 25 November 2022) and the walkability index [38]. Numerous authors modified these methodologies to better suit their research area [21,22,23,39,40].
To calculate the walkability based on the literature and the structure of the city of Novi Sad, a grid of 200 m × 200 m cells was set up, covering the entire territory of the city. After that, the boundary polygon of the analysis was defined, which included the entire city without water and wetland areas, as well as areas to which access is prohibited. All areas of special purpose, (i.e., military function) would usually be excluded, but due to its relocation on the territory of the city in the future, they were included in the analysis. The reason why it was decided to take a cell as a unit of analysis and not a residential block as in the walkability index is primarily due to the lack of data on the population per block which is needed to functionally determine its boundaries as well as lack of adequate zones in spatial and urban plans of the city. The other reason is the scale of the research, which despite the not so large number of inhabitants of the city, has an extremely complex structure thus zoning should be carried out with great caution. The scale of 200 × 200 m per cell was obtained by length of blocks in the city which should be smaller than the cell so that no empty cells in the urban fabric can be detected in the study. Three indicators were included in the analysis of walkability: pedestrian infrastructure (I), land use (L), and population density (S). Each of the indicators will be presented separately. The equation for calculating pedestrian infrastructure (I) is
where l is the length of roads in km, and a is the coefficient of infrastructure quality.
Pedestrian infrastructure (I) implies all pedestrian paths of different levels of quality and all auxiliary facilities. For this indicator, the total length of footpaths in m was calculated for each cell. Due to the different condition and quality of footpaths, the coefficient of infrastructure quality (a) was introduced. This coefficient, depending on the type of pedestrian infrastructure, has values from 0.5 to 1.5, namely pedestrian zones and organized footpaths through parks and greenery: 1.5; sidewalks: 1; dirt paths and staircase: 0.75; unregulated paths and paths that are not primarily for that purpose: 0.5.
The equation for the calculation of indicator L is
where F is a polygon that represents the zone of attraction of a certain function represented by 15 min on foot (Figure 2) from the location of the function. Every function has a certain weight derived from the survey (Table 1). Additionally, d is the attractiveness decay coefficient, and m is the coefficient of diversity of functions at the location.
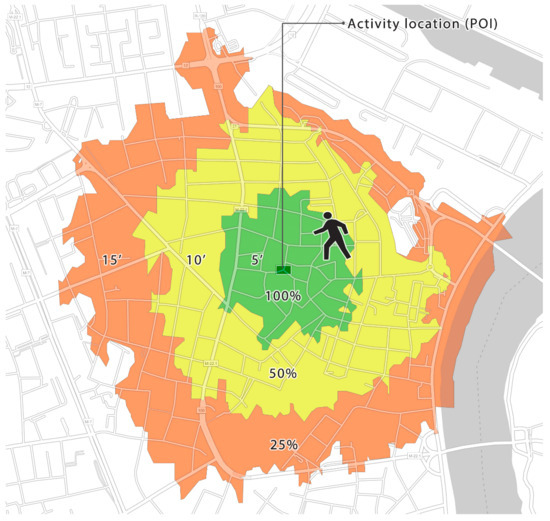
Figure 2.
Function attraction decay (d).

Table 1.
Weights for functions for indicator L for walkability and bikeability.
For the purposes of calculating the indicator L, all locations of interest (POIs) classified into 7 functions were used (Table 1). Locations related to tourism were excluded from the analysis because tourist traffic is not the subject of this research. Around each function (POI), with the help of Network Analyst in ArcGIS Pro 3.0 [41], polygons (service area) were created on pedestrian paths 5, 10 and 15 min on foot from a certain function with a 5 km/h walking speed. Some studies used buffer for the purpose of calculating the land use impacts [42,43] but given that many places in a 1 km radius of a POI are not walkable because they lack appropriate infrastructure, the service area using Network Analyst deals with this issue without any problem. The tool is used for the decay function as well. Since the attractive value of the function decreases with distance from it, the attractiveness decay coefficient (d) which is also used in other methodologies of this type was used here [44]. The value of this coefficient is adapted to the density of functions in European cities and its values are shown in Figure 2.
Each weight was obtained based on the survey questionnaire and the results and explanation are presented in the Results chapter. In each cell, the sum of all functions multiplied by the attractiveness decay coefficient was calculated to obtain the total functional attractiveness per cell. Due to the categorization of functions, this result can be observed for each function individually.
In order for the indicator to be complete, similar to the land use mix [45,46], the obtained result is multiplied by the coefficient of diversity of functions per cell, where for each cell, the number of overlapping different functions is calculated (value from 1 to 7) and depending on the number of different functions, it receives a value of 0.5 to 2: no or one function: 0.5; two or three functions: 1; four or five functions: 1.5; six or seven functions: 2.
The data sources used are shown in Table 2.
Indicator S represents only population density by statistical circle. Although the area of residential buildings in the total area is used for this indicator [47], it was not used in the end in the analysis due to the fact that in Serbia, residential space is often used for commercial activities, especially in the central parts of the city, so we obtain a distorted picture of housing.
The Republic of Serbia is still at an unenviable level in terms of the availability of geodata, especially when it comes to open data. Due to this, the main source of data is OpenStreetMap data (OSM). OSM provides spatial data divided into several categories such as traffic (roads, facilities in the service of traffic, etc.), buildings, objects of interest, and land use. The quality of the different data sets varies from territory to territory, but over time, the quality increases significantly [48]. Many authors have come to the conclusion that OSM is quite different in the United States and on the territory of Europe, but that the quality is quite satisfactory for planning trips, especially on foot, as well as the quality of the database related to locations of importance [49]. Locations of importance have the most dynamic change and the base is increasing every day. The information that is often missing in the database is the quality of the traffic infrastructure, which would greatly help with these analyses [50].
A review of the OSM database for the city of Novi Sad revealed several irregularities, such as the lack of marked pedestrian paths in front of houses in blocks with individual housing. Although sidewalks are not official and therefore not in the same class, people use them as such, so they are very important for analysis. The database with locations of interest corresponded to the territorial layout and the density was adequate but insufficient for the range of analysis. Due to this, the database was supplemented with data that was missing, especially through data from the Google Maps platform via the Google Maps API.
After summing up all three indicators, the final value of the walkability indicator is obtained. On the basis of this, classification was carried out according to the Jenks natural breaks classification method: 5 classes given values from 1 to 5 for the smallest to largest values within the class for each indicator. Finally, walkability can be expressed through the following equation:
where the minimum value is 3 and the maximum is 15. This result format is easier to read and symbolize, and the range is wide enough to see finer differences in values.
In contrast to the analysis of walkability, bikeability is much less researched in the literature, although the analysis methodology itself has been extensively elaborated and modified in order to adapt to different researched environments. As is the case with walkability, there are two basic methodologies from which to start when conducting research, namely BikeScore™ [51] and the bikeability index [15]. These methodologies were used primarily for the territory of North America, so they must be adapted to the needs of European cities, as is the case for the analysis of walkability.
By researching the existing literature, it was determined that, in general, all the main factors that affect bikeability can be classified into the following groups [16]: cycling infrastructure; land use and accessibility; security; environment.
The survey questionnaire obtained data on how often and for which functions a bicycle is used in the city of Novi Sad. Based on the survey as well as the existing methodological procedures, a methodology that reveals the level of bikeability in the city was obtained.
The same grid of cells (200 m × 200 m) used for walkability analysis was also used in the bikeability analysis for the same reasons.
When it comes to bicycle infrastructure, which was also the first criterion of this analysis, it was presented as indicator I and was obtained through the following equation:
where l is the length of the road in m, a is the coefficient of infrastructure quality, and s is the slope coefficient.
The first step includes the calculation of the length of bicycle roads, and the analysis included all roads that, according to the Law on Traffic Safety, can be used for cycling [52].
All pedestrian paths, all roadways with bicycle paths or pedestrian-bicycle paths, roadways on which bicycle traffic is not allowed, such as the highway, were excluded from the analysis.
In order to determine the suitability of cycling paths, the coefficient of infrastructure quality (a) was introduced. This coefficient also reflects the safety factor, which is often a separate criterion in such analyses. It is reflected in the fact that the highest value of the coefficient was also obtained by the safest shares, i.e., bicycle paths on which the presence of anyone and anything that is not in the function of cycling is prohibited, while the busiest car roads in the city received the lowest value.
The coefficient values for different types of roads (saobraćajnice) are bicycle paths—2; bicycle and pedestrian paths; dirt road—1; city collection and access streets (gradske sabirne i pristupne ulice)—0.75; Other—0.5.
The coefficient s was introduced to additionally mark environmental conditions that are not suitable for cycling, which is the slope of the terrain for which EUDEM was used for calculation [53]. The slope of the terrain was reflected in two values: up to 7 slope—1 and over 7 slope—0.5.
Classification of the final values of the indicators was carried out according to the Jenks natural breaks classification method into 5 classes and given the values from 1 to 5 from the smallest to the largest values within the class. The second criterion is the way of land use, i.e., to jest attractiveness of different functions. The indicator is calculated according to the following equation:
where F is a polygon that represents the field of attraction of a certain function in terms of 400 m from the location of the function of a certain weight, and m is the coefficient of diversity of the functions at the location.
According to the questionnaire, different weights were calculated for each function, and they are presented in Table 1. The distance of 400 m was obtained from previous research [15].
The coefficient m is obtained in the same way as in the analysis of walkability. We classify the final values of the indicators according to Jenks natural breaks classification method into 5 classes and give them values from 1 to 5 from the smallest to the largest values within the class. The last indicator (S) is population density. The values are the same as in the walkability analysis.
Finally, the analysis of bikeability is calculated according to the following equation:
The final values of bikeability are not classified in order to obtain greater sensitivity to the values of the indicators. The values range from 4 to 20 so that 4 represents the least and 20 the greatest bikeability value/level. Data sources for bikeability are shown in Table 2.
Table 2.
Data sources used for the analysis.
Table 2.
Data sources used for the analysis.
| Data | Source |
|---|---|
| Administrative units | [54] |
| Demographic data | [32]; Survey |
| Transport infrastructure (existing and planned) | [33,55] |
| Land use (existing and planned) and POIs | [55]; GoogleMaps API; [33,56] |
| Elevation | [53] |
In order to obtain a picture of how planning solutions will affect walkability and bikeability using the methodology for walkability with the addition of bicycle infrastructure as an indicator, an analysis was performed for the planned land use. Land use, traffic infrastructure, and planned population density (planned transformation from individual to collective housing) were obtained from the existing planning documents listed in Table 2, and based on them, an index reflecting walkability and bikeability was obtained using the aforementioned method.
4. Results
4.1. Survey
After all checks and removal of incorrect answers, a sample of 1163 respondents was obtained. Descriptive statistics for the demographic characteristics of respondents are presented in Table 3.
Table 3.
Descriptive statistics for demographic characteristics of respondents.
For the question “How do you most often move around Novi Sad”, the largest number of respondents answered that their primary means of transportation is a car (47.72%) (Figure 3). It is surprising that as many as 22.53% of respondents answered that they most often travel on foot. Only 15.56% of respondents use public transport as the dominant means of transport, and 11.87% use bicycles. Motorcycles, taxis, and scooters are not well represented as the primary means of transport, and due to the extremely small number of respondents who singled out these options as dominant (10 or fewer respondents), they will not be statistically analyzed in more detail.
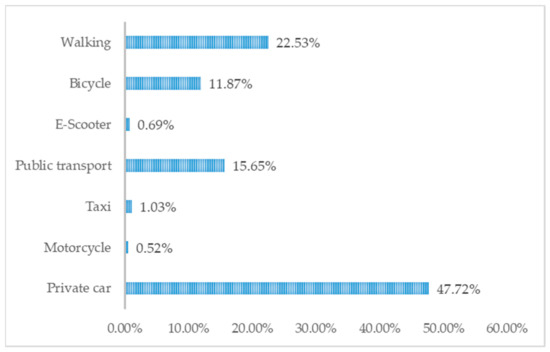
Figure 3.
Dominant transport choice for daily activities derived from the survey (x axis—percentage of respondents; y axis—dominant transport choice for all daily activities).
Spatial distribution of the dominant means of transport is shown in Figure 4. As a cartographic tool, the point density method (heat map) was used; the green color shows higher density and the dark blue shows lower density points that represent the place of residence of the respondent with the selected dominant means of transport. Although the main subject of this research is sustainable forms of traffic, it is also necessary to show the trends related to car traffic as a counterweight to sustainable forms that will be presented in more detail. When it comes to the spatial distribution of respondents with a car as the dominant means of transportation, we see a high spatial coverage, which also corresponds to the share of respondents who singled out the mentioned means as dominant. The car has the best spatial distribution in all the settlements surrounding Novi Sad (secondary centers). When it comes to the continuous urban fabric of Novi Sad, the spatial distribution corresponds to places with existing housing, i.e., places that do not have coverage for respondents who use a car on the map are the locations of industry and specialized complexes without housing.
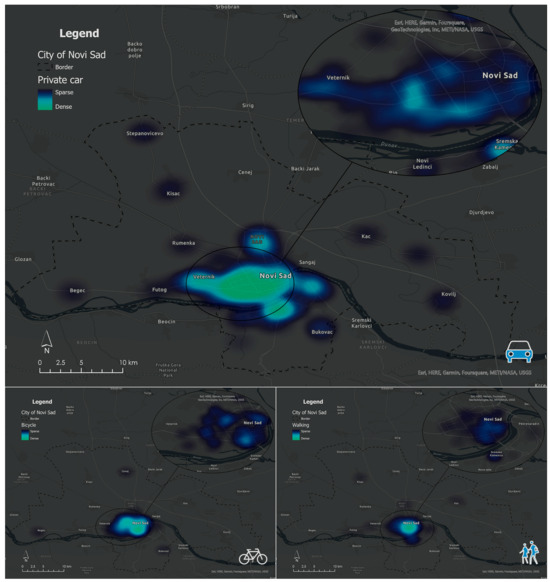
Figure 4.
Distribution and density of respondents with car, bicycle, and walking as a dominant transport method (source: authors, based on survey results).
The settlement of Veternik has almost become part of the urban area of Novi Sad, but the settlement is still completely dependent on the use of cars, which can be seen in Figure 4. When it comes to cycling and walking, these two types of traffic are dominant and spatially oriented to the greatest extent in the settlement of Novi Sad.
Pedestrian traffic is most prevalent in the residential areas surrounding the historic city center itself. To a lesser extent, it is also present in secondary centers. Bicycle traffic has a slightly different spatial distribution, so it covers greater distances from the historical center, while it is less present in the very center of the city. Apart from the settlements of Begeč, Bukovac, and Čenej, where this result was obtained due to a smaller number of respondents, the secondary centers do not have a high density of respondents who use bicycles, so we can clearly see the complete dependence on automobiles of all the secondary centers (settlements) of the city.
Table 4 shows the frequency of performing certain activities on foot and by bicycle. Overall, 19.09% often go to work on foot, while 51.68% do not perform the same activity on foot. As many as 15.13% of respondents often walk to college or school, which if compared to the number of students means that most of them often walk, more precisely, 44.74% of students. It should be noted that many students are also employed, so a large number of them marked the answer to the question about employment as an employed person and not a student.
Table 4.
The frequency of performing certain activities on foot and by bicycle.
For the purchase of groceries, the largest share of respondents travels on foot (45.74%), a smaller share travels on foot sometimes (29.41%), while 6.45% of respondents do not carry out this activity on foot. When it comes to trade and services, the largest share of respondents also travels on foot often (36.97%), slightly fewer respondents travel by foot sometimes (27.34%), while the smallest share does not travel on foot (10.58%).
The majority of respondents do not go to sports and recreation facilities on foot or perform any activity (30.52%), and slightly fewer respondents (28.37%) rarely go; 21.5% of respondents often go to these facilities on foot. The largest share of respondents walks to hospitality facilities (cafes, restaurants, etc.) sometimes (32.33%) and often (30.78%), while the least share of them do not walk or perform any activity (12.12%).
The largest share of respondents does not walk to cultural facilities (or do not perform an activity), namely 32.42% of respondents. If we subtract from this number the respondents who do not perform the activity (8.07%) (on each of the questions related to the means of transport for visiting cultural facilities, they marked that they do not perform the activity or do not perform the activity with the analyzed means of transport), we ascertain that 24.35% do not perform the activity on foot, which is less than the share of respondents who rarely perform the same activity on foot (28.03%); 22.01% of respondents often go to cultural facilities on foot.
In order to better understand the spatial distribution of respondents with high and low frequency of walking for all activities, frequency scores for all activities were collected and a hot spot analysis was performed to separate clusters of high and low values (Figure 5). In the central part of Novi Sad, a clear cluster of high values can be observed, which decreases with the distance from the center. Mixed values surround that cluster of high values, so there is no statistically significant cluster; all other settlements have clusters of low values with 99% significance.
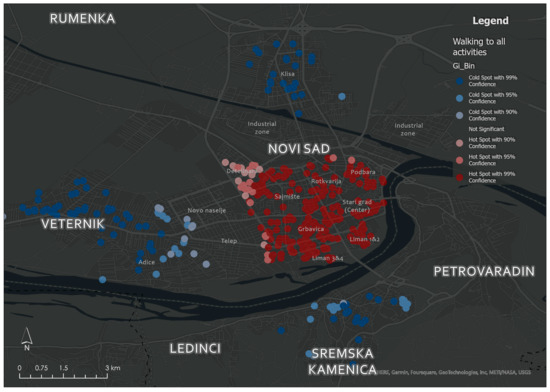
Figure 5.
Statistically significant clusters of high and low values for walking for all activities (source: authors, based on survey results).
When it comes to the type of housing, as many as 77.08% of respondents (dominant walking) who live in collective housing usually perform their daily activities on foot. For the type of housing, for different functions, a more significant difference is reflected in going to work on foot, where respondents who live in residential buildings give an average score of 1.23, while respondents who live in individual buildings had an average score of 0.48 for this function. Respondents who live individually gave the highest value to shopping for groceries and other purchases. When it comes to riding a bicycle, as many as 88.37% of respondents who most often perform their activities by bicycle live in residential buildings (collective housing). Of the total number of respondents, 60.62% answered that they never use a bicycle, while 39.38% answered that they do; 12.56% of respondents mentioned a bicycle or a scooter as their primary means of transportation, which means that 26.82% of respondents use a bicycle for certain activities, but it is not the primary means of transportation.
Table 4 shows the values for all respondents who use bicycles (39.38% of the total sample). According to Table 4, we see that the largest number of respondents who often use a bicycle to go to work with it, is 37.55%, which is 14.78% of the total respondents. A large number of respondents (36.68%) do not use bicycles for this activity. When it comes to transportation to college or school by bicycle, the majority of respondents do not perform this activity or do not ride a bicycle for this activity (58.95%), while 20.52% ride often. For the question related to getting groceries by bicycle, the most common answer is sometimes (31%), although there are no big differences between the different frequencies. Respondents most often travel to make other purchases by bicycle (31.44%), and the value distribution is similar to that for grocery purchases. Respondents go to sports and recreation facilities by bicycle most often (31.44%). A high percentage of respondents do not perform this activity or do not perform it by bicycle (27.07%). When visiting hospitality facilities, the majority of respondents do not use a bicycle (31%), while 25.33% often go to them by bicycle. When visiting cultural facilities, the respondents most often do not travel by bicycle (40.61%), while only 20.09% often travel by bicycle. The percentage of respondents who rarely go to these facilities by bike is 23.58%. The spatial distribution of high and low values of the frequency of riding a bicycle to perform various activities does not show a single statistically significant cluster of either high or low values. The values of the sum of all grades for all activities are extremely mixed and it is not possible to establish the spatial dependence of the place of residence and the choice of this means of transport for carrying out activities such as walking.
4.2. Walkability and Bikeability
Based on the results of the survey and Table 4, weights were formed for each type of attraction (function) depending on the frequency of using a certain means of transport to perform the mentioned functions. The weight corresponds with frequency of using a bicycle or walking for certain activities from survey, so that the highest frequency is 3 and the lowest is 1 (often—3; sometimes—2; rarely or never—1). Weight values for walking and cycling are shown in Table 1.
For the analysis of walkability, three main factors were used: pedestrian infrastructure (I), land use (L), and population density (S). When it comes to the length of pedestrian roads per studied cell, as the first sub-indicator (l), we used pedestrian zones, sidewalks, and unregulated footpaths. In the absence of any of the mentioned classes, individual city access streets were used. Depending on the degree of quality, according to the methodology, each of the mentioned roads received the corresponding value of the infrastructure quality coefficient (a).
The obtained values of indicator I are shown on Figure 6. The largest share of areas does not have any kind of pedestrian infrastructure. This area coincides to the greatest extent with the agricultural areas of the city. Of the infrastructurally equipped areas, the total number of cells decreases with the level of quality, so only 0.33 percent of cells (out of the total 17,640 included in the analysis) has the highest value of the indicator, meaning a length greater than 1250 m after multiplying with the appropriate coefficient. The fourth class has a somewhat larger share with 1.99% and a value of over 650 m. Territorially, the fourth and fifth classes can almost exclusively be found in the Novi Sad settlement, especially in its central parts. The third class is represented to a lesser extent in almost all settlements and covers a total of 4.26% of the territory with values above 275 m. The second class covers all urban areas and parts of hiking trails in the Fruška Gora National Park. This class covers an area of 10.61% and represents values over 85 m.
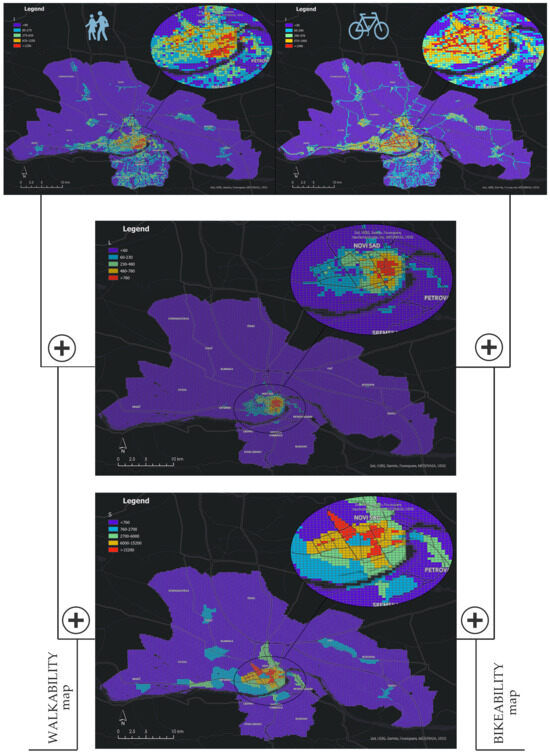
Figure 6.
Indicator maps which make up walkability and bikeability (source: authors, based on data from Table 2).
The indicator of attractiveness of the different functions (L) takes into account the location of the functions (the land use that has an attractive effect) and its field of influence in terms of a fifteen-minute polygon obtained by the time required from the function on foot, assuming an average pedestrian speed of 5 km/h. Each function had its own class as presented in the methodological procedure.
The walkability analysis included 3954 points classified into seven categories with appropriate weights (Table 1).
Of all the functions, the best spatial coverage is the grocery shopping function. This function can be found in all settlements and is well distributed. Unlike other functions, it is not excessively concentrated in the central parts of the settlement and there is not too much overlap. When it comes to high concentrations and a high degree of overlap, services and hospitality should be singled out. Apart from good territorial coverage, they have an extremely high concentration in the center and surrounding parts of Novi Sad. The smallest territorial coverage and concentration has culture and entertainment, which is represented by theaters, cinemas, galleries, and museums, of which there are not many in the city. The largest concentration of this content is certainly in the city center. Apart from the functions themselves and their field of attraction, an important factor is the number of different functions in one place.
The highest concentration of various functions is found in the central parts of the Novi Sad settlement, but a high concentration can also be found in a few cells of other settlements. This is especially the case along the main road in Petrovaradin as well as in the center of the Sremska Kamenica settlement. The central city core of Novi Sad and especially the pedestrian zone have the highest value of this indicator. By multiplying the sum of all functions with the coefficient of diversity of functions, we obtain the total values of the indicator L, which according to Jenks’ classification, is shown in Figure 6.
The values of the indicator for the attractiveness of land use (L) have the highest values in the central part of the settlement of Novi Sad, and as we move away from it, the value of the indicators gradually decreases. Apart from Novi Sad, we can notice that in the territory of settlements Petrovaradin and Sremska Kamenica, several cells of the second class can be seen.
The third indicator is the population density, and it was obtained based on the 2011 census data by statistical district. Population density values are divided into five classes and are shown in Figure 6.
As population density depends not only on the number of inhabitants, but also on the size of the statistical circle and the area it encompasses, we must note that the area of certain statistical circles also includes the Danube, so sometimes the number is less accurate. Generally, the numbers shown on the map correspond to the current state and there is a high value in the parts of the city where there is multi-family housing and lower density in the parts where individual housing is predominant.
The highest population density is found in parts of Novi Sad (Center, Grbavica, Rotkvarija, Detelinara, and part of Novo Naselje). By summing up all the indicators, we obtained a map of total walkability (Figure 7).
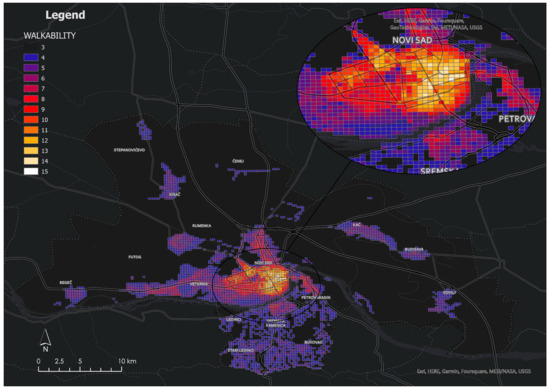
Figure 7.
Measure of walkability for the city of Novi Sad (source: authors, based on research results).
All values of walkability that are equal to 3 are considered places where it is not possible to walk, so they are transparent. As much as 80.9% of the city’s territory was covered with the lowest values. In general, the number of walkability indicator cells decreases with increasing walkability, so only one cell has a value of 15 in the city center. Areas covered by values of 3, 4, and 5 occupy as much as 95.1% of the territory. Values above 5 thus occupy less than 1% each.
The territorial distribution of high walkability values shows extremely high values in the center of the Novi Sad settlement, where there are high concentrations of various functions, good pedestrian infrastructure and high population density. High values of the analyzed walkability can be observed in Grbavica as well as in Liman 2 and 3. All three parts of the settlement have their own functional centers and they are connected by the Liman Park, which is very important for pedestrian traffic. High values can still be observed in Rotkvarija and in the center of Novo Naselje. Only the center of Petrovaradin and one cell in the center of Sremska Kamenica are above average. All other settlements are below average and mostly not suitable for pedestrian traffic.
For the bicycle infrastructure indicator (I), three sub-indicators were used, namely the length of the bicycle infrastructure, the quality of the bicycle infrastructure and the angles of inclination (slope). According to the values of the criteria shown in the methodology chapter, the final map of the criteria was made (Figure 6). Slope angles above 7 degrees cover the territory south of the Danube River, more precisely the northern slopes of Fruška Gora. The rest of the territory of the city of Novi Sad is flat and therefore completely suitable for bicycle traffic. The network of bicycle paths is almost evenly distributed in the central part of the city. The lack of regulated (official) bicycle paths can be noticed on most bridges, such as in Petrovaradin and Sremska Kamenica. The density of city access streets is the highest. After multiplying the sub-indicators, we see that the distribution of values shows that each settlement has infrastructure suitable for cycling at least in certain parts. The best quality of cycling infrastructure can be found along the main roads in Novi Sad, with the exception of Telep and Adice. Due to the high inclination, settlements on the slopes of Fruška Gora have the lowest values for this indicator.
The indicator for function attraction (land use) L is very similar to that of a walkabilty analysis. The highest values of the indicators can be observed in the pedestrian zone of the city, which is also the gravitational center for traffic movements. High values of the indicators were recorded in the center, Liman 2, Sajmište, and Detelinara. Apart from Novi Sad, other settlements do not have significant functional appeal, so it is expected that traffic will be directed to the central part of Novi Sad.
Population density is an indicator that is the same for walkability and bikeability and is already presented on the Figure 6.
Figure 8 shows the bikeability in the City.
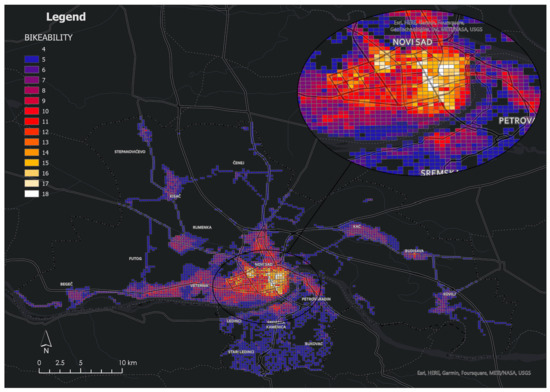
Figure 8.
Measure of bikeability in the city of Novi Sad (source: authors, based on research results).
The highest values of bikeability can be seen along the city’s main boulevard (Bule-var Oslobođenja) as well as in the places surrounding the pedestrian zone in the city center. Generally high values coincide to a large extent with those of walkability, but with a shift of high values towards the marginal parts of the blocks where there are bicycle paths. You can also clearly see the increase in the value of indicators in relation to walkability towards the bicycle path along the Danube as well as on the roads connecting Novi Sad with other settlements. Due to the slope angles, the values on the slopes of Fruška Gora are significantly reduced, where it is considered unfavorable for this type of traffic. Values above the average are almost exclusively related to the urban area of Novi Sad, with less convenience in Petrovaradin and the center of Sremska Kamenica.
The data derived from spatial plans include certain planned land uses: business, business-residential zones, zones of the general city center with city functions prescribed by the corresponding planning document, and planned network of all types of roads and restrictions regarding construction. Figure 9 shows the expected values in case of the implementation of the mentioned solutions.
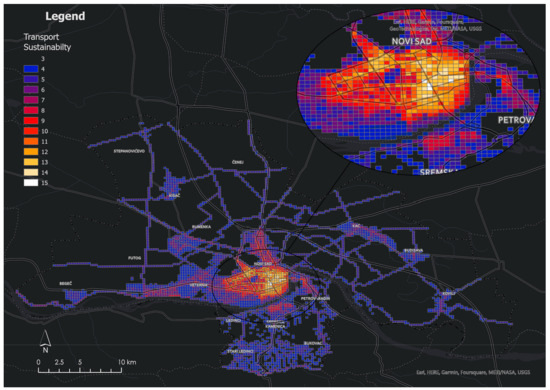
Figure 9.
Map showing the change in walkability and bikeability if land use changes from spatial and urban plans are implemented (source: authors, based on research results).
There is a clear increase in the number of cells that do not have a value of 3, but there is no clear increase in values above the average. Although the increase is present in all values except value 3, the largest increase can be observed in value 5, which now occupies 9.07% of the cells, while in the walkability analysis, it occupied only 4.9% of the territory.
The first visible change compared to Figure 7 and Figure 8 are the numerous planned national and international bicycle paths that should connect all settlements with each other and with the central part of Novi Sad. The planned new bridges also include bicycle paths as their integral parts which will further help connect other settlements with Novi Sad.
Another major improvement can be seen at the site of the planned city-wide center of the so-called Novi Sad Waterfront, as well as the city-wide centers on the territory of Telep and the new city-wide centers on the territory of Novo Naselje. Due to the new connections and the planned bicycle infrastructure, an increase in value can be seen in the territory of Sremska Kamenica and to a lesser extent in Petrovaradin. Significant changes were not recorded in Veternik, Futog, and with the planned multi-family housing, these places will become even greater sources of car traffic that will negatively affect the sustainable development of the city.
5. Discussion
Great attention in the literature is devoted to the adequate selection of indicators for the analysis of the possibility of using different means of transport (type of traffic). To the greatest extent, the indicators themselves are conditioned by the available data, which are variable from country to country, but also by the specifics of the researched territory and everything that makes the given territory unique at the global level. As there are no two identical cities, there cannot be two identical models that equally explain the studied phenomena within cities. The initial stage of this research aimed to collect as much data as possible about the specificity of the researched territory of the city of Novi Sad in order to modify the research methodology. This was achieved by using a survey in the same way as it was carried out in many previous studies.
The results of the survey for the question, “How do you most often move around Novi Sad” were extremely important in order to validate the obtained results of the analysis of the possibility of different types of traffic. Therefore, it was desirable to check the accuracy of these results, so they were all compared with the results of the Smart Plan [28]. It was found that the data from 2017 coincide to a large extent with the fact that during the research for the purposes of the Smart Plan, the number of trips per day by all means of transport was used, and not the most commonly used means in general, so the share of trips on foot is at a much higher level (39.98%) instead of 22.53% as obtained by the survey). The reason why this approach was chosen in the survey research is because it was necessary to perform an analysis of all the questions by grouping the respondents according to the predominant means of transport in order to observe all the regularities in each group of respondents. From the aspect of traffic planning in order to ensure that capacities and traffic movements are at a satisfactory level, the measure used in these documents represents a quality indicator, but it has its shortcomings for the analysis required for sustainable development planning.
Another big problem was data on the population of the city of Novi Sad. The population census from 2011 is already out of date, and the new census was only carried out at the end of 2022, and official data will not be released for at least the next year for the territorial levels needed for this research. The new population census will also be of better quality because it is the first digital census in the Republic of Serbia, and as such, it will bring a big breakthrough in this research. This information largely determined the methodology of this research, so only data on population density by statistical circle were obtained from the population data in order to avoid errors.
With the lack of at least the number of inhabitants per block, it is impossible to obtain data that would reflect the exact situation in our research area. The second territorial entity that was considered is the statistical circle, of which there are 166 in the city. This is the smallest territorial unit for which statistics are kept in the Republic of Serbia, which means that population data are mostly available for this territorial level. This was primarily obtained as a territorial level of research, but after the first research results, it was concluded that it does not functionally represent any whole and that differences within one statistical circle in terms of all indicators can be too different, thus giving a false picture of the current situation. In order to avoid generalization of this type, cells of 200 m × 200 m were chosen for the research.
The methodology differs the most from the above regarding the number of junctions for calculating both walkability and bikeability. The number of intersections (junctions) where pedestrian paths join was not taken into account because the data showed that pedestrian paths are quite short and with many junctions, while most of them are at intersections with major roads and roundabouts, which are not desirable places for walking.
This phenomenon is linked to the already researched issue of the difference between American and European cities. If we consider that Walk Score™ also takes block length as an indicator because they are very long in American cities, then we come to the conclusion that the methodology must be adapted to each city to suit its structure.
One of the more important criterion is the average speed of walking and cycling in the city, which will be taken into account for the distance from the respective land uses. The ArcGIS Pro 3.0 software takes a value of 5 km/h as a default value. Many studies have been dedicated to measuring this indicator and numerous differences have been proven, especially in European, Asian, and American cities [57,58]. The value chosen in this study is precisely the one that is the default for ArcGIS Pro because it matches the results for cities of similar morphology from Europe. When it comes to the average speed of cycling, a value of 15 km/h was used, the same as in studies of European cities [59,60]. Average speeds of both walking and cycling are lower in cities with a large number of intersections and traffic lights (places where the length of the block is smaller, so higher speeds cannot be developed).
Walkability analysis showed that the central part of Novi Sad is very suitable for walking and that moving away from it decreases the possibility of walking. It is interesting that there are no smaller pedestrian centers in suburban settlements that do not form the urban fabric of the city. In these locations, neither the functions, nor the pedestrian infrastructure, nor the population density corresponded to the conditions of high or even medium walkability. The reason can be found in the functional diversity of the settlement of Novi Sad, which has impoverished the surrounding settlements as a result.
Several different data were used to validate the obtained results. The Novi Sad population survey is the first step in data validation. Table 5 shows the average walkability values by groups of respondents grouped according to the predominant means of transport.
Table 5.
Average values of walkability and bikeability by dominant transport choice from the survey.
According to the first validation data, the highest average values are observed for pedestrians, are slightly less for cyclists, and the least for those who most often perform their activities with the help of a car.
If these values are compared, it can be concluded that if residents have the opportunity to walk, they will most often walk.
Bikeability analysis is a research concept that is increasingly present in the literature in response to increases in motorization and the general drive for sustainable development. As there are numerous different methodologies that are conditioned firstly by the available data and then by the specificity of the researched area as well as all historical connotations and current traffic habits, the first step is the selection of appropriate analysis indicators. The availability of data for the territory of the city of Novi Sad is at an extremely low level. The data used are from all possible sources of open data. Although the Republic of Serbia is clearly working on the digitization of data, many data are either still not collected or are not available to the scientific community. Scientific institutions still do not have access to the data needed for all research, which is why Serbia often lags behind in scientific circles. Although the flow of bicycle traffic is measured in several places in the city, the locations of the measuring stations for which there are data for several consecutive years are more in recreational locations such as the Novi Sad quay, than in those where there is a high density of bicycle traffic for various activities. The difficulty of determining the criteria is also reflected in the fact that, in the absence of a bicycle path, contrary to the law [52], many cyclists will use the pedestrian path instead of the road for safety reasons, and for that, except in the case of an accident, they will not be penalized. Despite this, pedestrian paths were not used as a criterion for the analysis because the unhindered movement of pedestrians is an equally important goal of sustainable development. This caused concern regarding the results obtained because there are places where the bikeability measure will not be realistic due to the mentioned criterion. The reason why a possible error was accepted is that a square grid of 200 × 200 m was used for the analysis, so it is considered that riding a bicycle on the road or on a pedestrian path is not as safe as on a bicycle path, so a much lower coefficient of infrastructure quality is given.
The big problem of cycling in Novi Sad is its seasonal nature. Many respondents only use a bicycle as a means of transportation in the warmer season. Although this may not coincide with the fact that the cities with the largest share of bicycle trips are much more north of Novi Sad with a much colder and wetter climate, it is certainly a problem that needs attention. This problem is mainly of a cultural nature and as such cannot be solved by simple modifications in the structure of the city. The motivation and demotivation of the population to use bicycles in different weather conditions should be the subject of future research in order to see future solutions to the mentioned problem.
Table 5 shows the average values of bikeability by groups of respondents according to the dominant means of transport. The highest value of the indicator is still obtained by respondents who most often travel on foot, but we also note an extremely high value among those who mostly perform their daily activities by bicycle. Low bikeability values are found in subjects who predominantly use public transport, and the lowest values are for car users.
If we compare respondents who use and those who do not use a bicycle, the average value of bikeability is higher for those who use a bicycle in their daily activities (11.42) compared to others (10.26).
When it comes to cycling, it is necessary to study the trends in more detail so that the obtained results match the realistic state as much as possible. Although the values for bikeability match the conditions, it cannot be concluded that where there is a possibility, residents will use bicycles for certain activities. A better analysis of cause-and-effect relationships is necessary, especially for studies at lower territorial levels.
A big problem when measuring the efficiency of planning solutions in the case of sustainable transport is the quality of planning documents.
Spatial and urban plans often have ambiguous strategic goals, such as the emphasis on pedestrian and bicycle traffic in terms of infrastructure development, and functionally, this measure is not respected at all by the construction of new shopping centers and other facilities with large parking spaces. Errors of this type will creep into the plans due to the inadequate information base on which the plans are made, the inadequate use of information technologies that are available today, as well as the absence of clear goals, strategies, and policies from higher levels of administration. According to the results of the research, it is clear that there is a trend of increasing the possibility of using sustainable modes of transport in certain locations in the case of the implementation of planning measures, but these increases could be at a significantly higher level if more radical spatial changes were made, which, as experience has shown, are necessary in order to achieve sustainable development. Another big problem is the assumption that 100% of planned solutions are actually implemented, which, as experience has shown, is absolutely impossible.
6. Conclusions
Since the introduction of the term and all the guidelines for sustainable local development, if only a few isolated examples of good practice are excluded, the world is dizzyingly going in the opposite direction. The city of Novi Sad is not lagging behind the mentioned trend. The increase in the share of private cars per capita, increasing traffic congestion, environmental degradation, and increasingly poor living conditions in cities is a trend that must be stopped in the future.
The imperative to change behavior has been evident for decades, but apart from soft measures, a more serious transition in both behavior and planning has been absent as can be seen in the analysis of traffic sustainability. What is not missing is an extremely large number of studies and projects in this field, which mostly have the same conclusion. The pandemic of the COVID-19 virus has brought new knowledge and perspectives to the world of traffic and its planning. First, if we make a change in behavior, a positive ecological response will soon follow, and second, radical changes in traffic habits are feasible and necessary.
The results showed that Novi Sad has a good morphological structure as well as a culture of walking and cycling, which is an excellent prerequisite and facilitating circumstance when implementing measures for sustainable modes of transport. Results showed that if neighborhoods have high walkability and bikeability, citizens are more likely to walk or cycle for daily activities. A major drawback is the absence of planning solutions that would precisely support this transition towards sustainability. Although there are certain improvements from 50 years of experience, we can conclude that these small steps are not enough to put the city on its sustainable path. The city of Novi Sad with its expanding urban area has not recognized walking and cycling as dominant future modes of transport which concludes that if changes in the new planning cycle are not made, motorization of the city will continue to grow rapidly. The methodological process has been significantly improved, especially with the use of open data. This is the first study of this type in Serbia and as such is an important starting point from a scientific point of view. The proposed methodology and analysis can greatly improve planning processes of the Novi Sad and in Serbia in general.
This research has only opened the door to further research. Any improvement of spatial data requires new calibrations and improvement of models and methodology. In addition to improving the methodology, an important element of future research will be to go down to lower territorial units such as parts of settlements that require a much higher level of data detail. A big shortcoming in this study was the data concerning the ecological parameters of the city, so in the future it is necessary to make great improvements in this field. Just as without adequate data, it is difficult to measure the deterioration of the current state, it is also impossible to prove any improvement in the environment after the implementation of certain planning solutions. Future research will also be directed towards modeling the interaction of land use planning and traffic after the release of the 2022 census data where the data from this research will be an important starting point. Moreover, the research presented in this paper represents only one part of the study on the interdependence of urban development planning and sustainable modes of transport, which represents an extremely important segment in the new planning cycle of the Republic of Serbia.
Author Contributions
Conceptualization, T.Đ.; methodology, T.Đ.; software, T.Đ. and D.T.; validation, T.Đ. and N.T.; formal analysis, T.Đ.; investigation, T.Đ. and N.T.; data curation, T.Đ. and D.T.; writing—original draft preparation, T.Đ.; writing—review and editing, N.T.; visualization, T.Đ. and D.T.; supervision, T.Đ. and N.T.; funding acquisition, T.Đ. and N.T. All authors have read and agreed to the published version of the manuscript.
Funding
This research received no external funding.
Institutional Review Board Statement
Not applicable.
Informed Consent Statement
The conducted survey was anonymous. Before filling out the survey, respondents were informed that by completing the survey, they consented to the publication of the data for scientific purposes.
Data Availability Statement
Data available on request due to restrictions, e.g., privacy or ethical. The data presented in this study are available on request from the corresponding author. The data are not publicly available due to privacy statement in the survey.
Conflicts of Interest
The authors declare no conflict of interest.
References
- Yin, C.; Xiong, Z.; Chen, H.; Wang, J.; Cooper, D.; David, B. A literature survey on smart cities. Sci. China Inf. Sci. 2015, 58, 1–18. [Google Scholar] [CrossRef]
- Silva, B.N.; Khan, M.; Han, K. Towards sustainable smart cities: A review of trends, architectures, components, and open challenges in smart cities. Sustain. Cities Soc. 2018, 38, 697–713. [Google Scholar] [CrossRef]
- OECD. Towards Sustainable Transportation; OECD Publications: Paris, France, 1996. [Google Scholar]
- Gärling, T.; Eek, D.; Loukopoulos, P.; Fujii, S.; Johansson-Stenman, O.; Kitamura, R.; Pendyala, R. A Conceptual Analysis of the Impact of Travel Demand Management on Private Car Use. Transp. Policy 2002, 9, 59–70. [Google Scholar] [CrossRef]
- Steg, L.; Gifford, R. Sustainable Transport and Quality of Life. J. Transp. Geogr. 2005, 13, 59–69. [Google Scholar] [CrossRef]
- WCED. Our Common Future; Oxford Univerisity Press: New York, NY, USA, 1987. [Google Scholar]
- Resch, B.; Puetz, I.; Bluemke, M.; Kyriakou, K.; Miksch, J. An Interdisciplinary Mixed-Methods Approach to Analyzing Urban Spaces: The Case of Urban Walkability and Bikeability. Int. J. Environ. Res. Public Health 2020, 17, 6994. [Google Scholar] [CrossRef]
- Sallis, J.F.; Frank, L.D.; Saelens, B.E.; Kraft, M.K. Active transportation and physical activity: Opportunities for collaboration on transportation and public health research. Transp. Res. Part A Policy Pract. 2004, 38, 249–268. [Google Scholar] [CrossRef]
- Frank, L.D.; Sallis, J.F.; Conway, T.L.; Chapman, J.E.; Saelens, B.E.; Bachman, W. Many pathways from land use to health: Associations between neighborhood walkability and active transportation, body mass index, and air quality. J. Am. Plan. Assoc. 2006, 72, 75–87. [Google Scholar] [CrossRef]
- Gebel, K.; Bauman, A.; Owen, N. Correlates of non-concordance between perceived and objective measures of walkability. Ann. Behav. Med. 2009, 37, 228–238. [Google Scholar] [CrossRef]
- Leslie, E.; Coffee, N.; Frank, L.; Owen, N.; Bauman, A.; Hugo, G. Walkability of local communities: Using geographic information systems to objectively assess relevant environmental attributes. Health Place 2007, 13, 111–122. [Google Scholar] [CrossRef]
- Saelens, B.E.; Sallis, J.F.; Frank, L.D. Environmental correlates of walking and cycling: Findings from the transportation, urban design, and planning literatures. Ann. Behav. Med. 2016, 25, 80–91. [Google Scholar] [CrossRef]
- Wang, H.; Yang, Y. Neighbourhood walkability: A review and bibliometric analysis. Cities 2019, 93, 43–61. [Google Scholar] [CrossRef]
- Lee, S.M.; Conway, T.L.; Frank, L.D.; Saelens, B.E.; Cain, K.L.; Sallis, J.F. The relation of perceived and objective environment attributes to neighborhood satisfaction. Environ. Behav. 2017, 49, 136–160. [Google Scholar] [CrossRef]
- Winters, M.; Brauer, M.; Setton, E.M.; Teschke, K. Mapping bikeability: A spatial tool to support sustainable travel. Environ. Plan. B Plan. Des. 2013, 40, 865–883. [Google Scholar] [CrossRef]
- Castañon, U.N.; Ribeiro, P.J.G. Bikeability and Emerging Phenomena in Cycling: Exploratory. Sustainability 2021, 13, 2394. [Google Scholar] [CrossRef]
- Porter, K.; Kohl, H.W.; Pérez, A.; Reininger, B.; Pettee Gabriel, K.; Salvo, D. Bikeability: Assessing the Objectively Measured Environment in Relation to Recreation and Transportation Bicycling. Environ. Behav. 2020, 52, 861–894. [Google Scholar] [CrossRef]
- Ewing, R.; Brownson, R.C.; Berrigan, D. Relationship between urban sprawl and weight of United States youth. Am. J. Prev. Med. 2006, 31, 464–474. [Google Scholar] [CrossRef]
- Dobesova, Z.; Krivka, T. Walkability Index in the Urban Planning: A Case Study in Olomouc City. In Advances in Spatial Planning; InTech: Rijeka, Croatia, 2012; pp. 179–197. [Google Scholar]
- Rayer, M.; Fina, S.; Siedentop, S.; Schlicht, W. Walkability is Only Part of the Story: Walking for Transportation in Stuttgart, Germany. Int. J. Environ. Res. Public Health 2014, 11, 5849–5865. [Google Scholar] [CrossRef]
- Ribeiro, A.I.; Krainski, E.T.; Autran, R.; Teixeira, H.; Carvalho, M.S.; de Pina, M.D. The influence of socioeconomic, biogeophysical and built environment on old-age survival in a Southern European city. Health Place 2016, 41, 100–109. [Google Scholar] [CrossRef]
- Stockton, J.S.; Duke-Williams, O.; Stamatakis, E.; Mindell, J.S.; Brunner, E.J.; Shelton, N.J. Development of a novel walkability index for London, United Kingdom: Cross-sectional application to the Whitehall II Study. BMC Public Health 2016, 16, 416. [Google Scholar] [CrossRef]
- Sundquist, K.; Eriksson, U.; Kawakami, N.; Skog, L.; Ohlsson, H.; Arvidsson, D. Neighborhood walkability, physical activity, and walking behavior: The Swedish Neighborhood and Physical Activity (SNAP) study. Soc. Sci. Med. 2011, 72, 1266–1273. [Google Scholar] [CrossRef]
- Gu, P.; Han, Z.; Cao, Z.; Chen, Y.; Jiang, Y. Using Open Source Data to Measure Street Walkability and Bikeability in China: A Case of Four Cities. Transp. Res. Rec. 2018, 2672, 63–75. [Google Scholar] [CrossRef]
- Maghelal, P.K.; Capp, C.J. Walkability: A Review of Existing Pedestrian Indices. URISA J. 2011, 23, 5–19. [Google Scholar]
- Wang, Y.; Chau, C.K.; Ng, W.Y.; Leung, T.M. A review on the effects of physical built environment attributes on enhancing walking and cycling activity levels within residential neighborhoods. Cities 2016, 50, 1–15. [Google Scholar] [CrossRef]
- Saelens, B.E.; Handy, S.L. Built environment correlates of walking: A review. Med. Sci. Sport. Exerc. 2008, 40, S550–S566. [Google Scholar] [CrossRef]
- Smart Plan—Second Phase, City of Novi Sad; City Administration for Traffic and Roads: Novi Sad, Serbia, 2019.
- Law on Planning and Construction. In Official Gazette of the Republic of Serbia; no. 72/2009, 81/2009—Corrected, 64/2010—US decision, 24/2011, 121/2012, 42/2013—US decision, 50/2013—US decision, 98/2013—US decision, 132/2014, 145/2014, 83/2018, 31/2019, 37/2019—State law, 9/2020; 2009.
- Republic Hydrometeorological Institute of Serbia. November 2022. Available online: https://www.hidmet.gov.rs/ciril/meteorologija/klimatologija.php (accessed on 12 November 2022).
- Population Data. October 2022. Available online: https://www.nsinfo.co.rs/cyr/broj-stanovnika-po-naseljima (accessed on 3 October 2022).
- The Statistical Office of the Republic of Serbia. Census of Population, Households and Apartments in 2011—Special Data Processing; The Statistical Office of the Republic of Serbia: Belgrade, Serbia, 2021. [Google Scholar]
- Spatial Plan of the City of Novi Sad; Official Gazette of city of Novi Sad: Novi Sad, Serbia, 2012.
- Traffic Study of the City of Novi Sad with the Dynamics of Traffic Regulation-NOSTRAM; PC (Public Company) “URBANIZAM“: Novi Sad, Serbia, 2009.
- Municipalities and Regions in the Republic of Serbia; The Statistical Office of the Republic of Serbia: Belgrade, Serbia, 2021.
- “NOSTRAM Update,” PC “Urbanizam”; Institute for Urban Planning: Novi Sad, Serbia, 2015.
- Clark, A.F.; Scott, D.M.; Yiannakoulias, N. Examining the relationship between active travel, weather, and the built environment: A multilevel approach using a GPSenhanced dataset. Transportation 2014, 41, 325–338. [Google Scholar] [CrossRef]
- Frank, L.D.; Sallis, J.F.; Saelens, B.E.; Leary, L.; Cain, K.; Conway, T.L.; Hess, P.M. The development of a walkability index: Application to the Neighborhood Quality of Life Study. Br. J. Sports Med. 2009, 44, 924–933. [Google Scholar] [CrossRef]
- Villanueva, K.; Knuiman, M.; Nathan, A.; Giles-Corti, B.; Christian, H.; Foster, S.; Bull, F. The impact of neighborhood walkability on walking: Does it differ across adult life stage and does neighborhood buffer size matter? Health Place 2014, 25, 43–46. [Google Scholar] [CrossRef]
- Kelley, E.A.; Kandula, N.R.; Kanaya, A.M.; Yen, I.H. Neighborhood Walkability and Walking for Transport among South Asians in the MASALA Study. J. Phys. Act. Health 2016, 13, 514–519. [Google Scholar] [CrossRef]
- ESRI. Network Analyst Solvers. Available online: https://pro.arcgis.com/en/pro-app/latest/help/analysis/networks/network-analyst-solver-types.htm#ESRI_SECTION1_B826A1BEEC9142DD860980BC99B71000 (accessed on 30 January 2023).
- de Sa, E.; Ardern, C.I. Neighbourhood walkability, leisure-time and transport-related physical activity in a mixed urban–rural area. PeerJ 2014, 2, e440. [Google Scholar] [CrossRef]
- Duncan, D.T.; Aldstadt, J.; Whalen, J.; Melly, S.J. Validation of Walk Scores and Transit Scores for estimating neighborhood walkability and transit availability: A small-area analysis. GeoJournal 2013, 78, 407–416. [Google Scholar] [CrossRef]
- Zhang, J.; Tan, P.J.; Zeng, H.; Zhang, Y. Walkability Assessment in a Rapidly Urbanizing City. Sustainability 2019, 11, 2205. [Google Scholar] [CrossRef]
- van den Hoek, J. The MXI (Mixed-use Index) as Tool for Urban Planning and Analysis. In Corporations and Cities: Envisioning Corporate Real Estate in the Urban Future; TU Delft: Delft, Netherlands, 2008; pp. 1–15. [Google Scholar]
- van den Hoek, J. Towards a Mixed-use Index (MXI) as a tool for urban planning and analysis. In Urbanism—Phd Research 2008–2012; IOS Press: Amsterdam, The Netherlands, 2009; pp. 64–85. [Google Scholar]
- Carr, L.J.; Shira, D.I.; Bess, M.H. Walk Score as a global estimate of neighborhood walkability. Am. J. Prev. Med. 2010, 39, 460–463. [Google Scholar] [CrossRef]
- Novack, T.; Wang`, Z.; Zipf, A. A System for Generating Customized Pleasant Pedestrian Routes Based on OpenStreetMap Data. Sensors 2018, 18, 3794. [Google Scholar] [CrossRef]
- Zielstra, D.; Hochmair, H. Using free and proprietary data to compare shortest-path lengths for effective pedestrian routing in street networks. J. Locat. Based Serv. 2016, 10, 64–77. [Google Scholar] [CrossRef]
- Mobasheri, A.; Sun, Y.; Loos, L.; Ali, A.L. Are Crowdsourced Datasets Suitable for Specialized Routing Services? Case Study of OpenStreetMap for Routing of People with Limited Mobility. Sustainability 2017, 9, 997. [Google Scholar] [CrossRef]
- Walk Score. 2022. Available online: https://www.walkscore.com/bike-score-methodology.shtml (accessed on 25 November 2022).
- Law on Road Traffic Safety. In Official Gazette of the Republic of Serbia; no. 41/2009, 53/2010, 101/2011, 32/2013—US decision, 55/2014, 96/2015—State law, 9/2016—US decision, 24/2018, 41/2018, 41/2018—State law, 87/2018, 23/2019 and 128/2020—State law; 2009.
- Copernicus—Land Monitornig Service. November 2022. Available online: https://land.copernicus.eu/imagery-in-situ/eu-dem/eu-dem-v1.1 (accessed on 22 November 2022).
- Republic Geodetic Authority. “Open Data,” 2022. Available online: https://opendata.geosrbija.rs/loginopendata?next=%2F (accessed on 4 September 2022).
- G. G.-OpenStreetMap, November 2022. Available online: http://download.geofabrik.de/europe/serbia.html (accessed on 22 November 2022).
- Ministry of Environmental Protection. General Urban Plan of the City of Novi Sad until 2030; City Administration for Environmental Protection: Novi Sad, Serbia, 2022.
- Wirtz, P.; Ries, G. The pace of life—Reanalysed: Why does walking speed of pedestrians correlate with city size? Behaviour 1992, 123, 77–83. [Google Scholar] [CrossRef]
- Franek, M.; Režny, L. Environmental features influence walking speed: The effect of urban greenery. Land 2021, 10, 459. [Google Scholar] [CrossRef]
- Boufous, S.; Hatfield, J.; Grzebieta, R. The impact of environmental factors on cycling speed on shared paths. Accid. Anal. Prev. 2018, 110, 171–176. [Google Scholar] [CrossRef]
- Parkin, J.; Rotheram, J. Design speeds and accelaration characteristics of bycicle traffic for use in planning, design and appraisal. Transp. Policy 2010, 17, 335–341. [Google Scholar] [CrossRef]


Disclaimer/Publisher’s Note: The statements, opinions and data contained in all publications are solely those of the individual author(s) and contributor(s) and not of MDPI and/or the editor(s). MDPI and/or the editor(s) disclaim responsibility for any injury to people or property resulting from any ideas, methods, instructions or products referred to in the content. |
© 2023 by the authors. Licensee MDPI, Basel, Switzerland. This article is an open access article distributed under the terms and conditions of the Creative Commons Attribution (CC BY) license (https://creativecommons.org/licenses/by/4.0/).