Article

The Impact of Technology Innovation on Urban Land Intensive Use in China: Evidence from 284 Cities in China

School of Accounting, Harbin University of Commerce, Harbin 150028, China
*
Author to whom correspondence should be addressed.
Sustainability 2023, 15(4), 3801; https://doi.org/10.3390/su15043801
Submission received: 11 January 2023 / Revised: 15 February 2023 / Accepted: 17 February 2023 / Published: 19 February 2023

Abstract

:
How to improve the level of urban land intensive use (ULIU) has been of wide concern to academic circles. Technology innovation, as the internal driving force of economic development, has an important impact on ULIU. To clarify the impacts of technology innovation on ULIU, this study measures the ULIU level index of China from 2006 to 2019 from four dimensions: the input-output level of economic efficiency, the carrying capacity of ecological environment, the harmony of the man-land relationship and the rationality of relationships between regions. On this basis, as there are different production technologies and land use technologies between cities, the differences of ULIU in different regions are analysed. Using the spatial econometric model, this study empirically analyzes the impact of technology innovation on ULIU. In addition, considering the differences in geographical distribution, natural resource endowment and technological type, this study analyzes the heterogeneous impact of technology innovation on ULIU. The main conclusions are as follows: (1) The level of ULIU and technology innovation in China is increasing year by year. The level of ULIU and technology innovation in the eastern region is higher than that in the central and western regions. (2) From the spatial perspective, ULIU has a significant positive spatial spillover effect. (3) On the whole, technology innovation significantly improves the level of ULIU. (4) The impact of technology innovation in different regions, different types of cities and different types of technologies on ULIU is heterogeneous. Our results not only enrich the research on the relationship between technology innovation and ULIU, but also provide a reference for the formulation of relevant policies.

1. Introduction

Land resources are the most important material basis of urban development. Recently, with the rapid economic development, urban land use in China is expanding rapidly [1]. From 2006 to 2020, the area of urban construction land in China increases from 31,765.7 km2 to 58,355.3 km2, with an average annual growth rate of 4.44%. The rapid expansion of urban land area has seriously depleted a large number of cultivated land resources [2]. To provide a solution to the abandonment of cultivated land resources, China has introduced many cultivated land protection systems, but the effect is small. Statistics show that the per-capita cultivated land area in China is 0.007 km2, which is only 1/4 of the world’s per-capita cultivated land area. Medium and low fields account for 2/3 of the total fields. High-quality cultivated land resources are very scarce. The problem of environmental pollution restricts the sustainable development of economy to a large extent [3]. With this background, reducing the excessive demand for urban land and the blind occupation of cultivated land, and promoting the intensive use of urban land, is an evitable choice to achieve sustainable economic development. Therefore, it is necessary to explore effective ways to promote the transformation of urban land from extensive use to intensive use.
Previous studies have found that economic structure and technological progress [4], the development of related industries [5] and the introduction of land policies [1] have an impact on ULIU. As the motivating force for economic development, the impact of technology innovation on ULIU is particularly important [6]. Technology innovation largely determines how efficient the allocation of land resources is [7]. It plays a key role in the effective use of land resources. Therefore, studying the impact of technology innovation on ULIU and its mechanism not only has important theoretical significance, but also provides valuable policy suggestions for deriving the path of technological innovation to promote ULIU.
This study firstly measures the ULIU level index of 284 cities in China from the following four dimensions: the input-output level of economic efficiency, the carrying capacity of ecological environment, the harmony of man-land relationship and the rationality of regional relationship. Secondly, it uses the spatial econometric model to empirically analyze the impact of technology innovation on ULIU. Finally, dividing the national sample into eastern, central and western regions based on differences in geographical distribution, allocating 284 cities into resource-based cities and non-resource-based cities based on differences in the natural resources endowment, differentiating technology innovation into green technology innovation and general technology innovation based on differences in the technological type, this study examines the heterogeneous impact of technology innovation in different regions, different types of cities and different types of technologies on ULIU.

2. Literature Review

The concept of land intensive use originated from agriculture and was later introduced into the field of urban land research. At present, the definition of the concept of ULIU has not been unified. At first, the ULIU was defined as: increasing the input of capital, labor and other factors to improve the economic output of land while maintaining the same scale of urban land [8,9]. However, land is a complex economic, social and environmental system [10]. The concept of ULIU should not be limited to the economic category, but should pursue the harmony of economic, social and ecological environments [11].
The scientific measurement of ULIU level is the focus of many scholars [12]. There are two mainstream measurement methods: One is nonparametric estimation method, such as the DEA model [13], SFA model [14] and system dynamics method [15]. The other is objective evaluation methods, such as entropy weight method [16] and principal component analysis method [17]. Compared with the subjective evaluation method, the objective evaluation method has higher credibility and accuracy.
Changes in land use have an impact on the entire earth system. The quality of water resources [18], air quality [19], soil resources [20] and climate system will all change with land use. At present, land use change is regarded as one of the most pressing environmental problems to be solved. The characteristics of the spatial change in land use are also a concern of many scholars. Zhu et al. [21] used the SBM model to reveal the spatial change characteristics of 35 megacities in China during 2008–2015. Sang et al. [22] used the CA-Markov model to simulate the spatial characteristics of land use in Fangshan district of Beijing in 2015. He believed that the change in the spatial characteristics of land use mainly comes from population growth. Liu et al. [23] found that the spatial characteristics of land use in China changed significantly from 1990 to 2010, which was mainly due to the government’s macro-control and economic driving forces.
Exploring the influencing factors of ULIU is also a focus of current research. Economic development level [24], city scale [17], industrial agglomeration [25] and transportation [26] are considered to be important factors affecting ULIU. To be specific, rapid urbanization leads to a large loss of cultivated land [27]. Industrial agglomeration can promote the effective use of land through labor market externalities, technology externalities and capital externalities [28]. In addition, policy factors such as vineyard cultivation expansion policy [29], related land policy [30] and urbanization policy [31] are also considered to affect ULIU. Among many influencing factors, the impact of technology innovation on land use cannot be ignored [32]. However, existing studies have only analyzed the interaction between technology innovation and land use, but have not deeply discussed the impact of technology innovation on ULIU and its mechanism.
In recent years, spatial econometric models have been widely used to measure spatial correlations between variables [33]. Previous studies have shown that ULIU has a significant positive spatial correlation [24]. The intensive use of urban land is not only affected by local economic and social factors, but also affected by spatially related areas. Therefore, the spatial effect of ULIU should be considered when exploring the impact of technology innovation on ULIU. However, there are no studies in the literature on the impact of technology innovation on ULIU using the spatial econometric model, which will cause bias in the estimation results.
At present, studies on ULIU are mainly based on industry [34,35], provincial level [36], and several cities [17] and single city [37]. There are few studies on ULIU as a whole. Compared with provincial data, city-level data can better reflect regional differences [38]. To the best of the authors’ knowledge, there is no existing literature that studies ULIU using all cities in China as research samples.
This paper makes the following contributions: Firstly, in terms of theory, it explores the impact of technology innovation on ULIU and its mechanism for the first time, providing an important reference for the formulation of urban land policies. Existing literature mainly focuses on the impact of economic and social factors such as economic development, urban scale, and industrial structure on ULIU, while ignoring the impact of technological innovation on ULIU. Secondly, in terms of research methods, the spatial econometric model is used in this paper, which enriches the application of the spatial econometric model in the land field. At present, the main research methods used in land use are the PSM method [39], Tobit model [40] and panel data model [41], while the spatial econometric model is less used in land use. Thirdly, in terms of sample selection, city-level data as research samples were chosen, which fully reflects the differences among regions and helps decision-makers to formulate urban land policies according to local conditions. At present, most of the existing research chose provincial regions or a single city as the research object, while ignoring the differences among regions in economic development level, main industrial pillars and resource endowment.

3. Theoretical Analysis and Research Hypothesis

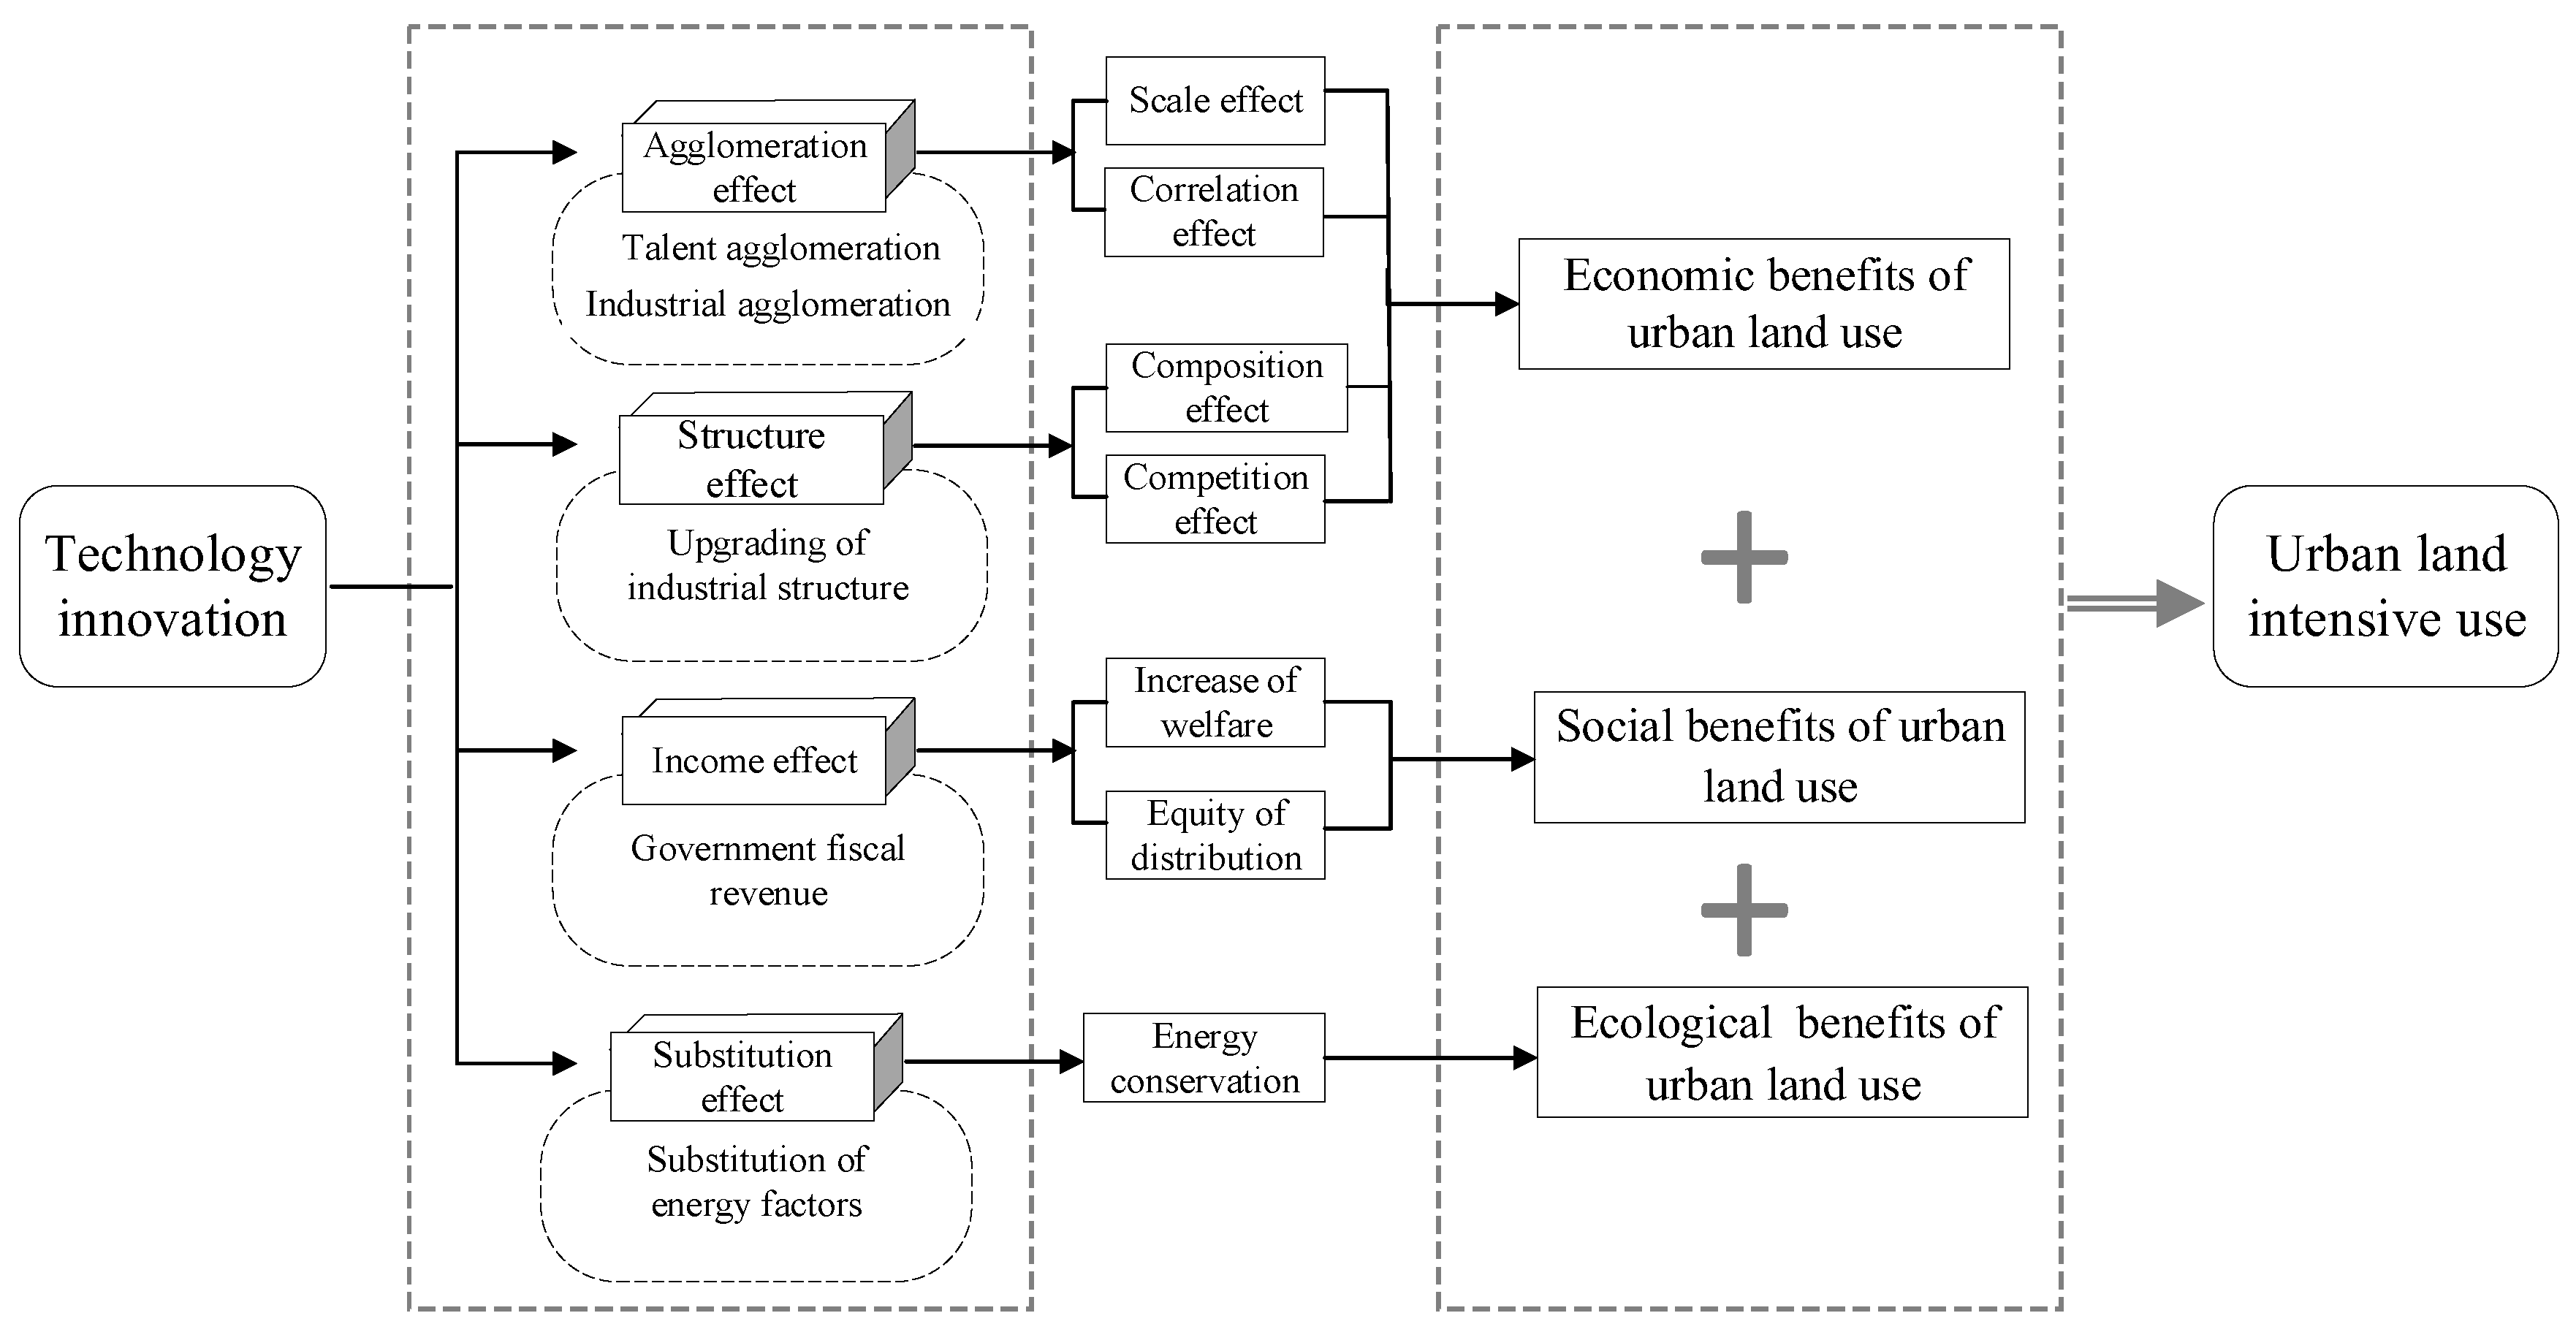
This paper defines ULIU as: without increasing the total amount of urban land, the utilization efficiency of urban land can be improved and higher economic, social and ecological benefits can be obtained, which is achieved by improving the operation and management, optimizing the structure of land use, and other ways. Technology innovation affects ULIU mainly in four ways: the agglomeration effect, structure effect, income effect and substitution effect (Figure 1). Firstly, the agglomeration effect. Technology innovation can promote talent agglomeration and industrial agglomeration [42]. Talent agglomeration can reduce industrial costs and promote the development of the service industry, thereby generating economies of scale and improving economic output per unit of land area. Meanwhile, the concentration of talents can form the economy of scope. When talent is pooled, new ideas are synthetized and put to use in brand new ways. The production cost of the enterprise is reduced and the economic benefit is increased. As for industrial agglomeration, in order to obtain returns to scale, the industries clustered in a particular region conduct specialized production according to their own advantages, which significantly improves the correlation effect among industries, thus improving the economic benefits of land use. Secondly, the structure effect: according to the theory of economic development, the process of innovation is accompanied by the destruction of old industries and the emergence of new industries, that is, the continuous evolution of industrial structure [43]. The upgrading of industrial structure is an important driving force for the intensive use of urban land [44]. The upgrading of industrial structure can promote the comparative advantages of each region, deepen the industrial division of labor, strengthen the effect of scale economy, thus improving the economic benefits of urban land use. Thirdly, the income effect. Technology innovation can promote economic growth. Rapid economic growth can increase government financial revenue, and then help the government in improving the quantity and quality of public goods supply, thus improving the level of public welfare. Fourthly, there is the substitution effect. It refers to the changes in the relative inputs of various production factors caused by technology innovation. Different proportions of energy factors and non-energy factors can achieve a certain level of output. Technology innovation enables units of non-energy production factors to replace more energy production factors, which reduces the emission of pollutants [45]. The ecological benefits of land use are improved.
Hypothesis 1.
Technology innovation can improve the level of ULIU through the agglomeration effect, structure effect, income effect and substitution effect.
From the perspective of spatial spillover effect, the change of ULIU level in a region affects the ULIU level in geographically or economically similar regions mainly through the following two aspects: One is the demonstration effect. In order to promote the intensive use of land, local governments make innovations in land supply conditions, idle land management and other related land systems, which absorb more production factors for the region and improve land income. Taking it as a model, other governments can formulate and improve relevant land policies based on their own actual conditions. In addition, cities with a high level of ULIU can promote the intensive use of urban land in surrounding cities through knowledge spillovers, technology diffusion and talent transfer. Therefore, Hypothesis 2 is proposed in this paper.
Hypothesis 2.
ULIU has a positive spatial spillover effect.
Regarding regional differences, the geographical location, transportation infrastructure level and relevant national support policies of different regions affect the level of technology innovation [46]. Various technological innovation levels in different regions have different impacts on ULIU. Regarding natural resource endowment differences, the theory of resource curse points out that excessive dependence on natural resources can affect the technology progress of a region. Therefore, cities with different resource abundance have different levels of technological innovation, which have different impacts on ULIU. Regarding technological differences, general technology innovation refers to the technology innovation that achieves economic output under the condition of producing certain pollutants. Green technology innovation refers to the technology innovation that achieves higher economic output with lower pollutant emission. Compared with the general technological innovation, it not only has the characteristics of improving production efficiency and increasing income, but can also save resources and improve environmental quality. Therefore, Hypothesis 3 is proposed in this paper.
Hypothesis 3.
The impact of technology innovation in different regions, different types of cities and different types of technologies on ULIU is heterogeneous.

4. Study Area, Research Methods and Variable Selection

4.1. Study Area

The study area of this paper covers 284 cities in China (excluding Hong Kong, Macao, Tibet, Taiwan and Hainan). Figure 2 shows the geographic distribution of 284 cities. 284 cities cover the eastern, central and western regions. These cities have different economic, social and urban characteristics. There are two main reasons why this study takes prefecture-level cities as the research object. Firstly, compared with provincial regions, prefecture-level cities can better reflect the economic and social development gap between regions. Secondly, compared with county-level regions, prefecture-level cities have more comprehensive statistical index data, which provides a basis for empirical analysis.

4.2. Model Construction

4.2.1. STIRPAT Model

In order to verify the above research hypotheses, this paper uses the STIRPAT model [47] to investigate the impact of technology innovation on ULIU. The standard STIRPAT model is as follows:
I = a P θ 1 A θ 2 T θ 3 e
where, I represents the environmental impact. Because land use is an important part of the environmental impact, this variable is expressed as urban land intensive use in this paper. T represents technological progress, where it represents the level of technological innovation; P is population size; A is per capita wealth; a is a constant term; e is the error term. Taking the logarithm of both sides of Equation (1):
ln I = A 0 + θ 1 ln P + θ 2 ln A + θ 3 ln T + ε
Extending the original STIRPAT model:
ln U L I U i t = η 1 ln T I i t + η 2 ln W E A i t + η 3 ln P E O i t + η 4 ln I N V i t + η 5 ln F I N i t + η 6 ln O P E N i t + ε i t
Among them, ULIU is the explained variable of urban land intensive use; TI is the explanatory variable of technology innovation; WEA, PEO, INV, FIN and OPEN are the control variables of per capita wealth, population density, investment, financial scale and degree of openness; ε i t is the random error term.

4.2.2. Spatial Econometric Model

It is common for innovation factors such as technology and talent to move across regions [48]. The knowledge and technology spillover effects caused by technological progress in a certain region may have an impact on the spatially related regions. Considering the spatial interaction of ULIU among regions, the spatial econometric model is used in this paper. The formula is as follows:
Spatial autoregressive model (SAR):
ln U L I U i t = α 1 j = 1 n W i j ln U L I U i t + α 2 ln T I i t + α 3 ln W E A i t + α 4 ln P E O i t + α 5 ln I N V i t + α 6 ln F I N i t + α 7 ln O P E N i t + ε i t
Spatial error model (SEM):
ln U L I U i t = β 1 ln T I i t + β 2 ln W E A i t + β 3 ln P E O i t + β 4 ln I N V i t + β 5 ln F I N i t + β 6 ln O P E N i t + ε i t ε i t = δ j = 1 n W i j ε i t + ν i t
where α 1 and δ are the coefficients of the spatial lag term of the explained variable and the error term, respectively; Wij is the spatial weight matrix. This paper chooses the geographical distance weight matrix (W1) and the economic distance weight matrix (W2) as the spatial weight matrix. The formula is as follows:
W 1 = 1 / d i j i f   i j 0 i f   i = j
W 2 = 1 / ( G D P i ¯ G D P j ¯ ) i f   i j 0 i f   i = j
Among them, dij in W1 represents the geographical distance between city i and city j; The G D P i ¯ and G D P j ¯ in W2 represent the per capita GDP of city i and city j, respectively.

4.3. Variable Selection

4.3.1. Explained Variable

Urban land intensive use (ULIU): The entropy method is used to measure the ULIU level. According to the existing research, this study constructs the comprehensive evaluation index system of ULIU in China based on four aspects: the input-output level of economic efficiency, the carrying capacity of the ecological environment, the harmony of the man-land relationship and the rationality of regional relationships (Table 1). The input-output level of economic efficiency is generally expressed by GDP per unit of land, industrial output value per land and retail sales of social consumer goods per unit of land. As for the carrying capacity of ecological environment, this study uses the per-capita road area and construction land area to express it. With regard to the integration of man-land relationship, the paper selects green land coverage rate, per-capita industrial wastewater emissions, per-capita solid industrial waste emissions and industrial SO2 emissions to characterize its compatibility. Regarding the rationality of regional association, this study selects the number of full-time teachers per 10,000 people, buses per 10,000 people, doctors per 10,000 people and library stock per 10,000 people to represent its rationality. These indicators are classified as the economic, social and ecological benefits of urban land use.

4.3.2. Core Explanatory Variable

Technology innovation (TI): Patents are closely related to technology innovation [49]. However, patent licensing has a certain time lag, which cannot reflect the technology innovation activities in a timely manner [50]. Therefore, this paper selects the number of patent applications as the measurement index of technology innovation.

4.3.3. Control Variables

Wealth per capita (WEA): Wealth is an important indicator for measuring the economic development level in a region. The more wealth per capita, the higher the level of regional economic development. The rapid economic development may lead to an increase in demand for urban construction land. Arable land is occupied [51]. The economic and ecological benefits of land use decline. This paper selects the average annual real wage level of employees to represent the per capita wealth.
Population density (PEO): Population density is an important social factor controlling changes in the level of ULIU [52]. The increase of population density can produce a population agglomeration effect, bringing a bigger labor force and technology and other production factors into the city, which brings scale economy to the development of the city and improves the level of ULIU. In this study, the number of people per unit area was chosen to represent the population density.
Investment (INV): As a part of national income, the increase in investment is conducive to consolidating the foundation for economic growth [53]. According to Keynesian theory, increasing investment can increase income and employment, which is the multiplier effect. The formula for calculating the multiplier K is: K = Δ Y / Δ I = Δ Y / ( Δ Y Δ C ) = 1 / ( 1 Δ C / Δ Y ) = 1 / ( 1 b ) . Among them, ΔI is the change in investment; ΔY is the change in income; ΔC is the change in consumption; and b is the marginal propensity to consume. In general, 0 < b < 1, so the investment multiplier K is always greater than 1. The multiplier effect makes the economic income increase exponentially. The increase of income makes more capital flow into the factor market of production and the increase of economic output, which increases the economic benefit of land use. In this study, the fixed asset investment of the whole society was selected to represent the investment.
Financial scale (FIN): The expansion of financial scale can enable enterprises to obtain more financial support, which improves their production efficiency and energy use efficiency [54], thus improving the ULIU level. In this study, the total deposit of financial institutions per capita was chosen to represent the financial scale.
Degree of openness (OPEN): Regions with a high degree of openness can share the spillover fruits of knowledge and technology to a greater extent. The vitality of the land market can be stimulated [55]. The actual amount of foreign capital per unit of land was used in this study to express the degree of openness.
Industrial structure (INS): The optimization of industrial structure can generate new land demand, which leads to changes in land quantity and the upgrading of land use structure, thus improving ULIU [56]. This study selected the proportion of output value of secondary and tertiary industries in GDP to represent this.
Government intervention degree (GOV): Excessive government intervention in the economy and society is not conducive to the operation of the market, which can inhibit the allocation and utilization of land resources. Simultaneously, excessive government intervention also contributes to the convenience of the development of polluting industries, increases the emission of pollutants and reduces the ULIU. The proportion of fiscal expenditure in GDP was used to represent this.
Urbanization level (URB): The increase of urbanization level improves productivity through the concentration of resources [57]. In addition, the accompanying pollutant discharge also has a negative effect on ULIU. In this study, the proportion of the population of the municipal district in the population of the whole city was used to represent this.

4.3.4. Data Sources and Descriptive Statistics

This paper selects panel data of 284 cities from 2006 to 2019 as research samples. All data were obtained from China Urban Construction Statistical Yearbook, China Urban Statistical Yearbook and National Bureau of Statistics. In order to eliminate the heteroscedasticity, in this study, logarithmic processing was carried out on each variable. Descriptive statistics and correlation matrices of variables are shown in Table 2 and Table 3, respectively.

5. Results

5.1. Spatial and Temporal Characteristics of ULIU Level and Technology Innovation in China

In terms of ULIU, except for 2007, ULIU is on the rise, reaching a peak in 2019. According to the 11th Five-Year Plan issued at the end of 2005, the red line between the quantity and quality of cultivated land should be strictly observed and the structure of incremental land use should be optimized. This policy has a great impetus for the improvement of ULIU level. In terms of space, there are obvious spatial differences in ULIU. The level of ULIU in the eastern region was significantly higher than that in the central and western regions, with an average of 0.0786 (Figure 3a). In terms of TI, the level of technology innovation showed an upward trend year by year and reached its peak in 2019 (Figure 3b). From the perspective of space, the level of technology innovation in the eastern region is always higher than that in the central and western regions. Compared with the central and western regions, the technology innovation in the eastern region starts earlier and the relevant policies are more sophisticated.
The city which ranks first in ULIU is Shenzhen, with the average value of ULIU reaching 0.286 from 2006 to 2019 (Figure 4a). This benefited from the rapid economic development of Shenzhen and the introduction of the relevant land system. Moreover, except for Ordos and Karamay, the rest of the top ten cities are located in the eastern region. About TI, the city with the largest number of patent applications is Beijing, with an average of 101,942 patent applications from 2006 to 2019 (Figure 4b). In addition, except Chengdu, the other nine cities are all located in the eastern region, which indicates that technology innovation has a certain correlation with ULIU.
Figure 5 shows the spatial distribution of ULIU and TI in 284 cities in China in 2006, 2010, 2014 and 2019. ULIU and TI in most cities has been improved. In 2019, the number of cities with ULIU index between 0.09 and 0.38 reached 120, an increase of 67 cities compared with 2006. In 2019, the number of cities with patent applications ranging from 9691 to 239,892 reached 71, an increase of 67 cities compared with 2006.

5.2. Estimation Results of the Benchmark Model

Table 4 shows the estimation results without considering spatial factors. Columns (1) to (5) show the estimation results of OLS, the region fixed effects model, the time fixed effects model, the time and region dual fixed effects model and the random effects model, respectively.
The results show that the time and region dual fixed effects model is the best model. With regard to the core explanatory variable, the development of technology innovation can significantly improve the level of ULIU in China without considering spatial factors. With regard to the control variables, the increase of per capita wealth and excessive government intervention can inhibit the improvement of ULIU level. The regression coefficients of population density, investment, financial scale, industrial structure and the degree of openness are all significantly positive, indicating that the increase of population density, investment, financial scale, the upgrade of industrial structure and expansion of the degree of openness have a positive impact on ULIU.
Panel data may have a spatial correlation. Due to the negligence of spatial correlation, the estimation results of traditional econometric models may have a certain bias [58]. Therefore, the spatial econometric model is used.

5.3. Spatial Autocorrelation Test

5.3.1. Global Moran’s I

The Moran’s I fluctuates between 0.048–0.081 and 0.411–0.498 under W1 and W2, respectively, indicating that ULIU has a stable spatial correlation (Table 5).

5.3.2. Local Moran’s I

The Global Moran index cannot reflect the correlation between cities. Therefore, four Moran scatter plots were drawn to reflect the spatial agglomeration characteristics of ULIU in 2006, 2010, 2014 and 2019, respectively. Figure 6 and Figure 7 shows that ULIU has a positive spatial correlation.

5.4. Estimation Results of Spatial Econometric Model

5.4.1. Full Sample Analysis

An appropriate spatial econometric model should be selected. Table 6 shows the estimation results of the spatial correlation test for the time and region dual fixed effects model. The LM-sar values under W1 and W2 are 12.254 and 20.366, respectively, which both pass the 1% significance level. The LM-err values under W1 and W2 are 5.19 and 12.141, respectively, which also pass the 1% significance level. This fully shows that there is a spatial correlation of dependent variables. In addition, the statistic of LM-sar is larger than that of LM-err, indicating that SAR model is the better choice for spatial econometric model. To check the robustness of the conclusions, we also report the estimation results of SEM.
As shown in Table 7, the regression coefficients of lnTI under W1 and W2 are 0.0127 and 0.0137, respectively, indicating that technology innovation significantly promotes the improvement of ULIU. For every 1% increase in the level of technology innovation, the level of ULIU increases by 0.013% and 0.014%, respectively, which is in line with hypothesis 1.
Regarding the spatial spillover effect of ULIU, the regression coefficients of the spatial lag term of ULIU under W1 and W2 are 0.270 (p < 0.01) and 0.094 (p < 0.01), respectively, indicating that ULIU has a positive spatial spillover effect. The improvement of ULIU level in one region can promote the improvement of ULIU level in geographically or economically close regions.
Regarding the control variables, the increase of per-capita wealth is not conducive to the improvement of ULIU level. The increase of per-capita wealth in a region often represents the improvement of region economic development level. Most of the economic growth in economically developed regions such as Shanghai, Nanjing and Hangzhou come from land finance and real estate income. The phenomenon of idle and waste of land resources is serious, resulting in the decrease in the input-output efficiency of land. Meanwhile, the occupation of cultivated land reduces the ecological benefits of land use. The level of ULIU decreases. An increase in population density can produce the population agglomeration effect. A bigger labor force, and more technology and other production factors flow into cities, which bring economies of scale to the development of cities and improves the economic benefits of land use. In addition, the increase in population density can put forward higher requirements for infrastructure construction, which improves the social benefits of land use. The increase in investment makes the economic output of unit land multiply through the multiplier effect. The economic benefit of land use increases. The expansion of financial scale can improve the level of ULIU. From the perspective of enterprises, a perfect securities market can encourage enterprises to invest in environmental protection, thus reducing environmental pollution. From the perspective of financial institutions, the implementation of green credit policies can promote the flow of corporate resources to environmentally friendly projects, thereby reducing environmental pollution. The reduction of environmental pollution is helpful to improve the ecological benefits of land use, thus improving ULIU level. The improvement of the degree of openness can improve ULIU level. With the increasingly strict requirements of urban development, the threshold of foreign investment has gradually raised. The purpose of investment is the quality of economic development rather than the quantity. In this case, the improvement of the degree of openness can reduce the emission of pollutants, which improves the benefits of land use. The upgrade of industrial structure makes production resources flow to higher gradient industries and improve the ULIU level. Excessive government intervention not only reduces the economic benefit of land use by restricting the free flow of resources, but also reduces the ecological benefit of land use by promoting the development of polluting industries. The improvement of urbanization level enhances production efficiency through the accumulation of resources. However, the improvement of urbanization level also leads to the increase in residential land, which crowds out green land and reduces the ecological benefits of land use. Therefore, the impact of urbanization level on ULIU is not significant.

5.4.2. Robustness Test

(1) Replace the core explanatory variables
In terms of the selection of core explanatory variables, because there are certain limitations in taking the number of patent applications as an indicator of technology innovation, in this study, the urban innovation and entrepreneurship index released by the Enterprise Big Data Research Center of Peking University was taken as the measurement indicator of technology innovation. The estimation results are shown in column (1) and column (3) of Table 8. The impact of technology innovation on ULIU is still significantly positive, which indicates that the estimation results are robust.
(2) Replace the explained variables
In terms of the selection of explained variables, ULIU is replaced by urban land green use efficiency, which is measured by the Malmquist index based on DDF super-efficiency model. Among them, the input includes capital, labor and land of each city in China, and the output includes GDP of each city (expected output) and industrial waste emissions of each city (unexpected output). The estimation results are shown in column (2) and column (4) of Table 8. Technology innovation also has a positive impact on urban land green use efficiency.

5.4.3. Heterogeneity Analysis

(1) The impact of technology innovation in different regions on ULIU
There are significant differences between different regions in China in terms of economic development level and urban innovation environment. Therefore, dividing 284 cities in China into eastern, central and western regions according to the economic scale and geographical location, this paper discusses the differential impact of technology innovation in different regions on ULIU.
As can be seen in Table 9, the facilitating effect of technology innovation on ULIU is mainly reflected in the eastern region. The facilitating effect of technology innovation on ULIU in the central region is much lower than that in the eastern region. However, there is a negative correlation between technology innovation and ULIU in western China.
(2) The impact of technological innovation in different types of urban on ULIU
It can be seen from Table 10 that technology innovation in non-resource-based cities has a positive impact on ULIU. Compared with non-resource-based cities, the marginal effect of technology innovation in resource-based cities on ULIU is greater.
(3) The impact of different types of technology innovation on ULIU
Different types of technology innovation may have a heterogeneous impact on ULIU. Dividing technology innovation into general technology innovation and green technology innovation, this paper further discusses the impact of different types of technology innovation on ULIU.
Compared with general technology innovation, green technology innovation has a greater facilitating effect on ULIU (Table 11).

6. Discussion

Technology innovation can promote ULIU. Firstly, technology innovation can accelerate the flow of production factors such as capital and talent to areas with a high added value. The scale effect of economy and the correlation effect of industry are realized. The economic benefits of land use can be improved. Secondly, technology innovation makes the proportion of high-service and high-technology industries increase, which can improve the economic benefits of land use. Thirdly, technology innovation can promote economic growth. The government financial expenditure increases, which brings social benefits of land use. Fourthly, technology innovation can reduce the proportion of energy factors and environmental pollution. The environmental benefits of land use can be improved. Du et al. [30] analyzed the impact of land pricing system on ULIU. Gong et al. [25] analyzed the relationship between industrial agglomeration and ULIU. Zeng et al. [26] explored the influence of transportation network on ULIU. However, no scholars have analyzed the impact of technological innovation on ULIU and its mechanism from the perspective of innovation.
Taking input and output per unit of land area as evaluation criteria, some regions construct an evaluation system for the benefit of industrial enterprises. The evaluation system fully reflects the facilitating effect of technology innovation on ULIU. Specifically, it can promote resource factors to gather to innovative enterprises through positive incentives and reverse forces, which will improve the output of regional unit land area and promote the intensive use of urban land. Taking Shaoxing as an example, in 2017, Shaoxing added the ratio of R&D expenditure to the main business income and full labor productivity to the evaluation system to guide enterprises to strengthen innovation in the areas of technology, management and manufacturing. With the improvement of the evaluation system, the number of innovative enterprises in Shaoxing has increased substantially. In 2021, 12 enterprises in Shaoxing were selected as the top 100 enterprises with high innovation ability in Zhejiang Province. The number of selected enterprises ranks the third in Zhejiang Province. The increase of innovative enterprises promotes the intensive use of land resources in Shaoxing.
ULIU has a significant positive spatial spillover effect. On the one hand, the improvement of ULIU level in one region has a demonstration effect on regions that are geographically or economically close. When the level of ULIU in the region is improved, governments in regions with similar geographical or economic geography will take it as a model to learn from, and formulate and improve relevant land policies based on their own conditions. Anhui Province selected 30 typical and exemplary cases from the three aspects of innovating land saving mode, transforming inefficient land use and improving technical methods. These cases provide a reference for the efficient use of land in surrounding areas. In 2018, the decline rate of construction land consumption per unit of GDP in Anhui Province ranks first in China. The level of ULIU increases significantly in Anhui Province. On the other hand, technological spillover effects in geographically or economically similar regions also promote the improvement of ULIU level in the region, which indicates that cooperation and exchange between cities are essential for the improvement of ULIU. At present, the common panel model and Tobit model are widely used in ULIU-related studies [40,41]. These models ignore the spatial spillover effect of ULIU and cannot accurately estimate the marginal effect of various influencing factors on ULIU. In the estimation results of benchmark model, the estimated coefficient of technological innovation is 0.0141. After considering the spatial spillover effect of ULIU, the estimated results of technological innovation are 0.0127 and 0.0137, indicating that if the spatial spillover effect of ULIU is not considered, the impact of technological innovation on ULIU will be overestimated.
The impact of technological innovation on ULIU is heterogeneous. As for regional heterogeneity, compared with other regions, technology innovation in the eastern region has the greatest facilitating effect on ULIU. The economic foundation of eastern region is strong, which provides certain financial support for enterprises to carry out technological innovation activities. If enterprises pay attention to technological input, their innovation ability continuously improves, thus promoting the improvement of production efficiency and resource utilization rate. The economic foundation of technology innovation is weak, which cannot significantly improve the utilization efficiency of resources. Regarding the heterogeneity of natural resource endowment, technological innovation plays a greater role in promoting ULIU in resource-based cities than in non-resource-based cities. Technology innovation can expand the comprehensive advantages of resource-based cities and improve the level of ULIU by optimizing resource allocation. Regarding technological heterogeneity, compared with general technology innovation, green technology innovation plays a greater role in promoting ULIU. Compared with general technology, green technology cannot only improve production efficiency, but also save resources and improve ecology. It has triple advantages of improving the economic, social and ecological benefits of land use. According to statistics, from the beginning of March 2021 to the end of April 2022, the number of green patent authorization is more than 210,000, which shows that the green technology innovation vitality of each subject is constantly enhanced. Kuang et al. [13] selected provincial data as the research object to explore the influencing factors of cultivated land use efficiency. Liu et al. [59] took Jiangsu Province as the research object and analyzed the impact of land market on land use. Tu et al. [60] analyzed the role of government intervention in industrial land by taking Hangzhou as the research object. These studies do not fully capture the differences between cities.

7. Conclusions and Policy Recommendations

7.1. Conclusions

Based on previous studies, this study carried out a theoretical analysis of the relationship between technology innovation and ULIU in China, and puts forward three research hypotheses. The results of this study confirm the rationality of these three hypotheses. Specifically, this paper measures the ULIU level index in China from four aspects: the input-output level of economic efficiency, the carrying capacity of the ecological environment, the harmony of the man-land relationship and the rationality of regional relationships. Considering the spatial correlation of ULIU in China, the spatial econometric model was used to empirically analyze the relationship between technology innovation and ULIU. The total sample was divided into the eastern, central and western regions, 284 cities were divided into resource-based cities and non-resource-based cities, and technology innovation was divided into green technology innovation and general technology innovation. The heterogeneous impact of technology innovation on ULIU was investigated. The main research conclusions are as follows:
(1) The level of ULIU and technology innovation in China shows an increasing development trend year by year. The level of ULIU and technology innovation in eastern China is higher than that in central and western China.
(2) From the perspective of space, ULIU has a significant positive spatial spillover effect. The improvement of the level of ULIU in the local region can have a positive impact on the ULIU in the spatially related areas. The positive spatial spillover effect mainly comes from the demonstration effect and technology spillover effect.
(3) On the whole, technology innovation significantly improves the level of ULIU. For every 1% increase in the technological innovation level, the level of ULIU increases by 0.013% and 0.014%, respectively, under the spatial weight matrices W1 and W2.
(4) From the perspective of regional heterogeneity, technology innovation has the greatest positive impact on ULIU level in the eastern region, followed by the central region, while technology innovation has an inhibitory impact on ULIU level in the western region. From the perspective of heterogeneity of natural resource endowment, technology innovation plays a greater role in improving ULIU level in resource-based cities than in non-resource-based cities. From the perspective of technological heterogeneity, the positive effect of green technology innovation on ULIU is greater than that of general technology innovation.
This study provides a new way for scholars to study ULIU. In addition, it is also helpful for policy makers to formulate policies from the perspective of technology innovation to promote intensive land use.

7.2. Policy Recommendations

  • Strengthen the radiation and driving role of central cities. This study found that ULIU has a significant positive spatial spillover effect, which indicates that “one-sided” efforts cannot achieve the most ideal effect. The central city should give full play to the role of radiation and drive the promotion of ULIU in surrounding cities. The surrounding cities should learn the relevant land policies of the central cities according to their own development conditions. Only through the joint efforts of cities can the linkage promotion of ULIU be promoted.
  • Implement technology innovation policies in light of local conditions. The formulation and implementation of technology innovation policy should consider the regional economic basis and technology innovation conditions. For the eastern region with a strong economic foundation, it is necessary to improve the ability of independent innovation and realize the harmonious development between man and land. The western region should improve the infrastructure conditions actively to ensure the smooth development of technological innovation activities.
  • Increase the proportion of green technology R&D investment in scientific research investment. Compared with general technology innovation, green technology innovation plays a greater role in improving the level of ULIU. Therefore, local governments should increase the proportion of green technology R&D investment in scientific research investment, and encourage the development and application of green technology in all regions.

7.3. Outlook

This study not only enriches the application of the spatial econometric model in the field of land, but also provides a reference for other scholars to analyze the influencing factors of ULIU. However, this paper only divides technology innovation into green technology innovation and general technology innovation, and analyzes the impact of the two types of technology innovation on the heterogeneity of ULIU, without further dividing technology innovation. The in-depth division of technological innovation can be carried out in future studies.

Author Contributions

Y.W.: Conceptualization, Resources, Supervision. L.Z.: Methodology, Software, Data curation, Investigation. All authors have read and agreed to the published version of the manuscript.

Funding

This research received no external funding.

Institutional Review Board Statement

Not applicable.

Informed Consent Statement

Not applicable.

Data Availability Statement

The data that support the findings of this study are available from [www.cnki.net].

Conflicts of Interest

We declare that we have no known competing financial interest or personal relationship that could have appeared to influence the work reported in this paper.

References

  1. Wang, J.; Lin, Y.; Glendinning, A.; Xu, Y. Land-use changes and land policies evolution in China’s urbanization processes. Land Use Policy 2018, 75, 375–387. [Google Scholar] [CrossRef]
  2. Chen, W.; Shen, Y.; Wang, Y.; Wu, Q. The effect of industrial relocation on industrial land use efficiency in China: A spatial econometrics approach. J. Clean. Prod. 2018, 205, 525–535. [Google Scholar] [CrossRef]
  3. Xu, W.; Jin, X.; Liu, J.; Zhou, Y. Analysis of influencing factors of cultivated land fragmentation based on hierarchical linear model: A case study of Jiangsu Province, China. Land Use Policy 2021, 101, 105119. [Google Scholar] [CrossRef]
  4. Peng, C.; Song, M.; Han, F. Urban economic structure, technological externalities, and intensive land use in China. J. Clean. Prod. 2017, 152, 47–62. [Google Scholar] [CrossRef]
  5. Huang, C.; Lin, F.; Chu, D.; Wang, L.; Liao, J.; Wu, J. Coupling relationship and interactive response between intensive land use and tourism industry development in China’s major tourist cities. Land 2021, 10, 697. [Google Scholar] [CrossRef]
  6. Luo, X.; Qin, J.; Cheng, C.; Pan, Y.; Yang, T. Spatial effects and influencing factors of urban land intensive use in the Yangtze River Delta under high-quality development. Front. Environ. Sci. 2022, 10, 1270. [Google Scholar] [CrossRef]
  7. Tan, R.; Zhang, T.; Liu, D.; Xu, H. How will innovation-driven development policy affect sustainable urban land use: Evidence from 230 Chinese cities. Sustain. Cities Soc. 2021, 72, 103021. [Google Scholar] [CrossRef]
  8. Romer, P.M. Increasing returns and long-run growth. J. Political Econ. 1986, 94, 1002–1037. [Google Scholar] [CrossRef] [Green Version]
  9. Brookfield, H.C. Intensification and disintensification in Pacific agriculture: A theoretical approach. Pac. Viewp. 1972, 13, 30–48. [Google Scholar] [CrossRef]
  10. Zhong, S.; Li, X.; Ma, J. Impacts of land finance on green land use efficiency in the Yangtze River Economic Belt: A spatial econometrics analysis. Environ. Sci. Pollut. Res. 2022, 29, 56004–56022. [Google Scholar] [CrossRef]
  11. Zeng, Y.; Bi, C.; Jia, J.; Deng, L.; Chen, Z. Impact of intensive land use on heavy metal concentrations and ecological risks in an urbanized river network of Shanghai. Ecol. Indic. 2020, 116, 106501. [Google Scholar] [CrossRef]
  12. Qiao, W.; Gao, J.; Liu, Y.; Qin, Y.; Lu, C.; Ji, Q. Evaluation of intensive urban land use based on an artificial neural network model: A case study of Nanjing City, China. Chin. Geogr. Sci. 2017, 27, 735–746. [Google Scholar] [CrossRef]
  13. Kuang, B.; Lu, X.; Zhou, M.; Chen, D. Provincial cultivated land use efficiency in China: Empirical analysis based on the SBM-DEA model with carbon emissions considered. Technol. Forecast. Soc. Chang. 2020, 151, 119874. [Google Scholar] [CrossRef]
  14. Wang, J.; Sun, K.; Ni, J.; Xie, D. Evaluation and factor analysis of the intensive use of urban land based on technical efficiency measurement—A case study of 38 districts and counties in Chongqing, China. Sustainability 2020, 12, 8623. [Google Scholar] [CrossRef]
  15. Geng, B.; Zheng, X.; Fu, M. Scenario analysis of sustainable intensive land use based on SD model. Sustain. Cities Soc. 2017, 29, 193–202. [Google Scholar] [CrossRef]
  16. Zhang, P.; Yang, D.; Qin, M.; Jing, W. Spatial heterogeneity analysis and driving forces exploring of built-up land development intensity in Chinese prefecture-level cities and implications for future Urban Land intensive use. Land Use Policy 2020, 99, 104958. [Google Scholar] [CrossRef]
  17. Hui, E.C.; Wu, Y.; Deng, L.; Zheng, B. Analysis on coupling relationship of urban scale and intensive use of land in China. Cities 2015, 42, 63–69. [Google Scholar] [CrossRef]
  18. Shi, P.; Zhang, Y.; Li, Z.; Li, P.; Xu, G. Influence of land use and land cover patterns on seasonal water quality at multi-spatial scales. Catena 2017, 151, 182–190. [Google Scholar] [CrossRef]
  19. Yang, H.; Chen, W.; Liang, Z. Impact of land use on PM2.5 pollution in a representative city of middle China. Int. J. Environ. Res. Public Health 2017, 14, 462. [Google Scholar] [CrossRef]
  20. Gebrelibanos, T.; Assen, M. Land use/land cover dynamics and their driving forces in the Hirmi watershed and its adjacent agro-ecosystem, highlands of Northern Ethiopia. J. Land Use Sci. 2015, 10, 81–94. [Google Scholar] [CrossRef]
  21. Zhu, X.; Li, Y.; Zhang, P.; Wei, Y.; Zheng, X.; Xie, L. Temporal–spatial characteristics of urban land use efficiency of China’s 35mega cities based on DEA: Decomposing technology and scale efficiency. Land Use Policy 2019, 88, 104083. [Google Scholar] [CrossRef]
  22. Sang, L.; Zhang, C.; Yang, J.; Zhu, D.; Yun, W. Simulation of land use spatial pattern of towns and villages based on CA–Markov model. Math. Comput. Model. 2011, 54, 938–943. [Google Scholar] [CrossRef]
  23. Liu, J.; Kuang, W.; Zhang, Z.; Xu, X.; Qin, Y.; Ning, J.; Zhou, W.; Zhang, S.; Li, R.; Yan, C.Z.; et al. Spatiotemporal characteristics, patterns, and causes of land-use changes in China since the late 1980s. J. Geogr. Sci. 2014, 24, 195–210. [Google Scholar] [CrossRef]
  24. Li, G.; Fang, C.; Pang, B. Quantitative measuring and influencing mechanism of urban and rural land intensive use in China. J. Geogr. Sci. 2014, 24, 858–874. [Google Scholar] [CrossRef]
  25. Gong, Q.; Guo, G.; Li, S.; Liang, X. Examining the coupling coordinated relationship between urban industrial co-agglomeration and intensive land use. Land 2021, 10, 499. [Google Scholar] [CrossRef]
  26. Zeng, C.; Zhao, Z.; Wen, C.; Yang, J.; Lv, T. Effect of complex road networks on intensive land use in China’s Beijing-Tianjin-Hebei urban agglomeration. Land 2020, 9, 532. [Google Scholar] [CrossRef]
  27. Deng, X.; Huang, J.; Rozelle, S.; Zhang, J.; Li, Z. Impact of urbanization on cultivated land changes in China. Land Use Policy 2015, 45, 1–7. [Google Scholar] [CrossRef]
  28. Zhang, W.; Wang, B.; Wang, J.; Wu, Q.; Wei, Y.D. How does industrial agglomeration affect urban land use efficiency? A spatial analysis of Chinese cities. Land Use Policy 2022, 119, 106178. [Google Scholar] [CrossRef]
  29. Basso, M. Land-use changes triggered by the expansion of wine-growing areas: A study on the Municipalities in the Prosecco’s production zone (Italy). Land Use Policy 2019, 83, 390–402. [Google Scholar] [CrossRef]
  30. Du, J.; Thill, J.-C.; Peiser, R.B. Land pricing and its impact on land use efficiency in post-land-reform China: A case study of Beijing. Cities 2016, 50, 68–74. [Google Scholar] [CrossRef]
  31. Wu, Y.; Zhang, X.; Shen, L. The impact of urbanization policy on land use change: A scenario analysis. Cities 2011, 28, 147–159. [Google Scholar] [CrossRef]
  32. Burgess, P.J.; Morris, J. Agricultural technology and land use futures: The UK case. Land Use Policy 2009, 26, S222–S229. [Google Scholar] [CrossRef] [Green Version]
  33. Zhong, S.; Li, J.; Zhao, R. Does environmental information disclosure promote sulfur dioxide (SO2) remove? New evidence from 113 cities in China. J. Clean. Prod. 2021, 299, 126906. [Google Scholar] [CrossRef]
  34. Xie, H.; Zhai, Q.; Wang, W.; Yu, J.; Lu, F.; Chen, Q. Does intensive land use promote a reduction in carbon emissions? Evidence from the Chinese industrial sector. Resour. Conserv. Recycl. 2018, 137, 167–176. [Google Scholar] [CrossRef]
  35. D’Amato, D.; Korhonen, J.; Toppinen, A. Circular, green, and bio economy: How do companies in land-use intensive sectors align with sustainability concepts? Ecol. Econ. 2019, 158, 116–133. [Google Scholar] [CrossRef]
  36. Zhang, M.; Liu, X.; Peng, S. Effects of urban land intensive use on carbon emissions in China: Spatial interaction and multi-mediating effect perspective. Environ. Sci. Pollut. Res. 2023, 30, 7270–7287. [Google Scholar] [CrossRef]
  37. Xuemei, L.; Qian, L.; Jie, H.; Ping, Y.; Yamin, L. Analysis of the Spatio-Temporal Evolution of Land Intensive Use and Land Ecological Security in Tianjin from 1980 to 2019. J. Resour. Ecol. 2021, 12, 367–375. [Google Scholar] [CrossRef]
  38. Wang, H.; Guo, J. Impacts of digital inclusive finance on CO2 emissions from a spatial perspective: Evidence from 272 cities in China. J. Clean. Prod. 2022, 355, 131618. [Google Scholar] [CrossRef]
  39. Fei, R.; Lin, Z.; Chunga, J. How land transfer affects agricultural land use efficiency: Evidence from China’s agricultural sector. Land Use Policy 2021, 103, 105300. [Google Scholar] [CrossRef]
  40. Xue, D.; Yue, L.; Ahmad, F.; Draz, M.U.; Chandio, A.A.; Ahmad, M.; Amin, W. Empirical investigation of urban land use efficiency and influencing factors of the Yellow River basin Chinese cities. Land Use Policy 2022, 117, 106117. [Google Scholar] [CrossRef]
  41. Huang, Z.; He, C.; Zhu, S. Do China’s economic development zones improve land use efficiency? The effects of selection, factor accumulation and agglomeration. Landsc. Urban Plan. 2017, 162, 145–156. [Google Scholar] [CrossRef]
  42. Li, H.; Lu, J.; Li, B. Does pollution-intensive industrial agglomeration increase residents’ health expenditure? Sustain. Cities Soc. 2020, 56, 102092. [Google Scholar] [CrossRef]
  43. Wu, N.; Liu, Z. Higher education development, technological innovation and industrial structure upgrade. Technol. Forecast. Soc. Chang. 2021, 162, 120400. [Google Scholar] [CrossRef]
  44. Chen, W.; Chen, W.; Ning, S.; Liu, E.-n.; Zhou, X.; Wang, Y.; Zhao, M. Exploring the industrial land use efficiency of China’s resource-based cities. Cities 2019, 93, 215–223. [Google Scholar] [CrossRef]
  45. Du, K.; Li, P.; Yan, Z. Do green technology innovations contribute to carbon dioxide emission reduction? Empirical evidence from patent data. Technol. Forecast. Soc. Chang. 2019, 146, 297–303. [Google Scholar] [CrossRef]
  46. Liu, Y.; Dong, F. How technological innovation impacts urban green economy efficiency in emerging economies: A case study of 278 Chinese cities. Resour. Conserv. Recycl. 2021, 169, 105534. [Google Scholar] [CrossRef]
  47. York, R.; Rosa, E.A.; Dietz, T. STIRPAT, IPAT and ImPACT: Analytic tools for unpacking the driving forces of environmental impacts. Ecol. Econ. 2003, 46, 351–365. [Google Scholar] [CrossRef]
  48. Yang, H.; Li, L.; Liu, Y. The effect of manufacturing intelligence on green innovation performance in China. Technol. Forecast. Soc. Chang. 2022, 178, 121569. [Google Scholar] [CrossRef]
  49. Liu, X.; Zhang, X. Industrial agglomeration, technological innovation and carbon productivity: Evidence from China. Resour. Conserv. Recycl. 2021, 166, 105330. [Google Scholar] [CrossRef]
  50. Lin, B.; Ma, R. Green technology innovations, urban innovation environment and CO2 emission reduction in China: Fresh evidence from a partially linear functional-coefficient panel model. Technol. Forecast. Soc. Chang. 2022, 176, 121434. [Google Scholar] [CrossRef]
  51. Guo, L.; Di, L.; Tian, Q. Detecting spatio-temporal changes of arable land and construction land in the Beijing-Tianjin corridor during 2000–2015. J. Geograph. Sci. 2019, 29, 702–718. [Google Scholar] [CrossRef] [Green Version]
  52. Feng, Y.; Chun, Y.; Wei, Z.; Yin-gui, C.; Ming-jie, Q. Study on the influence factors to regional land intensive use. Resour. Ind. 2010, 12, 67. [Google Scholar]
  53. Anderson, D. Investment and economic growth. World Dev. 1990, 18, 1057–1079. [Google Scholar] [CrossRef]
  54. Qamri, G.M.; Sheng, B.; Adeel-Farooq, R.M.; Alam, G.M. The criticality of FDI in Environmental Degradation through financial development and economic growth: Implications for promoting the green sector. Resour. Policy 2022, 78, 102765. [Google Scholar] [CrossRef]
  55. Pan, X.; Li, M.; Wang, M.; Chu, J.; Bo, H. The effects of outward foreign direct investment and reverse technology spillover on China’s carbon productivity. Energy Policy 2020, 145, 111730. [Google Scholar] [CrossRef]
  56. Liu, J.; Hou, X.; Wang, Z.; Shen, Y. Study the effect of industrial structure optimization on urban land-use efficiency in China. Land Use Policy 2021, 105, 105390. [Google Scholar] [CrossRef]
  57. Lu, X.; Shi, Z.; Li, J.; Dong, J.; Song, M.; Hou, J. Research on the Impact of Factor Flow on Urban Land Use Efficiency from the Perspective of Urbanization. Land 2022, 11, 389. [Google Scholar] [CrossRef]
  58. Liu, J.; Yu, Q.; Chen, Y.; Liu, J. The impact of digital technology development on carbon emissions: A spatial effect analysis for China. Resour. Conserv. Recycl. 2022, 185, 106445. [Google Scholar] [CrossRef]
  59. Liu, Z.; Zhang, L.; Rommel, J.; Feng, S. Do land markets improve land-use efficiency? evidence from Jiangsu, China. Appl. Econ. 2020, 52, 317–330. [Google Scholar] [CrossRef]
  60. Tu, F.; Yu, X.; Ruan, J. Industrial land use efficiency under government intervention: Evidence from Hangzhou, China. Habitat Int. 2014, 43, 1–10. [Google Scholar] [CrossRef]
Figure 1. The mechanism of technology innovation affecting ULIU.
Sustainability 15 03801 g001
Figure 2. Study area.
Sustainability 15 03801 g002
Figure 3. Average ULIU and TI of 284 cities from 2006 to 2019: (a) ULIU; (b) TI.
Sustainability 15 03801 g003
Figure 4. ULIU and TI average ranking from 2006 to 2019 (Top 10 Cities): (a) ULIU; (b) TI.
Sustainability 15 03801 g004
Figure 5. Spatial distribution of ULIU and TI: (a) Spatial distribution of ULIU in 2006; (b) Spatial distribution of ULIU in 2010; (c) Spatial distribution of ULIU in 2014; (d) Spatial distribution of ULIU in 2019; (e) Spatial distribution of TI in 2006; (f) Spatial distribution of TI in 2010; (g) Spatial distribution of TI in 2014; (h) Spatial distribution of TI in 2019.
Sustainability 15 03801 g005aSustainability 15 03801 g005b
Figure 6. Moran’s I scatter plot (W1): (a) 2006; (b) 2010; (c) 2014; (d) 2019.
Sustainability 15 03801 g006
Figure 7. Moran’s I scatter plot (W2): (a) 2006; (b) 2010; (c) 2014; (d) 2019.
Sustainability 15 03801 g007
Table 1. Evaluation index system of ULIU.
IndexFormulaAnnotation
Economic benefits of urban land useGDP per unit of landGDP/urban construction land areaInput-output level
Industrial output per unit of landIndustrial output/urban construction land area
Capita retail sales of consumer goods per unit of landRetail sales of consumer goods/urban construction land area
Per-capita road areaUrban road area/total urban populationLoad carrying capacity
Per-capita construction land areaUrban construction land area/total urban population
Social benefits of urban land useThe number of full-time teachers per 10,000 peopleThe number of full-time teachers/total urban populationThe relationship between regions
The number of buses per 10,000 peopleThe number of buses/total urban population
The number of doctors per 10,000 peopleThe number of doctors/total urban population
Library stock per 10,000 peopleLibrary stock/total urban population
Ecological benefits of urban land useGreen space coverage in built-up areaThe green area of the urban area/area of built-up areaThe relationship between man and land
Per-capita public green spacePublic green space/total urban population
Discharge of industrial wastewater per unit of landDischarge of industrial wastewater/urban construction land area
Solid industrial waste gas emissions per unit of landSolid industrial waste gas emissions/urban construction land area
Industrial SO2 emissions per unit of landIndustrial SO2 emissions/urban construction land area
Table 2. Descriptive statistics of variables.
VariableMeaningObsMeanStd.DevMinMax
lnULIUUrban land intensive use39761.9610.4460.2503.630
lnTITechnology innovation39767.0591.8131.38612.387
lnWEAPer capita wealth39769.8200.2378.79512.111
lnPEOPopulation density39766.4370.9412.5229.345
lnINVInvestment397614.8121.24210.58119.076
lnFINFinancial scale397610.4050.7568.24513.309
lnOPENDegree of openness39766.5321.564−1.93110.507
lnINSIndustrial structure39764.5310.0853.7224.908
lnGOVGovernment intervention degree39762.8410.5591.4496.403
lnURBUrbanization level39763.8920.3162.7264.605
Table 3. Correlation matrix of variables.
lnULIUlnTIlnWEAlnPEOlnASSlnFINlnFDIlnINSlnGOVlnURB
lnULIU1
lnTI0.5901
lnWEA0.4940.5501
lnPEO0.3000.4350.1271
lnASS0.5580.7260.4930.3711
lnFIN0.7360.6160.6510.3060.5561
lnFDI0.4360.4880.3030.3780.5170.4311
lnINS0.5630.3540.3530.3830.3730.5690.3021
lnGOV−0.335−0.180−0.135−0.383−0.211−0.308−0.314−0.2841
lnURB0.6020.6060.5050.1490.6230.6300.3870.407−0.2521
Table 4. Estimation results of the benchmark model.
(1)(2)(3)(4)(5)
lnTI0.0245 ***0.0485 ***−0.00040.0141 **0.0393 ***
(0.0040)(0.0052)(0.0042)(0.0068)(0.0047)
lnWEA−0.252 ***−0.0104−0.258 ***−0.0356−0.0464 **
(0.0212)(0.0246)(0.0205)(0.0240)(0.0233)
lnPEO−0.0273 ***0.0184 *−0.0208 ***0.0360 ***0.00161
(0.0050)(0.0111)(0.0048)(0.0106)(0.0080)
lnINV0.0205 ***0.0162 ***0.0109 **0.0130 **0.0162 ***
(0.0055)(0.0061)(0.0054)(0.0062)(0.0059)
lnFIN0.418 ***0.320 ***0.447 ***0.342 ***0.356 ***
(0.0081)(0.0135)(0.0081)(0.0134)(0.0111)
lnOPEN0.0099 ***0.0063 **0.0163 ***0.0137 ***0.0062 **
(0.0028)(0.0028)(0.0027)(0.0027)(0.0027)
lnINS0.627 ***0.08420.544 ***0.143 **0.185 ***
(0.0546)(0.0662)(0.0528)(0.0634)(0.0624)
lnGOV−0.0538 ***−0.0235 ***−0.137 ***−0.0464 ***−0.0317 ***
(0.0074)(0.0088)(0.0103)(0.0126)(0.0078)
lnURB0.0800 ***0.01160.0264−0.02990.0727 ***
(0.0170)(0.0335)(0.0167)(0.0322)(0.0270)
Constant−3.279 ***−2.365 ***−2.467 ***−2.207 ***−2.884 ***
(0.275)(0.349)(0.272)(0.342)(0.316)
F test 15.85 *** 16.37 ***3195.50 ***
Hausman test 89.24 ***38.55 **88.64 ***
LM test 5766.25 ***
Year test 27.44 ***
R20.7400.3290.7510.3990.326
N39763976397639763976
Notes: Standard errors in parentheses; *** p < 0.01, ** p < 0.05, * p < 0.1. Same in the remaining tables.
Table 5. Global Moran’s I.
W1Z ValueW2Z Value
20060.081 ***16.4140.419 ***14.015
20070.061 ***12.4480.498 ***16.573
20080.059 ***12.1740.438 ***14.574
20090.065 ***13.2840.421 ***14.107
20100.063 ***12.9240.411 ***13.691
20110.061 ***12.6000.482 ***16.061
20120.058 ***11.9450.481 ***16.013
20130.062 ***12.6890.462 ***15.377
20140.056 ***11.5720.457 ***15.211
20150.048 ***9.9060.437 ***14.536
20160.055 ***11.3240.421 ***14.027
20170.058 ***12.0210.427 ***14.218
20180.059 ***12.1160.433 ***14.425
20190.053 ***10.9840.425 ***14.157
*** p < 0.01.
Table 6. Estimation results of spatial correlation tests for region and time dual fixed effects model.
W1W2
(1)(2)
LM-sar12.254 ***20.366 ***
Robust LM-sar18.522 ***18.091 ***
LM-err5.190 *12.141 ***
Robust LM-err12.051 ***8.267 ***
*** p < 0.01, * p < 0.1.
Table 7. Estimation results of the spatial econometric model.
W1W2
(1)(2)(3)(4)
SARSEMSARSEM
lnTI0.0127 *0.0115 *0.0137 **0.0138 **
(0.0065)(0.0068)(0.0065)(0.0065)
lnWEA−0.0343−0.0360−0.0355−0.0293
(0.0231)(0.0231)(0.0230)(0.0231)
lnPEO0.0350 ***0.0335 ***0.0351 ***0.0362 ***
(0.0102)(0.0102)(0.0101)(0.0101)
lnINV0.0121 **0.0110 *0.0127 **0.0129 **
(0.0060)(0.0061)(0.0060)(0.0060)
lnFIN0.343 ***0.347 ***0.342 ***0.344 ***
(0.0129)(0.0130)(0.0129)(0.0129)
lnOPEN0.0136 ***0.0138 ***0.0139 ***0.0144 ***
(0.0026)(0.0026)(0.0026)(0.0026)
lnINS0.144 **0.149 **0.142 **0.154 **
(0.0608)(0.0610)(0.0607)(0.0608)
lnGOV−0.0439 ***−0.0422 ***−0.0475 ***−0.0475 ***
(0.0121)(0.0123)(0.0121)(0.0122)
lnURB−0.0355−0.0294−0.0332−0.0264
(0.0309)(0.0315)(0.0308)(0.0310)
Spatial rho0.270 ** 0.0943 ***
(0.120) (0.0271)
Spatial lambda 0.411 *** 0.128 ***
(0.110) (0.0281)
Hausman test25.21 ***22.30 ***114.36 ***102.15 ***
Time fixed effectYesYesYesYes
City fixed effectYesYesYesYes
R20.7110.7130.7190.711
N3976397639763976
*** p < 0.01, ** p < 0.05, * p < 0.1.
Table 8. Estimation results of robustness test.
W1W2
(1)(2)(3)(4)
lnTI0.0583 ***0.0312 ***0.0589 ***0.0310 ***
(0.0064)(0.0070)(0.0063)(0.0071)
lnWEA−0.02870.0441 *−0.02950.0409
(0.0229)(0.0249)(0.0228)(0.0250)
lnPEO0.0255 **−0.0663 ***0.0253 **−0.0688 ***
(0.0101)(0.0110)(0.0101)(0.0110)
lnINV0.0102 *−0.0550 ***0.0106 *−0.0546 ***
(0.0059)(0.0064)(0.0059)(0.0065)
lnFIN0.303 ***−0.0295 **0.302 ***−0.0277 **
(0.0135)(0.0139)(0.0135)(0.0140)
lnOPEN0.0131 ***0.003040.0135 ***0.0028
(0.0026)(0.0028)(0.0026)(0.0028)
lnINS0.124 **0.965 ***0.122 **0.979 ***
(0.0602)(0.0657)(0.0602)(0.0658)
lnGOV−0.0453 ***−0.0628 ***−0.0480 ***−0.0647 ***
(0.0120)(0.0130)(0.0119)(0.0131)
lnURB−0.0682 **0.0262−0.0672 **0.0339
(0.0304)(0.0333)(0.0303)(0.0334)
Spatial rho0.18740.4835 ***0.0921 ***0.0192
(0.1245)(0.0967)(0.0270)(0.0311)
Hausman test58.65 ***67.97 ***101.55 ***202.34 ***
Time fixed effectYesYesYesYes
City fixed effectYesYesYesYes
R20.7190.2490.7320.404
N3976397639763976
*** p < 0.01, ** p < 0.05, * p < 0.1.
Table 9. Heterogeneity analysis (Geographical distribution).
W1W2
Eastern RegionCentral RegionWestern RegionEastern RegionCentral RegionWestern Region
lnTI0.0293 **0.0033−0.00420.0300 **0.0033−0.0040
(0.0122)(0.0090)(0.0141)(0.0123)(0.0089)(0.0141)
lnWEA0.0457−0.0121−0.101 **0.0412−0.0151−0.0986 **
(0.0450)(0.0322)(0.0432)(0.0450)(0.0319)(0.0433)
lnPEO0.112 ***0.0314 *−0.0593 ***0.116 ***0.0316 *−0.0596 ***
(0.0147)(0.0178)(0.0219)(0.0146)(0.0177)(0.0220)
lnINV0.0316 ***0.0321 ***−0.01880.0346 ***0.0318 ***−0.0174
(0.0105)(0.0096)(0.0115)(0.0104)(0.0095)(0.0115)
lnFIN0.282 ***0.436 ***0.320 ***0.280 ***0.437 ***0.322 ***
(0.0207)(0.0234)(0.0248)(0.0207)(0.0233)(0.0249)
lnOPEN0.0236 ***−0.00220.0204 ***0.0234 ***−0.00200.0206 ***
(0.0047)(0.0040)(0.0050)(0.0047)(0.0040)(0.0050)
lnINS0.129−0.06770.306 ***0.139−0.07990.317 ***
(0.0844)(0.128)(0.115)(0.0846)(0.127)(0.115)
lnGOV−0.0185−0.0187−0.0757 ***−0.0205−0.0209−0.0718 ***
(0.0194)(0.0169)(0.0278)(0.0195)(0.0169)(0.0278)
lnURB−0.155 **−0.0085−0.0941−0.162 **−0.0109−0.0966
(0.0663)(0.0424)(0.0611)(0.0664)(0.0417)(0.0613)
Spatial rho0.274 ***−0.0136−0.403 **0.05270.0878 **0.0533
(0.103)(0.139)(0.180)(0.0431)(0.0386)(0.0430)
Time fixed effectYesYesYesYesYesYes
City fixed effectYesYesYesYesYesYes
R20.6520.6500.6570.6540.6650.661
N140014001176140014001176
*** p < 0.01, ** p < 0.05, * p < 0.1.
Table 10. Heterogeneity analysis (Natural resource endowment).
W1W2
Resource-Based CitiesNon-Resource-Based CitiesResource-Based CitiesNon-Resource-Based Cities
lnTI10.0887 ***0.0294 ***0.0980 ***0.0291 ***
(0.0097)(0.0085)(0.0097)(0.0085)
lnWEA−0.1070 ***−0.0075−0.102 ***−0.0116
(0.0383)(0.0283)(0.0385)(0.0282)
lnPEO0.0415 ***0.0495 ***0.0419 ***0.0499 ***
(0.0157)(0.0134)(0.0158)(0.0133)
lnINV0.0267 ***0.005270.0249 **0.00595
(0.0098)(0.0072)(0.0098)(0.0071)
lnFIN0.4120 ***0.2970 ***0.4120 ***0.2940 ***
(0.0226)(0.0156)(0.0227)(0.0155)
lnOPEN0.0214 ***0.0086 **0.0213 ***0.0090 ***
(0.0040)(0.0034)(0.0045)(0.0034)
lnINS0.21000.1320 **0.2230 *0.1230 *
(0.128)(0.0664)(0.129)(0.0661)
lnGOV0.0129 *0.00490.0133 *0.0049
(0.0073)(0.0059)(0.0073)(0.0059)
lnURB0.0256 *−0.0182 *0.0241 *−0.0192 *
(0.0141)(0.0101)(0.0142)(0.0100)
Spatial rho−0.4230 ***0.2840 **−0.03810.1700 ***
(0.163)(0.115)(0.0452)(0.0348)
Time fixed effectYesYesYesYes
City fixed effectYesYesYesYes
R20.6000.7420.5900.758
N1582239415822394
*** p < 0.01, ** p < 0.05, * p < 0.1.
Table 11. Heterogeneity analysis (Technological type).
W1W2
General Technology InnovationGreen Technology InnovationGeneral Technology InnovationGreen Technology Innovation
lnTI10.0119 * 0.0128 **
(0.0064) (0.0063)
lnTI2 0.0126 ** 0.0135 **
(0.0055) (0.0054)
lnWEA−0.0343−0.0343−0.0355−0.0355
(0.0231)(0.0231)(0.0230)(0.0230)
lnPEO0.0351 ***0.0352 ***0.0351 ***0.0353 ***
(0.0102)(0.0102)(0.0101)(0.0101)
lnINV0.0121 **0.0126 **0.0127 **0.0132 **
(0.0060)(0.0059)(0.0060)(0.0059)
lnFIN0.343 ***0.344 ***0.342 ***0.343 ***
(0.0129)(0.0129)(0.0129)(0.0129)
lnOPEN0.0136 ***0.0137 ***0.0139 ***0.0141 ***
(0.0026)(0.0026)(0.0026)(0.0026)
lnINS0.144 **0.144 **0.141 **0.142 **
(0.0608)(0.0608)(0.0607)(0.0607)
lnGOV−0.0442 ***−0.0428 ***−0.0477 ***−0.0463 ***
(0.0121)(0.0121)(0.0121)(0.0121)
lnURB−0.0350−0.0347−0.0326−0.0322
(0.0309)(0.0307)(0.0308)(0.0306)
Spatial rho0.271 **0.271 **0.0942 ***0.0953 ***
(0.120)(0.120)(0.0271)(0.0271)
Time fixed effectYesYesYesYes
City fixed effectYesYesYesYes
R20.7100.7120.7190.721
N3976397639763976
*** p < 0.01, ** p < 0.05, * p < 0.1.
Disclaimer/Publisher’s Note: The statements, opinions and data contained in all publications are solely those of the individual author(s) and contributor(s) and not of MDPI and/or the editor(s). MDPI and/or the editor(s) disclaim responsibility for any injury to people or property resulting from any ideas, methods, instructions or products referred to in the content.

