Article

Analyzing Interdependencies among Influencing Factors in Smart Manufacturing

by
Fawaz M. Abdullah
1,2,*,
Abdulrahman M. Al-Ahmari
1,2 and
Saqib Anwar
1
1
Industrial Engineering Department, College of Engineering, King Saud University, P.O. Box 800, Riyadh 11421, Saudi Arabia
2
Raytheon Chair for Systems Engineering (RCSE Chair), King Saud University, P.O. Box 800, Riyadh 11421, Saudi Arabia
*
Author to whom correspondence should be addressed.
Sustainability 2023, 15(4), 3864; https://doi.org/10.3390/su15043864
Submission received: 10 January 2023 / Revised: 11 February 2023 / Accepted: 17 February 2023 / Published: 20 February 2023
(This article belongs to the Special Issue Artificial Intelligence Applications for Industry 4.0)

Abstract

:
The manufacturing industry has grown increasingly computerized and complex. Such changes are brought about mainly by adopting Industry 4.0 (I4) technologies. I4.0 promises a future of mass-producing highly individualized goods via responsive, autonomous, and cost-effective manufacturing operations. Adopting I4.0 technologies significantly improves a company’s productivity, efficiency, effectiveness, innovation, sustainable management, and sustainability. As is well known, implementing I4.0 technologies results in smart and sustainable manufacturing outputs. Despite their significance, I4.0 technologies have received less attention in the literature, and their influence on MSOs is unknown. This study analyzes the factors influencing manufacturing strategy outputs (MSOs), adopting I4.0 technologies using the fuzzy DEMATEL method. This research utilizes the fuzzy DEMATEL method to address the vagueness and uncertainties inherent in human judgments. Furthermore, this method is utilized to determine the cause-and-effect relationship and analyze the interdependence of factors. It explores the interrelationships among MSO factors from the perspectives of academic and industry experts. Identifying cause-and-effect aspects boosts the market’s competitiveness and prioritizes them. The results demonstrated that cost, quality, and performance are the most influential factors on MSOs.

1. Introduction

Manufacturing is currently transitioning from mass production to customization. Technological advancements have led to paradigm shifts known as industrial revolutions throughout history. Water and steam-powered mechanical manufacturing facilities were introduced during the First Industrial Revolution. The separation of labor and mass production was introduced with electricity (the Second Industrial Revolution). Developing electronic and information technology systems and manufacturing automation characterized third industrial revolution. The fourth industrial revolution is characterized by the growth of the Internet of Things (IoT) [1,2]. Over the last 200 years of human history, the rate at which operations have been revolutionized has increased. With each industrial revolution, the complexity and productivity of production has increased.
Different manufacturing techniques have evolved to simplify life, especially technology that allows for precision, customization, and rapid production. Consumers are increasingly demanding customized products over traditional standardized products. To satisfy customers’ diverse and highly customized product requirements, manufacturing companies have made huge investments in enhancing their manufacturing systems’ flexibility, intelligence, and responsiveness. Modern manufacturing systems are characterized by their intelligence [3], interactivity [4], interconnected nature, and ecological sustainability, among other characteristics. Consequently, a new industrial revolution termed “I4.0” is gathering traction, with the promise of mass customization at low mass-production costs [5].
I4.0 is a paradigm-shifting wave that enables companies to respond quickly and efficiently to customer demands. I4.0 came to public attention in 2011 when academics and practitioners launched a venture called “I4.0,” intending to increase the competitiveness of the manufacturing industry [6]. It began efficiently meeting customer requirements; designers refer to this idea as the “flexible integration of the global value chain” [7,8]. I4.0 promotes industrial flexibility and product customization via automation and data sharing in various contexts, hence aiding in the digitalization of manufacturing [9]. According to the research conducted thus far, the I4.0 technologies are illustrated in Figure 1 [10,11,12,13,14]. I4.0 and MSOs must be appropriately aligned to improve overall production and performance.
Manufacturing strategies (MSs) are long-term plans for utilizing manufacturing system resources to achieve organizational goals [15]. The MS is a strategy established to obtain optimal outcomes while maintaining an appropriate balance between different desired outcomes. Implementing an MS entails aligning manufacturing goals with business objectives to boost the manufacturing output [15]. Top management should ensure that all manufacturing policies are designed with, or support, the corporate strategy [16]. Manufacturing has become a critical competitive differentiator that establishes a company’s identity in the market [
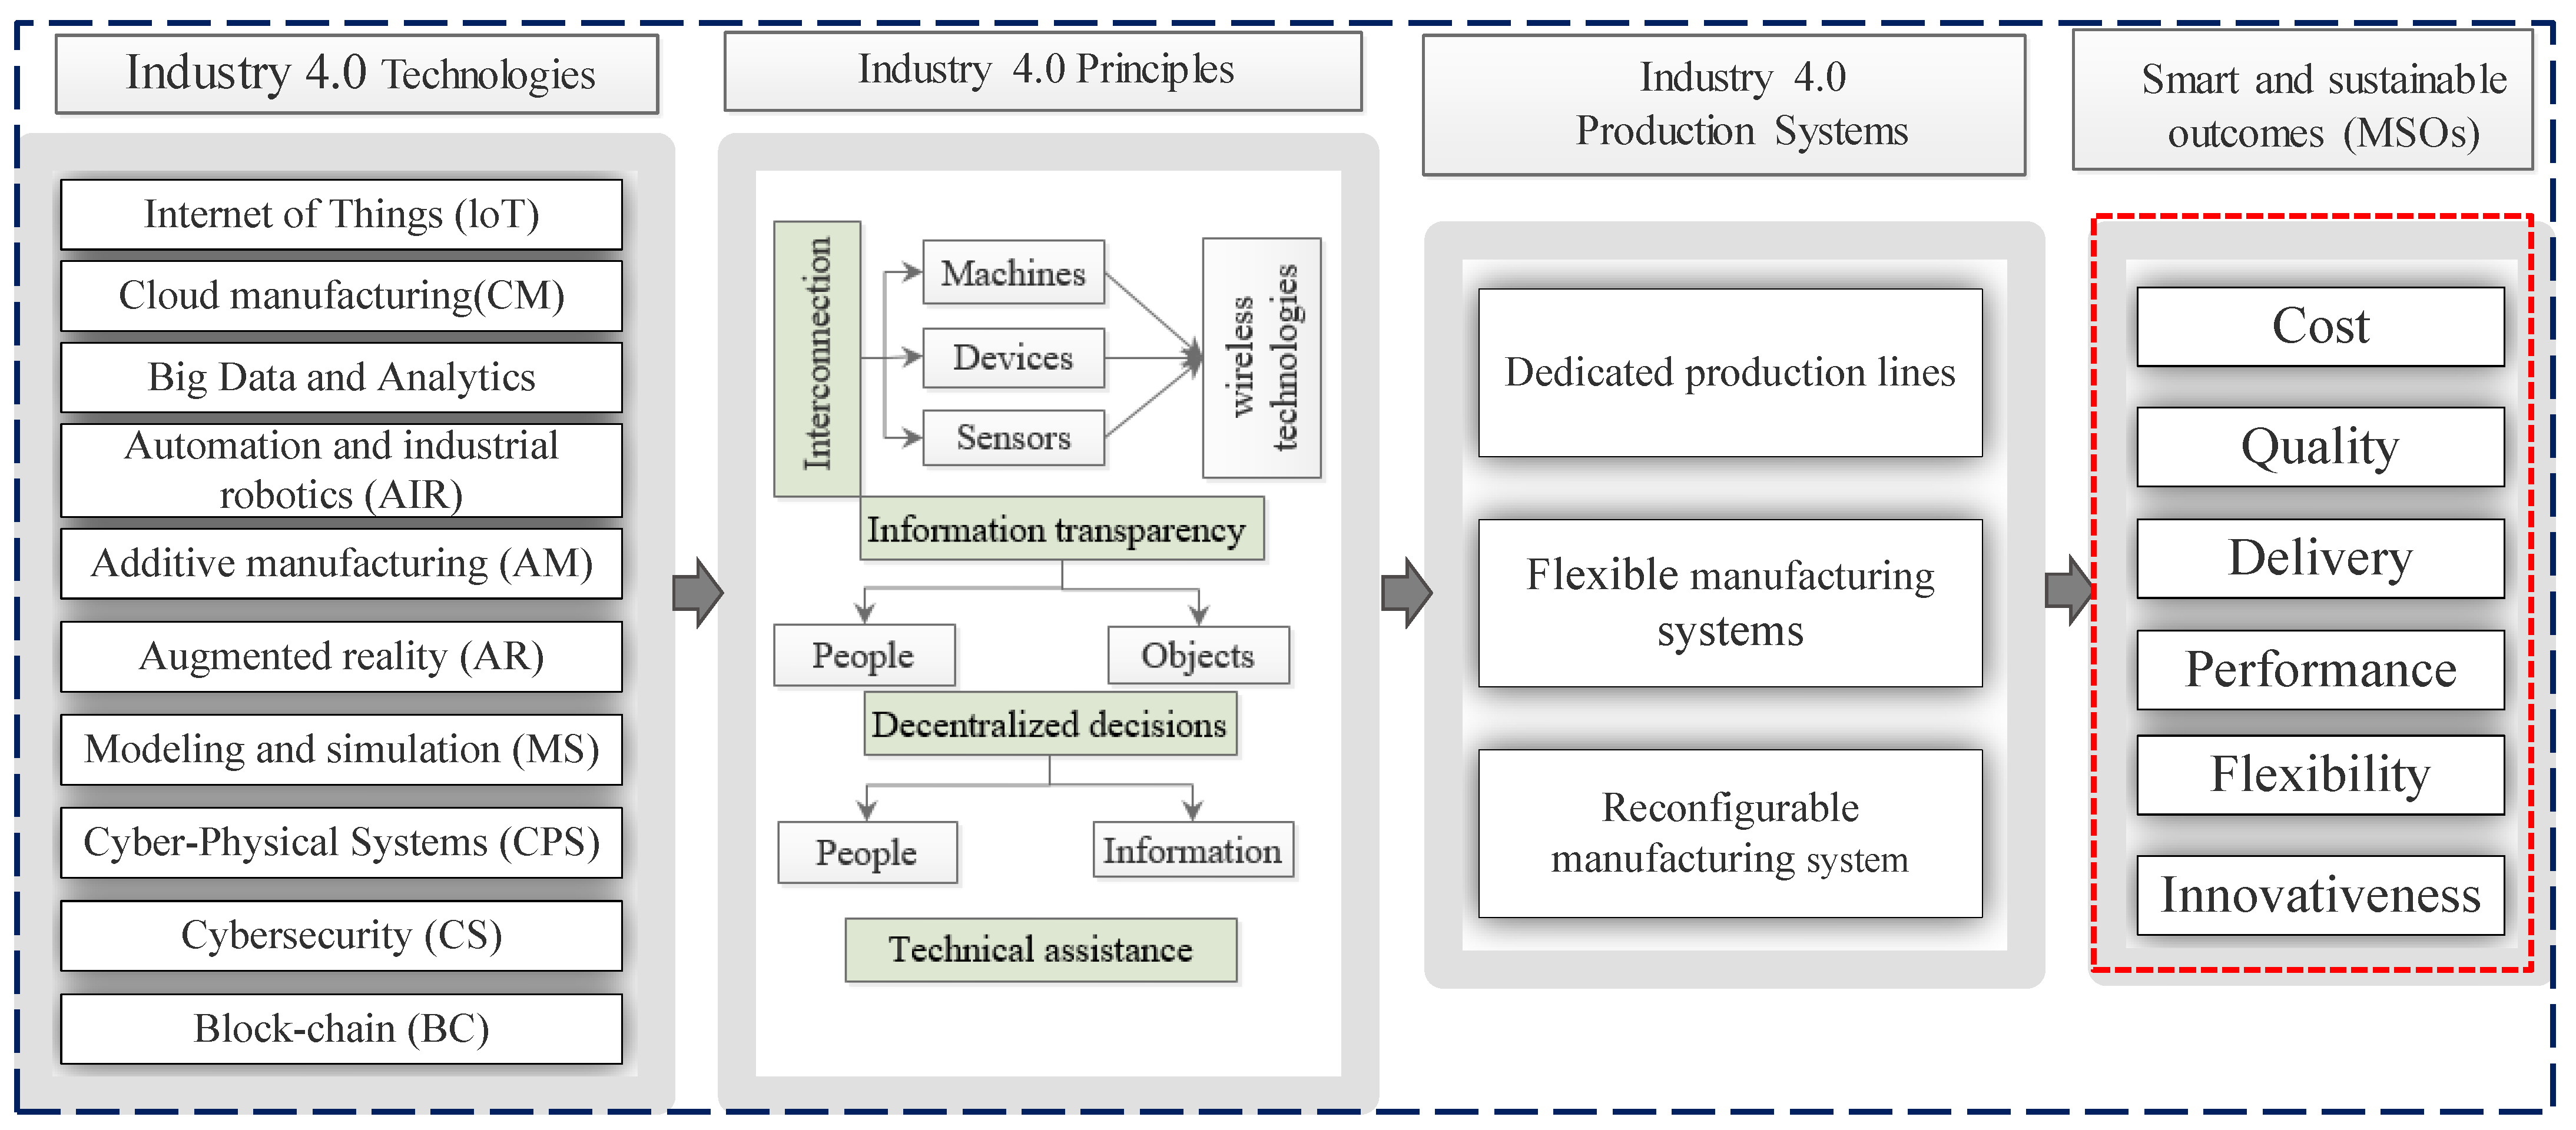
17]. I4.0 is a modern industrial system driven by information technology (IT) and by the aim of attaining a sustainable society. I4.0 has delivered new production technologies that maximize output and resource use. To acquire a holistic idea, the appropriate I4.0 technologies and principles, the production systems, i.e., the raw materials, energy, and information needed to turn inputs into outputs to obtain intelligent and sustainable products, are required, as shown in Figure 1.
MSOs are also known as competing priorities. This refers to the different dimensions or outputs of a firm’s production system needed to meet the demands of the markets they wish to compete in [17,18,19]. MSOs relate to a company’s capability to compete in global markets by offering customers superior products and services [20,21]. These outputs lead to environmental sustainability and protection. Cost, delivery, flexibility, lead time/delivery, and quality are all factors that affect a competitive advantage [16]. As a result, manufacturing has recently gained popularity in terms of enhancing a company’s competitiveness through the effective management of long-term strategic decisions. Manufacturing has evolved into a strategic differentiator for businesses [22]. Manufacturing strategies are implemented systematically, beginning with strategy formulation and ending with the company’s performance [23]. Figure 1 displays the sustainable and smart MSOs based on previous studies [24,25,26,27].
Due to advancements in processing power, machine intelligence, sensor miniaturization, and data storage and transmission, intelligent machines and products are now feasible. MSOs must be data-driven and instantaneous in order to respond quickly to changing consumer demands. Therefore, I4.0 responds quickly to customer needs while also being incredibly efficient [7,8]. The total manufacturing performance can be improved by properly aligning I4.0 technologies and long-term strategic goals in all of these areas [28]. Several firms have already implemented I4.0, including BMW, Jaguar Land Rover, Rolls-Royce, General Electric, and Philips. Nestlé has been heavily active in Germany’s I4.0 initiative to improve efficiency, minimize the environmental impact of packaging waste, and increase production via digitalization [29]. Hosseini, S. M. and Peer, A. [30] identifyedidentified the opportunities of automated decision-making in wood processing by implementing I4.0 technologies such as, including automation. I4.0 implementation must be transdisciplinary and deeply interconnected across various essential disciplines.
Several studies have clarified the importance of applying I4.0 techniques to MSOs. Italy has incorporated I4.0 technologies (Big data analytics, Digital supply chain, Internet of things (IoT), Cloud Computing, Robotics, 3D printing, and Automated Guided) in order to boost cost, performance, and innovation [31]. May and Kiritsis [32] utilized Industry 4.0 technologies to eliminate errors in production lines, thus increasing efficiency, profitability, product quality, customer happiness, competitiveness, and sustainability. Tortorella and Fettermann [33] utilized I4.0 technologies, such as 3D printing, virtual model simulation/analysis, BD, cloud service, IoT, and so on, to improve MSO quality and performance. Ghobakhloo [11] provides an alternative framework that academics and practitioners can use to construct a complete strategic plan. This will provide a smooth transition from conventional production to I4.0, resulting in an enhanced overall performance. Ghobakhloo and Fathi [34] described the I4.0 technologies used to build lean-digitized production processes that increase sustainable competitiveness. Mittal Sameer et al. [35] presented the development of an I4.0 maturity model for small and medium-sized businesses (SMEs) that more accurately reflects the reality of industrial implementation challenges. Nouinou Hajar et al. [36] identified the views that can guide future research into how digital technologies and I4.0 affect decision-making.
As manufacturing becomes more complex, manufacturers are increasingly interested in effective decision-making. Multiple Criteria Decision Making (MCDM) is a well-known and commonly utilized methodology for analyzing multiple conflicting criteria [37]. MCDM is a decision-making technique that is widely used in industrial organizations. The quality of decisions can be enhanced through MCDM methods by making the decision-making process more rational and practical [38]. DEMATEL is used to establish a causal relationship between dependent variables. This method makes it easier for researchers to build a model to assess how complex components interact [39]. Their relative rankings demonstrate the strength of the relationships between these factors. Along with identifying the interdependencies between factors, the DEMATEL can also determine their relative relationships and solve complex problems [40].
An organization’s productivity, efficiency, effectiveness, innovation, sustainable management, and sustainable manufacturing outputs are all greatly improved by adopting I4.0 technologies. Sustainable manufacturing incorporates practices at all production levels, including product, process, and system. It is expanded to include additional R’s, including reducing, reusing, recovering, recycling, redesigning, repurposing, remanufacturing, and refurbishing. Organizations that go green or reduce their environmental impact become more competitive, save money, set themselves apart from the competition, and are better prepared for future regulations due to the trend toward sustainability in smart manufacturing. As customers, employees, and business partners become more aware of the manufacturing industry, it becomes increasingly important for manufacturers to implement sustainable practices. Productivity increases typically result in lower production costs, more profits, and enhanced market competitiveness, all of which contribute to lower prices and greater sustainability [41,42,43]. Processes utilizing 4.0 technologies enable organizations to achieve sustainable outcomes. Sustainability related to I4.0 terminology provides a practical starting point for companies worldwide to improve the efficiency of their production processes and products, thereby contributing to sustainable development and green growth [44].
DEMATEL discovers realistic solutions, specific difficulties, and, most crucially, complex problem clusters [45,46]. Human judgments regarding the interactions between components are often replaced with precise numbers when DEMATEL is utilized. Therefore, accurate values are often inadequate in the real world [47]. In order to account for the reality that people’s opinions are often ambiguous and impossible to quantify quantitatively, the use of fuzzy logic terms is essential. This research uses fuzzy set theory and the DEMATEL approach to tackle the problems of ambiguity and knowledge loss in human judgment [48]. In addition, the main benefit of fuzzy DEMATEL is that it can handle ambiguity and uncertainty [49].
This method transforms interdependency interactions into a group of cause-and-effect relationships using matrices, and identifies the critical aspects of a complex structure system using an impact relation diagram. The DEMATEL can confirm interdependence among elements, assist in developing a map that reflects their relative relationships, and can be used to investigate and solve complex and interconnected problems. The DEMATEL has been expanded due to its benefits and ability to improve decision-making in various situations, since many real-world systems contain imperfect and ambiguous information. Previous research indicates that all MCDM methods have certain advantages and disadvantages. However, the DEMATEL methodology is more widely used for the following reasons [50,51,52,53,54,55]:
It visualizes system interconnectedness with causal diagrams.
Defines the critical influences on the phenomenon within the complex structure.
It requires fewer sample data and has greater flexibility in pattern recognition.
It is confident in its ability to provide potential outcomes with the lowest quantity of data.
Unlike other methods, such as interpretive structural modeling (ISM), it permits extensive diversity in the relationships between factors.
Compared with AHP, DEMATEL provides many directional relationships, whereas AHP has only a unidirectional relationship and multiple independent matrices that require integration.
Due to the limited and planned resources, including static routing, the lack of linkage, autonomous control, and isolated information, the traditional production system is insufficient to maintain the company’s competitiveness. Moreover, today’s market competitiveness is rapidly evolving due to globalization and other sociological, technological, and economic variables. As a result of globalization, firms must now struggle with a more complicated and competitive marketplace, an unpredictable and riskier trading market, and shifting consumer expectations. Organizations must prioritize the implementation of I4.0 technologies in order to be competitive on the market. The deep integration of digitalization and the overall economy has become a critical strategy for boosting the competitiveness and high-quality growth of the manufacturing production mode [56,57]. Furthermore, it is worth mentioning that the previously reported studies regarding the factors that influence MSOs in adopting I4.0 technologies are merely consider one or two output factors. The DEMATEL methodology has not been applied in prior articles to analyze the impact of I4.0 technologies on MSOs.
This research investigates the factors that influence MSOs’ adoption of I4.0 technologies. The proposed model used the MCDM approach to determine the interrelationships between factors. This study employs DEMATEL to identify the underlying causes and effects of MSOs. Utilizing expert opinion, the interrelationships between these root causes are proposed. The fuzzy DEMATEL approach considers the uncertainty in expert opinions to determine which enhancements should be prioritized. Expertise and interconnections amongst MSOs allow for developing an optimal strategic road plan. The novelty of the proposed strategic road map is that it enables the managers to use it per the manufacturer’s goal and objective. According to the literature review and expert opinions, the research defines and classifies the MSOs concerning I4.0 technologies. The proposed approach analyzed the root cause–effect of factors influencing the MSOs adopting I4.0 technologies, which helps managers make better decisions and improve market competitiveness. This method also allows researchers and manufacturers to understand how MSOs are prioritized by explaining the system’s structure and determining the most critical factors.
The structure of this research is as follows: The theoretical background is discussed in Section 2. The third section discusses the methods used to pick experts, collect data, and identify factors influencing MSOs adopting I4.0 technologies. The results and discussion are included in Section 4. In Section 5, implications are discussed. The conclusions and suggested further study are presented in Section 6.

2. Theoretical Background

MSOs are manufacturing strategies that maximize productivity while balancing several potential sources of success, all to implement the manufacturing strategy of any organization. MSOs were developed based on a comprehensive review of the relevant literature and consultation with academic and industry practitioners. As reported by previous studies, the outputs of MSOs are illustrated in Figure 2 [13]. Thus, this article aims to identify the factors influencing MSOs’ adoption of I4.0 technologies. MSOs are described as follows:
Cost (C): Offer competitive pricing with low overall costs. The objective of a cost strategy is to gain a competitive edge by reducing the expenses of service, sales, and marketing. Organizations can achieve a competitive edge on a broad basis by implementing effective and appropriate technologies for reducing the cost of human resources and minimizing costs through using less expensive raw materials, mass production, and distribution [58].
Quality (Q): Maintaining customer satisfaction while establishing rigorous quality control, supervision, and standards [59,60]. Quality is a crucial strategy in a company’s struggle to differentiate itself from competitors. The essence of quality is that it adds value to the customer’s experience, and benefit is one of the factors that contributes to competitive advantage [61]. Consequently, in today’s competitive market, quality has become a crucial metric [62].
Delivery (D): The time needed to collect and deliver a customer’s order. In addition, it can give reduce lead times throughout the supply chain, including transportation, production, and design [63]. On-time deliveries result in satisfied customers. Receiving their goods on time will please them. Some goods have an expiration date, so delivery deadlines may be strict. On-time or speed deliveries have a significant competitive advantage [64].
Flexibility (F): The ability to quickly respond to customer demands by personalizing goods and services, and increasing or decreasing product numbers [60,63]. Flexibility refers to a manufacturing system’s ability to adapt cost-effectively and rapidly to changing production requirements and needs. This capability is becoming increasingly critical for designing and operating manufacturing systems in highly variable and unpredictable environments.
Performance (P): The characteristics of a product that enable it to perform tasks that other goods cannot [60,65]. The manufacturing performance of a company is defined by its capacity to convert production or manufacturing expenditures into volume and performance. Competitiveness is a result of superior manufacturing performance [45].
Innovativeness (I): The ability to introduce or modify new products [60]. Innovation is the application of knowledge, creativity, and initiative to obtain higher or different values from resources, encompassing the processes that develop and convert new ideas into valuable goods. Innovation occurs regularly in business when a company’s thoughts are applied to satisfy further its customers’ requirements and expectations [66].
According to the reported studies [10,11,12,13,14], the I4.0 technologies are illustrated in Figure 2. I4.0 technologies are described as follows:
Internet of things (loT): The Internet of Things enables physical objects to communicate with each other, share data, and coordinate decisions [66,67]. It forms a network of Things to Things and humans to humans. The IoT uses, within manufacturing systems, a reduction in the product recall size, the early discovery of defective items, design modifications, and the improvement of product performance.
Cloud manufacturing (CM): A paradigm of conducting business based on sharing cloud-based manufacturing resources and capabilities. The cloud-based software, web-based management dashboard, and cloud-based collaboration that make up cloud manufacturing make it ideal for modern manufacturers. Distributed manufacturing resources can be combined to create a scalable platform, even if they are located at different locations. [68].
Big Data and Analytics (BD): It is defined as massive collections of heterogeneous data, arriving from a variety of sources, in a variety of formats, and moving in real-time [69]. This technology and system show how businesses can profit from discovering, processing, and analyzing massive volumes of diverse data to obtain an economic advantage [70].
Automation and industrial robotics (AIR): AIR is undoubtedly on the rise, particularly in industry and, increasingly, in everyday life [11]. Manufacturing processes and services in fast-expanding sectors (such as electronics, food, logistics, and the life sciences) will necessitate using cutting-edge robot technology (gluing, coating, laser-based processes, precision assembly, and fiber material processing).
Additive manufacturing (AM): AM is the process of joining materials to create objects from three-dimensional (3D) model data, typically layer by layer [71,72,73,74]. It lowers waste and simplifies production processes, mass customization, and on-demand production. In addition, it improves supply chain flexibility by manufacturing near the end-user.
Augmented reality (AR): AR is an up-and-coming technique for visualizing computer visuals in real-world settings [75]. Augmented reality improves human performance by providing the knowledge needed for a specific task [76]. Workers’ productivity, efficiency, and safety can all be enhanced with the use of industrial augmented reality (AR), which uses specialized goggles, glasses, or smartphone apps to superimpose digital information on top of the plant worker’s real-world view.
Modeling and simulation (MS): Modeling and simulation technologies aim to simplify the design, implementation, testing, and real-time control of a manufacturing system [77]. Modeling and simulation benefits are minimizing costs, reducing development time, and improving product quality.
Cyber-Physical Systems (CPSs): CPSs are “systems of cooperating computational entities closely connected to the real world and its activities, supplying and consuming internet-based data-access and data-processing services” [78]. The distributed manufacturing systems that CPSs enable offer several beneficial attributes, including increased effectiveness and greater manufacturing flexibility [79].
Cybersecurity (CS): With the addition of cyber, CS becomes a novel paradigm for highly secure information systems applicable across the entire IoT ecosystem in manufacturing. The term “cybersecurity” (CS) refers to the collection of tools used to prevent, detect, and recover from cyber-attacks [79]. CS technology can be used to detect threats and keep data safe.
Block-chain (BC): BC is a technology that facilitates a transparent and decentralized financial transaction platform for a given industry. BC technology’s characteristics are its stability, modifiability, transparency, and process integrity [80]. BC technology can be used to transfer any digital knowledge. Design, manufacturing, banking, supply chain, and social applications are just some of the many that have embraced BC [80].
Figure 2. The influencing factors of MSOs in the adoption of I4.0 technologies.
Sustainability 15 03864 g002

3. Research Methodology

Research in this study followed a similar methodology to [81]. This analysis was conducted by experts with extensive background knowledge. Experts have at least ten years of experience in academia, industry, or both, as recommended by [82]. The target respondents are CEOs, general managers, department heads, specialized engineers, academics, and professional experts of experience in manufacturing strategies related to industrial organizations, emphasizing MSOs. Experts in the field should know a great deal about different manufacturing systems. A working understanding of I4.0 technologies, gained via experience or study, is also recommended for experts [82]. Most of the manufacturing industry professionals consulted for this study were employed in positions related to I4.0 technologies. They manage marketing or production and operations, so they know what works in the manufacturing industry. Due to these specialists’ production or consulting experience, the questionnaire data are reliable. Academic experts were chosen from academics and Doctorates who have published publications on MS and I4.0. The selected academic experts are highly influential. To explain the research, experts were interviewed in person and online. In the study, 30 experts matched the criterion. Twenty experts responded to the email describing the study’s goals and verifying their participation. Only 16 experts completed the surveys. This research determines the factors influencing MSOs to adopt I 4.0 technologies, as shown in Figure 2.
The fuzzy DEMATEL method involves the collection of indicators implying the degree of influence and cause–effect relationship for each factor, as well as the creation of a causality map. To better solve problems, this method develops a causal diagram based on the relationships between factors, determines the center degree and cause degree of each factor, categorizes them (cause group or effect group), and finally selects the most important factors [83]. Figure 3 shows the general steps of the fuzzy DEMATEL approach.
The following steps represent the fuzzy DEMATEL method [48,84,85]:
Determining decision objectives, criteria, and a fuzzy scale.
Choosing experienced experts to conduct pairwise comparisons to determine the impact of different factors.
Creating a semantic assessment form that classifies factors into five categories (Table 1).
Initializing a direct impact matrix. Inviting experts to assess the factor’s direct relationship based on the semantic assessment table and constructing a direct effect matrix.
To deal with ambiguous human assessments, developing a fuzzy linguistic scale and transforming step 3′s direct impact into fuzzy triangular numbers, as shown in Table 1.
To generate the fuzzy direct-relation matrix Z K , where k is the number of experts, have the evaluators build fuzzy pairwise impact relationships between components in a n x n matrix. As can be seen in Figure 4, the triangular fuzzy number consists of a triple, with l representing the most pessimistic estimate and r representing the most optimistic estimate. The formula displays the membership function of a triangular fuzzy number (2). As can be seen in Figure 5, the membership function and fuzzy ratings are as follows:
Z k = C 1 C 2 C n 0 , 0 , 0 x k 12 x k 21 0 , 0 , 0 x k 1 n x k 2 n x k n 1 x k n 2 0 , 0 , 0
μ N   x = 0 ,   x < l x l m l   ,   l x m r x l m ,   m x r 0 ,   x > r
Table 1. The fuzzy scale [48].
Linguistic TermsSymbolCorresponding Triangular Fuzzy Numbers (TFNs)
No influenceNO(0, 0.1, 0.3)
Very low influenceVL(0.1, 0.3, 0.5)
Low influenceL(0.3, 0.5, 0.7)
High influenceH(0.5, 0.7, 0.9)
Very high influenceVH(0.7, 0.9, 1)
In the fuzzy triangular symbol, l stands for the left score, r for the right score, and m for the middle.
Figure 4. Triangular fuzzy number.
Sustainability 15 03864 g004
Figure 5. Fuzzy ratings and their membership function.
Sustainability 15 03864 g005
To achieve an overall score, the CSCF (converting fuzzy data to crisp score) approach is applied, which involves defuzzifying the fuzzy numbers and then calculating the weighted average of the left and right scores of the membership function. The strategy provides researchers with accurate data [86,87]. For a given fuzzy number range, the CFCS technique is used to calculate its ranges. A weighted average of the membership functions is used to determine the final score. A new direct effect starting matrix is generated for each population score. These are the steps, as follows:
Normalize the fuzzy triangular numbers:
x l k i j = l k i j m i n l k i j Δ m i n m a x
x m k i j = m k i j m i n l k i j Δ m i n m a x
x r k i j = r k i j m i n l k i j Δ m i n m a x ,
Δ m i n m a x = m a x r k i j m i n l k i j
Calculate the normalized values for the left score (ls) and right score (rs):
x l s k i j = x m k i j 1 + x m k i j x l k i j ,
x r s k i j = x r k i j 1 + x r k i j x m k i j
Calculate the crisp values:
x k i j = x l s k i j 1 x l s k i j + x r s k i j x r s k i j 1 x l k i j + x r s k i j
Calculate the expert k’s total crisp normalized values:
z k i j = m i n l k i j + x k i j Δ m i n m a x
Construct the direct relationship matrix by aggregating all experts’ normalized crisp values:
z i j = Z 1 i j + Z 2 i j + + Z n i j n
The initial direct influence matrix is utilized to build a standardized direct influence matrix X = x i j n n , and 0 ≤ x i j ≤ 1.
X = s   Z ,
s = 1 max 1 i n j = n m z i j   , i , j = 1 ,   2 , , n
Calculate the influence matrix   T = t i j n n . The element t i j indicates the indirect influence relationship of factors i and j. The influence matrix T represents the overall relationship between elements in terms of their impact. The matrix is calculated as follows:
T = lim m X 1 + X 2 + X 3 X m = X 1 X 1
Determine each factor’s influence, affect, center, and cause. Impact D i shows the cumulative influence of MSOs.
The   influence   degree :   D i = j = 1 n t i j
The affected degree R j   indicates the extent to which the other factors influence each factor in MSOs.
The   affected   degree :   R j = i = 1 n t i j
The center degree is R j + D i , which indicates the importance of factors in MSOs.
The   center   degree   = R j + D i | i = j
The cause degree is as follows:
When R j + D i   is positive, the factor belongs to the cause group.
When R j D i   is negative, the factor belongs to the effect group.
The   center   degree   = R j + D i | i = j ,  
A cause-and-effect relationship diagram is created: The cause-and-effect relationship diagram is completed by representing the datasets R j + D i and R j D i .

4. Results

Defining the decision objective by compiling relevant data and defining the goals for further developing the six MSOs criteria to examine the interrelationships of the criteria under the conditions of uncertainty was performed as the first step. The six criteria, including (C), (Q), (D), (F), (P), and (I), was evaluated. The relevance of each criterion was also calculated using the fuzzy DEMATEL method. This method used a survey format to demonstrate the interdependence of factors through FDEMATEL pairwise comparisons. The question “How much influence does each left-hand factor have on the right-hand factor?” was addressed for each option. In this instance, survey respondents utilized the five-point scale listed in Table 1 to respond. This method was also repeated until all comparisons had been made.
Then, Equations (1)–(3) were used to figure out the pairwise fuzzy judgments. Table 2 shows an example of a fuzzy direct-influence matrix. The normalized fuzzy direct-relation matrix derived from Equations (3)–(6) is presented in Table 3. Then, the linguistic data was transformed to a fuzzy linguistic scale to obtain the DEMATEL initial direct relation matrix, as shown in Table 4. The initial direct relation matrix was utilized to determine the crisp value of the MSOs criterion based on the fuzzy evaluation. Finally, the average influence matrix of all the experts on factors affecting MSOs was determined, as shown in Table 5. Based on the averaged normalized fuzzy direct-relation matrix, Figure 6 illustrates the interdependence and connections between MSOs. Figure 6 shows that cost has the most significant influence on quality, followed by innovativeness and performance. Cost has a moderate to low impact on other factors. In addition, Figure 6 illustrates the remaining interdependencies and associations. The causal diagram is shown in Figure 7. The six outputs can be separated into cause-and-effect groups. The evaluation factors’ performance (P), flexibility (F), and innovativeness (I) are divided into the cause criteria group, which should be focused on investing. In contrast, the effect criteria group includes cost (C), quality (Q), and delivery (D).

5. Implications

The following section discusses the theoretical implications of the factors influencing MSOs’ adoption of I4.0 technologies and the managerial implications of improving MSOs within organizations through the adoption of I4.0 technologies.

5.1. Theoretical Implications

MSOs are essential to motivating the entire organization to gain a competitive advantage. This paper answers the continuing argument by demonstrating how MSOs can benefit from the adoption of I4.0 technologies. To compete globally, I4.0 is being used as an advanced manufacturing technology. It refers to developing technologies and market needs for shorter lead times and the increasing individualization of products.
The literature reveals that decreasing manufacturing costs is one of the most critical factors in achieving market competitiveness [88]. This research demonstrates that cost is the most influential factor for MSOs. A competitive advantage can be obtained if the organization can develop cost leadership while considering other factors [89]. Organizations can achieve a broad competitive advantage by using effective and appropriate technologies to reduce the cost of human resources and limit expenses through using less expensive raw materials, mass production, and distribution.
I4.0 technologies raise productivity, customer satisfaction, and market competitiveness by boosting product quality and service delivery [90]. According to the findings of this study, quality is the second crucial factor in MSOs in order to achieve market competitiveness. To gain a competitive advantage, incorporating a higher level of service quality has become a strategic requirement for businesses and senior management worldwide. As a result, quality has evolved as a crucial measure of success in today’s competitive market. As a result, Table 6 shows that other enablers appear to be moderately important to MSOs in adopting I4 technologies.
Understanding the most common critical MSOs requires the rigorous consideration of their causes. However, effect factors are relatively easily influenced by other factors. Flexibility is the greatest cause factor that must be considered in order to keep the organization competitive with others. Flexibility in production increases production efficiency. Flexibility enables a degree of adaptability, making it able to respond to predictable and unpredicted market changes. According to the cause–effect relation diagram in Figure 7, cost was the highest affected factor among all the effect groups. Due to the limited and predetermined resources, including static routing, a lack of interconnection, independent control, and isolated data, a traditional production system cannot maintain the organization’s competitiveness. Consequently, shifting from conventional to intelligent manufacturing will mean that these firms can maintain competitiveness.

5.2. Managerial Implications

Organizations struggle to manage competing priorities and must make the right decisions while developing their criteria in a competitive market. It is critical to determine the degree to which a one-criterion practices influences another, and vice versa. As a result, the DEMATEL method is a practical approach capable of highlighting the most influential risk factors. The fuzzy DEMATEL method was used to identify the significant MSOs influenced by the adoption of I4.0 technology. This work proposed to establish a cause-and-effect model for MSOs’ adoption of I4.0 technologies (Smart manufacturing) by utilizing the fuzzy DEMATEL.
Among all the factors contributing to market competitiveness, cost is the most influential factor for MSOs, and the past literature supports this finding [18,88,91,92,93]. Effectively managing production costs, including overhead, training, and value-added costs, is evidence of lower costs. A cost-competitive advantage exists when a corporation can maximize consumer value by leveraging its skilled labor force, inexpensive raw materials, cost management, and efficient operations. As an industry develops its competitive strategy, cost advantage is critical. Organizations seek to increase their cost advantage by lowering the cost of their raw materials and rearranging their manufacturing and distribution processes. Manufacturing organizations strive to reduce costs by improving their efficiency [94]. Cost savings refer to the process by which the average cost per unit produced decreases as the volume increases. By providing cost advantages, well-designed strategic plans enable businesses to gain a competitive advantage over competitors [95]. Industry 4.0 technology contributes to cost savings by reducing waste and optimizing resource utilization.
The second critical factor in MSOs’ market competitiveness is quality. It refers to a company’s ability to meet and exceed the expectations of its customers while maintaining a high standard of quality control, management, oversight, and inspection [59,96]. Maintaining a high standard of quality in all aspects of the business enables the business to build loyal customers, maintain consistent cash flows, and outperform competitors in the market. Quality in manufacturing becomes critical in establishing an image and sustaining a competitive advantage, as competitive advantage success is determined by meeting or exceeding customer expectations [97,98,99]. Effective quality improvement has evolved into a highly profitable method of ensuring competitiveness and improving organizational performance [100].
The third crucial factor that enables MSOs to achieve market competitiveness is performance. Performance is a critical output for any organization’s success. Product performance is measured by how well it accomplishes unique features that others cannot [39]. The proper performance strategy system can help employees to align, connect, and support one another to drive company-wide outcomes. Industry 4.0 adoption improves the firm’s economic and operational performance and business operations [101]. Other enablers, therefore, appear to be of moderate importance to MSOs when adopting I4 technologies (Table 6).
Understanding critical MSOs requires focusing on their root causes, which must be treated with extreme care. For this reason, a cause-and-effect relationship diagram was built, as shown in Figure 7. Table 6 reveals that flexibility has the highest R j D i   value (0.78) among all factors in the cause group. This indicates that flexibility has a more significant impact on MSOs. Flexibility is the capability to provide customized goods and services, and increase or decrease the number of existing products to adapt to consumer needs quickly [60,63]. A company’s ability to respond rapidly to shifting markets is made possible by manufacturing flexibility.
Flexibility is a crucial factor in a company’s competitive position and should be considered [102]. In reality, flexible manufacturing is becoming an increasingly essential capability for organizations looking to stay ahead of the market and provide value-added solutions to their customers. As a result, flexibility is the most critical MSO. Following that, innovativeness is the second most important causal factor of MSOs adopting I4.0 technologies, followed by performance. Innovation provides numerous significant benefits to companies and is frequently critical to outperforming the competition. Innovation in manufacturing can take many forms, from introducing new technology and alterations to the supply chain, to product and process enhancements.
Effect factors are the ones that are easily influenced by other factors. However, it is essential to assess the factors that could have a negative impact on the manufacturing strategy’s output. According to Figure 7, the cause–effect relationship diagram clearly shows that cost has the highest R j + D i   value (18.45) among all the effect groups. Among all factors, it has the highest influenced impact index D i (9.27). As effect factors, quality and delivery significantly impact manufacturing strategies, as shown in Figure 7.

6. Conclusions

Smart manufacturing has grown and strengthened its position in the global economy. It employs internet-connected machinery to monitor the manufacturing process, finds potential for automating activities, and uses data analytics to improve MSOs. However, based on experts’ perspectives, this study utilized the fuzzy DEMATEL method to analyze the factors influencing MSOs’ adoption of I4.0 technologies. This method discovers the root cause and effect factors, and generates a strategy map based on these factors. The strategy map demonstrates the interdependencies between MSOs, as well as their strengths. Through well-organized and planned manufacturing strategies, this research aids manufacturing firms in considering the root causes and influence of MSOs, emphasizing how the proper decisions can motivate the company to maintain a competitive advantage. Based on the experts’ perspectives, the following conclusions have been made:
Among all the factors contributing to market competitiveness, cost is the most critical enabler for MSOs, followed by quality and performance.
According to the root causes of MSOs, flexibility is the most influential factor in the cause factors group. Other important causes are innovativeness and performance, respectively.
The result indicates that cost greatly influences the affected factors group. Furthermore, quality and delivery have a significant impact on manufacturing strategies.
This paper has several limitations and shortcomings. Firstly, no case study or empirical study has been undertaken to determine how factors influence the adoption of I4.0 technologies. Therefore, future research should conduct an empirical investigation in manufacturing areas. Secondly, future studies should conduct more surveys (more experts) to obtain a greater perspective on the topic. Thirdly, the method needs to be combined with other MCDM methods, such as BWM or PROMETHEE methods, to help manufacturing businesses figure out the causes and effects of MSOs to stay ahead of the competition.

Author Contributions

Conceptualization, F.M.A. and A.M.A.-A.; methodology, F.M.A.; investigation, F.M.A. and A.M.A.-A.; resources, A.M.A.-A.; data curation, F.M.A.; writing—original draft preparation, F.M.A.; writing—review and editing, F.M.A., A.M.A.-A. and S.A.; visualization, F.M.A.; supervision, A.M.A.-A. and S.A.; funding acquisition, A.M.A.-A. All authors have read and agreed to the published version of the manuscript.

Funding

This study received funding from the Raytheon Chair for Systems Engineering. The authors are grateful to the Raytheon Chair for Systems Engineering for funding.

Institutional Review Board Statement

Not applicable.

Informed Consent Statement

Not applicable.

Data Availability Statement

The data used to support the findings of this study are included in the article.

Conflicts of Interest

The authors declare no conflict of interest.

References

  1. Thoben, K.-D.; Wiesner, S.; Wuest, T. “Industrie 4.0” and smart manufacturing-a review of research issues and application examples. Int. J. Autom. Technol. 2017, 11, 4–16. [Google Scholar] [CrossRef]
  2. Çınar, Z.; Zeeshan, Q.; Korhan, O. A Framework for Industry 4.0 Readiness and Maturity of Smart Manufacturing Enterprises: A Case Study. Sustainability 2021, 13, 6659. [Google Scholar] [CrossRef]
  3. Giret, A.; Garcia, E.; Botti, V. An engineering framework for Service-Oriented Intelligent Manufacturing Systems. Comput. Ind. 2016, 81, 116–127. [Google Scholar] [CrossRef]
  4. Siew, J.P.; Low, H.C.; Teoh, P.C. An interactive mobile learning application using machine learning framework in a flexible manufacturing environment. Int. J. Mob. Learn. Organ. 2016, 10, 1–24. [Google Scholar] [CrossRef]
  5. Qin, J.; Liu, Y.; Grosvenor, R. A categorical framework of manufacturing for industry 4.0 and beyond. Procedia CIRP 2016, 52, 173–178. [Google Scholar] [CrossRef]
  6. Hermann, M.; Pentek, T.; Otto, B. Design principles for industrie 4.0 scenarios. In Proceedings of the 2016 49th Hawaii international conference on system sciences (HICSS), Koloa, HI, USA, 5–8 January 2016; pp. 3928–3937. [Google Scholar]
  7. Sony, M. Industry 4.0 and lean management: A proposed integration model and research propositions. Prod. Manuf. Res. 2018, 6, 416–432. [Google Scholar] [CrossRef]
  8. Wang, S.; Wan, J.; Li, D.; Zhang, C. Implementing Smart Factory of Industrie 4.0: An Outlook. Int. J. Distrib. Sens. Netw. 2016, 12, 3159805. [Google Scholar] [CrossRef]
  9. Sung, T.K. Industry 4.0: A Korea perspective. Technol. Forecast. Soc. Change 2018, 132, 40–45. [Google Scholar] [CrossRef]
  10. Alcácer, V.; Cruz-Machado, V. Scanning the Industry 4.0: A Literature Review on Technologies for Manufacturing Systems. Eng. Sci. Technol. Int. J. 2019, 22, 899–919. [Google Scholar] [CrossRef]
  11. Ghobakhloo, M. The future of manufacturing industry: A strategic roadmap toward Industry 4.0. J. Manuf. Technol. Manag. 2018, 29, 910–936. [Google Scholar] [CrossRef]
  12. Ko, M.; Kim, C.; Lee, S.; Cho, Y. An Assessment of Smart Factories in Korea: An Exploratory Empirical Investigation. Appl. Sci. 2020, 10, 7486. [Google Scholar] [CrossRef]
  13. Parhi, S.; Joshi, K.; Akarte, M. Smart manufacturing: A framework for managing performance. Int. J. Comput. Integr. Manuf. 2021, 34, 227–256. [Google Scholar] [CrossRef]
  14. Dohale, V.; Gunasekaran, A.; Akarte, M.M.; Verma, P. 52 Years of manufacturing strategy: An evolutionary review of literature (1969–2021). Int. J. Prod. Res. 2022, 60, 569–594. [Google Scholar] [CrossRef]
  15. Cimorelli, S.; Chandler, G. Handbook of Manufacturing Engineering; Walker, J.M., Ed.; Marcel Dekker: New York, NY, USA, 1996. [Google Scholar]
  16. Ketokivi, M.; Schroeder, R.; Management, P. Manufacturing practices, strategic fit and performance: A routine-based view. Int. J. Oper. Prod. Manag. 2004, 24, 171–191. [Google Scholar] [CrossRef]
  17. Awwad, A.S.; Al Khattab, A.A.; Anchor, J.R. Competitive Priorities and Competitive Advantage in Jordanian Manufacturing. J. Serv. Sci. Manag. 2013, 6, 69–79. [Google Scholar] [CrossRef]
  18. Youssef, M.A.; Youssef, E.M. The synergisitic impact of time–based technologies on manufacturing competitive priorities. Int. J. Technol. Manag. 2015, 67, 245–268. [Google Scholar] [CrossRef]
  19. Miltenburg, J. Setting manufacturing strategy for a company's international manufacturing network. Int. J. Prod. Res. 2009, 47, 6179–6203. [Google Scholar] [CrossRef]
  20. Patil, P.P.; Narkhede, B.; Akarte, M.M. Pattern of manufacturing strategy implementation and implications on manufacturing levers and manufacturing outputs and business performance. Int. J. Indian Cult. Bus. Manag. 2015, 10, 157–177. [Google Scholar] [CrossRef]
  21. Flynn, B.B.; Schroeder, R.G.; Flynn, E.J. World class manufacturing: An investigation of Hayes and Wheelwright’s foundation. J. Oper. Manag. 1999, 17, 249–269. [Google Scholar] [CrossRef]
  22. ElMaraghy, H.; Schuh, G.; ElMaraghy, W.; Piller, F.; Schönsleben, P.; Tseng, M.; Bernard, A. Product variety management. CIRP Ann. 2013, 62, 629–652. [Google Scholar] [CrossRef]
  23. E Quezada, L.; Córdova, F.M.; Widmer, S.; O’Brien, C. A methodology for formulating a business strategy in manufacturing firms. Int. J. Prod. Econ. 1999, 60–61, 87–94. [Google Scholar] [CrossRef]
  24. Schmenner, R.W. Multiplant manufacturing strategies among the fortune 500. J. Oper. Manag. 1982, 2, 77–86. [Google Scholar] [CrossRef]
  25. Wheel Wright, S.C. Manufacturing strategy: Defining the missing link. Strateg. Manag. J. 1984, 5, 77–91. [Google Scholar] [CrossRef]
  26. Voss, C.A. Implementing manufacturing technology: A manufacturing strategy approach. Int. J. Oper. Prod. Manag. 1986, 6, 17–26. [Google Scholar] [CrossRef]
  27. Anderson, J.C.; Cleveland, G.; Schroeder, R.G. Operations strategy: A literature review. J. Oper. Manag. 1989, 8, 133–158. [Google Scholar] [CrossRef]
  28. Ardito, L.; Petruzzelli, A.M.; Panniello, U.; Garavelli, A.C. Towards Industry 4.0: Mapping digital technologies for supply chain management-marketing integration. Bus. Process Manag. J. 2019, 25, 323–346. [Google Scholar] [CrossRef]
  29. Salam, M.A. Analyzing manufacturing strategies and Industry 4.0 supplier performance relationships from a resource-based perspective. Benchmarking Int. J. 2019, 28, 1697–1716. [Google Scholar] [CrossRef]
  30. Hosseini, S.M.; Peer, A. Wood Products Manufacturing Optimization: A Survey. IEEE Access 2022, 10, 121653–121683. [Google Scholar] [CrossRef]
  31. Chiarini, A.; Belvedere, V.; Grando, A. Industry 4.0 strategies and technological developments. An exploratory research from Italian manufacturing companies. Prod. Plan. Control 2020, 31, 1385–1398. [Google Scholar] [CrossRef]
  32. May, G.; Kiritsis, D. Zero Defect Manufacturing Strategies and Platform for Smart Factories of Industry 4.0. In Proceedings of the 4th International Conference on the Industry 4.0 Model for Advanced Manufacturing, Industry 4.0 and Internet of Things for Manufacturing (AMP), Belgrade, Serbia, 3–6 June 2019; pp. 142–152. [Google Scholar] [CrossRef]
  33. Tortorella, G.L.; Fettermann, D. Implementation of Industry 4.0 and lean production in Brazilian manufacturing companies. Int. J. Prod. Res. 2018, 56, 2975–2987. [Google Scholar] [CrossRef]
  34. Ghobakhloo, M.; Fathi, M. Corporate survival in Industry 4.0 era: The enabling role of lean-digitized manufacturing. J. Manuf. Technol. Manag. 2019, 31, 1–30. [Google Scholar] [CrossRef]
  35. Mittal, S.; Khan, M.A.; Romero, D.; Wuest, T. A critical review of smart manufacturing & Industry 4.0 maturity models: Implications for small and medium-sized enterprises (SMEs). J. Manuf. Syst. 2018, 49, 194–214. [Google Scholar] [CrossRef]
  36. Nouinou, H.; Asadollahi-Yazdi, E.; Baret, I.; Nguyen, N.Q.; Terzi, M.; Ouazene, Y.; Yalaoui, F.; Kelly, R. Decision-making in the context of Industry 4.0: Evidence from the textile and clothing industry. J. Clean. Prod. 2023, 391, 136184. [Google Scholar] [CrossRef]
  37. Raju, K.S.; Duckstein, L.; Arondel, C. Multicriterion Analysis for Sustainable Water Resources Planning: A Case Study in Spain. Water Resour. Manag. 2000, 14, 435–456. [Google Scholar] [CrossRef]
  38. Rehman, A.U.; Al-Ahmari, A. Assessment of alternative industrial robots using AHP and TOPSIS. Int. J. Ind. Syst. Eng. 2013, 15, 475–489. [Google Scholar] [CrossRef]
  39. Wu, G.-C.; Ding, J.-H.; Chen, P.-S. The effects of GSCM drivers and institutional pressures on GSCM practices in Taiwan’s textile and apparel industry. Int. J. Prod. Econ. 2012, 135, 618–636. [Google Scholar] [CrossRef]
  40. Si, S.-L.; You, X.-Y.; Liu, H.-C.; Zhang, P. DEMATEL Technique: A Systematic Review of the State-of-the-Art Literature on Methodologies and Applications. Math. Probl. Eng. 2018, 2018, 3696457. [Google Scholar] [CrossRef]
  41. Fathi, M.; Ghobakhloo, M. Enabling Mass Customization and Manufacturing Sustainability in Industry 4.0 Context: A Novel Heuristic Algorithm for in-Plant Material Supply Optimization. Sustainability 2020, 12, 6669. [Google Scholar] [CrossRef]
  42. Kuys, B.; Koch, C.; Renda, G. The Priority Given to Sustainability by Industrial Designers within an Industry 4.0 Paradigm. Sustainability 2021, 14, 76. [Google Scholar] [CrossRef]
  43. Pasi, B.N.; Mahajan, S.K.; Rane, S.B. The current sustainability scenario of Industry 4.0 enabling technologies in Indian manufacturing industries. Int. J. Product. Perform. Manag. 2020, 70, 1017–1048. [Google Scholar] [CrossRef]
  44. Javaid, M.; Haleem, A.; Singh, R.P.; Khan, S.; Suman, R. Sustainability 4.0 and its applications in the field of manufacturing. Internet Things Cyber Phys. Syst. 2022, 2, 82–90. [Google Scholar] [CrossRef]
  45. Huang, C.-Y.; Shyu, J.Z.; Tzeng, G.-H. Reconfiguring the innovation policy portfolios for Taiwan’s SIP Mall industry. Technovation 2007, 27, 744–765. [Google Scholar] [CrossRef]
  46. Tzeng, G.-H.; Chiang, C.-H.; Li, C.-W. Evaluating intertwined effects in e-learning programs: A novel hybrid MCDM model based on factor analysis and DEMATEL. Expert Syst. Appl. 2007, 32, 1028–1044. [Google Scholar] [CrossRef]
  47. Devadoss, A.V.; Felix, A. A Fuzzy DEMATEL approach to study cause and effect relationship of youth violence. Int. J. Comput. Algorithm 2013, 2, 363–372. [Google Scholar]
  48. Lin, R.-J. Using fuzzy DEMATEL to evaluate the green supply chain management practices. J. Clean. Prod. 2013, 40, 32–39. [Google Scholar] [CrossRef]
  49. Wu, W.-W. Choosing knowledge management strategies by using a combined ANP and DEMATEL approach. Expert Syst. Appl. 2008, 35, 828–835. [Google Scholar] [CrossRef]
  50. Mahmoodzadeh, S.; Shahrabi, J.; Pariazar, M.; Zaeri, M. Project selection by using fuzzy AHP and TOPSIS technique. Int. J. Ind. Manuf. Eng. 2007, 1, 270–275. [Google Scholar]
  51. Bouzon, M.; Govindan, K.; Rodriguez, C.M.T. Evaluating barriers for reverse logistics implementation under a multiple stakeholders’ perspective analysis using grey decision making approach. Resour. Conserv. Recycl. 2018, 128, 315–335. [Google Scholar] [CrossRef]
  52. Zhu, Q.; Sarkis, J.; Geng, Y. Barriers to environmentally-friendly clothing production among Chinese apparel companies. Asian Bus. Manag. 2011, 10, 425–452. [Google Scholar] [CrossRef]
  53. Aghelie, A.; Mustapha, N.; Sorooshian, S.; Azizan, N. Mathematical modeling of interrelationship analysis to determine multi-criteria decision making casual relations. J. Adv. Res. Des. 2016, 20, 18–33. [Google Scholar]
  54. Sivakumar, K.; Jeyapaul, R.; Vimal, K.; Ravi, P. A DEMATEL approach for evaluating barriers for sustainable end-of-life practices. J. Manuf. Technol. Manag. 2018, 29, 1065–1091. [Google Scholar]
  55. Aruldoss, M.; Lakshmi, T.M.; Venkatesan, V.P. A survey on multi criteria decision making methods and its applications. Am. J. Inf. Syst. 2013, 1, 31–43. [Google Scholar]
  56. Chen, Z.; Ming, X.; Zhou, T.; Chang, Y. Sustainable supplier selection for smart supply chain considering internal and external uncertainty: An integrated rough-fuzzy approach. Appl. Soft Comput. 2020, 87, 106004. [Google Scholar] [CrossRef]
  57. Hund, A.; Wagner, H.-T.; Beimborn, D.; Weitzel, T. Digital innovation: Review and novel perspective. J. Strateg. Inf. Syst. 2021, 30, 101695. [Google Scholar] [CrossRef]
  58. Eraslan, I.H. The Effects of Competitive Strategies on Firm Performance: A Study in Turkish Textile and Apparel Industry Considering the Mediating Role of Value Chain Activities. Ph.D. Thesis, Boğaziçi University Social Sciences Institute, Istanbul, Turkey, 2008. [Google Scholar]
  59. Ward, P.T.; Duray, R. Manufacturing strategy in context: Environment, competitive strategy and manufacturing strategy. J. Oper. Manag. 2000, 18, 123–138. [Google Scholar] [CrossRef]
  60. Miltenburg, J. Setting manufacturing strategy for a factory-within-a-factory. Int. J. Prod. Econ. 2008, 113, 307–323. [Google Scholar] [CrossRef]
  61. Kusumadewi, R.N.; Karyono, O. Impact of Service Quality and Service Innovations on Competitive Advantage in Retailing. Bp. Int. Res. Crit. Inst. 2019, 2, 366–374. [Google Scholar] [CrossRef]
  62. Sadq, Z.M.; Mohammed, H.O.; Othman, B.; Saeed, V.S. Attitudes of Managers in the Knowledge Private University towards the impact of Human Capital in Achieving Competitive Advantages. EST Eng. Manag. 2020, 82, 393–401. [Google Scholar]
  63. Krause, D.R.; Pagell, M.; Curkovic, S. Toward a measure of competitive priorities for purchasing. J. Oper. Manag. 2001, 19, 497–512. [Google Scholar] [CrossRef]
  64. Park-Poaps, H.; Bari, M.S. Supply chain management practices (SCMP) and their impact on competitive advantage in the Bangladeshi apparel sector. Int. Text. Appar. Assoc. Annu. Conf. Proc. 2019, 76, 8452. [Google Scholar] [CrossRef]
  65. Abdullah, F.M.; Al-Ahmari, A.M.; Anwar, S. Exploring Key Decisive Factors in Manufacturing Strategies in the Adoption of Industry 4.0 by Using the Fuzzy DEMATEL Method. Processes 2022, 10, 987. [Google Scholar] [CrossRef]
  66. Al-Fuqaha, A.; Guizani, M.; Mohammadi, M.; Aledhari, M.; Ayyash, M. Internet of Things: A Survey on Enabling Technologies, Protocols, and Applications. IEEE Commun. Surv. Tutor. 2015, 17, 2347–2376. [Google Scholar] [CrossRef]
  67. Abdullah, F.M.; Saleh, M.; Al-Ahmari, A.M.; Anwar, S. The Impact of Industry 4.0 Technologies on Manufacturing Strategies: Proposition of Technology-Integrated Selection. IEEE Access 2022, 10, 21574–21583. [Google Scholar] [CrossRef]
  68. Xu, X. From cloud computing to cloud manufacturing. Robot. Comput. Integr. Manuf. 2012, 28, 75–86. [Google Scholar] [CrossRef]
  69. Mabkhot, M.M.; Ferreira, P.; Maffei, A.; Podržaj, P.; Mądziel, M.; Antonelli, D.; Lanzetta, M.; Barata, J.; Boffa, E.; Finžgar, M.; et al. Mapping Industry 4.0 Enabling Technologies into United Nations Sustainability Development Goals. Sustainability 2021, 13, 2560. [Google Scholar] [CrossRef]
  70. LaValle, S.; Lesser, E.; Shockley, R.; Hopkins, M.S.; Kruschwitz, N. Big data, analytics and the path from insights to value. MIT Sloan Manag. Rev. 2011, 52, 21–32. [Google Scholar]
  71. Esmaeilian, B.; Behdad, S.; Wang, B. The evolution and future of manufacturing: A review. J. Manuf. Syst. 2016, 39, 79–100. [Google Scholar] [CrossRef]
  72. M Abdullah, F.; Anwar, S.; Al-Ahmari, A. Thermomechanical Simulations of Residual Stresses and Distortion in Electron Beam Melting with Experimental Validation for Ti-6Al-4V. Metals 2020, 10, 1151. [Google Scholar] [CrossRef]
  73. Alfaify, A.; Saleh, M.; Abdullah, F.; Al-Ahmari, A. Design for Additive Manufacturing: A Systematic Review. Sustainability 2020, 12, 7936. [Google Scholar] [CrossRef]
  74. Anwar, S.; Abdullah, F.M.; Salah, B.; Ahmad, S.; Al-Ahmari, A.M. An Overview of Electron Beam Melting research with Bibliometric Indicators. In Proceedings of the International Conference on Industrial Engineering and Operations Management, Rabat, Morocco, 11–13 April 2017. [Google Scholar]
  75. Yew, A.; Ong, S.; Nee, A. Towards a griddable distributed manufacturing system with augmented reality interfaces. Robot. Comput. Manuf. 2016, 39, 43–55. [Google Scholar] [CrossRef]
  76. Palmarini, R.; Erkoyuncu, J.A.; Roy, R. An Innovative Process to Select Augmented Reality (AR) Technology for Maintenance. Procedia CIRP 2017, 59, 23–28. [Google Scholar] [CrossRef]
  77. Kocian, J.; Tutsch, M.; Ozana, S.; Koziorek, J. Application of Modeling and Simulation Techniques for Technology Units in Industrial Control. In Frontiers in Computer Education; Springer: Berlin/Heidelberg, Germany, 2012; pp. 491–499. [Google Scholar] [CrossRef]
  78. Monostori, L. Cyber-physical Production Systems: Roots, Expectations and R&D Challenges. Procedia CIRP 2014, 17, 9–13. [Google Scholar] [CrossRef]
  79. Adamson, G.; Wang, L.; Moore, P. Feature-based control and information framework for adaptive and distributed manufacturing in cyber physical systems. J. Manuf. Syst. 2017, 43, 305–315. [Google Scholar] [CrossRef]
  80. Abeyratne, S.A.; Monfared, R.P. Blockchain ready manufacturing supply chain using distributed ledger. Int. J. Res. Eng. Technol. 2016, 5, 1–10. [Google Scholar]
  81. Tortorella, G.L.; Pradhan, N.; Macias de Anda, E.; Trevino Martinez, S.; Sawhney, R.; Kumar, M. Designing lean value streams in the fourth industrial revolution era: Proposition of technology-integrated guidelines. Int. J. Prod. Res. 2020, 58, 5020–5033. [Google Scholar] [CrossRef]
  82. Baker, J.; Lovell, K.; Harris, N. How expert are the experts? An exploration of the concept of ‘expert’ within Delphi panel techniques. Nurse Res. 2006, 14, 59–70. [Google Scholar] [CrossRef] [PubMed]
  83. Ocampo, L.A.; Tan, T.A.G.; Sia, L.A. Using fuzzy DEMATEL in modeling the causal relationships of the antecedents of organizational citizenship behavior (OCB) in the hospitality industry: A case study in the Philippines. J. Hosp. Tour. Manag. 2018, 34, 11–29. [Google Scholar] [CrossRef]
  84. Tsai, S.-B.; Chien, M.-F.; Xue, Y.; Li, L.; Jiang, X.; Chen, Q.; Zhou, J.; Wang, L. Using the Fuzzy DEMATEL to Determine Environmental Performance: A Case of Printed Circuit Board Industry in Taiwan. PLoS ONE 2015, 10, e0129153. [Google Scholar] [CrossRef]
  85. Muhammad, M.N.; Cavus, N. Fuzzy DEMATEL method for identifying LMS evaluation criteria. Procedia Comput. Sci. 2017, 120, 742–749. [Google Scholar] [CrossRef]
  86. Vinodh, S.; Devadasan, S.; Vasudeva Reddy, B.; Ravichand, K. Agility index measurement using multi-grade fuzzy approach integrated in a 20 criteria agile model. Int. J. Prod. Res. 2010, 48, 7159–7176. [Google Scholar] [CrossRef]
  87. Opricovic, S.; Tzeng, G.-H. Defuzzification within a multicriteria decision model. Int. J. Uncertain. Fuzziness Knowl. Based Syst. 2003, 11, 635–652. [Google Scholar] [CrossRef]
  88. Kamble, S.S.; Gunasekaran, A.; Ghadge, A.; Raut, R. A performance measurement system for industry 4.0 enabled smart manufacturing system in SMMEs-A review and empirical investigation. Int. J. Prod. Econ. 2020, 229, 107853. [Google Scholar] [CrossRef]
  89. Beheshti, H.M. Gaining and sustaining competitive advantage with activity based cost management system. Ind. Manag. Data Syst. 2004, 104, 377–383. [Google Scholar] [CrossRef]
  90. Tortorella, G.L.; Vergara, A.M.C.; Garza-Reyes, J.A.; Sawhney, R. Organizational learning paths based upon industry 4.0 adoption: An empirical study with Brazilian manufacturers. Int. J. Prod. Econ. 2019, 219, 284–294. [Google Scholar] [CrossRef]
  91. Dalenogare, L.S.; Benitez, G.B.; Ayala, N.F.; Frank, A.G. The expected contribution of Industry 4.0 technologies for industrial performance. Int. J. Prod. Econ. 2018, 204, 383–394. [Google Scholar] [CrossRef]
  92. Bai, C.; Li, H.A.; Xiao, Y. Industry 4.0 technologies: Empirical impacts and decision framework. Prod. Oper. Manag. 2022. [Google Scholar] [CrossRef]
  93. Buer, S.-V.; Strandhagen, J.O.; Chan, F.T.S. The link between Industry 4.0 and lean manufacturing: Mapping current research and establishing a research agenda. Int. J. Prod. Res. 2018, 56, 2924–2940. [Google Scholar] [CrossRef]
  94. Mosheim, R.; Lovell, C.K. Scale Economies and Inefficiency of U.S. Dairy Farms. Am. J. Agric. Econ. 2009, 91, 777–794. [Google Scholar] [CrossRef]
  95. Lechner, C.; Gudmundsson, S.V. Entrepreneurial orientation, firm strategy and small firm performance. Int. Small Bus. J. Res. Entrep. 2012, 32, 36–60. [Google Scholar] [CrossRef]
  96. Wang, J.; Cao, D.-B. Relationships between two approaches for planning manufacturing strategy: A strategic approach and a paradigmatic approach. Int. J. Prod. Econ. 2008, 115, 349–361. [Google Scholar] [CrossRef]
  97. Jelcic, S. Managing service quality to gain competitive advantage in retail environment. Tem J. 2014, 3, 181. [Google Scholar]
  98. Lakhal, L. Impact of quality on competitive advantage and organizational performance. J. Oper. Res. Soc. 2009, 60, 637–645. [Google Scholar] [CrossRef]
  99. Dominic, P.D.D.; Goh, K.N.; Wong, D.; Chen, Y.Y. The importance of service quality for competitive advantage—with special reference to industrial product. Int. J. Bus. Inf. Syst. 2010, 6, 378–397. [Google Scholar] [CrossRef]
  100. Valdez-de la Rosa, L.M.; Villarreal, L.A.; Alarcón-Martínez, G. Quality and innovation as drivers for manufacturing competitiveness of automotive parts suppliers. TQM J. 2021, 33, 966–986. [Google Scholar] [CrossRef]
  101. Yu, Z.; Khan, S.A.R.; Umar, M. Circular economy practices and industry 4.0 technologies: A strategic move of automobile industry. Bus. Strat. Environ. 2021, 31, 796–809. [Google Scholar] [CrossRef]
  102. Nigel, S. The flexibility of manufacturing systems. Int. J. Oper. Prod. Manag. 2005, 25, 1190–1200. [Google Scholar]
Figure 1. Sustainable manufacturing outputs.
Sustainability 15 03864 g001
Figure 3. General steps of the fuzzy DEMATEL method.
Sustainability 15 03864 g003
Figure 6. The interdependence and relationship between MSOs.
Sustainability 15 03864 g006
Figure 7. Cause−effect strategy map.
Sustainability 15 03864 g007
Table 2. The fuzzy triangular numbers.
FCQDFPI
C0.000.000.000.700.901.000.300.500.700.100.300.500.500.700.900.500.700.90
Q0.500.700.900.000.000.000.000.100.300.100.300.500.100.300.500.000.100.30
D0.100.300.500.000.100.300.000.000.000.000.100.300.000.100.300.000.100.30
F0.500.700.900.500.700.900.500.700.900.000.000.000.300.500.700.500.700.90
P0.300.500.700.100.300.500.000.100.300.100.300.500.000.000.000.300.500.70
I0.500.700.900.100.300.500.000.100.300.100.300.500.700.901.000.000.000.00
Table 3. Normalized fuzzy direct-relation matrix.
FCQDFPI
C0.000.000.000.700.901.000.330.560.780.200.601.000.500.700.900.560.781.00
Q0.560.781.000.000.000.000.000.110.330.200.601.000.100.300.500.000.110.33
D0.110.330.560.000.100.300.000.000.000.000.200.600.000.100.300.000.110.33
F0.560.781.000.500.700.900.560.781.000.000.000.000.300.500.700.560.781.00
P0.330.560.780.100.300.500.000.110.330.200.601.000.000.000.000.330.560.78
I0.560.781.000.100.300.500.000.110.330.200.601.000.700.901.000.000.000.00
Table 4. The initial direct influence matrix after the fuzzy triangulation is performed.
FCQDFPI
C0.000.870.500.290.690.69
Q0.690.000.130.290.310.13
D0.310.130.000.130.130.13
F0.690.690.690.000.500.69
P0.500.310.130.290.000.50
I0.690.310.130.290.870.00
Table 5. Average expert influence matrix on MSOs.
FCQDFPI
C0.000.720.540.540.630.67
Q0.720.000.420.470.720.45
D0.510.400.000.400.330.33
F0.590.560.530.000.630.61
P0.670.720.420.570.000.57
I0.640.510.380.630.570.00
Table 6. The affected degree ( R j ), influence degree ( D i ), centrality ( R j + D i ) and cause–effect degree R j D i for each factor.
Factor R j D i R j   +   D i R j     D i Category
C9.18 (1)9.27 (1)18.45 (1)−0.09 (4)Net effect
Q8.47 (4)8.76 (2)17.23 (3)−0.30 (5)Net effect
D6.19 (6)7.09 (6)13.27 (6)−0.90 (6)Net effect
F8.71 (3)7.93 (5)16.64 (4)0.78 (1)Net cause
P8.90 (2)8.68 (3)17.58 (2)0.21 (3)Net cause
I8.37 (5)8.07 (4)16.44 (5)0.30 (2)Net cause
The numbers in brackets indicate the priority or rank of each factor.
Disclaimer/Publisher’s Note: The statements, opinions and data contained in all publications are solely those of the individual author(s) and contributor(s) and not of MDPI and/or the editor(s). MDPI and/or the editor(s) disclaim responsibility for any injury to people or property resulting from any ideas, methods, instructions or products referred to in the content.

