Abstract
Cone-shaped volcanoes have important research significance and application value due to their typical cone shape and unique structural features. The existing methods for recognizing volcanoes are mainly morphological feature matching and machine learning. In general, the former has low recognition accuracy, while the latter requires a large number of training samples. The contour lines of cone-shaped volcanoes are distributed in concentric circles. Furthermore, from the center outwards, the elevation of the contour lines increases first and then decreases. Based on the morphological characteristics of cone-shaped volcanoes and the Hough transform algorithm, the main algorithm includes (1) preliminary filtering of contour lines, (2) filtering circular contour lines based on random Hough transform, (3) grouping contour lines based on contour trees, (4) recognizing cone-shaped volcanoes based on concentric-circle contour lines, and (5) automatically mapping cone-shaped volcanoes. Case studies demonstrate the effectiveness of this method for detecting cone-shaped volcanoes in the Western Galapagos shield volcanoes and the Mariana Trench submarine volcano group. The proposed algorithm has low missed and false alarm rates, which is basically consistent with the manual recognition results. This method can effectively automatically recognize cone-shaped volcanoes and cone-shaped landscapes and is a powerful means to support deep-space and deep-sea exploration.
1. Introduction
Cone-shaped volcanoes have important research significance and application value in tourism and geographical environments due to their typical cone shape and unique structural features [1,2]. Furthermore, volcanic mapping is an important task of geomorphology [3]. However, the traditional method for volcanic surveying and mapping based on field exploration is inefficient and time-consuming [4]. With the development of remote sensing technology, it is possible to map volcanoes by visual interpretation of remote sensing images [5,6,7,8]. However, manual interpretation is time-consuming, costly, and subjective [9,10]. The manual interpretation is valid only for a small number of volcanoes. It is limited when the number of volcanoes is large, such as in the survey and mapping of underwater and planetary volcanoes [11].
Therefore, automatic algorithms for volcano recognition and delimitation have become a research focus, and the methods are mainly divided into two types: morphological feature matching and machine learning. The former mainly uses the morphological features of volcanoes in remote sensing images or digital elevation models (DEM) [12], including the morphometric characterization of volcanic edifices [9,10], visual morphometric characterization [13], and spectral and textural signatures [14]. Additionally, the algorithm is efficient. With remote sensing images of Venus, Wiles and Forshaw [11] used a template matching method to identify volcanoes. However, this method only considers the two-dimensional morphological features of volcanoes in remote sensing images; the recognition efficiency is low, and the accuracy is not high. In addition, when the volcanic cone is formed on very rough terrain, the automatic delineation of the boundary of the volcanic cone may be affected by the irregular terrain [10]. Cao et al. [15] proposed an automatic recognition method for cone-shaped volcanoes using a DEM matching template. Due to a large amount of data and a lack of apparent topological information in DEM, the algorithm has low applicability, and it is challenging to identify submarine volcanoes.
Machine learning can automatically improve the accuracy of identifying volcanoes through experience. This recognition method is mainly divided into supervised and unsupervised learning methods, including support vector machine [16], genetic [17], object-oriented [18], artificial neural network [19], and other algorithms [20,21]. Machine learning can deal with more complex cases, and with more training samples, the recognition accuracy is improved [22,23]. For example, Burl et al. [22] used machine learning to recognize the volcanoes on Venus using remote sensing images. The recognition was as good as a trained human observer. However, this method requires high quality and a large quantity of training set, and the workload to collect and sort samples is heavy.
The recognition methods based on morphological features fail to consider the three-dimensional morphology, spatial structure, and other features of volcanoes and are prone to misjudgment. Although the accuracy of machine learning algorithms will continuously improve with the increase of training samples, it requires a lot of time for model training, which has certain limitations in practical applications. In addition, the data sources for these two kinds of recognition methods are mostly based on quality remote sensing images or DEM. Although it is convenient to obtain, the data volume is large and has certain limitations when used for large-scale recognition.
In the field of geomorphic recognition, a general trend is to use contour lines and multi-dimensional features to identify geomorphic features, which have the advantages of high efficiency and high accuracy [24,25,26,27,28,29]. The closed-contouring approach is one of the representative methods [24]. The method, using multi-dimensional features, considers not only the morphological features of landforms but also composite features such as spatial structure and statistical features, which can identify specific landforms with a lower probability of false detection. For example, Wang et al. [26] developed a method for automatically extracting lunar craters based on analyzing the relationships of contour lines and the accurate matching of crater morphological characteristics. Compared with the method based on remote sensing images and DEM, this method has better accuracy, stability, and real-time performance. Lunar craters are similar in shape to volcanic craters, and the automatic recognition of lunar craters has a high reference value for cone-shaped volcano recognition. Volcanoes are concentric structures of satellite images. The characteristics of volcanoes are well summarized by contour. Therefore, our proposed algorithm uses the spatial structure and statistical characteristics of the contour data to identify volcanoes.
The main contribution of this paper are as follows: Given the apparent characteristics of cone-shaped volcanoes in contour lines, this paper intends to propose an algorithm for automatically detecting and mapping cone-shaped volcanoes from contour lines. The Hough transform of vector data and the contour tree grouping make the algorithm fast and effective. Furthermore, the method has low missed and false alarm rates, which is consistent with the results of manual recognition.
2. Methodology
The automatic identification of volcanoes mainly includes the following steps: (1) preliminary screening of contour lines, (2) recognition of circular contour lines based on the random Hough transform, (3) grouping of concentric contour lines using contour trees, (4) cone-shaped volcano identification based on concentric contour lines, and (5) automatic mapping of cone-shaped volcanoes. Figure 1 shows a flow diagram illustrating the method.
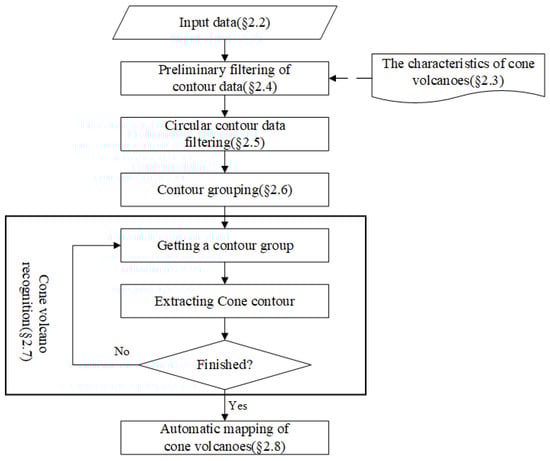
Figure 1.
Flow chart of the cone-shaped volcano extraction algorithm.“§” is the symbol of section.
2.1. The Outline of Research Area and Applicability
In order to verify the validity of the algorithm, two study areas were selected to represent terrestrial and submarine volcanoes. Both are located in the Pacific Ring of Fire, a region around much of the rim of the Pacific Ocean where many volcanic eruptions and earthquakes occur. The first is Isabela Island (Figure 2 study area 1), part of the Republic of Ecuador. All volcanoes have distinct cones and craters. Therefore, it can represent the terrestrial volcanoes mentioned in Section 2.3.
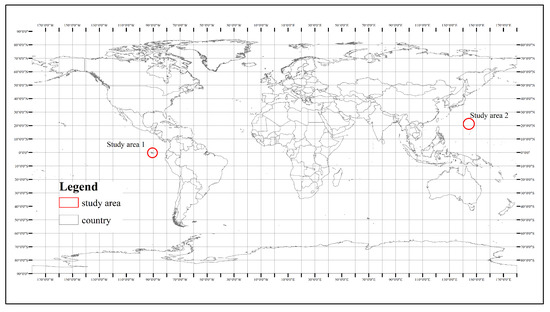
Figure 2.
The outline of the study area in the world map. Study Area 1 is Isabela Island in the Galapagos Islands. Study Area 2 is located in the northeastern Mariana Trench.
Another study area is the Mariana Trench (Figure 2 study area 2), an oceanic trench located in the western Pacific Ocean, about 200 km east of the Mariana Islands. There are many submarine volcanoes in the Mariana Trench, which do not have apparent craters. It can represent the submarine volcanoes mentioned in Section 2.3.
2.2. Input Data
Standardizing input data is of great significance for effectively identifying cone-shaped volcanoes. In this paper, cone-shaped volcanoes are recognized according to the shape characteristics of contour lines, and the input data is the vector data of contour lines in shapefile (.shp) format.
When there is no available contour line data, the DEM data of the study area can be downloaded, and the contour layer can be generated from the DEM. If there are holes or missing data in the DEM, the data must be repaired first. The specific requirements for generating contour lines are as follows:
- 1.
- The contour interval should not be too small, as that will increase the calculation workload. It highly depends on the type and size of the studied volcano. According to the experimental results, it is generally appropriate to set the range between 50 m and 300 m;
- 2.
- The features of contour lines should include elevation attributes;
- 3.
- The contour lines need to be processed by a smoothing operation. Contour lines are shown as broken line segments, which are stiff at corners and topographic changes. In order to make the contour line meet the visual requirements of being smooth and appropriate, it is necessary to smooth the contour line. Besides, the algorithm’s efficiency is mainly focused on the Hough transform. Compared with the original contour lines, smoothed contour lines can improve the efficiency of the Hough transform.
2.3. Characteristics of Cone-Shaped Volcanoes
The characteristic analysis is the basis and premise of cone-shaped volcanoes identification. A cone-shaped volcano is a volcano with a cone-shaped crater mainly composed of basalt and andesite basalt. The crater of a volcano is a basin-like depression over a vent at the summit of the cone, which is large at the top and small at the bottom. It is often funnel-shaped or bowl-shaped and is the outlet for volcanic material. The craters are generally less than 200–300 m in depth and less than 1 km in diameter [30].
For the contour line layer, the cone-shaped volcano usually has the following morphological features (Figure 3):
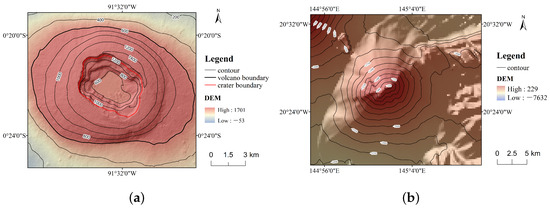
Figure 3.
Example of volcanic cone contour (color represents height): (a) Example of a terrestrial volcano (Mount La Cumbre of Galápagos Islands); (b) Example of a submarine volcano (seamount of Mariana Trench).
- 1.
- The contour lines of the cone-shaped volcano are usually a group of closed contour lines, approximately distributed in concentric circles;
- 2.
- For terrestrial cone-shaped volcanoes, from the center outwards, the elevation of the contour lines first increases and then decreases because of the crater. For the submarine volcano, we can also call it a seamount. It is technically defined as an isolated rise in elevation of 1000 m or more from the surrounding seafloor, with a limited summit area, of the conical form [31]. A seamount does not have an obvious crater, and its elevation monotonically increases from the outside to the inside;
- 3.
- The aspect ratio of the minimum bounding rectangle (MBR) is close to 1, usually within the interval [0.8, 1].
2.4. Preliminary Filtering of Contour Lines
Using the closed characteristics of cone-shaped volcano contour lines, the area threshold, and the aspect-ratio threshold of MBR (defined by the user), many irrelevant contour lines can be quickly removed by filtering contour lines, which can greatly improve the efficiency of the algorithm. The area threshold depends on the closed area of the minimum volcanic contour in the study area.
The specific steps for filtering contour lines are as follows: Firstly, the unclosed contour lines are eliminated. Secondly, according to the delineation area of the contour lines, contour lines larger than the area threshold are selected. Finally, according to the aspect ratio of the MBR, the contour lines that obviously do not meet the shape characteristics of cone-shaped volcanoes are deleted.
2.5. Circular Contour Line Recognition Based on Random Hough Transform
2.5.1. Random Hough Transform
The Hough transform (HT) is a common feature-detection algorithm in image recognition. It is widely used in recognizing straight lines, triangles, and circles [32]. The classical HT is widely used for its robustness and accuracy. However, the algorithm has the following disadvantages: high computational consumption, low detection accuracy, vulnerability to noise, and the possibility of missing objects [33].
At present, the improved HT mainly focuses on reducing memory consumption and improving timeliness, the random Hough transform (RHT) manages to considerably overcome these shortcomings. The algorithm can map any n points in the space to the Hough parameter space. Once the count of a point in the Hough parameter space reaches the threshold, the shape can be extracted. This algorithm reduces memory consumption because it does not need to prepare the Hough parameter space (generally, the linked list structure is used to store data) and can overcome the shortcomings of the classical HT by improving computation speed. Xu and Oja’s [34] experiments indicated that the computation efficiency of the RHT is 80 times that of the HT.
The basic idea of circle recognition using RHT [35] is as follows (Formula (1)): firstly, three non-collinear edge points(, , ) are randomly selected in the image space. Then, they are transformed into a point in the parameter space by mapping ((x, y) to (, , radius)),and the number of points in the parameter space is accumulated circularly. Finally, the number of accumulated points in the parameter space is compared; if it is more than the threshold, it is a true circle.
2.5.2. Circular Contour Line Recognition Based on RHT
The contour lines of cone-shaped volcanoes are approximately a group of concentric circles, and the circles can be accurately identified by using the RTH. To verify the automated extraction algorithm of volcanoes, we developed software for the automatic recognition and mapping of cone-shaped volcanoes. The proposed methodology is the core module of the desktop program, which can be freely downloaded at https://github.com/Vencent6666/SGEDSystem.git (accessed on 17 December 2022). The algorithms were implemented using C# and Visual Studio 2017. The specific processing steps are as follows:
- 1.
- Take any contour line from the contour line set L, get all the points of , and put them into the point set P = | j = 0, 1, ⋯, m−1, where m is the point number of contour line ;
- 2.
- Randomly select three points from P, marked as , , and , respectively. The three degrees of freedom (, , radius) of the RHT are calculated according to Formula (2):where a = .x − .x, b = .y − .y, c = .x − .x, d = .y − .x, and e and f are calculated according to Formulas (3) and (4), respectively:
- 3.
- Organize related parameters into a tuple hc (Formula (5)). If there is no element in a tuple set HC, store it in a tuple set HC = { | k ∈ N} and go to Step 7:where , is the center point coordinate of the circle, radius is the radius of the circle, Poi = , , is the set of points on the current circle, and cnt is the count of the parameter group hc in the HC;
- 4.
- Traverse the set HC. If an element matches condition 1, then .cnt = .cnt + 1, and , , are assigned to .Poi. Otherwise, save hc into set HC and go to Step 7.Condition 1: (hc. ∈ (. − , . + )) & & (hc. ∈ ( . − , . + )) & & (hc.radius∈ (.radius − , .radius + )). where and are the preset threshold values of the circle center and radius. The symbol hck.() represents the corresponding members in ;
- 5.
- If .cnt > (Hough transform threshold), go to Step 6; otherwise, go to Step 7;
- 6.
- If the number of points of .Poi > (the minimum number of true circle points) ( ∈ [3,3*]), the contour line is stored in the circular contour line set L1; ., . and .radius are stored in the circular parameter set as the parameter set of the contour line, and the algorithm ends. Otherwise, .cnt = 0;
- 7.
- Repeat Step 2 to Step 6 until the number of elements in HC > . Where ≈ (10∼100) × /( ) [36] and is the minimum number of points of a true circle. In this paper, to simplify things, = 0.8 × m, meaning the true circle has 80% of its contour line points.
2.6. Concentric Circle Contour Line Grouping Based on Contour Trees
A contour tree is a data structure used to represent the spatial topological relationship of contour lines. The topological relationship mainly includes the inclusion relation and adjacency relation [37,38,39]. The construction process of a contour tree is the process of grouping contour lines. The construction of a contour tree can quickly find a group of concentric contour lines and get the topological relationship of contour lines. In this paper, the contour tree can easily compare elevations and count the number of cone-shaped volcanoes. It is the basis for the identification of volcanic cones.
This paper develops a method to group concentric circle contour lines based on the contour tree. The specific steps are as follows (Figure 4):
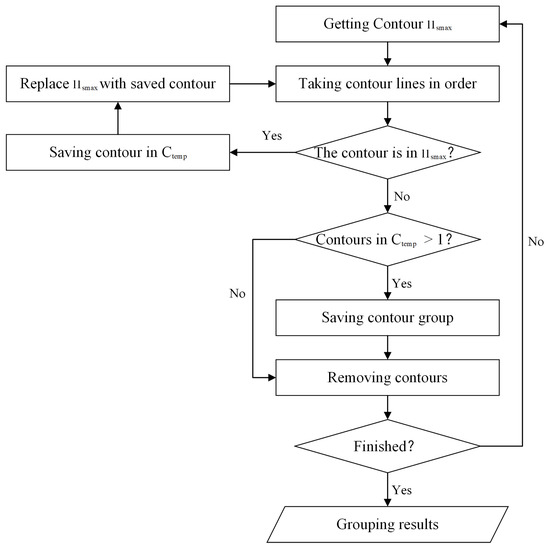
Figure 4.
Flow chart of the contour line grouping algorithm.
- 1.
- From largest to smallest, successively store each contour line in the set L1 in the set S = |j = 0, 1, 2, ⋯, v−1, where v is the number of circular contour lines in the set L1;
- 2.
- Traverse the set L1 and obtain each circular contour line’s center point p (., .). If there is a circular contour line within the MBR of (initially, it is the circular contour line with the largest area in S), assign it to the temporary circular contour line group . Update and continue to traverse;
- 3.
- If the number of circular contour lines in is greater than 1, the contour lines in are sorted in descending order according to the delineation area and stored as a subset in set C. Remove the delineation area corresponding to elements in from S;
- 4.
- Repeat Steps 2 and 3 until S is empty, and get the grouping result (as shown in Figure 5).
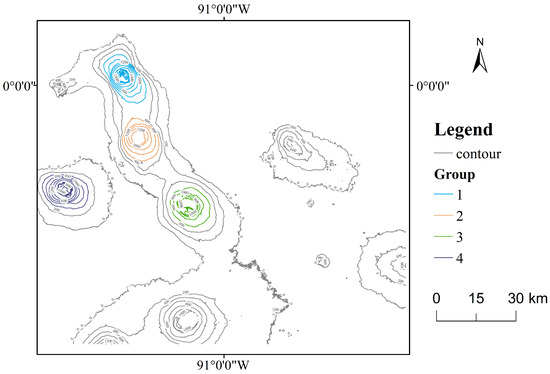 Figure 5. Example of grouping results (La Cumbre Mountain in Galápagos Islands). Groups 1 to 4 are concentric contour groups extracted by the approach.
2.7. Cone-Shaped Volcano Recognition Based on Concentric Contour Lines
Cone-shaped volcanoes can be identified based on whether the elevation of the contour lines follows the rules of “increase first and then decrease” or “gradually increase”. The degree of membership evaluated on the interval (0,1) was used to characterize the degree to which x belongs to A (x is the identified crater and A is the actual crater) [40]. If a volcano follows the rule of “increase first and then decrease”, it can be marked as a high degree of membership. Some submarine volcanoes, with no apparent craters, follow the “gradually increase” rule, which can be marked as a low degree of membership.
2.8. Cone-Shaped Volcano Mapping
According to the position information and attributes of the volcano, a cone volcano can be automatically mapped, which has important application value for tourism, engineering site selection, and natural resource exploration. The mapping of cone volcanoes mainly involves determining the geographical scope of volcanoes and calculating the related attributes.
First, the geographical scope of each cone-shaped volcano can be approximately regarded as a circular area centered on the crater. Therefore, the circle contour line with the largest area in each group can be regarded as the geographical scope of the cone-shaped volcano (Figure 6).
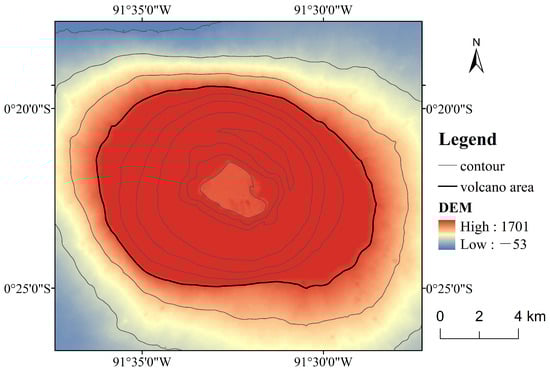
Figure 6.
=The geographical scope of a cone-shaped volcano (La Cumbre Mountain in Galápagos Islands).
Second, according to the geographical range of cone-shaped volcanoes, we can further calculate the perimeter, height, radius, overall area, profile shape, the slope of the edifice, and other attributes of each cone-shaped volcano [9]. The meanings and calculation methods of the related attributes are shown in the following Table 1.

Table 1.
Properties of cone volcanoes.
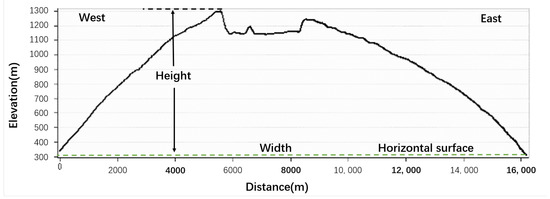
Figure 7.
The attributes of a cone-shaped volcano.
3. Case Studies
3.1. Case 1: Isabela Island Volcano Group
3.1.1. Study Area and Data
The Isabela Island volcano group (Galápagos Islands) is located in the Pacific Ocean 1000 km west of the South American continent. It was formed by repeated volcanism. There are tall volcanoes on the island; the highest is Wolf Volcano (1707 m), and the second highest, Azul mountain, is an extinct volcano (1689 m). Most of the islands have a typical cone shape, which is often associated with volcanic activity. The largest island, Isabela, is made up of six volcanoes. Due to limited DEM data, the experimental area is located from longitude of 90°1911 W to 91°414 W, latitude of 0°1211 N to 0°5546 S. There are five conical craters in the island volcano group (Figure 8a).
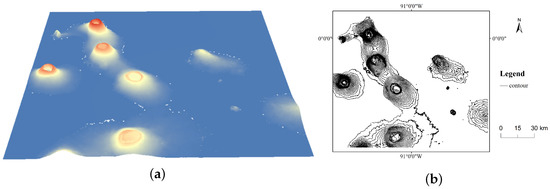
Figure 8.
The study area of the Galápagos Islands: (a) DEM data of the study area; (b) contour lines extracted from DEM data.
The experimental data from this study area is from 12.5 m resolution ALOS DEM (Figure 8a). It can be downloaded for free from https://search.asf.alaska.edu/#/ (accessed on 17 December 2022 ). The contour lines of the experimental area were extracted by ArcMap 10.6 (Figure 8b) and smoothed by Polynomial Approximation with Exponential Kernel (PAEK) algorithm [41], with a contour interval of 50 m. The geographic coordinate system of the data was WGS1984, and the projection was Transverse_Mercator.
3.1.2. Evaluation of Experimental Results
To verify the effectiveness of this method, we overlaid the recognition results on the contour line data of the experimental area and compared it with the results of expert visual interpretation.
In this experiment, the high degree of membership and low degree of membership was set to 0.9 and 0.8, respectively. The closer the degree of membership is to 1, the higher the possibility that identified crater belongs to the actual crater. The closer it is to 0, the lower the possibility that identified crater belongs to the actual crater.
In this paper, the standard missed alarm rate (MAR) and the false alarm rate (FAR) was used to quantitatively evaluate the effectiveness of the identification results [42].
where nMAD is the number of cone-shaped volcanoes missed by our proposed algorithm, nED is the number of cone-shaped volcanoes identified by experts, nFAD is the number of cone-shaped volcanoes mistakenly detected by our proposed algorithm, and nAD is the number of cone-shaped volcanoes detected by our proposed algorithm.
The recognition results of this case are shown in Figure 9a, which are compared with the results of expert interpretation (Figure 9b). The experts identified volcanoes using some extra data, such as the picture of the research area, geological survey report, and experience. The result can almost be regarded as actual. The method of this paper correctly identified five volcanoes. The MAR and FAR in this case, are both 0%. The experiment results are shown in Figure 10.
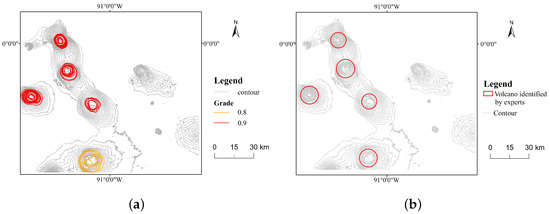
Figure 9.
Comparison of case 1: (a) cone-shaped volcanoes identified by our proposed algorithm; (b) cone-shaped volcanoes identified by experts.
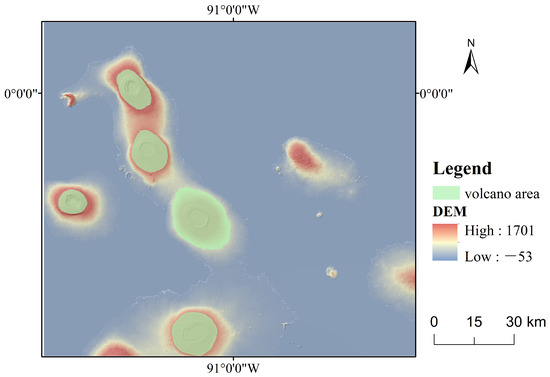
Figure 10.
Example of volcano range mapping (case 1). Volcanic areas marked in green.
3.2. Case 2: Submarine Volcanoes in the Mariana Trench
3.2.1. Study Area and Data
This study area, between the coordinates 142°5019 E, 19°540 N and 145°4222 E, 22°3844 N, is located in the northeastern Mariana Trench, where the plate subduction is very active. Many submarine volcanoes rise from a seafloor of 1000–4000 m in depth [43]. Most of the volcanoes have no typical crater, and the elevation of the contour lines increases monotonically. According to NOAA Pacific Marine Environmental Laboratory(PMEL) Earth-Ocean Interaction Program exploration results (https://oceanexplorer.noaa.gov/explorations/03fire/welcome.html, accessed on 17 December 2022), there are 10 conical volcanoes in the test area (Figure 11).
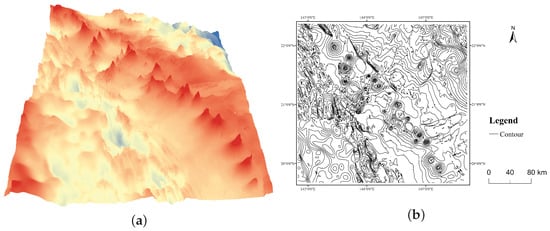
Figure 11.
The study area of the Mariana Trench: (a) DEM data of the study area; (b) contour lines extracted from DEM data.
The experimental data of this case were derived from the DEM generated by the bathymetric data, which was downloaded from the International Hydrographic Organization’s Data Centre (https://www.ncei.noaa.gov/maps/autogrid/, accessed on 17 December 2022). The data was obtained by sonar detection, but there are holes in the generated DEM. The undefined cells were filled with the ETOPO1 global relief model. The DEM data before and after background filling is shown in Figure 12a,b. The experimental data of this study area is 250 m resolution DEM, and the interval of the extracted contour lines is 250 m (Figure 11). The geographic coordinate system of the data is WGS1984, and the projection is World Mercator.
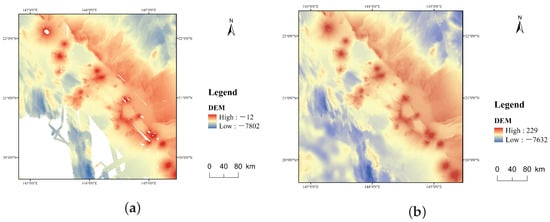
Figure 12.
Seabed DEM restoration: (a) DEM data before background filling. White stripes and bands are “no data” areas; (b) DEM data after background filling.
3.2.2. Evaluation of Experimental Results
The recognition results of this case are shown in Figure 13a. Compared with the results of expert interpretation (Figure 13b), the method of this paper correctly identified eight volcanoes, misidentified two volcanoes, and missed two volcanoes. The MAR and FAR in this case were 20%. The experiment result are shown in Figure 14.
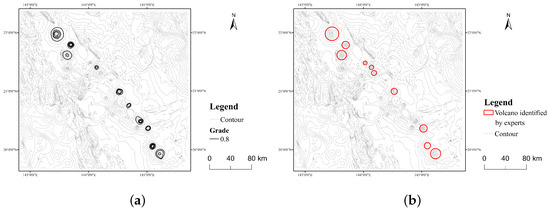
Figure 13.
Comparison of case 2: (a) cone-shaped volcanoes identified by our proposed algorithm; (b) cone-shaped volcanoes identified by experts.
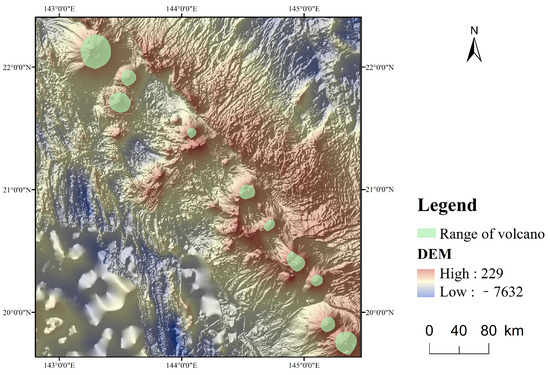
Figure 14.
Example of volcano range mapping (case 2). Volcanic areas are marked in green.
Some reasons might have caused the high MAR and FAR. Some submarine volcanoes do not have a typical conical shape, and some rise from a seafloor, becoming an island. Those reasons affect the algorithm’s ability to identify volcanoes correctly. However, there are estimated to be 40,000 to 55,000 seamounts in the global oceans [44]. Most of them have not been named or explored. Some unnamed submarine volcanoes were identified, most of which are not marked on maps.
4. Discussion
4.1. Stability of the Method
The algorithm uses RHT to identify circular contour lines with certain randomness. The results will be slightly different even if the parameters are the same.
In this paper’s automatic identification of cone-shaped volcanoes, the main factors affecting the identification result are area threshold, MBR aspect ratio threshold, Hough transform threshold, true circle minimum number, contour interval, the threshold of the center, and radius. Among them, the parameters affecting the algorithm’s efficiency are the area threshold and the MBR aspect-ratio threshold. Users set the value according to the application requirements to improve the algorithm’s efficiency. The parameters that affect the accuracy of the results are the center threshold and radius threshold . and are the thresholds of the center and radius; that is, the center and radius are regarded as the same value within a specific error range and can be set by themselves according to the contour line shape. Generally, it can be set as 1% of the map unit. For example, if the map unit is 1 km, the tolerance is set to 10 m.
The parameters that affect the accuracy of recognition results are (1) Hough transforms threshold , (2) the minimum number of true circles , and (3) contour interval. The following sections discuss these parameters, which greatly influence the accuracy of recognition results.
4.1.1. Contour Interval
Under the condition that all parameters remain unchanged, only the interval between contour lines is changed, and the different recognition results are shown in Figure 15.
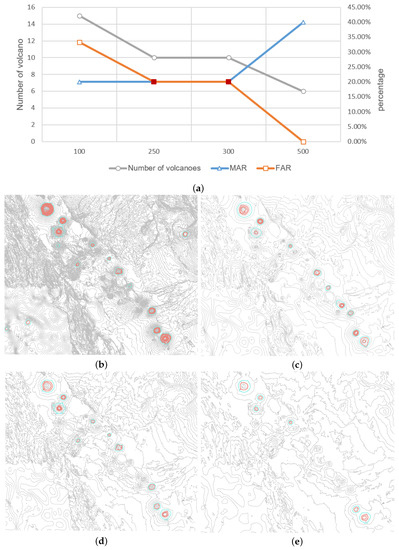
Figure 15.
Influence of the contour interval on recognition results: (a) The illustrated number of volcanoes and the MAR/FAR percentage of the identified results. Appropriate values are highlighted with red dots; (b) The recognition results of 100 m contour intervals; (c) The recognition results of 250 m contour intervals; (d) The recognition results of 300 m contour intervals; (e) The recognition results of 400 m contour intervals. Volcano contour lines are marked in red and volcano boundaries are marked in blue.
The experimental results show that the larger the contour interval, the fewer the number of identified cone-shaped volcanoes, the higher the miss detection rate, and the lower the false detection rate. On the contrary, contour lines that are too dense also have a certain impact on recognition efficiency. The best interval will depend on the type of volcano, its size range, and the type of DEM. According to the experimental results, it is relatively appropriate to set the contour interval between 50 m and 300 m.
4.1.2. Threshold of the Hough Transform
The following comparative experiments were carried out using the experimental data from Case 2. The area threshold, the length-width ratio threshold of MBR, the center threshold, the radius threshold, and the minimum number of true circles were always equal to 0.001, 1.2, 0.2, 0.2, and 7, respectively. The threshold values of the Hough transform were set to 4, 7, 10, 13, 16, 19, and 22, respectively. The experimental results are shown in Figure 16a.
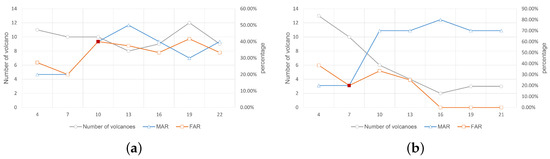
Figure 16.
The influence of and : (a) The number of volcanoes and MAR/FAR percentage by each ; (b) The number of volcanoes and MAR/FAR percentage by each Th6. The appropriate values are highlighted with red dots.
The experimental results show that the larger the threshold value of the Hough transform, the closer the shape of the extracted cone-shaped volcano is to a circle. Changing the threshold has little effect on the number of identified volcanoes. When the threshold value of the Hough transform reaches a specific value, MAR and FAR tend to be stable.
4.1.3. Minimum Number of True Circle Points
The following comparative experiments were carried out using the experimental data from Case 2. The area threshold, the length-width ratio threshold of MBR, the center threshold, the radius threshold, and the Hough transform threshold were always equal to 0.001, 1.2, 0.2, 0.2, and 7, respectively. The threshold values of the minimum number of true circle points were set to 4, 7, 10, 13, 16, 19, and 21, respectively. The experimental results are shown in Figure 16b.
The experimental results show that when the minimum number of true circles is relatively large, it will identify fewer volcano cones and lead to a higher MAR and lower FAR. According to the experimental results, it is relatively appropriate to set the minimum number of true circles between 3 and 7.
4.2. Applicability of the Method
The results show that the proposed method can identify the typical conical volcano, which is basically consistent with the expert identification results. However, for cone-shaped volcanoes that have been eroded by external forces for a long time and do not have complete craters, such as eroded dormant volcanoes, extinct volcanoes, and collapsed ancient calderas, the recognition effect will be affected. Moreover, for a small cone-shaped volcano with slight fluctuation, the contour interval greatly influences the recognition effect. Especially in the submarine volcano identification, the method is limited by the data quality of the seabed DEM.
Although the algorithm proposed in this paper is designed for conical volcanoes, it cannot directly identify non-conical volcanoes (such as shield volcanoes). However, the morphological characteristics of contour lines based on this paper can also be applied to identifying non-conical volcanoes. For example, the main distinguishing features of shield volcanoes are that the contour lines are closed and circular, and the contour elevations gradually increase from the outside to the inside, etc. The proposed method can also identify shield volcanoes by adjusting the relevant identification rules and parameter thresholds.
The recognition algorithm of this paper can be used to identify cone-shaped landforms, such as craters, sinkholes, stone peaks, stone forests, etc. Furthermore, the method has a reference value for recognizing the geomorphic types with apparent morphological features, such as dunes, domes, etc. Further work can be extended by adding new cone-volcano characteristics, such as height difference, slope, and aspect.
4.3. Comparison between the Proposed Algorithm and the Raster Image Algorithms
The circular Hough transform method using raster images has a good recognition effect on craters and a good recognition effect on discontinuous edges [20]. However, the difficulty is that the computational and memory requirements of the Hough transform grow exponentially as the number of parameters increases.
Compared with raster image/DEM, the algorithm proposed in this paper uses contour data to identify volcanoes. This method mainly has the following features: firstly, contour data contain not only the morphological characters but also composite features such as spatial structure and statistical features; secondly, compared with remote sensing images, the data value of contour is less, performs more efficiently, and is suitable for large-scale recognition, which can avoid the omission of volcanoes at the boundary during DEM segmentation recognition; finally, the RTH method does not need to prepare Hough parameter space and has low memory consumption.
5. Conclusions
Given the problems of low efficiency, difficulty in large-scale identification, and low availability of existing methods, an automatic identification and mapping method of conical volcanoes based on HT was proposed. The advantages of this algorithm are as follows: first, considering the three-dimensional shape characteristics of conical volcanoes and avoiding the impact of data segmentation on volcanic integrity, this method has high accuracy; secondly, using contour line data, which is smaller than traditional remote sensing images and DEM, the algorithm has higher execution efficiency and can be used for volcano identification on a larger scale. Experiments on the Isabella volcano group and the Mariana Trench submarine volcano group demonstrate that the proposed algorithm has a low missed alarm rate and low false alarm rate, which is basically consistent with the results of expert recognition.
The method of this paper has practical value for the automatic recognition of cone-shaped volcanoes. It can also be applied to the automatic recognition of cone-shaped landforms, such as craters, sinkholes, stone peaks, and stone forests. The method presented in this paper is a powerful means to support deep-space and deep-sea exploration and has great significance for the volcanic exploration of the seabed and other planets.
Author Contributions
H.L. and W.N.; developed the main modules of the prototype system conceived and is the main author of the article. W.N.; designed the study. A.L.; guided the way of writing. H.S.; review and editing. All authors have read and agreed to the published version of the manuscript.
Funding
This study was supported by the National Natural Science Foundation of China (Project No. 41971068, 41771431) and the National Key R & D Program of China (No. 2022YFB3904104).
Institutional Review Board Statement
Not applicable.
Informed Consent Statement
Not applicable.
Data Availability Statement
All data included in this study are available upon request by contact with the corresponding author.
Conflicts of Interest
The researcher claims no conflicts of interests.
Abbreviations
The following abbreviations are used in this manuscript:
| DEM | Digital Elevation Models |
| MBR | Minimum Bounding Rectangle |
| HT | Hough Transform |
| RHT | Random Hough Transform |
| MAR | Missed Alarm Rate |
| FAR | False Alarm Rate |
| NOAA | National Oceanic and Atmospheric Administration(USA) |
| PAEK | Polynomial Approximation with Exponential Kernel |
| PEML | Pacific Marine Environmental Laboratory |
| ETOPO1 | The ETOPO1 1-arcmin global relief model |
| The area threshold | |
| The aspect-ratio threshold of MBR | |
| The threshold values of the circle center | |
| The threshold values of the circle radius | |
| The Threshold of Hough transform | |
| Minimum number of true circle points |
References
- Erfurt-Cooper, P.; Cooper, M. Volcano and Geothermal Tourism: Sustainable Geo-Resources for Leisure and Recreation. 2010. Available online: https://www.routledge.com/search?sb=SCES (accessed on 17 December 2022).
- Fiantis, D.; Ginting, F.I.; Nelson, M.; Minasny, B. Volcanic ash, Insecurity for the people but securing fertile soil for the future. Sustainability 2019, 11, 3072. [Google Scholar] [CrossRef]
- Euillades, L.D.; Grosse, P.; Euillades, P.A. NETVOLC: An algorithm for automatic delimitation of volcano edifice boundaries using DEMs. Comput. Geosci. 2013, 56, 151–160. [Google Scholar] [CrossRef]
- Parra, E.; Cepeda, H. Volcanic hazard maps of the Nevado del Ruiz volcano, Colombia. J. Volcanol. Geotherm. Res. 1990, 42, 117–127. [Google Scholar] [CrossRef]
- Mouginis-Mark, P.J.; Pieri, D.C.; Francis, P.W.; Wilson, L.; Self, S.; Rose, W.I.; Wood, C.A. Remote sensing of volcanos and volcanic terrains. Eos Trans. Am. Geophys. Union 1989, 70, 1567–1575. [Google Scholar] [CrossRef]
- Corazzato, C.; Tibaldi, A. Fracture control on type, morphology and distribution of parasitic volcanic cones: An example from Mt. Etna, Italy. J. Volcanol. Geotherm. Res. 2006, 158, 177–194. [Google Scholar] [CrossRef]
- Beggan, C.; Hamilton, C.W. New image processing software for analyzing object size-frequency distributions, geometry, orientation, and spatial distribution. Comput. Geosci. 2010, 36, 539–549. [Google Scholar] [CrossRef]
- Cimarelli, C.; Di Traglia, F.; De Rita, D.; Torrente, D.G. Space–time evolution of monogenetic volcanism in the mafic Garrotxa Volcanic Field (NE Iberian Peninsula). Bull. Volcanol. 2013, 75, 1–18. [Google Scholar] [CrossRef]
- Grosse, P.; de Vries, B.V.W.; Euillades, P.A.; Kervyn, M.; Petrinovic, I.A. Systematic morphometric characterization of volcanic edifices using digital elevation models. Geomorphology 2012, 136, 114–131. [Google Scholar] [CrossRef]
- Di Traglia, F.; Morelli, S.; Casagli, N.; Monroy, V.H.G. Semi-automatic delimitation of volcanic edifice boundaries: Validation and application to the cinder cones of the Tancitaro–Nueva Italia region (Michoacán–Guanajuato Volcanic Field, Mexico). Geomorphology 2014, 219, 152–160. [Google Scholar] [CrossRef]
- Wiles, C.R.; Forshaw, M.R.B. Recognition of volcanoes on Venus using correlation methods. Image Vis. Comput. 1993, 11, 188–196. [Google Scholar] [CrossRef]
- Zhang, C.; Chen, J.P. Advances in the study of automatic identification and classification of lunar impact craters. J. Geol. 2019, 3, 514–522. [Google Scholar]
- Forshaw, M.R.B.; Wiles, C.R. Counting volcanoes on Venus: Comparison between humans, computers and theory. In Proceedings of the Fifth International Conference on Image Processing and Its Applications, Edinburgh, UK, 4–6 July 1995; pp. 65–69. [Google Scholar] [CrossRef]
- Kereszturi, G.; Schaefer, L.N.; Schleiffarth, W.K.; Procter, J.; Pullanagari, R.R.; Mead, S.; Kennedy, B. Integrating airborne hyperspectral imagery and LiDAR for volcano mapping and monitoring through image classification. Int. J. Appl. Earth Obs. Geoinf. 2018, 73, 323–339. [Google Scholar] [CrossRef]
- Cao, Z.T.; Li, A.B.; Lv, G.N. A Cone Volcano Automatic Recognition Method. China Patent CN110188214B, 26 January 2021. [Google Scholar]
- Stepinski, T.F.; Ghosh, S.; Vilalta, R. Machine learning for automatic mapping of planetary surfaces. In Proceedings of the National Conference on Artificial Intelligence, Vancouver, BC, Canada, 22–26 July 2007; p. 1807. [Google Scholar]
- Honda, R.; Konishi, O.; Azuma, R.; Yokogawa, H.; Yamanaka, S.; Iijima, Y. Data mining system for planetary images-crater detection and categorization. In Proceedings of the International Workshop on Machine Learning of Spatial Knowledge in Conjunction with ICML, Stanford, CA, USA, August 2000; pp. 103–108. Available online: https://citeseerx.ist.psu.edu/document?repid=rep1&type=pdf&doi=af887236fef6b059040a2889e4a3cf1e9b8b7884 (accessed on 17 December 2022).
- Chen, W.T.; Yan, B.K.; Zhang, Z. The Identification of special targets based on spatial features of CHANG’E-1. Remote Sens. Land Resour. 2009, 4, 40–44. [Google Scholar]
- Kim, J.R.; Muller, J.-P.; van Gasselt, S.; Morley, J.G.; Neukum, G. Automated crater detection, a new tool for Mars cartography and chronology. Photogramm. Eng. Remote Sens. 2005, 71, 1205–1217. [Google Scholar] [CrossRef]
- Liu, Y.X.; Liu, J.J.; Mou, L.L.; Li, C.L. Review of impact crater identification methods. Astron. Res. Technol. 2012, 2, 203–212. [Google Scholar] [CrossRef]
- Urbach, E.R.; Stepinski, T.F. Automatic detection of sub-km craters in high resolution planetary images. Planet. Space Sci. 2009, 57, 880–887. [Google Scholar] [CrossRef]
- Burl, M.C.; Fayyad, U.M.; Perona, P.; Smyth, P.; Burl, M.P. Automating the hunt for volcanoes on Venus. In Proceedings of the IEEE Conference on Computer Vision and Pattern Recognition, Seattle, WA, USA, 21–23 June 1994; pp. 302–309. [Google Scholar] [CrossRef]
- Asker, L.; Maclin, R. Feature engineering and classier selection: A case study in Venusian volcano detection. In Proceedings of the Fourteenth International Conference on Machine Learning, Nashville, TN, USA, 8–12 July 1997; pp. 3–11. [Google Scholar]
- Bohnenstiehl, D.R.; Howell, J.K.; White, S.M.; Smyth, P.; Hey, R.N. A modified basal outlining algorithm for identifying topographic highs from gridded elevation data, Part 1: Motivation and methods. Comput. Geosci. 2012, 49, 308–314. [Google Scholar] [CrossRef]
- Howell, J.K.; White, S.M.; Bohnenstiehl, D.R. A modified basal outlining algorithm for identifying topographic highs in gridded elevation data, part 2: Application to Springerville Volcanic Field. Comput. Geosci. 2012, 49, 315–322. [Google Scholar] [CrossRef]
- Wang, D.; Xing, S.; Xu, Q.; Geng, X.; Shi, Q.S. An automatic extraction method of impact craters on the surface of deep space stars based on 3D topography. J. Surv. Mapp. Sci. Technol. 2015, 6, 619–625. [Google Scholar]
- Zuo, W.; Zhang, Z.; Li, C.; Wang, R.; Yu, L.; Geng, L. Contour-based automatic crater recognition using digital elevation models from Chang’E missions. Comput. Geosci. 2016, 97, 79–88. [Google Scholar] [CrossRef]
- Liu, Y.X.; Li, C.L.; Liu, J.J. A small impact pit recognition method based on contour. Astron. Res. Technol. 2018, 4, 479–486. [Google Scholar] [CrossRef]
- Wu, W.; Li, C.; Wu, Z.; Yin, Y. Automatic recognition method of primary path for an anastomosing river based on its typical features. Trans. GIS 2021, 25, 1577–1598. [Google Scholar] [CrossRef]
- McGeary, D.; Plummer, C.C.; Carlson, D.H. Physical Geology Earth Revealed Fifth Edition; McGraw-Hill: New York, NY, USA, 2004. [Google Scholar]
- Hillier, J.K. Seamount detection and isolation with a modified wavelet transform. Basin Res. 2008, 20, 555–573. [Google Scholar] [CrossRef]
- Duda, R.O.; Hart, P.E. Use of the Hough transformation to detect lines and curves in pictures. Commun. ACM 1972, 15, 11–15. [Google Scholar] [CrossRef]
- Xu, L.; Oja, E. Randomized hough transform. In Encyclopedia of Artificial Intelligence; IGI Global: Hershey, PA, USA, 2009; pp. 1343–1350. [Google Scholar]
- Xu, L.; Oja, E.; Kultanen, P. A new curve detection method: Randomized Hough transform (RHT). Pattern Recognit. Lett. 1990, 11, 331–338. [Google Scholar] [CrossRef]
- Cross, A.M. Detection of circular geological features using the Hough transform. Int. J. Remote Sens. 1988, 9, 1519–1528. [Google Scholar] [CrossRef]
- Xu, L.; Oja, E. Randomized Hough transform (RHT): Basic mechanisms, algorithms, and computational complexities. CVGIP Image Underst. 1993, 57, 131–154. [Google Scholar] [CrossRef]
- Wu, Q.; Liu, H.; Wang, S.; Yu, B.; Beck, R.; Hinkel, K. A localized contour tree method for deriving geometric and topological properties of complex surface depressions based on high-resolution topographical data. Int. J. Geogr. Inf. Sci. 2015, 29, 2041–2060. [Google Scholar] [CrossRef]
- Wang, S.; Wu, Q.; Ward, D. Automated delineation and characterization of drumlins using a localized contour tree approach. Int. J. Appl. Earth Obs. Geoinf. 2017, 62, 144–156. [Google Scholar] [CrossRef]
- Zhang, W. Research on construction method of contour tree based on contour cluster. Sci. Technol. Innov. 2017, 22, 69–70. [Google Scholar]
- Goguen, J.A. L-fuzzy sets. J. Math. Anal. Appl. 1967, 18, 145–174. [Google Scholar] [CrossRef]
- Bodansky, E.; Gribov, A.; Pilouk, M. Smoothing and compression of lines obtained by raster-to-vector conversion. In Proceedings of the Graphics Recognition Algorithms and Applications: 4th International Workshop, Kingston, ON, Canada, 7–8 September 2002; pp. 256–265. [Google Scholar] [CrossRef]
- Xu, S.Y.; Li, A.B.; Dong, T.T.; Xie, X.L. Automatic mapping of river canyons using a digital elevation model and vector river data. Earth Sci. Inform. 2021, 14, 505–519. [Google Scholar] [CrossRef]
- Nybakken, J.W.; Bertness, M.D. Marine Biology: An Ecological Approach, 6th ed.; Benjamin Cummings: San Francisco, CA, USA, 2008. [Google Scholar]
- Kim, S.S.; Wessel, P. New global seamount census from altimetry-derived gravity data. Geophys. J. Int. 2011, 186, 615–631. [Google Scholar] [CrossRef]


Disclaimer/Publisher’s Note: The statements, opinions and data contained in all publications are solely those of the individual author(s) and contributor(s) and not of MDPI and/or the editor(s). MDPI and/or the editor(s) disclaim responsibility for any injury to people or property resulting from any ideas, methods, instructions or products referred to in the content. |
© 2023 by the authors. Licensee MDPI, Basel, Switzerland. This article is an open access article distributed under the terms and conditions of the Creative Commons Attribution (CC BY) license (https://creativecommons.org/licenses/by/4.0/).