Article

Frequency, Intensity and Influences of Tropical Cyclones in the Northwest Pacific and China, 1977–2018

College of Marine Sciences, Shanghai Ocean University, Hucheng Ring Road 999, Shanghai 201203, China
*
Author to whom correspondence should be addressed.
Sustainability 2023, 15(5), 3933; https://doi.org/10.3390/su15053933
Submission received: 20 November 2022 / Revised: 31 January 2023 / Accepted: 9 February 2023 / Published: 21 February 2023

Abstract

:
China is part of the western Pacific region, which is the source of the most frequent tropical cyclones in the world. These cause severe disasters each year, including huge economic losses and casualties. To better understand their frequency and intensity, remote sensing tropical cyclone data were obtained for the entire Northwest Pacific region for the period 1977–2018. MATLAB and ArcGIS were used to analyse the frequency and intensity of tropical cyclones and their characteristics in various regions of China. At the same time, the influence factors of tropical cyclone characteristics such as El Niño and SST were analyzed by correlation analysis and Geographical detector. The annual frequency of tropical cyclones in the Northwest Pacific showed a fluctuating state, but the overall trend was decreasing. In particular, since 1994, the overall frequency decreased significantly but rebounded in recent years, while the intensity did not change significantly. It was found that cyclone intensity is lower when the frequency is higher, and vice versa. 85% of tropical cyclones occurred in summer and autumn, with the highest intensities in autumn, when the maximum average wind speed peaks at 37 m/s. The area with the most frequent tropical cyclones was 5–20° N, 125–155° E. A total of 314 tropical cyclones arrived in China during the study period, an average of about 7.5 per year. Their frequency and intensity gradually decreased as they moved from coastal to inland areas. Both SST and El Niño are significantly related to the formation and development of tropical cyclones, and the contribution of multiple factors interaction to the variation characteristics of tropical cyclones is significantly higher than that of single factors. Understanding the characteristics of the Pacific tropical cyclones is an important step in planning disaster prevention framework.

1. Introduction

Tropical cyclones are low-pressure eddies that occur on the ocean surface in the tropics or subtropics. According to Chinese standard GB/T 19201-2006, they can be divided into six grades: tropical depressions, tropical storms, severe tropical storms, typhoons, severe typhoons, and super typhoons [1,2]. Tropical cyclones have the characteristics of great destructive power and often cause huge economic losses and casualties. According to many studies, they are considered to be one of the world’s most serious types of natural disasters [3,4]. China is located in the most active tropical cyclone area of the Northwest Pacific Ocean, and a large number of tropical cyclones land on its coastal areas each year [5,6]. Hence, China has some of the worst tropical cyclone disasters in the world.
The trends in the characteristics of tropical cyclone frequency, intensity, wind speed, and landfall in the northwest Pacific have been previously reported in the literature. However, the conclusions and employed methods are not the same. In general, in the context of global warming [7], SST is significantly affected, the frequency of tropical cyclones in the northwest Pacific is significantly fluctuating, and the total number of landfall tropical cyclones is also on a downward trend. Nonetheless, the overall trend is stable, and the extreme wind speed is fluctuating. At the same time, tropical cyclones in the West Indian Ocean, the Indo-Pacific Ocean, and other sea areas also exhibit the same downward trend [8,9,10,11,12,13]. However, there is still some discussion on whether the frequency of strong tropical cyclones is decreasing. Some works in the literature suggest that anthropogenic aerosol emissions have a cooling effect on climate [14], which in turn can offset the contribution of global warming to the frequency of strong tropical cyclones. As a result, an increasing trend in the frequency of strong tropical cyclones in the northwest Pacific during summer and autumn is induced [15,16]. According to the statistics of the different types of tropical cyclone data in different seasons, it was found that the frequency of tropical cyclones was higher in summer and autumn, while the intensity of tropical cyclones was higher in autumn than in summer [17,18]. Moreover, the frequency of tropical cyclones was lower in spring and winter, and the intensity of tropical cyclones was lower in spring than in winter [19].
In addition, climate changes also lead to changes in tropical cyclone landfall locations. In China, for example, the average generation location of tropical cyclones gradually shifted to the northwest [20], where vertical wind shear and changes in local SST are the main driving causes of the location shift [17,21]. Interestingly, the westerly generation location of tropical cyclones combined with changes in the guiding airflow leads to a reduction in landfall in the southeast and the frequency of tropical cyclones in southeastern and southern China year by year, whereas the annual average landfall intensity increases year by year and the landfall sites are more concentrated [22,23,24].
In terms of tropical cyclone influence mechanisms, a large number of works have shown that the northwest Pacific tropical cyclone is mainly influenced by sea surface temperature (SST), the El Niño phenomenon, and ambient wind vertical shear [10,25,26,27,28,29,30,31]. Among them, sea surface temperature and El Niño have the most significant impact on tropical cyclones. During the process of exploring the underlying mechanism of SST in tropical cyclones, Chen and Huang [25] found that there is a good correlation between SST anomalies in the tropical western Pacific Ocean and the geographical distribution and path type of tropical cyclones. Additionally, Zhan et al. found that the coverage of SST anomalies in the East Indian Ocean (EIO) has been expanding since the late 1970s, which significantly enhanced the influence of EIO SSTA on the frequency of tropical cyclone generation over the northwest Pacific [10]. Zhan demonstrated that the spring SST gradient (SSTG) between the southwest and northwest Pacific could explain 53% of the total variance of tropical cyclone generation frequency in the northwest Pacific during the 1980–2011 typhoon season [32].
ENSO can also significantly influence the properties of tropical cyclones. There are two types of El Niño, namely the Eastern Pacific (EP) El Niño (or typical El Niño) and the Central Pacific (CP) El Niño (or Modoki). Different types of El Nino lead to a variety of temporal and spatial characteristics of atmospheric circulation and affect tropical cyclone activities in the Northwest Pacific in different ways. Wang et al. found that typical ENSO events lead to an eastward shift in the mean position of tropical cyclone production over the northwest Pacific (WNP) [26]. In another interesting work, Chen and Tam reported a significant positive correlation between ENSO Modoki and Northwest Pacific tropical cyclone frequency [33]. However, from the relationship between the tropical cyclone frequency and Niño 3 index, there was no significant correlation due to the mutual offset of tropical cyclone frequency enhancement and weakening in different regions was revealed. In subsequent work, Kim et al. classified three modes based on the location and intensity of SSTs in the central and eastern tropical Pacific Ocean. The authors concluded that the warm ENSO mode is closely related to the frequency of tropical cyclones in the northwest Pacific Ocean based on the Niño 3 index [27]. Wu et al. further classified them into four modes and concluded that central-type SST warming plays a major controlling role in the tropical cyclones in the northwest Pacific Ocean [28].
A number of studies on tropical cyclones in the Northwest Pacific region have shown that although their frequency has decreased, their intensity levels, influence areas, and durations all exhibit clear trends of intensification [22,34,35]. Most studies on Northwest Pacific tropical cyclones have only made simple frequency and intensity analyses, which lack consideration of their specific impacts on China. This paper makes a comprehensive statistical analysis of the activity of tropical cyclones in the Northwest Pacific and China and discusses their influencing factors. Analysing the variations and causes of tropical cyclones will help us better understand them, thus providing a basis for their monitoring and forecasting and the formulation of disaster mitigation measures.

2. Data and Methods

2.1. Data Sources

Tropical cyclone data was obtained from the tropical cyclone point dataset of Japan’s National Institute of Information Science (NII). It uses tropical cyclone images acquired by continuous geostationary meteorological satellites, such as Himawari, Goes, GMS, and MTSAT, to construct a massive spatiotemporal scientific database. The tropical cyclone data used in this paper includes the tracks, times, intensities, and the central point wind speeds of all tropical cyclones in the western Pacific from 1977 to 2018. Figure 1 shows the tracks of western Pacific tropical cyclones from 1977 to 2018; the time interval between two consecutive path points in each tropical cyclone is 6 h.
The data used for the analysis of the factors influencing tropical cyclones include (1) sea surface temperatures (SSTs) in the Central and Eastern Pacific Ocean near the Equator, Eastern Indian Ocean(EIO) (0° S–22.5° N, 75–100° E), Southwest Pacific (SWP) (40°–20° S, 160° E–170° W) and location in (0°–16° N, 125° to 165° E) of the western Pacific warm pool (wp), and (2) El Niño-related data from 1977 to 2018. The SST data were remote sensing data obtained from the European Centre for Medium-Range Weather Forecasts (https://apps.ecmwf.int, accessed on 30 December 2020). El Niño data were downloaded from http://www.cpc.ncep.noaa.gov/data/indices/sstoi.indices (accessed on 26 May 2019), from which the Niño3 index represents the mean sea surface temperature anomaly in the area of 5° N–5° S, 150° W–90° W. An abnormally high SST is an important indicator of El Niño events.

2.2. Research Methods

Track data were used to analyse the timing and intensity of western Pacific tropical cyclones that made landfall. Statistical and exponential moving average methods were used to study their interannual, intermonthly, and regional distributions.
In the analysis of the variation characteristics and influencing factors of tropical cyclones, a geographic detector was used to study the variation characteristics of tropical cyclones in the different regions of the Northwest Pacific, such as the correlation between the frequency, intensity, and influencing factors. The geographical detector is essentially a statistical method that can reveal the spatial heterogeneity of the research object and explore the driving factors behind it [36]. The main principle is that when an independent variable has an important influence on the dependent variable, the spatial distribution of the independent variable is similar to that of the dependent variable. The basic idea of this method is to divide the study area into several sub-regions [37] and examine the difference between the variance of the sub-region and the variance of the whole region.
q = 1   h = 1 L N h σ h 2 N σ 2
In the formula, h = 1… L denotes the partition of the research object or factor, N h and N represent the number of units in the partition h and the whole region, σ h 2 and σ 2 stand for the variance of the partition h and the whole region, q represents the difference between the variance of the sub-region and the variance of the whole region and quantitatively reveals the interaction between the impact factor and the study object. The range of the q value is [0, 1], and when the q value is close to 1, the contribution rate of the factor to the research object is higher.
In this work, the factor detector and interaction detector were chosen since the factor detector can quantitatively evaluate the contribution of each factor to the research object. However, there will be some contingency in using the interaction detector to evaluate whether the two factors could enhance or weaken the impact on the variation characteristics of the tropical cyclones or whether these factors were independent of each other [37]. The basic method is to superimpose the X1 and X2 variable layers and take the overlapping part to form a new layer. The interaction q(X1 ∩ X2) was calculated and compared with q(X1) and q(X2). The interaction type between each other was also determined and is presented in Table 1. On the basis of quantitative evaluation, the interaction detector can effectively avoid the one-sidedness caused by single factor analysis and explain the contribution of two-factor combinations to the research object under different conditions in more detail. Therefore, it is more suitable for investigating complex and changeable tropical cyclones and marine environments.

3. Results and Analysis

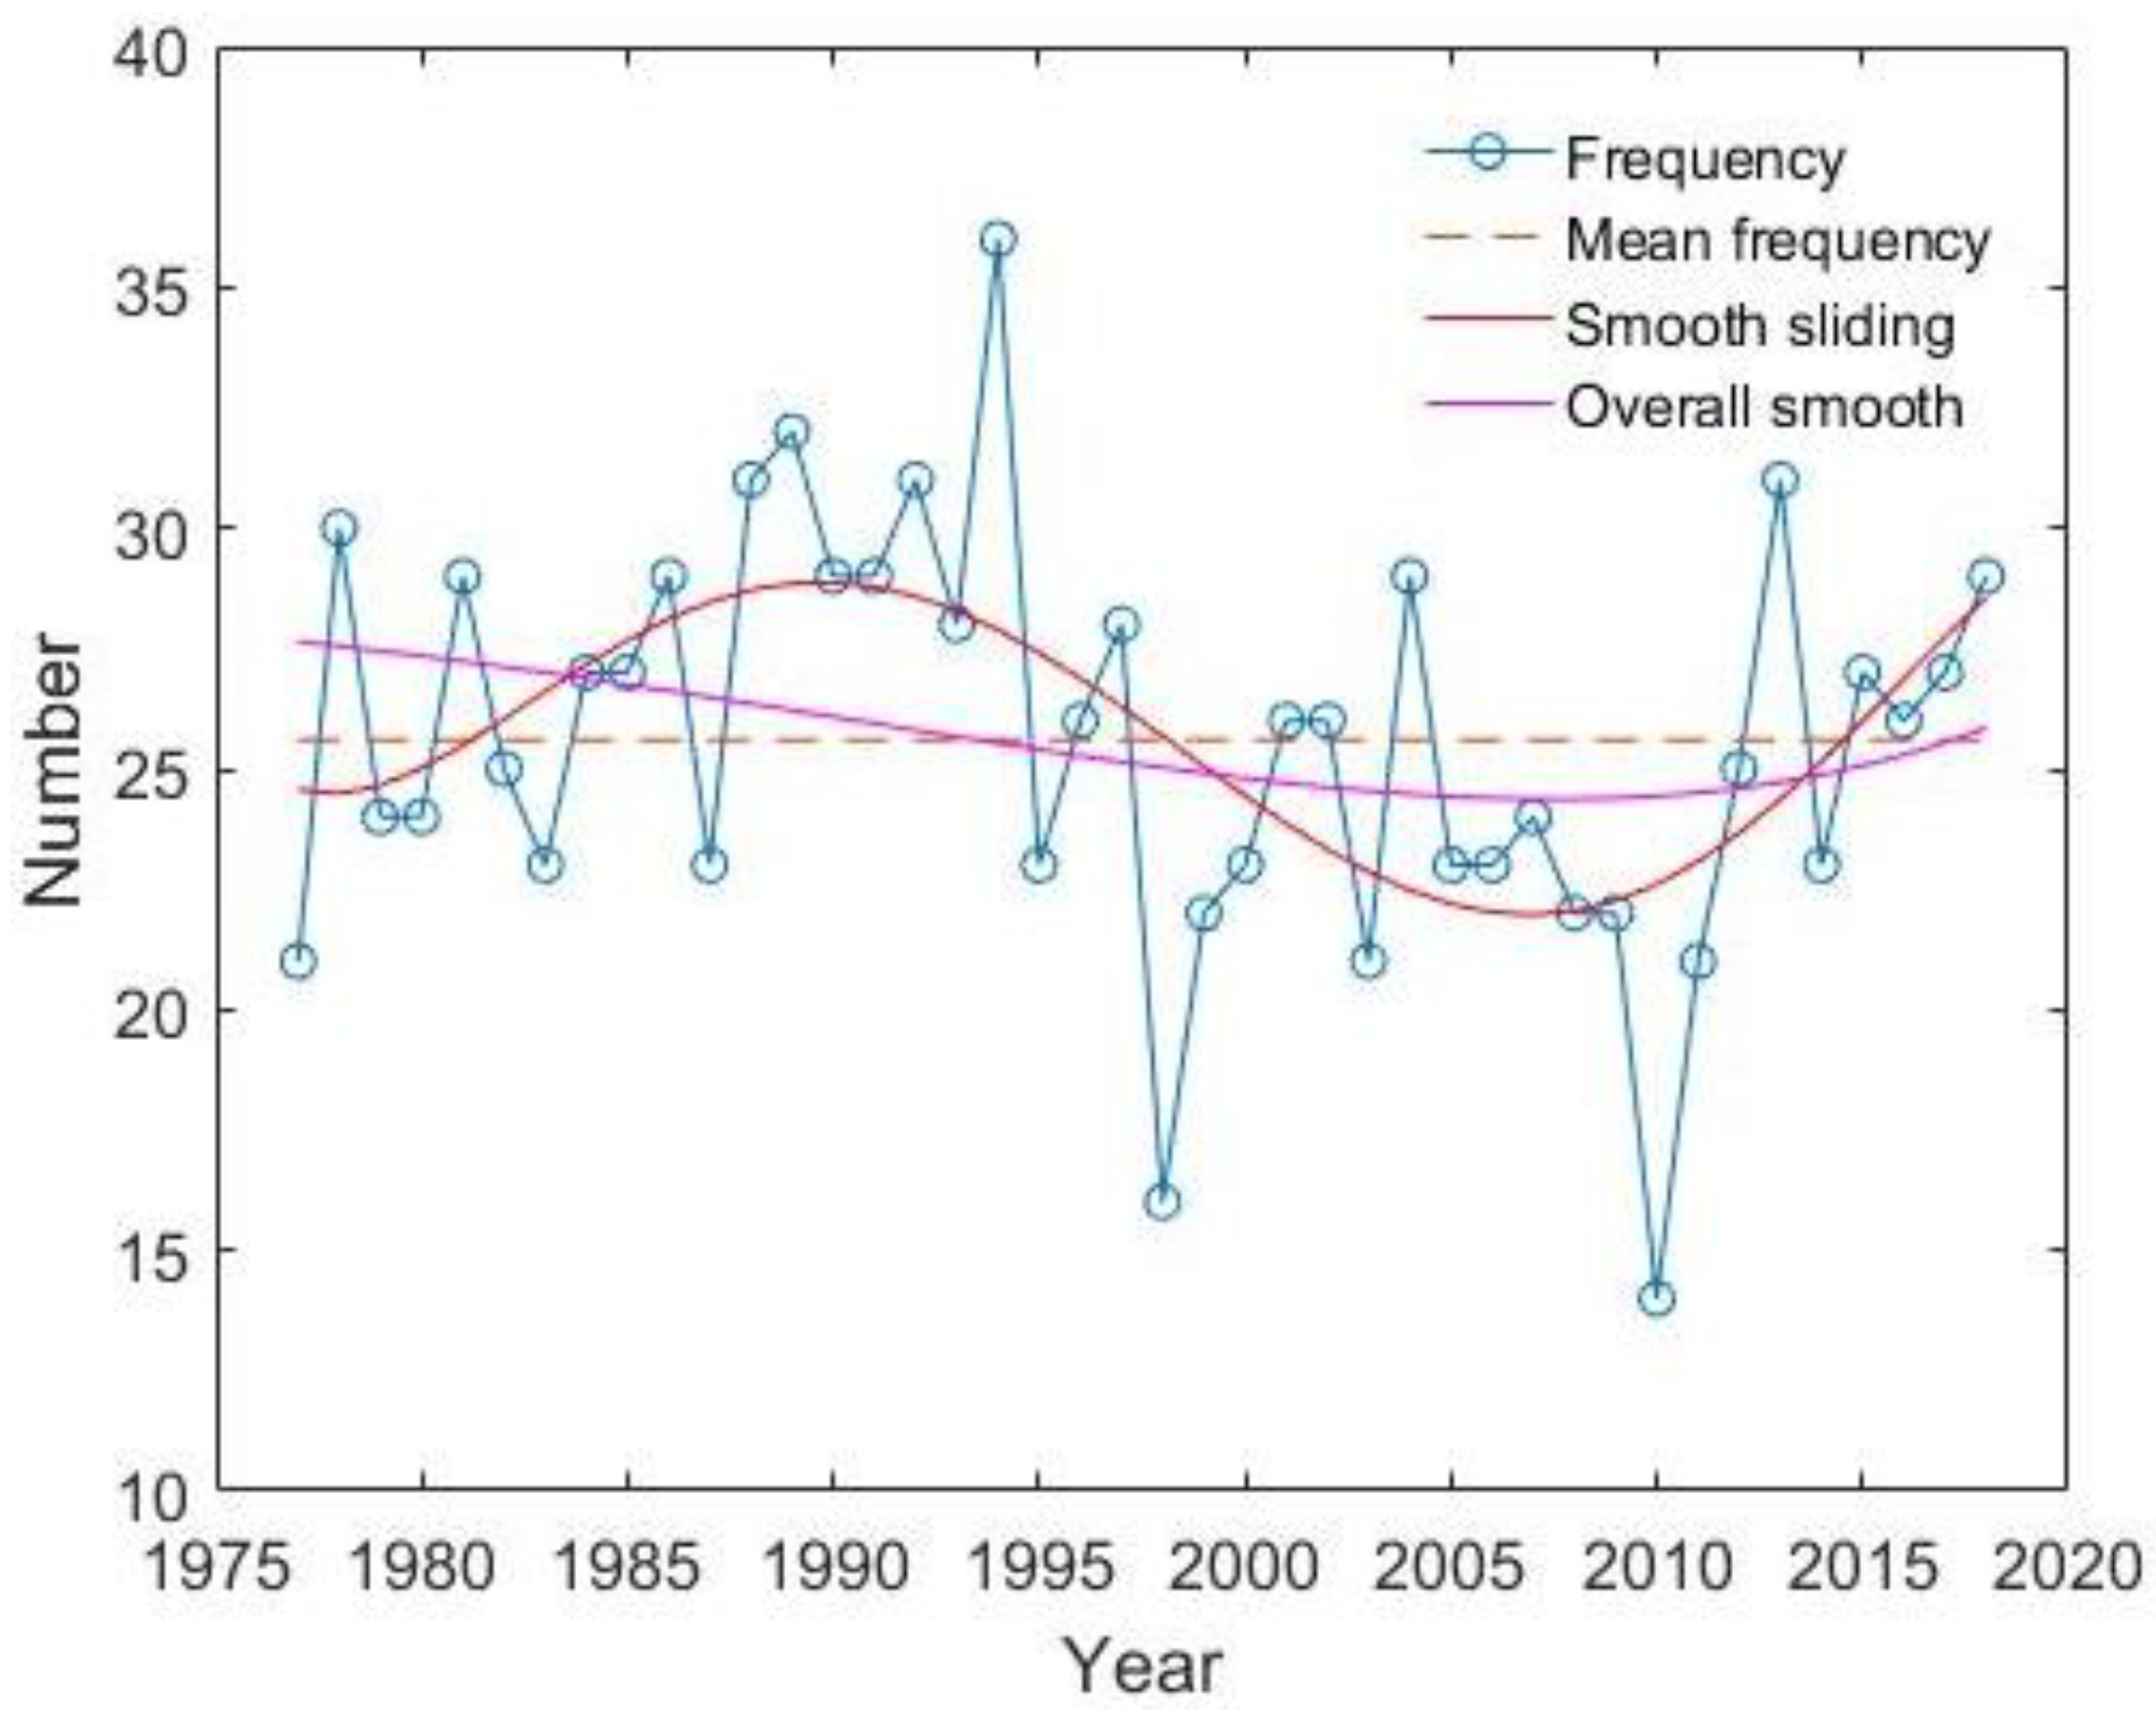
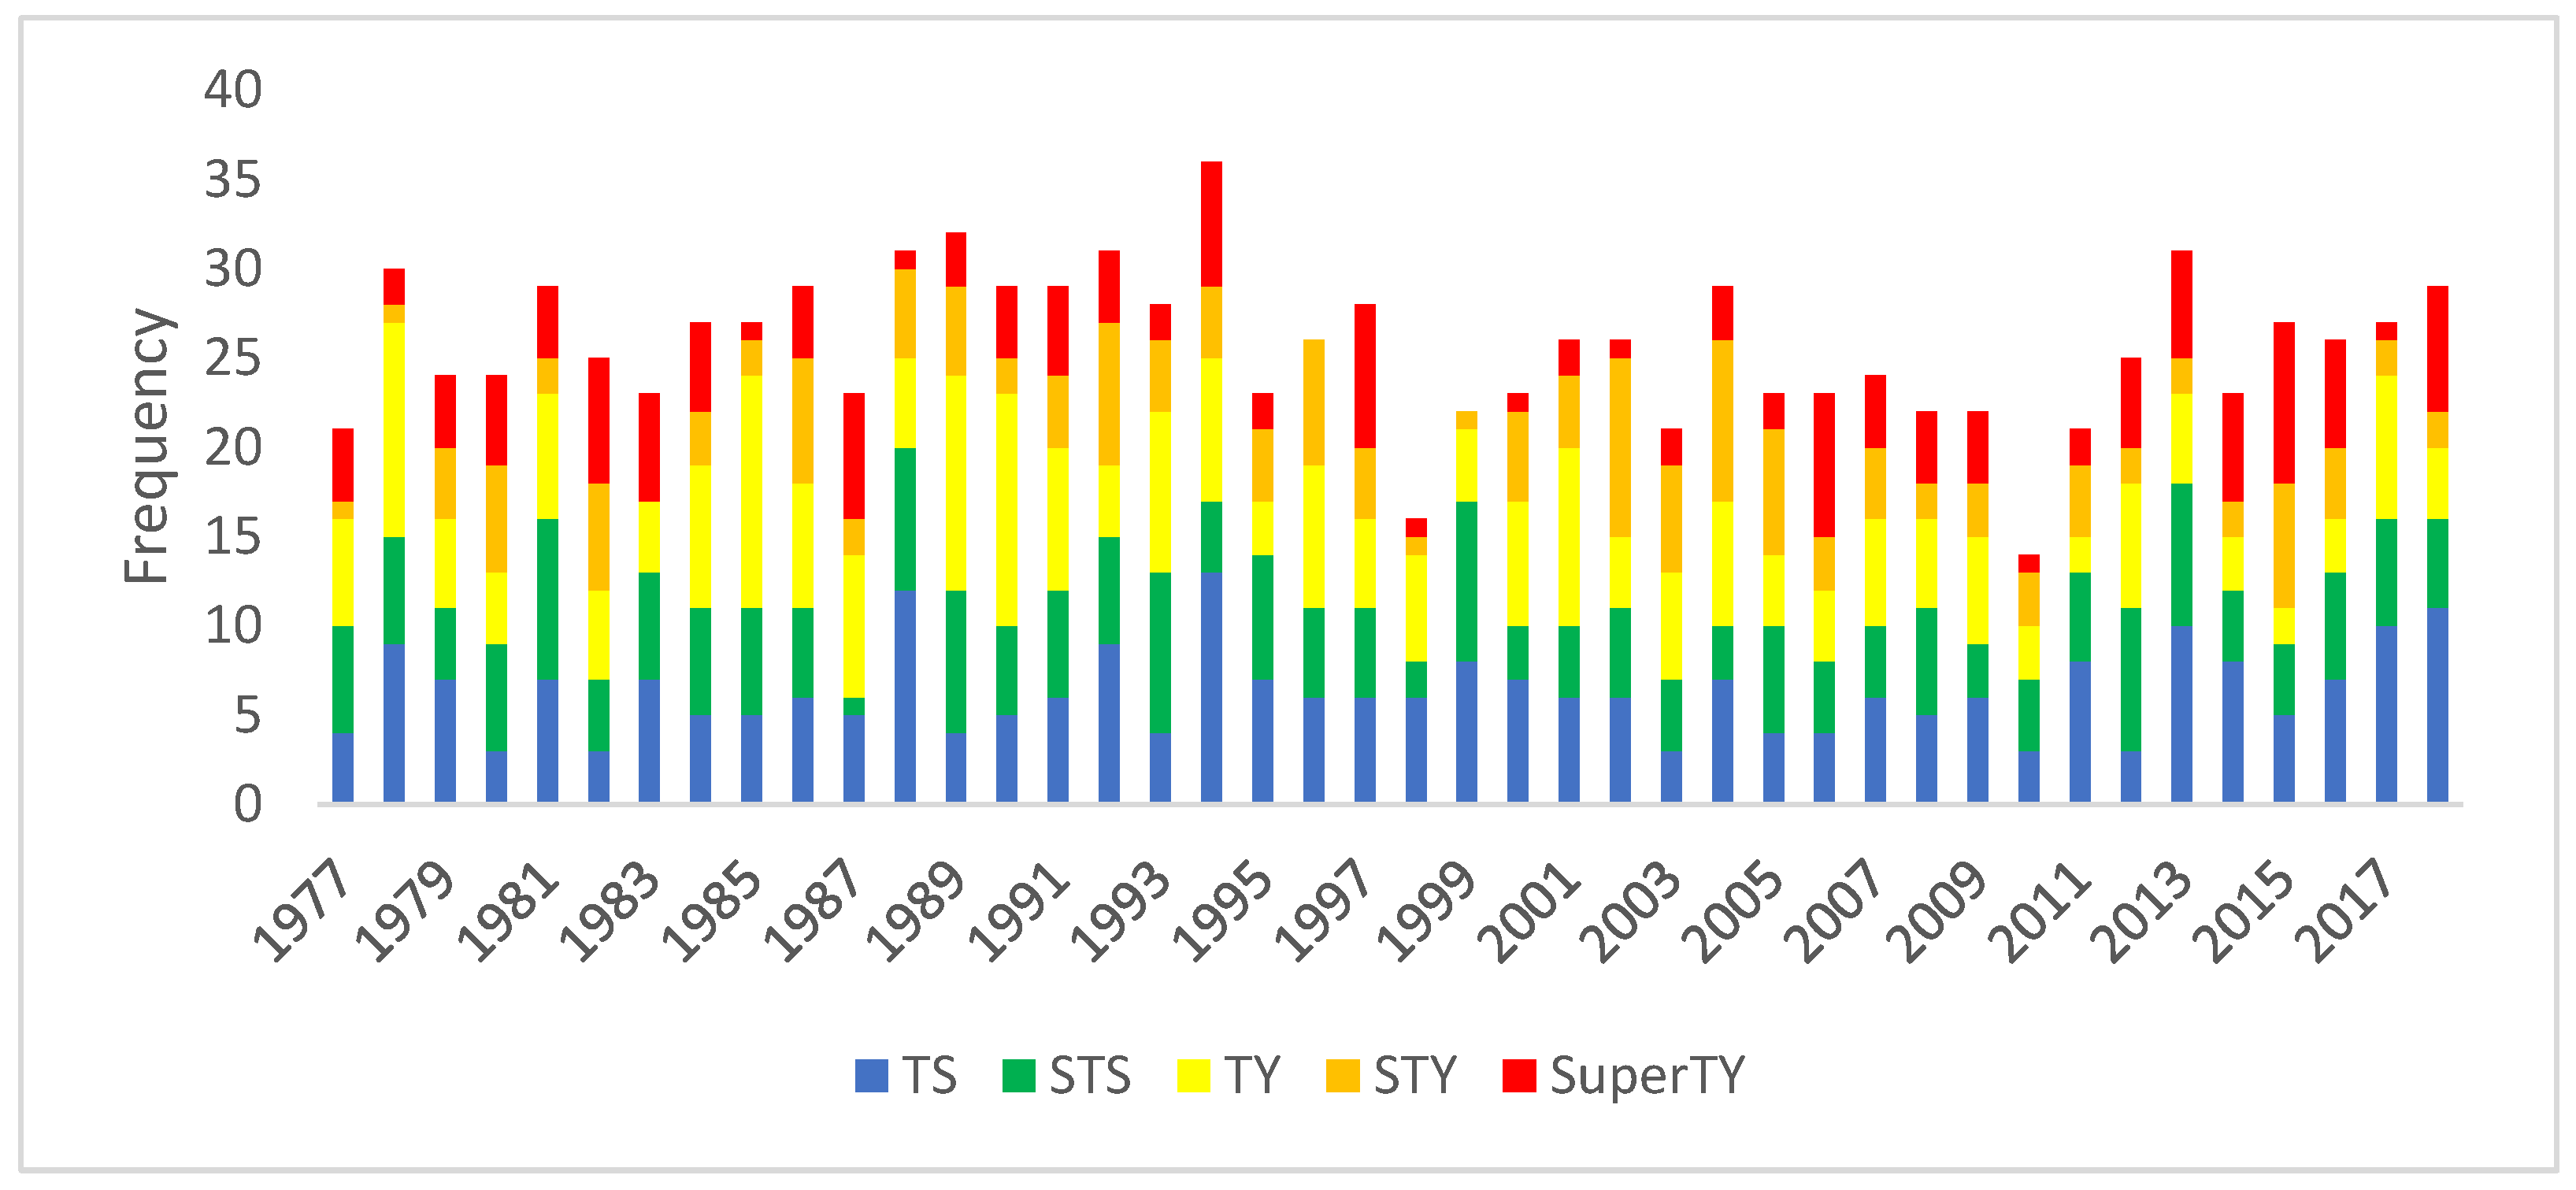
3.1. Characteristics of Tropical Cyclone Frequency in the Northwest Pacific

From 1977 to 2018, there were 1075 tropical cyclones in the Northwest Pacific, an average of 25.6 per year. Figure 2 illustrates the frequency change in different years. During the 1977–2018 period, the tropical cyclone frequency was highest in 1994 and lowest in 2010. There were slightly more years with below-average frequencies than above-average ones. From the overall smooth curve in the figure, it can be seen that the annual frequency of tropical cyclones in the Northwest Pacific had a fluctuating downward trend overall. After 1994, this downward trend was especially obvious; however, after 2010, the frequency increased again. In terms of historical variation, the frequency of tropical cyclones in the 1980s was relatively uniform, while that in the 1990s and 2000s fluctuated greatly. There were a total of about 270 tropical cyclones in the 1980s and 1990s, while in the 2000s, there were only 230, which shows that the frequency has decreased significantly.
Figure 3 shows the monthly frequency of tropical cyclones from 1977 to 2018. Most tropical cyclones occurred from July to October (85%); hence, there was a strong seasonal distribution. Over the past 42 years, the maximum frequencies have been in summer and autumn almost every year, with spring and winter generally having fewer. August had the greatest frequency (230), followed by September and July with 210 and 159, respectively. The frequency was lowest in February (8).

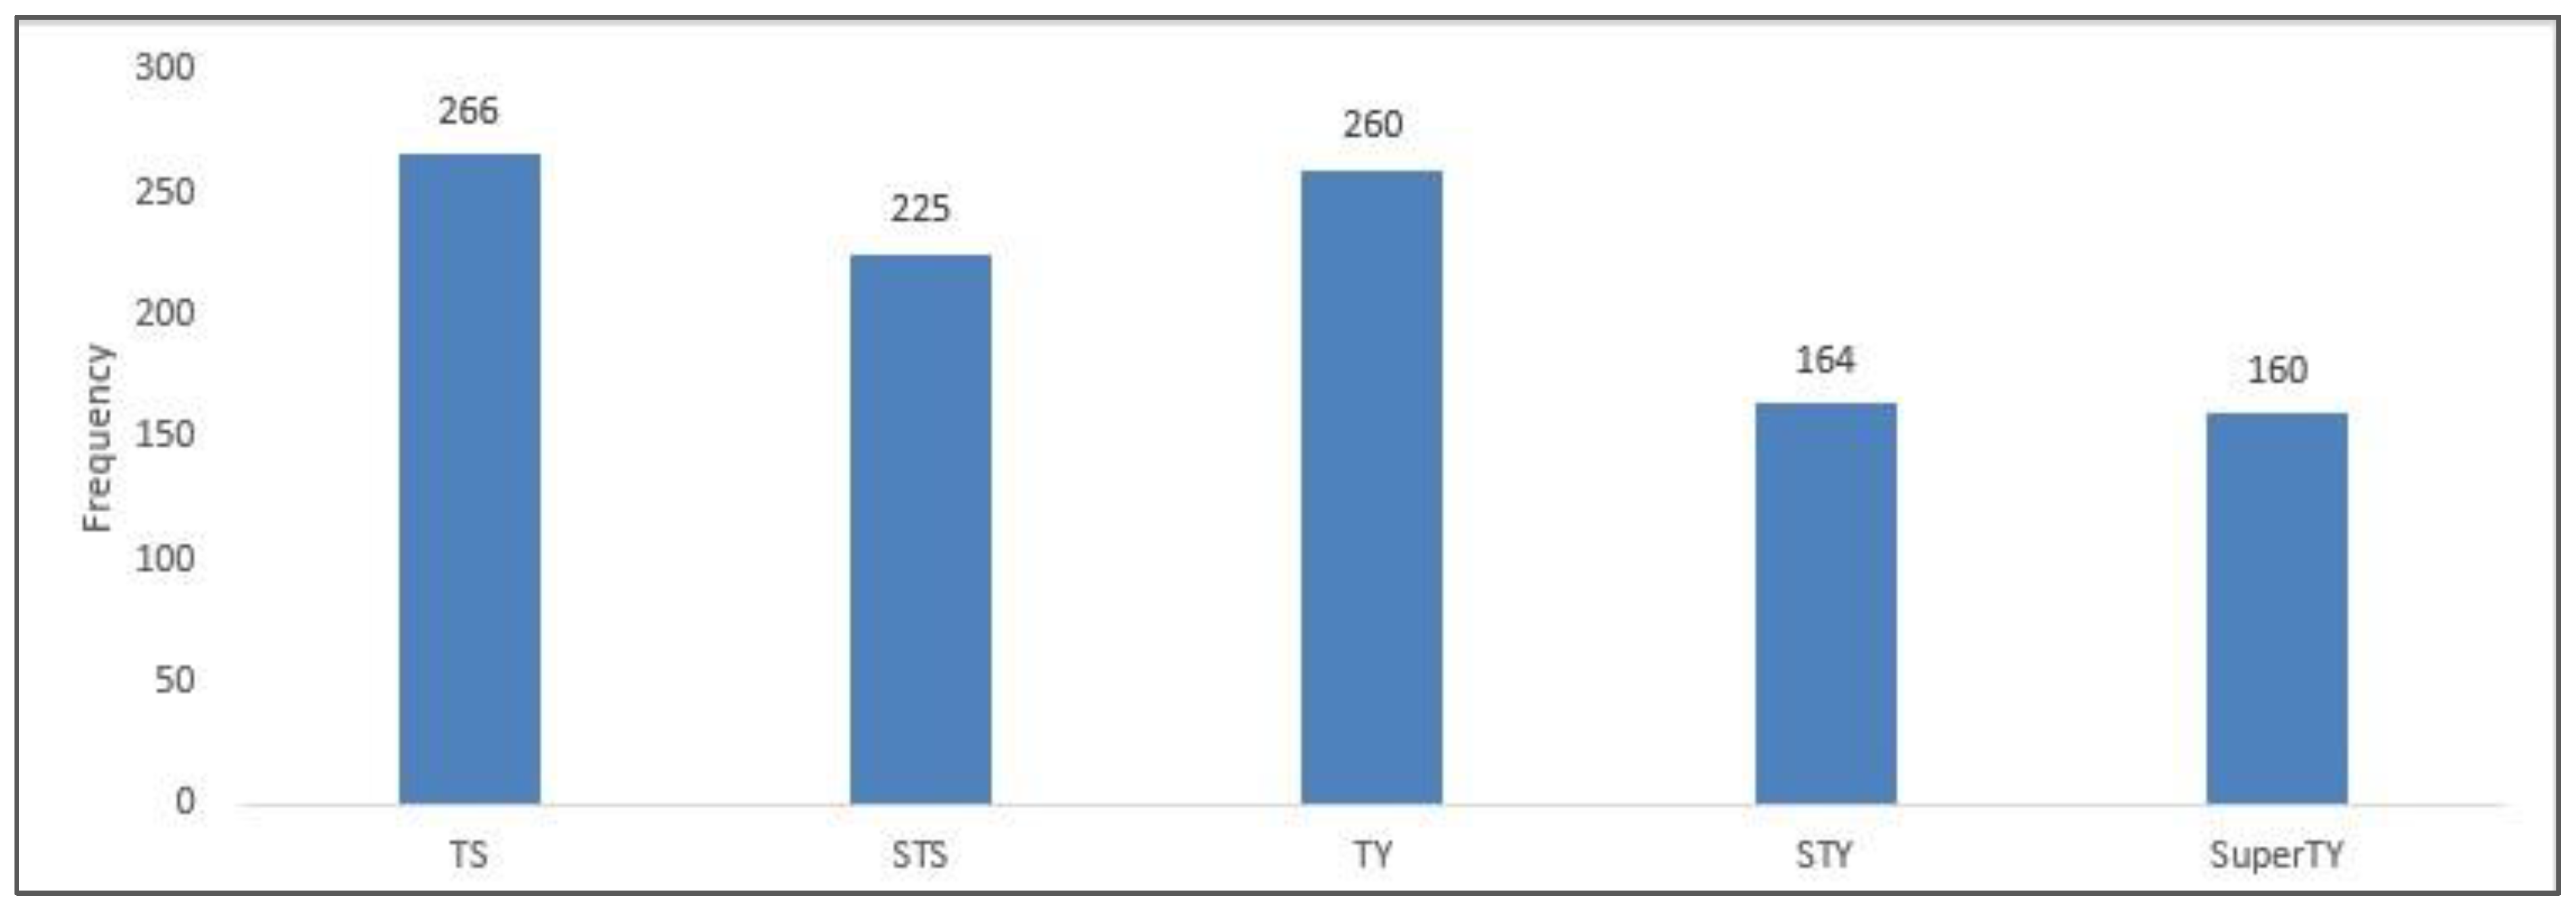
3.2. Intensity of Tropical Cyclones in the Northwest Pacific

China divides tropical cyclones into six grades according to their maximum wind force and maximum average wind speed near the bottom centre, as shown in Table 2. According to this standard, the intensity characteristics of tropical cyclones over the Northwest Pacific over the past 42 years were calculated (Figure 4).
Most Northwest Pacific tropical cyclones were at levels 8–17, and no tropical depressions occurred. The frequency of tropical storms was the highest (24.74%), followed closely by typhoons (n = 260, 24.19%). Severe tropical storms occurred 225 times in total, an average of five per year. The numbers of strong typhoons and super typhoons were almost equal, at 164 and 160, respectively. During 1977–2018, typhoons and the above accounted for 59.90% of Northwest Pacific tropical cyclones.

3.2.1. Interannual Variation

Changes in the annual intensity of tropical cyclones were obtained by classifying the intensity of tropical cyclones in each year (Figure 5). Tropical storms and strong tropical storms occurred every year, while the frequencies of strong typhoons and super typhoons changed chaotically and irregularly. The frequency of super typhoons was relatively high in 1987, 1994, 1997, 2006, and 2015, and occurred about eight times per year on average.
Figure 6 shows the annual average tropical cyclone intensity from 1977 to 2018. In the past 42 years, the annual average intensity decreased first and then increased, although the overall change was not obvious. From the smooth sliding trend of intensity in Figure 5 and the sliding smoothing trend of frequency in Figure 1, tropical cyclones were increasingly frequent in the 1980s; however, their average annual maximum wind speeds were decreasing. In the 1990s, the frequency was trending downward, and the average annual maximum wind speeds decreased first and then increased. In the 2000s, the frequency decreased but the average annual maximum wind speeds increased. Finally, the frequency increased in the 2010s, and the trend in annual average maximum wind speed was the opposite, showing a downward trend. Therefore, when the frequency of tropical cyclones in the Northwest Pacific increases, their intensity decreases, and vice versa.

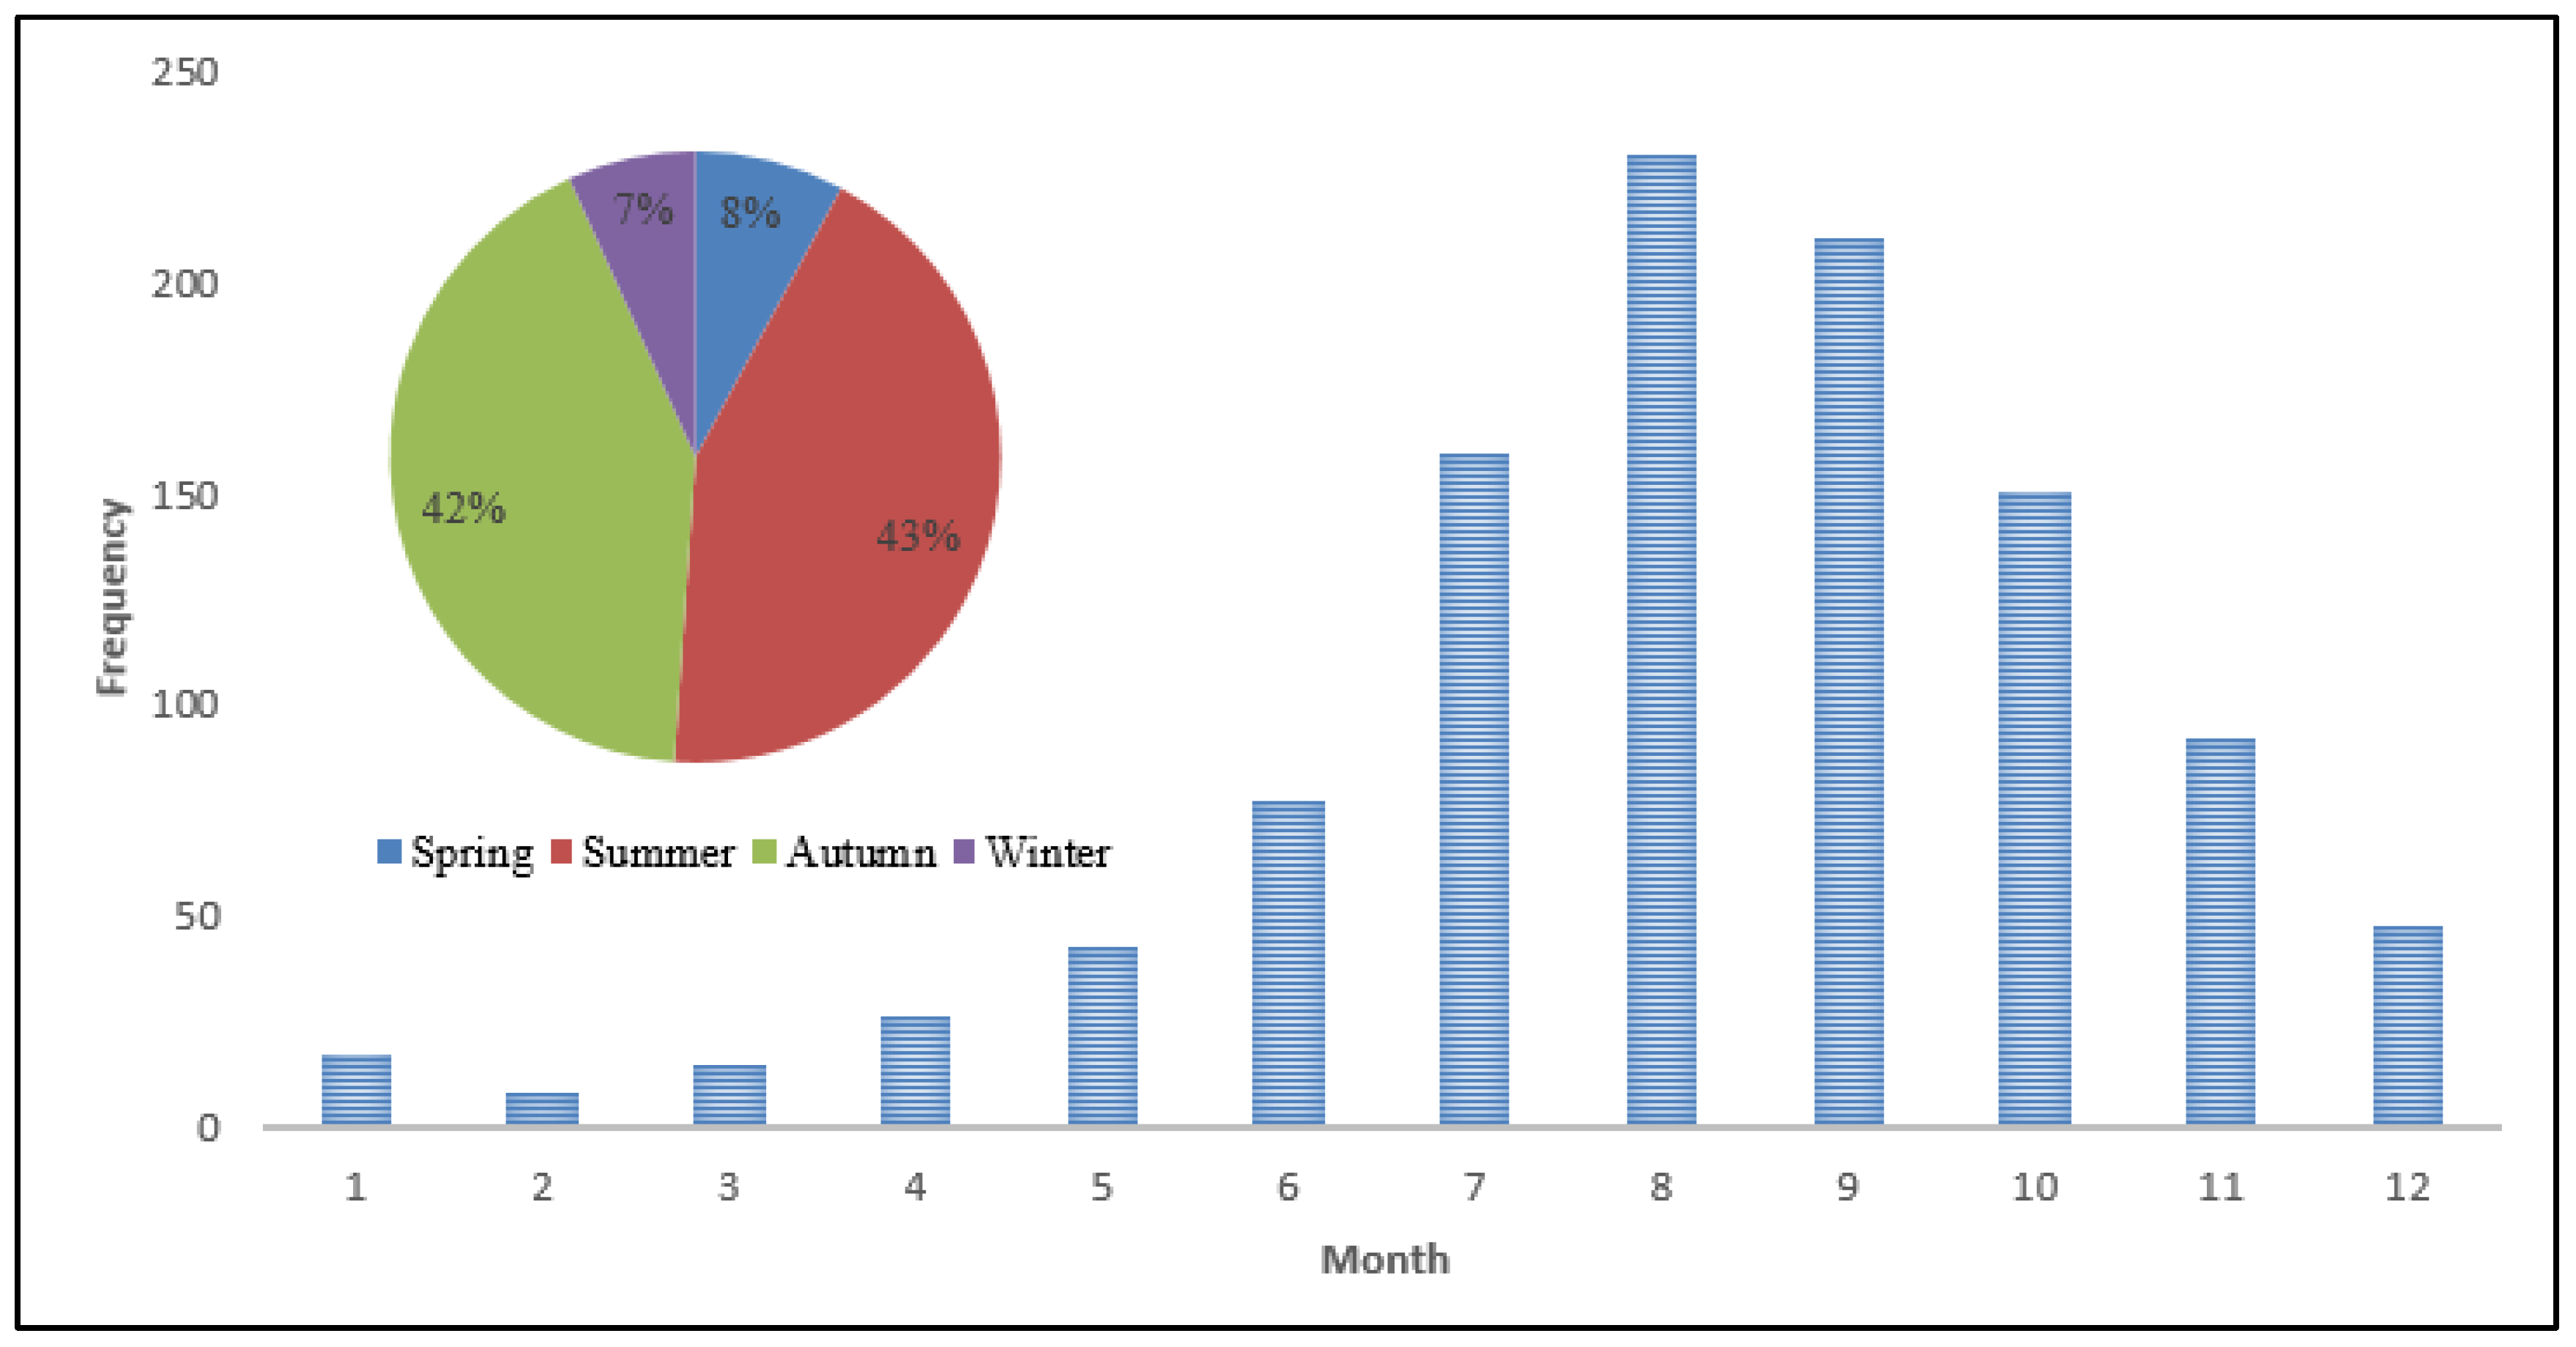
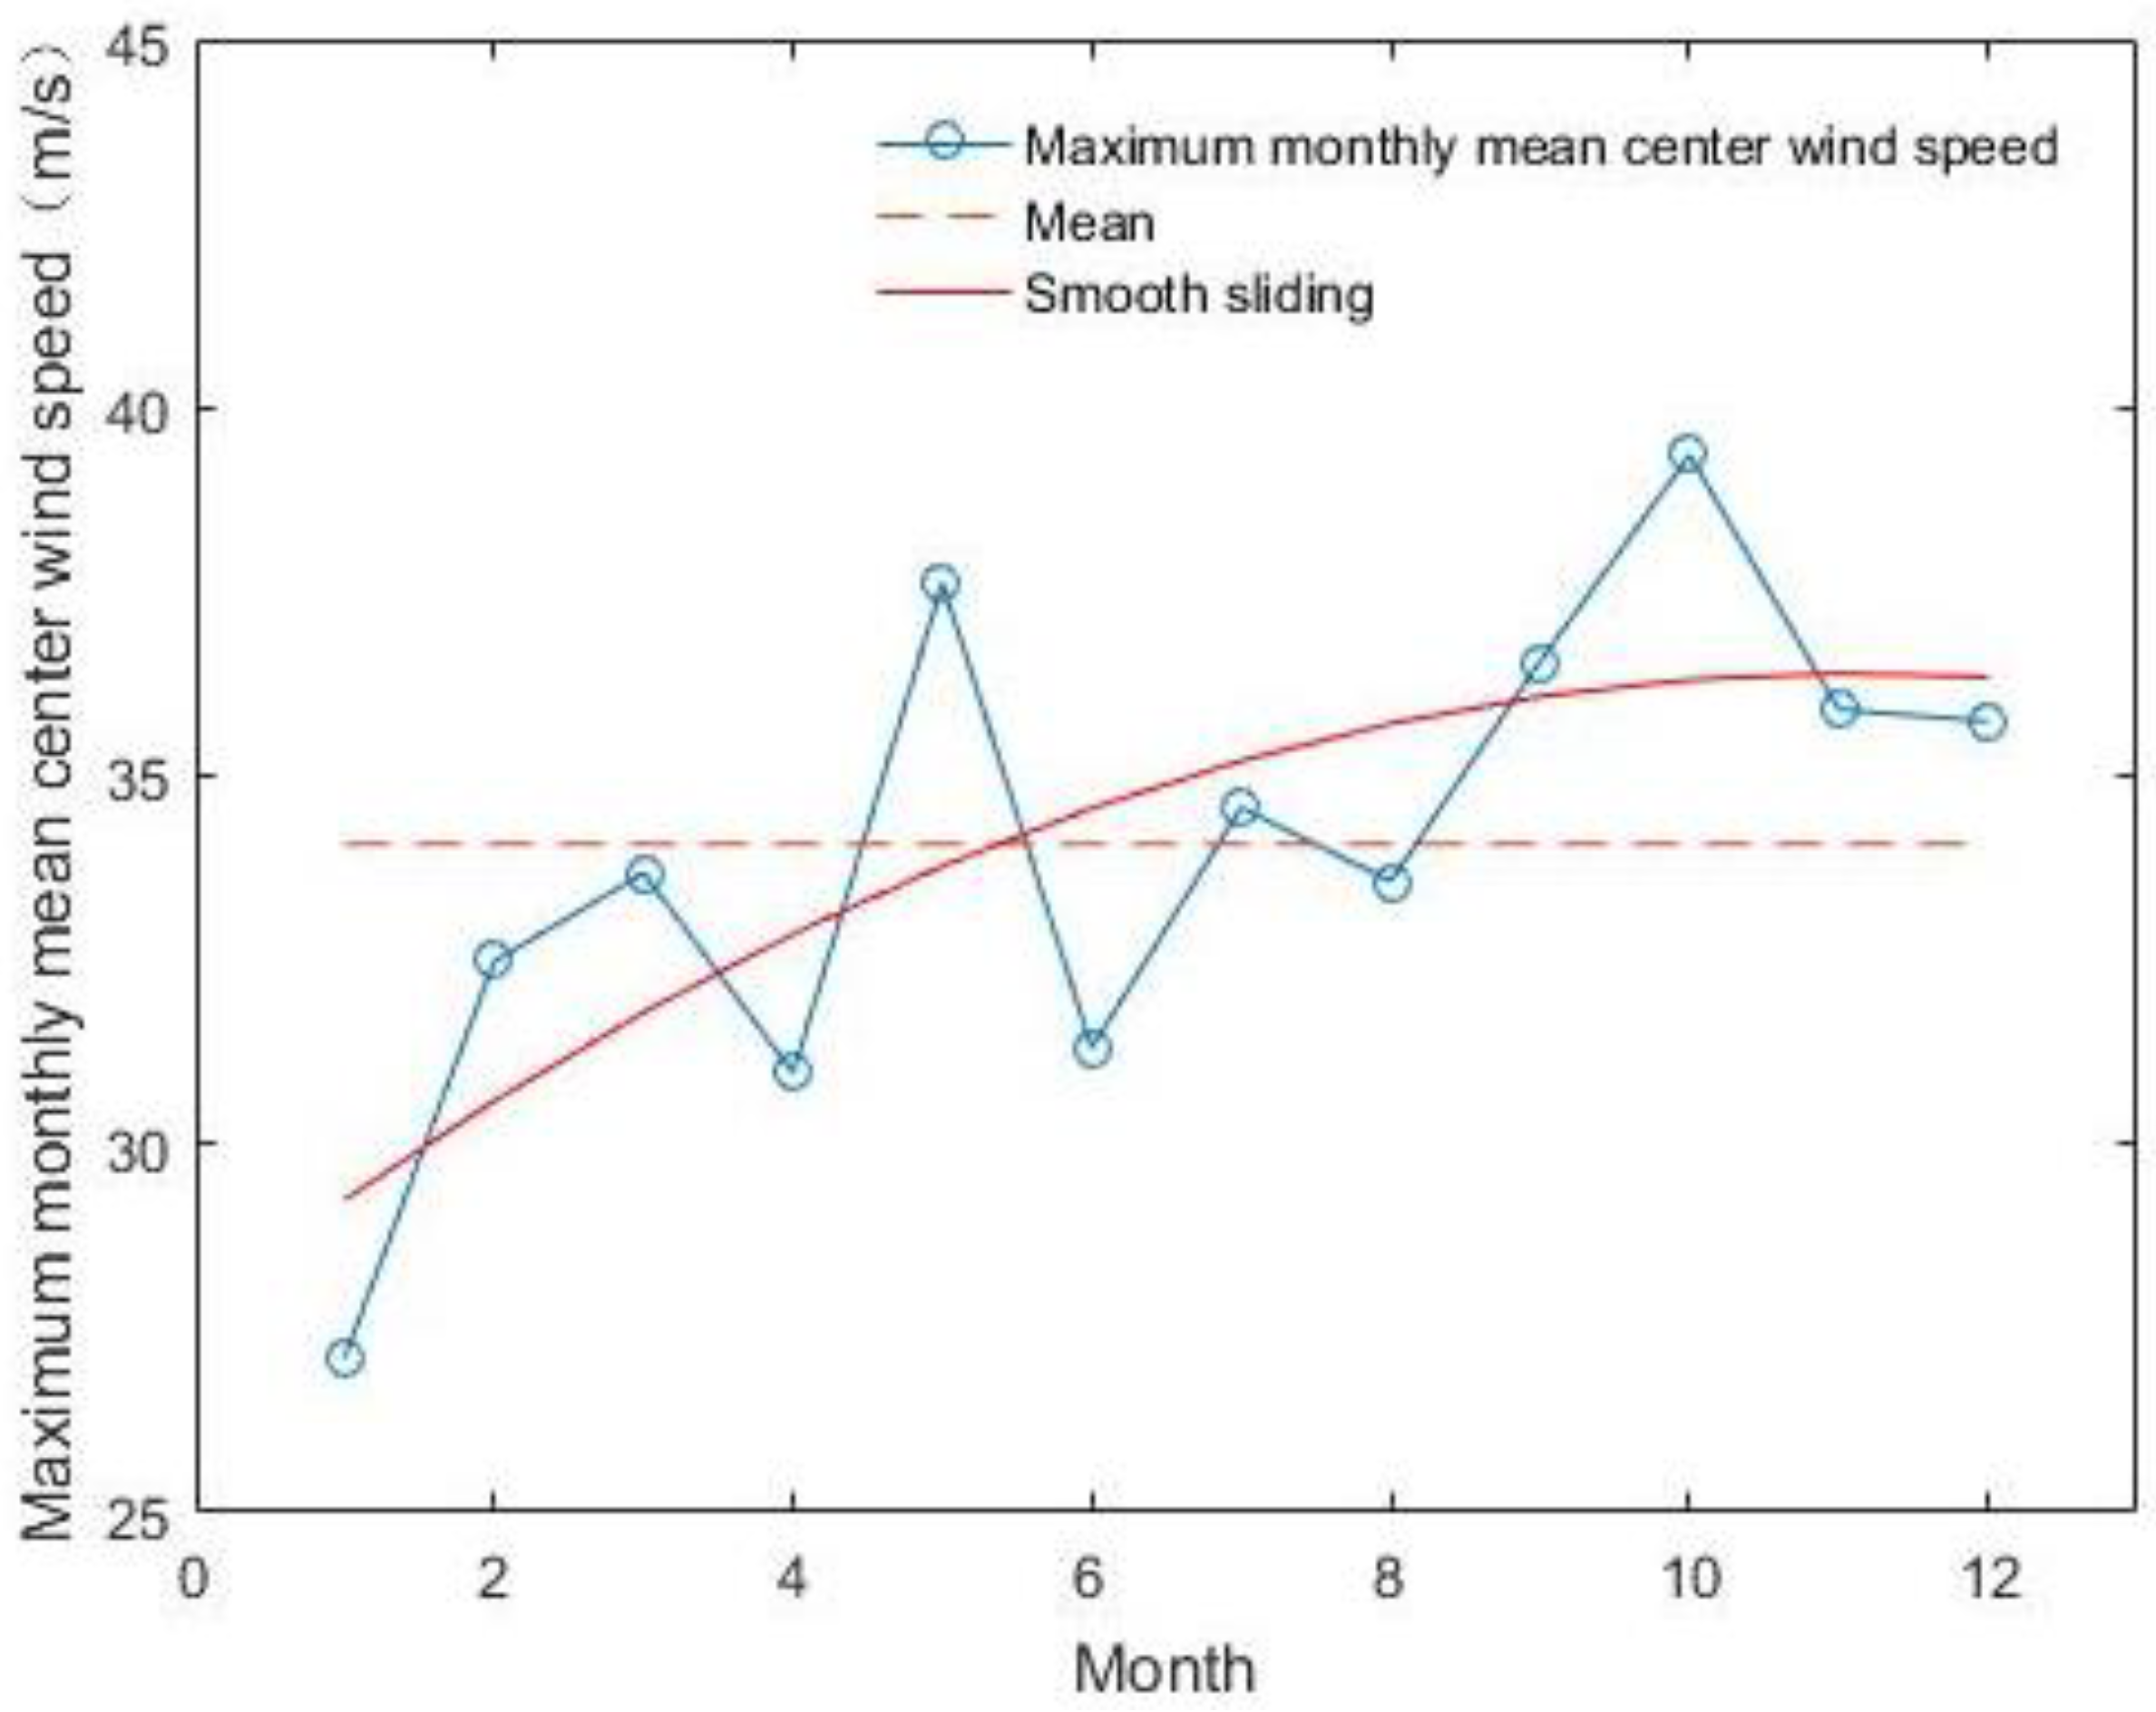
3.2.2. Seasonal Changes

The monthly and seasonal average maximum wind speeds of Northwest Pacific tropical cyclones were calculated. Figure 7 shows that, in terms of monthly variation, wind speeds were highest in October and lowest in January. The maximum wind speeds were low in the first half of the year and high in the second; that is, strong tropical cyclones generally occurred in the second half of the year. The season with the greatest cyclone intensity was autumn (September–November), during which the annual average maximum wind speeds reached 37 m/s. Combined with the previous results, it can be seen that autumn has the most frequent and intense tropical cyclones.

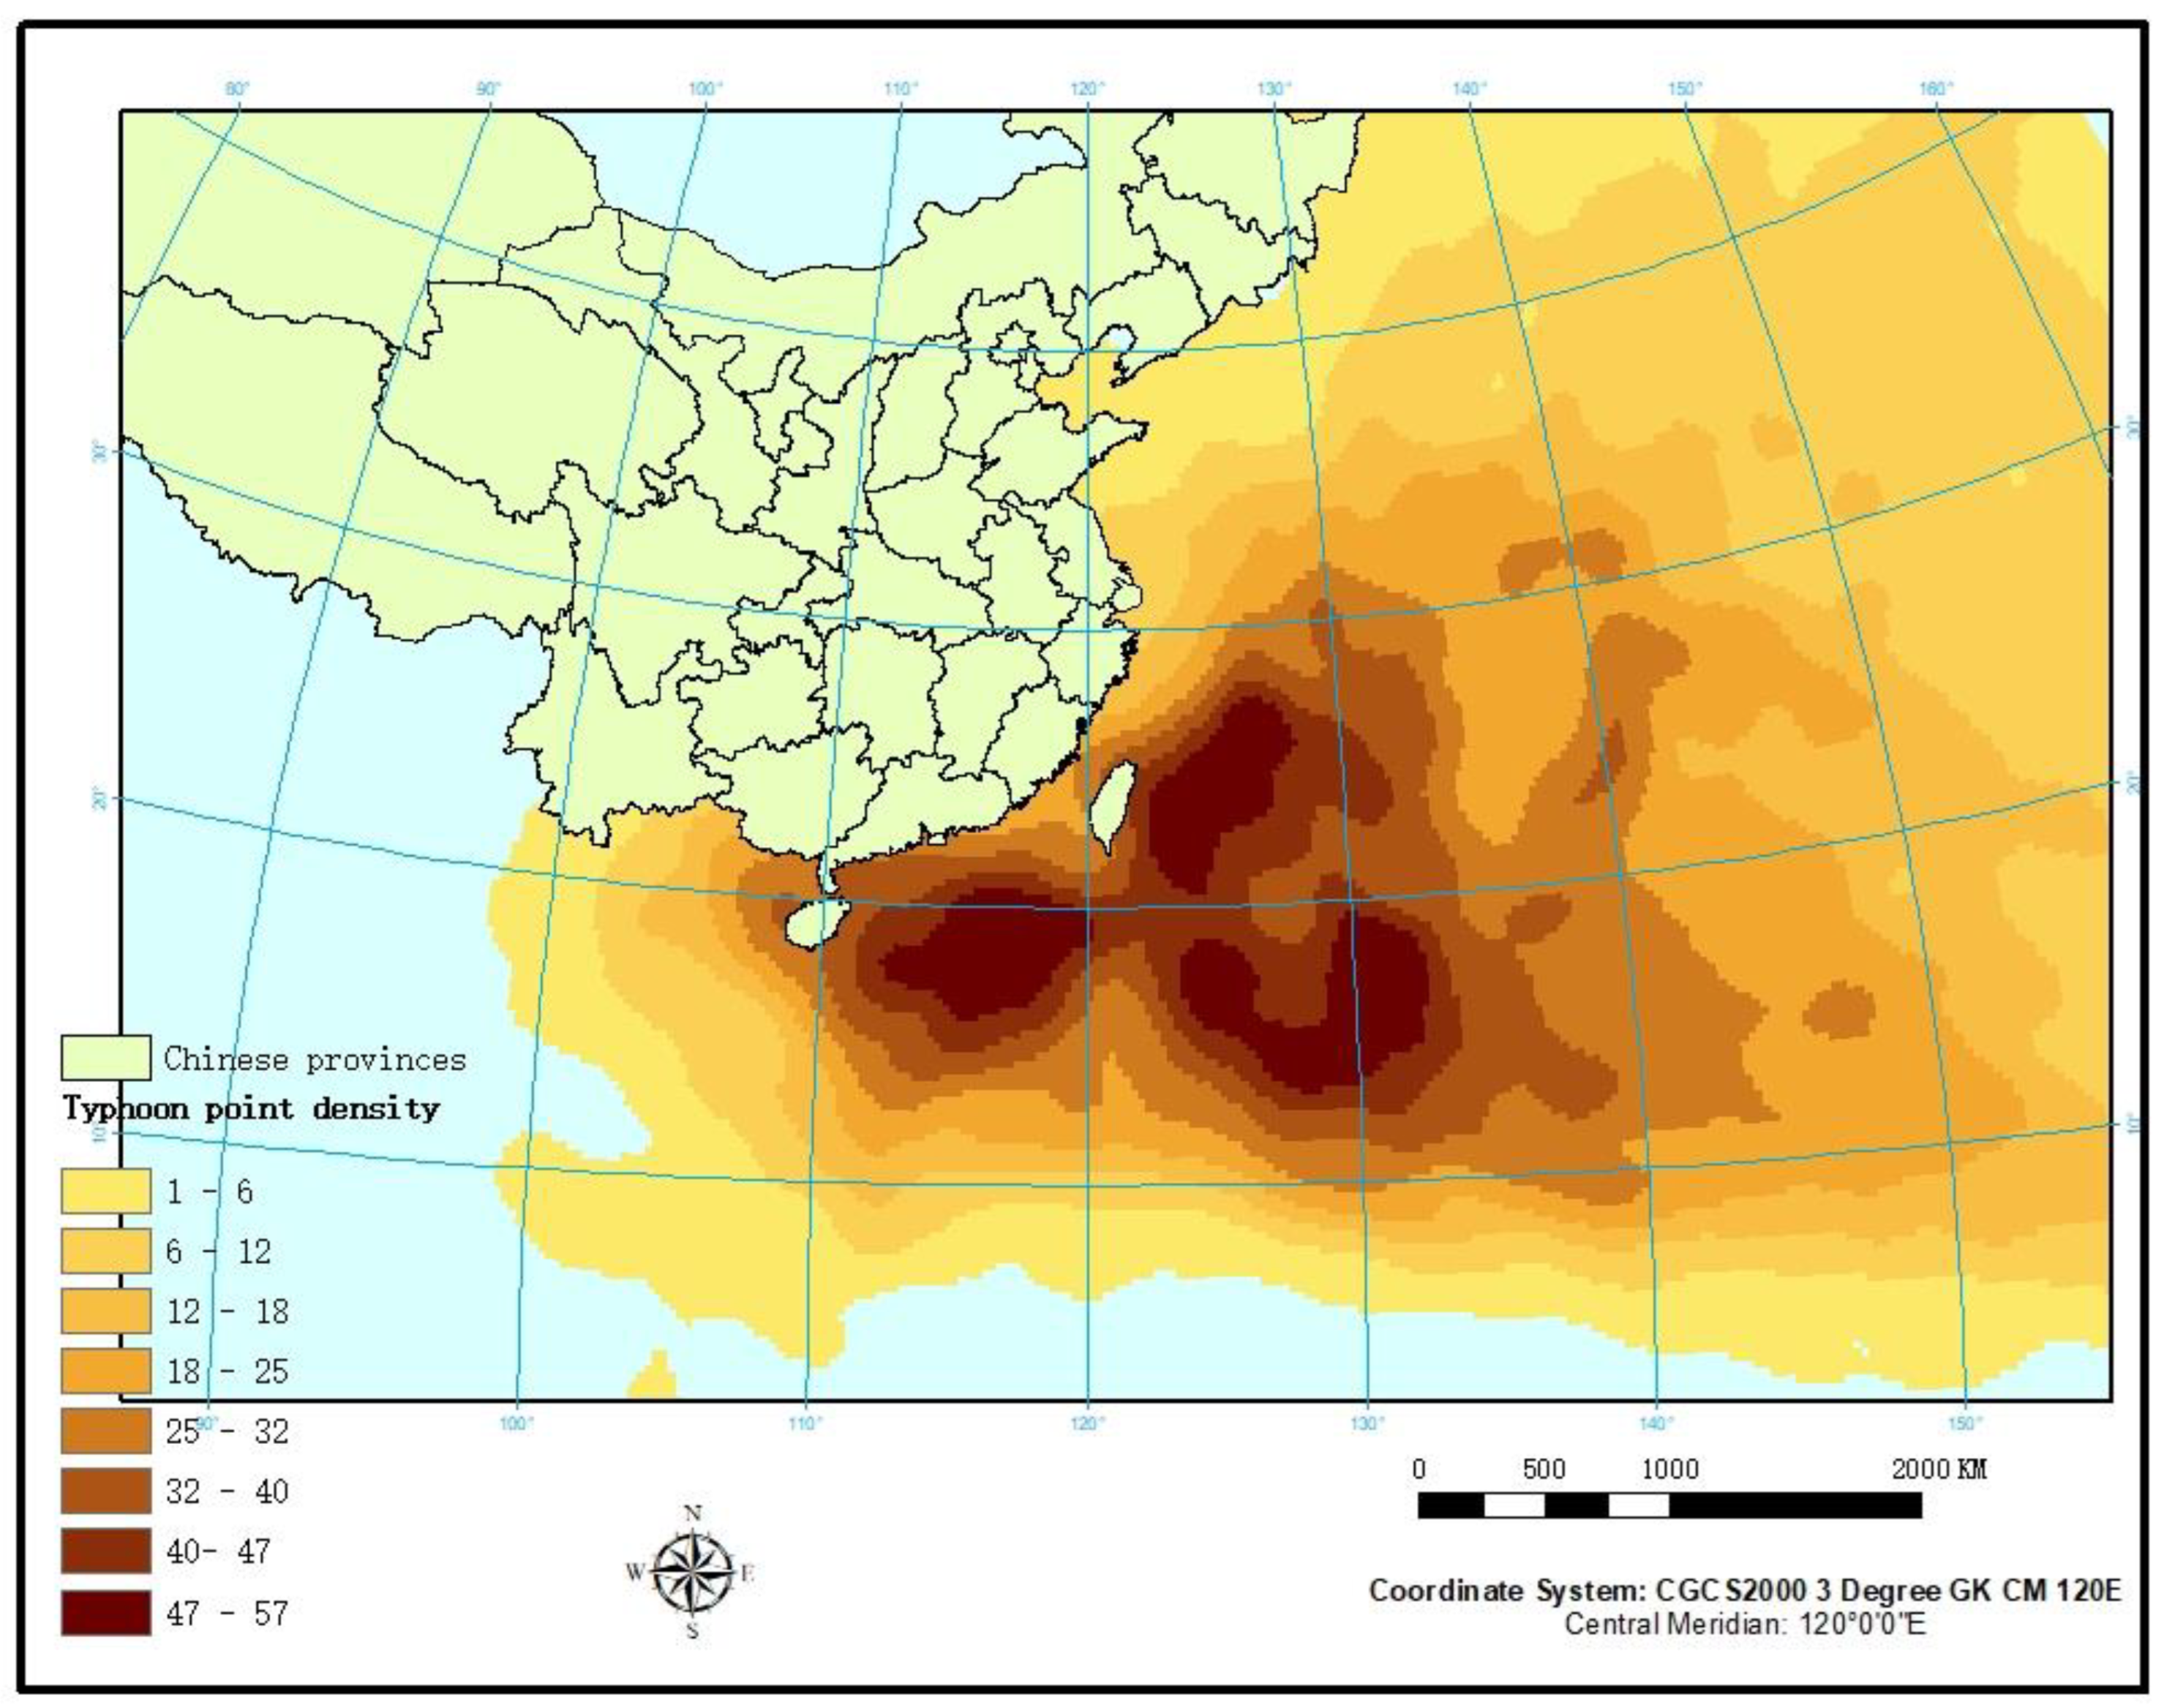
3.3. Characteristics of the Origin of Tropical Cyclones in the Northwest Pacific

Statistical analysis of the locations of all tropical cyclones shows that they originated in the range of 0–30° N and 105–180° E. After importing the tropical cyclone source point data into the map of the Northwest Pacific region, three main source areas were selected from the study area according to the source point distribution density. Area A is mainly in the South China Sea (110–120° N, 10–20° E). Area B includes the Northern Mariana Islands (USA), Guam, and offshore areas of the Philippines (5–20° N, 125–145° E). Area C includes the Federated States of Micronesia and the Roman Sauer Islands (5–20° N, 145–155° E). According to a Mercator projection, the areas covered by Areas A, B, and C are approximately 1.235 million km2, 3.705 million km2, and 1.852 million km2, respectively.
The red dots in Figure 8 represent the initial positions of each typhoon from 1977 to 2018; 206 tropical cyclones occurred in Area A (15.96% of the total), with a density of 1.67/10,000 km2. The largest number of tropical cyclones originated in Area B (n = 476, 35.37%), with a density of 1.28 per 10,000 km2. The fewest occurred in Area C (n = 142, 10.81%), with a source density of only 0.77 per 10,000 km2. Other regions had 498 cyclones (37.93%). Areas A, B, and C have the highest source densities. Among them, Area A (the South China Sea) had the highest source density.

3.4. Characteristics of Tropical Cyclones That Affected China

The cumulative number and intensity of tropical cyclones that affected China from 1977 to 2018 (based on the maximum wind level near the bottom centre) were determined in each province (Figure 9 and Figure 10).

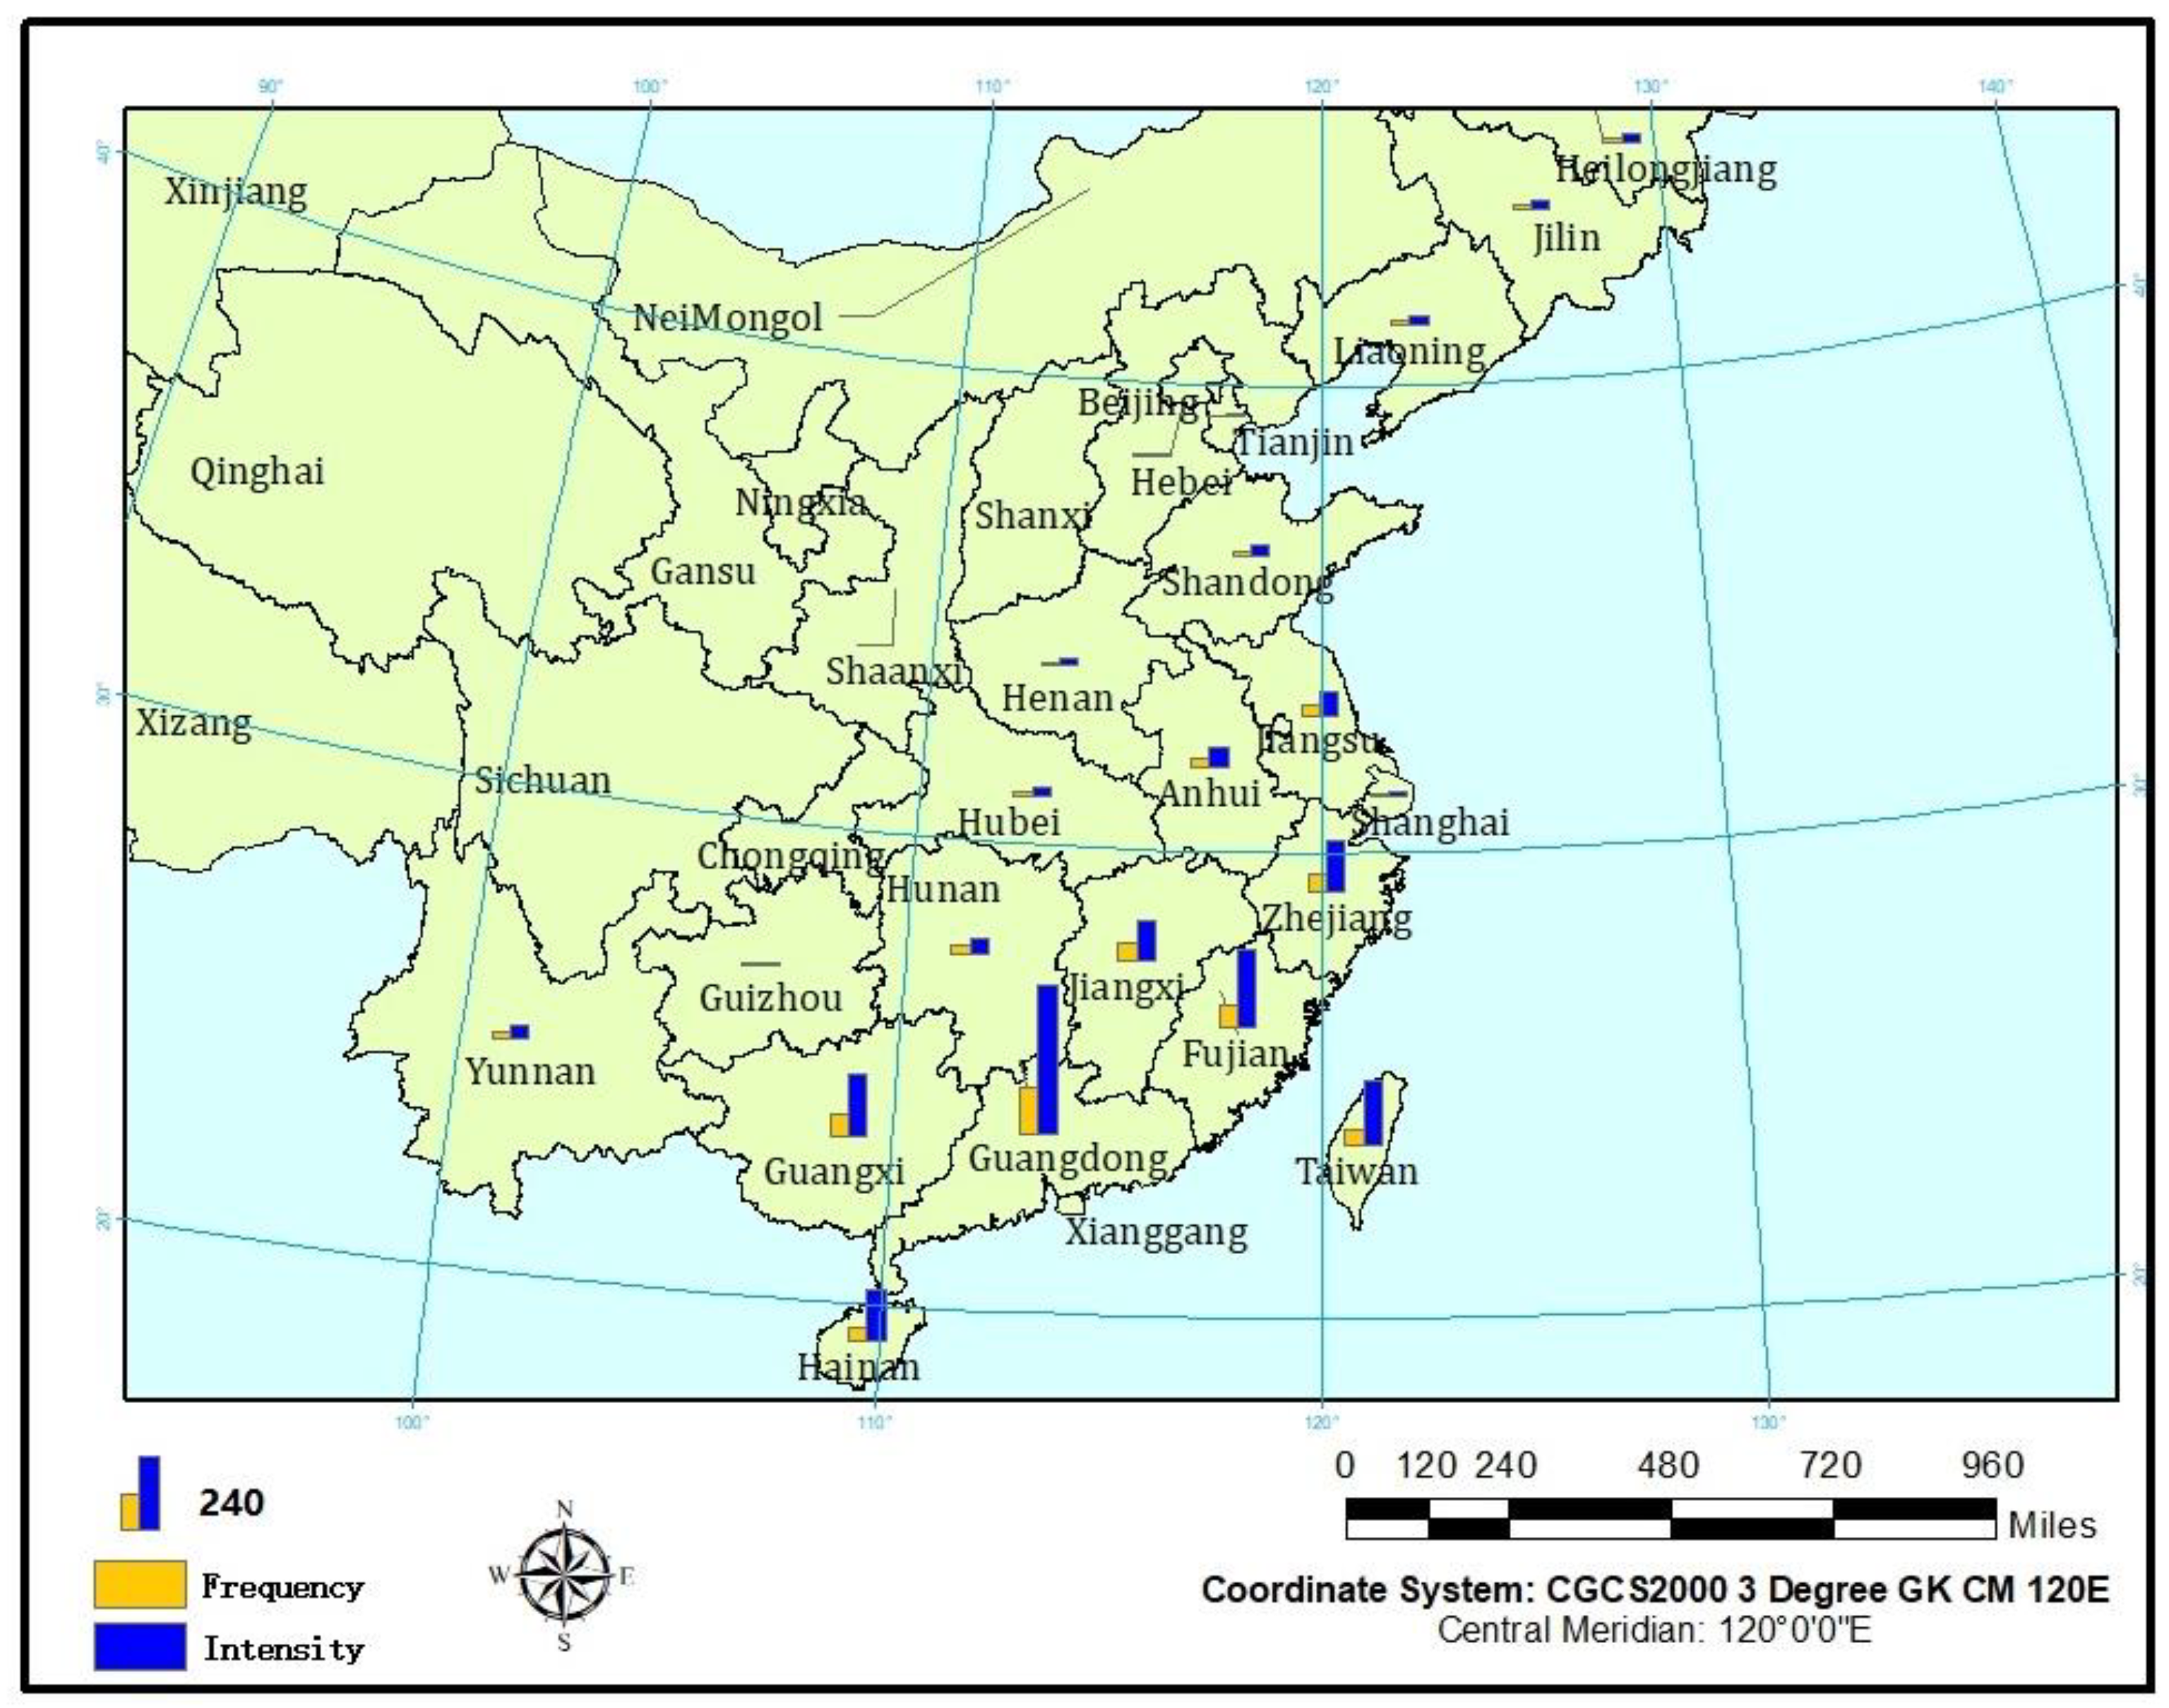
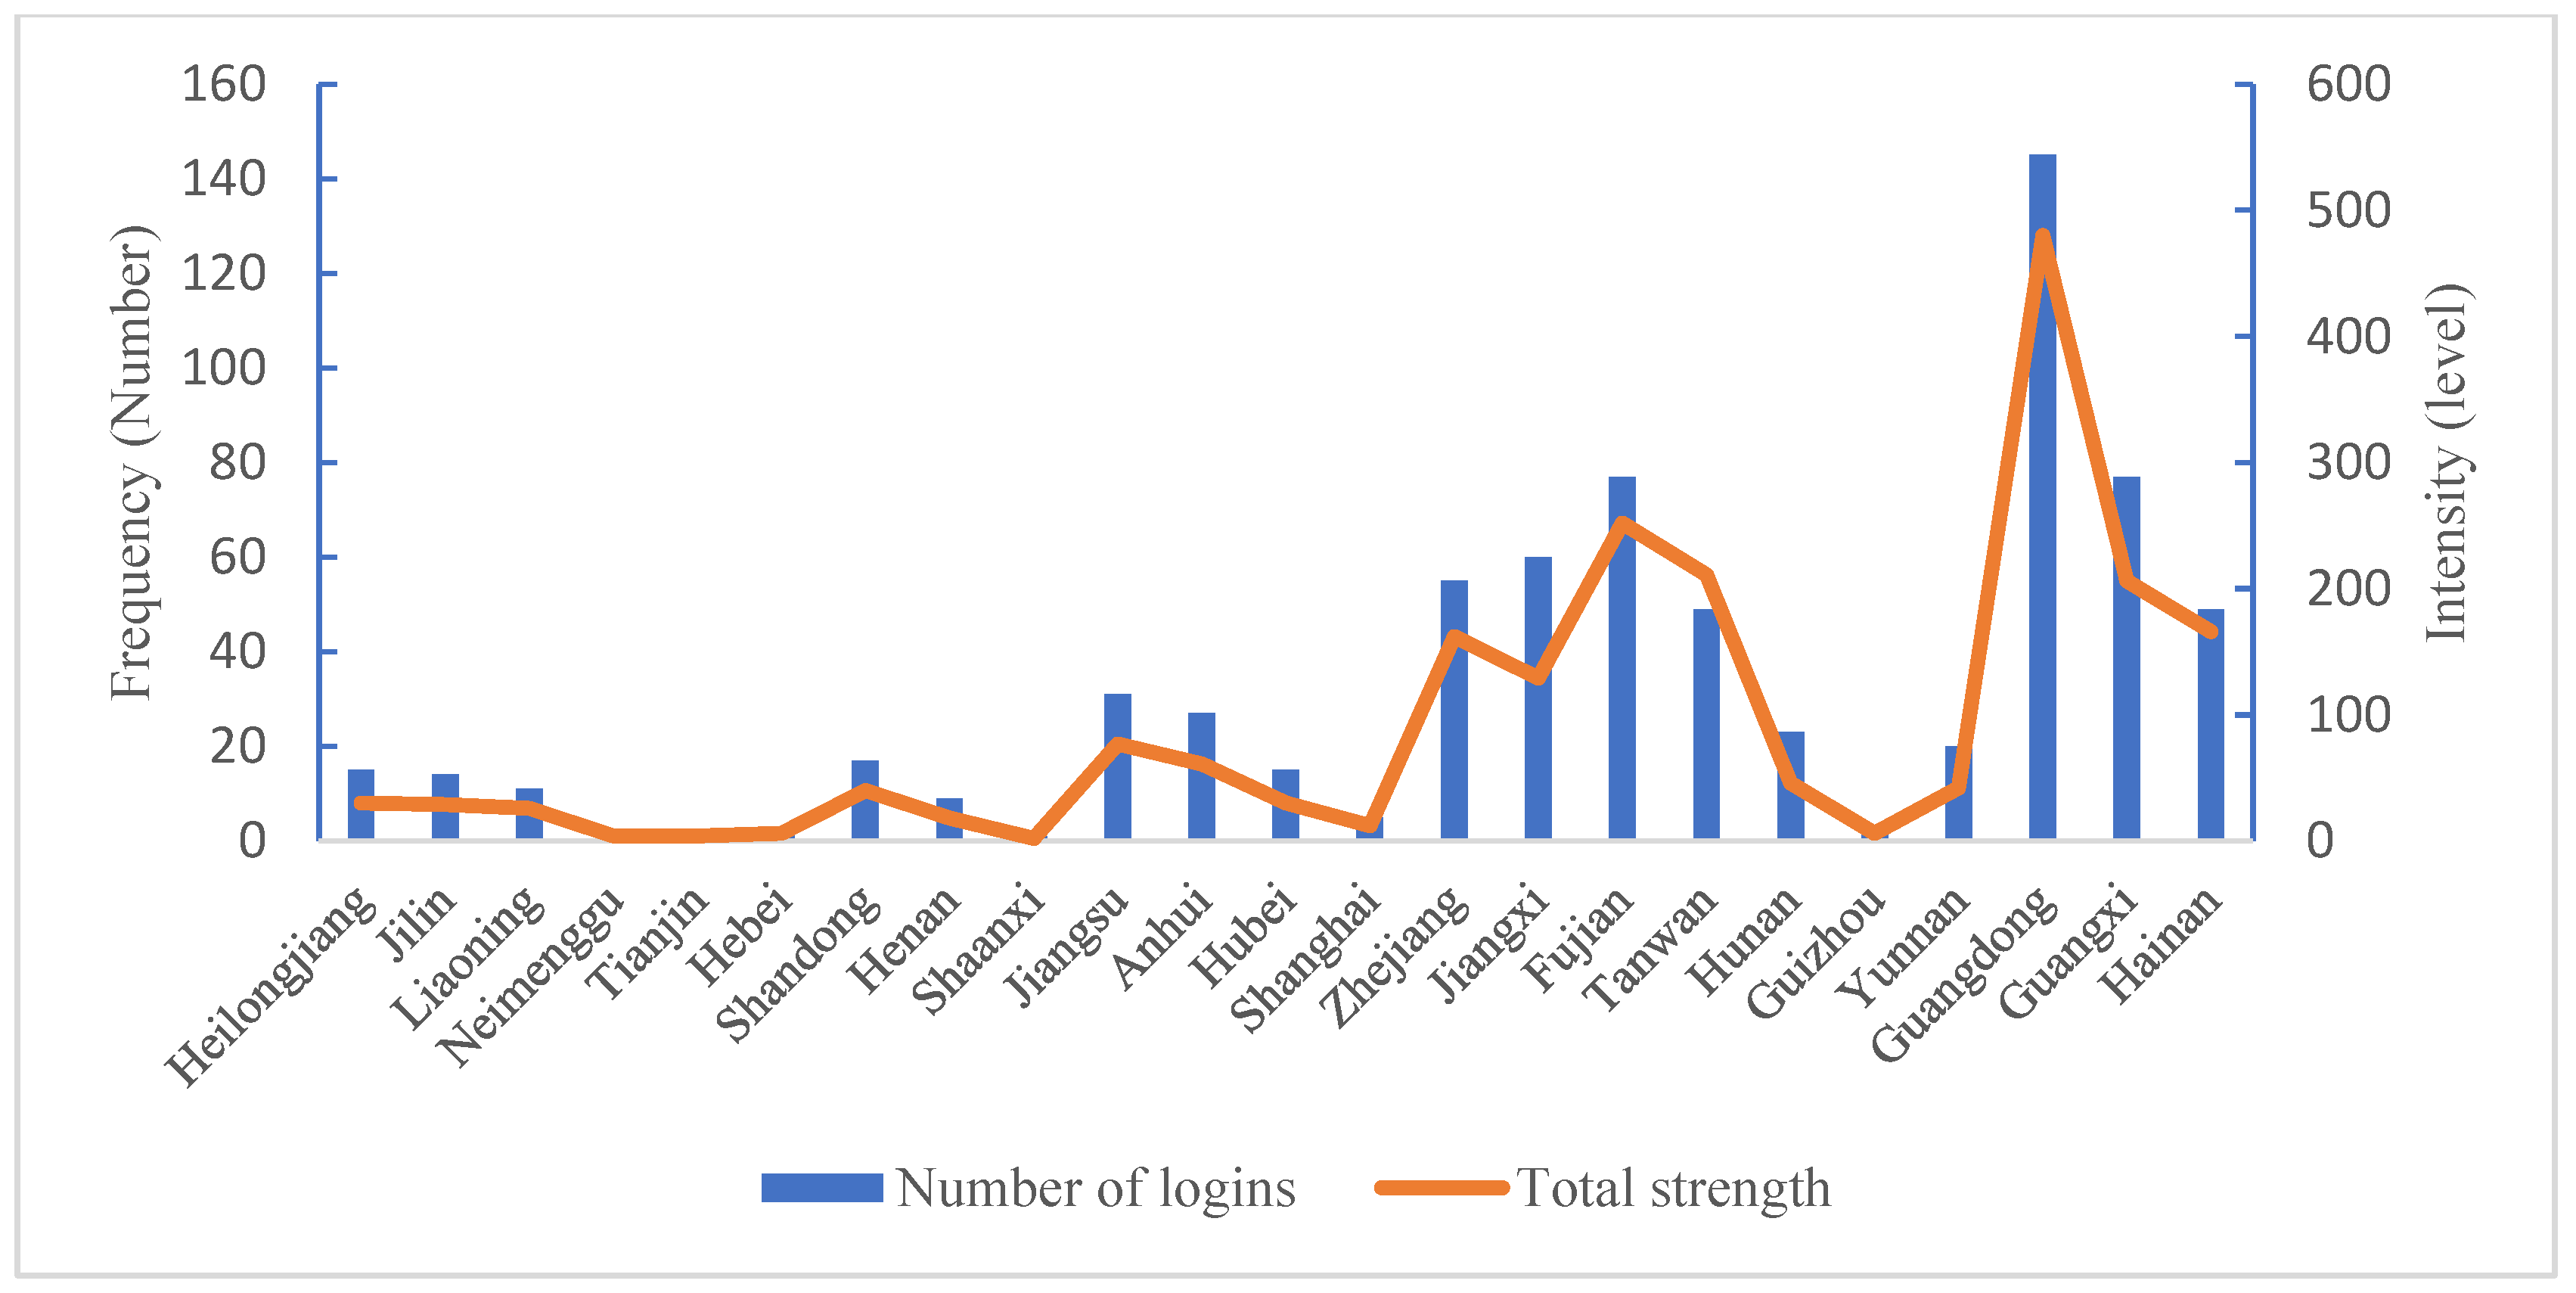
3.4.1. Frequency of Tropical Cyclones That Affected China

By analysing 1075 Northwest Pacific tropical cyclones in 1977–2018, a total of 314 affected China’s inland and coastal areas, an annual average of about 7.5. As shown in Table 3, an average of about 7 affected China each year in the 1970s. The frequencies in the 1980s and 1990s were relatively stable at about 7.5 and 7.8, respectively. The frequency began to decrease slowly in the 2000s, to an average of about 6.8 per year. In the 2010s, the frequency increased greatly to an average of about 8 per year.
As shown in Figure 10, tropical cyclones originating off China’s coast from 1977 to 2018 affected 23 provinces, municipalities, and autonomous regions of China, which include all of its coastal cities. A tropical cyclone may pass through multiple areas with varying intensities. In this paper, the statistics of tropical cyclones in China were analysed according to the actual tropical cyclones that passed through the region. Of China’s coastal areas, Guangdong province has been most frequently affected (145), followed by Fujian and Guangxi provinces. Many tropical cyclones also affected Zhejiang, Hainan, and Taiwan. These are the main areas affected by tropical cyclones on China’s coast, with >80% of the total landfalls occurring there. There were fewer tropical cyclones that affected Jiangsu Province and Shanghai. In addition, a few tropical cyclones affected Shandong, Hebei, and Liaoning.
Of inland areas, Jiangxi Province had the greatest number of tropical cyclones affected (60), followed by Anhui, Hunan, Hubei, and Yunnan. Inland areas such as Heilongjiang, Liaoning, Henan, and Guizhou were less affected (≤15). In general, coastal areas are more affected by tropical cyclones, while inland areas are less affected.

3.4.2. Intensity of Tropical Cyclones That Affected China

Intensity analysis shows that few tropical cyclones categorised as strong typhoons or stronger that affected China from 1977 to 2018. A total of 55 strong typhoons that affected this period, mainly in Taiwan and Guangdong, and also in Fujian, Guangxi, Zhejiang and Hainan.
According to the intensity distribution (Figure 10), the intensity changes of tropical cyclones in various regions were basically the same as their frequency changes. In terms of spatial distribution, tropical cyclones in coastal areas have both high frequency and high intensity. As cyclones pass into inland areas, their frequency and intensity gradually decrease. This is because China’s coastal waters are mostly affected by landfall-type tropical cyclones. These have high intensity when they that affected coastal areas such as Guangdong, Fujian, Hainan, Taiwan and Zhejiang, then their wind speed decreases as they move to inland areas such as Jiangxi, Guangxi, Hunan, Hubei and Anhui due to the influences of terrain and other resistances. Therefore, tropical cyclones are generally weaker in intensity once they move inland and are often downgraded to tropical depressions.

4. Discussion

Many factors affect the variability of tropical cyclones; for example, SST is an important thermal condition affecting their generation, change, development, and movement [16,38]. Studies have shown that the summer SST anomalies in the East Indian Ocean (10° S–22.5° N, 75–100° E) (EIOSSTA), the SST gradient (SSTG) between the SWP and the WWP, and El Niño events are all associated with tropical cyclone activity in the Northwest Pacific [39]. In this paper, the Niño3 is selected as an index for determining the occurrence of El Niño events [40].

4.1. Influencing Factors on Northwest Pacific Tropical Cyclones

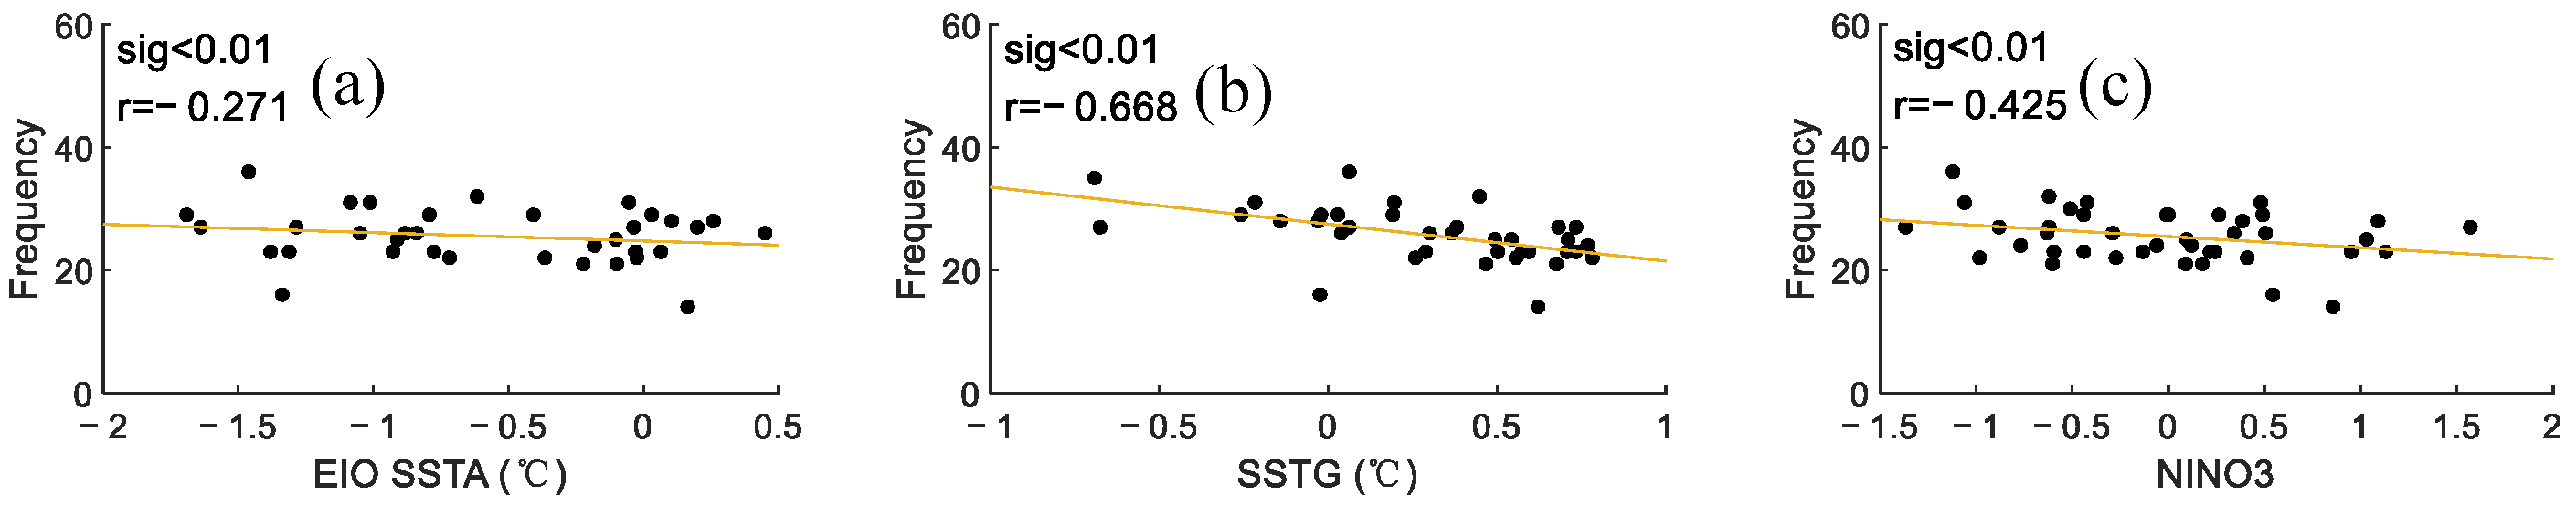
4.1.1. Relationship between EIOSSTA, SSTG, El Niño and Tropical Cyclone Frequency

Correlation analysis was respectively applied between the frequency of tropical cyclones in the Northwest Pacific from 1977–2018 and EIOSSTA, SSTG, and NIÑO3 (El Niño data). The results are shown in Figure 11.
It shows a negative correlation between SSTG and TCGF (tropical cyclone genesis frequency), with a correlation coefficient of -0.668. This means that the greater the temperature gradient between SWP and WWP, the lower the frequency of tropical cyclones in the northwest Pacific. This is in good agreement with the results of Zhan’s study [13]. The annual Niño3 index also had a negative linear correlation with the annual frequency (correlation coefficient = −0.425, sig < 0.01), which indicates that the TCGF occurring in the northwest Pacific Ocean during the El Niño phenomenon is small.
As shown in Table 4, there were nine El Niño events from 1977 to 2018. The three strongest occurred in 1982, 1997, and 2014, which all had very long durations of >1 year. The longest occurred in 2014, lasting 19 months.
Combined with the analysis of cyclone frequency in the study area (Figure 2), it can be seen that during the three strongest El Niño periods of 1982–1983, 1997–1998, and 2014–2016, the annual frequencies of tropical cyclones were lower than the 1977–2018 average and were much lower than in the preceding and succeeding years. Hence, Northwest Pacific tropical cyclones are less frequent than normal during stronger El Niño events. This is because El Niño disrupts the normal homeostasis of heat and moisture, reduces seawater evaporation, and reduces the energy available to generate tropical cyclones, thus reducing their number.

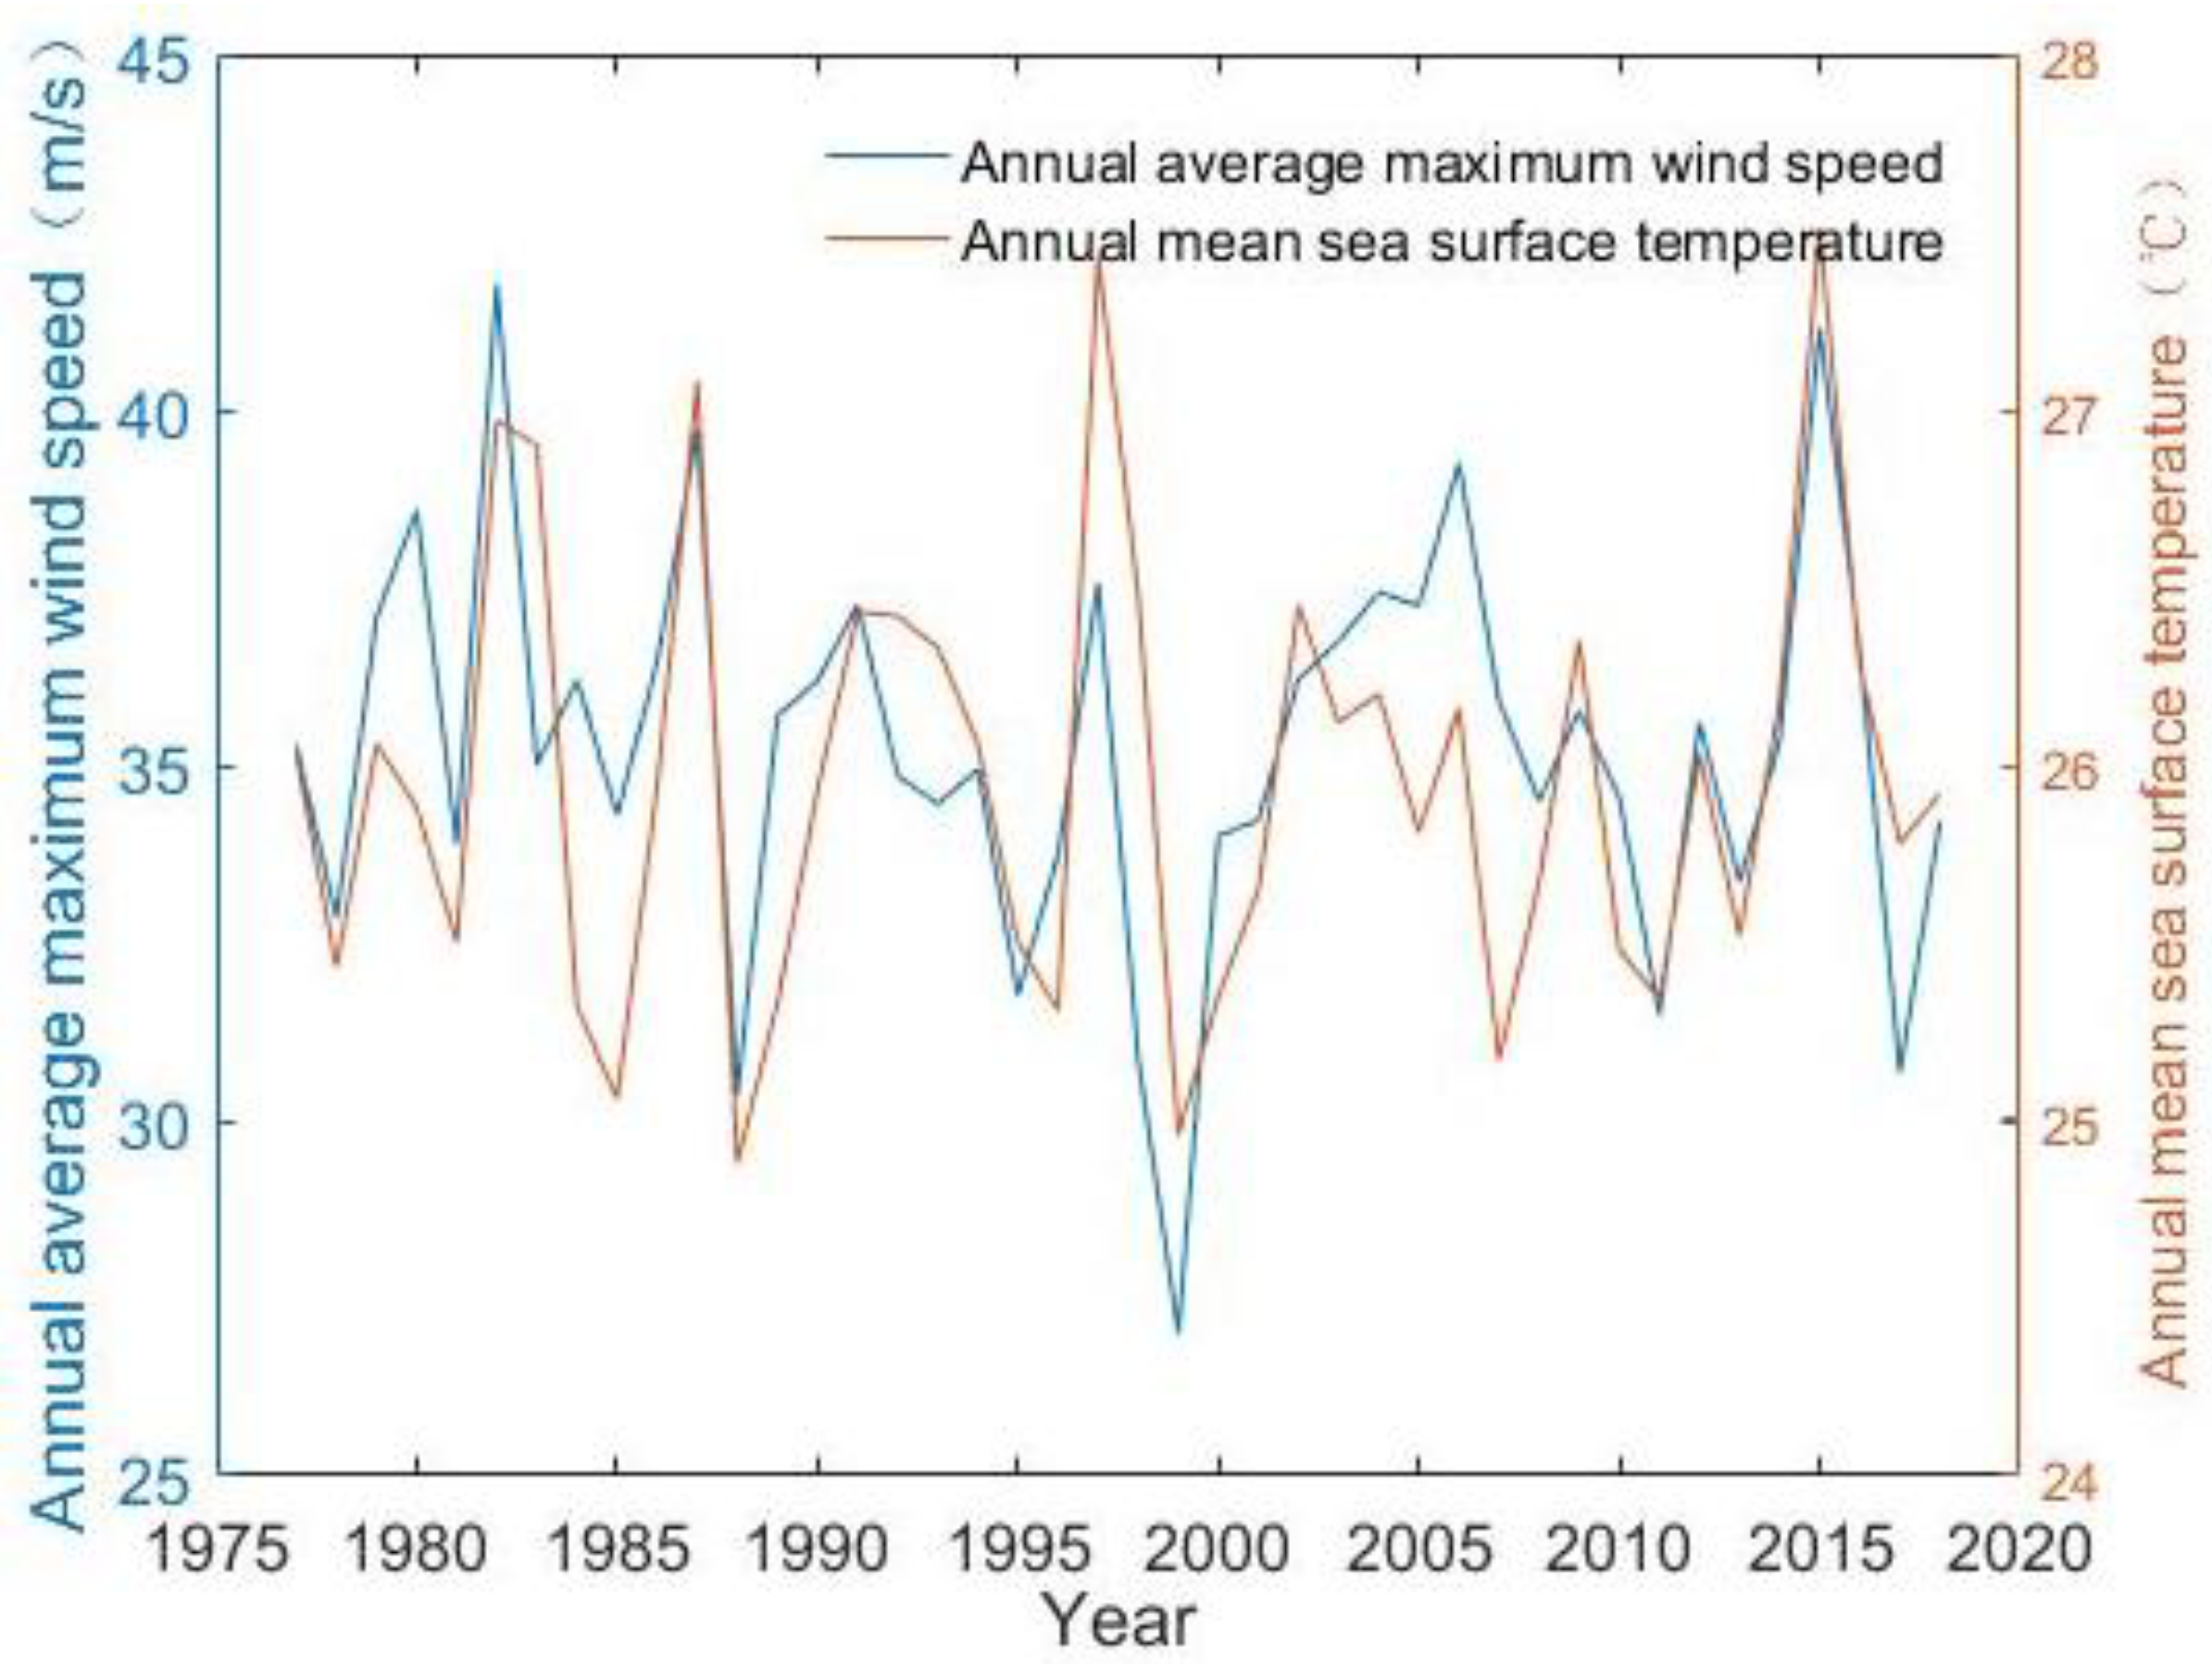
4.1.2. Relationship between SST, El Niño and Tropical Cyclone Intensity

Some studies have shown that the area with the most severe SST changes is the central and eastern Pacific Ocean near the equator. This area has the strongest impact on tropical cyclones in the Northwest Pacific [41]. The SST in the equatorial central and eastern Pacific Ocean from 1977 to 2018 was analysed, and correlations with the characteristics of Northwest Pacific tropical cyclones were identified.
As shown in Figure 12, the SST shows fluctuations, especially since the 21st century, when the overall trend has slightly increased.
A correlation analysis was carried out between the annual average maximum wind speed of Northwest Pacific tropical cyclones and the annual average SSTs of the central and eastern Pacific Ocean, 1977–2018 (Figure 12). The final result passed the test of sig < 0.01 and the correlation coefficient is 0.646. The positive correlation between the two is highly significant.
Comparing the changes in the annual mean SST with those of the mean annual maximum wind speed yielded the following two points: (1) Both factors showed peaks and troughs at similar times, for example, peaks in 1982, 1987, and 2015, and troughs in 1988 and 1999. (2) Both fluctuate over time with high consistency. In particular, after 2000, they both had slightly stronger trends.
The annual average intensity of tropical cyclones is represented by their annual average maximum wind speed. In the Northwest Pacific, this was correlated with the annual Niño3 index from 1977 to 2018 (correlation coefficient = 0.614, sig < 0.01). This indicates that tropical cyclones occurring during El Niño events are relatively intense (Figure 13).
This correlation is consistent with other research. Xu and Huang studied tropical cyclones in the Northwest Pacific and South China Sea in El Niño years up to 2015 [42]. They found that a lower frequency is associated with greater intensity, and the origin of tropical cyclones is more easterly. Cao et al. analysed the relationship between the cumulative energy of Northwest Pacific tropical cyclones of different strengths and the ENSO (El Niño-Southern Oscillation) index [43]. They found that ENSO events mainly affect the origin and frequency of super typhoons in this area by altering the relative vorticity and SST, and that their impact on Super TY events varies from month to month. Wang et al. also found that during El Niño events, the number of tropical cyclones landing in South China is less than normal, while their intensity is stronger [39].

4.2. Influence on Northwest Pacific Tropical Cyclones Based on Geographical Detector

A number of works in the literature have shown that SST anomalies between sea areas can have a different impact on the frequency and intensity of tropical cyclones, and the influence of SST factors on tropical cyclones has been considered based on this effect [38,39,41]. Nevertheless, most of them start with a single factor. In fact, the ocean environment is more complex, and the interaction of sea air between sea areas will make the SST factors closely related to each other and then combine to act on tropical cyclones. Thus, when the influence of a single factor is only taken into account, the chance of the results being favorable is increased. Hence, it is difficult to effectively reveal the association between SST factors and tropical cyclones. At the same time, although in the study of the whole region, the single factor may show a strong correlation, its influence degree is very unstable in the subdivisions. Zhan et al. explored the impact of three SST factors, namely EIOSSTA, SSTG, and EMI, on the annual frequency of tropical cyclones in the northwest Pacific. The authors showed that the three SST factors together contribute 72% to the annual frequency of tropical cyclones in the northwest Pacific [44], which is much higher than the single factor. Therefore, the factor detector and interaction detector in the geographic detector were used in this work. On top of that, the influence of a single SST factor and multiple factors on the frequency and intensity of tropical cyclones in thirteen divisions of the northwest Pacific Ocean was thoroughly investigated, while more desirable results were achieved.

4.2.1. Influence of SST Factors on the Frequency of Tropical Cyclones in the Northwest Pacific Ocean

(1)
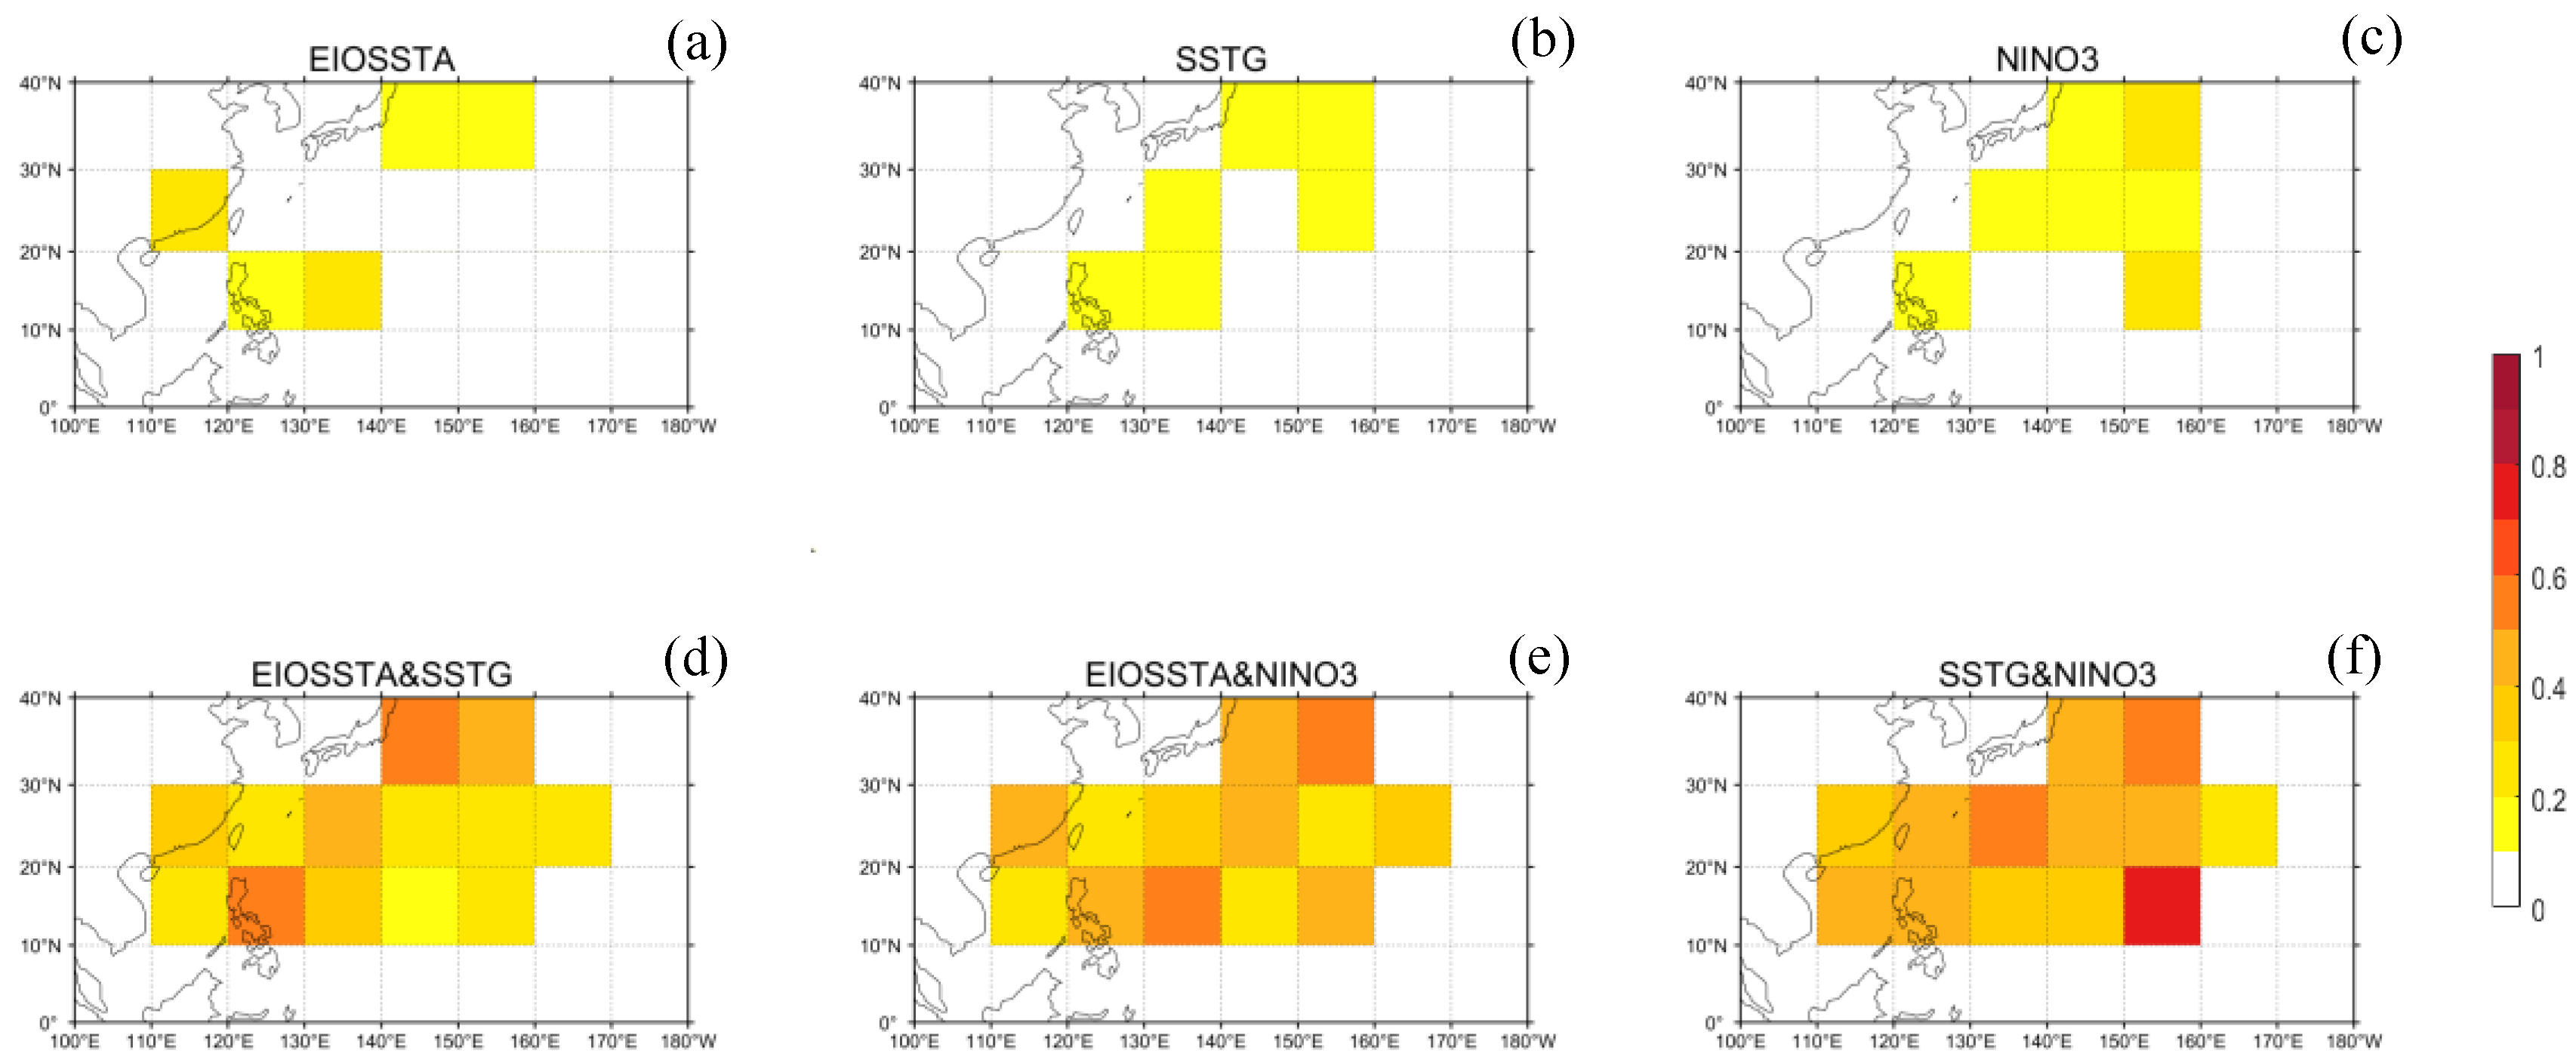
The contributions of the single SST factors EIOSSTA, SSTG, and El Niño were all low in the thirteen sub-regions and much lower than those of the interaction factors (Figure 14a–c). Among the single factors, the highest contributions of EIOSSTA, SSTG, and El Niño were 0.33, 0.22, and 0.27. However, the contributions of each subdivision increased significantly after the interaction, among which the highest contributions of EIOSSTA and SSTG, EIOSSTA and El Niño, SSTG and El Niño were 0.73, 0.54, and 0.65, respectively (Figure 14d–f). Combined with Table 1, it can be found that the interaction type of the three SST factors was a two-factor enhancement, indicating that any combination of two SST factors has played a significant role in promoting the increase in the contribution of tropical cyclone frequency.
(2)
It was found that when two factors interact, the impact on TCGF in the coastal and eastern regions of Japan is significant. Especially, the contribution of EIOSSTA interacting with SSTG to TCGF in the two subdivisions around Japan reached 0.73 and 0.49, which was the highest among all subdivisions. Meanwhile, the contribution of EIOSSTA interacting with El Niño and SSTG interacting with El Niño to the TCGF in the subdivision around Japan also remained high. Combined with the study of Xu et al. [45], it can be argued that the area affected by tropical cyclones in the Sea of Japan accounts for a high percentage, and it was affected by 140 tropical cyclones from 1990 to 2017. Among them, the South China Sea region exhibited the most serious impact.
(3)
The results of the factor interaction in the South China Sea region are at a high level overall, indicating that TCGF in the South China Sea region is closely related to the three SST factors, especially the results of the EIOSSTA and El Niño interaction and the SSTG and El Niño interaction, which contribute 0.54 and 0.46 to the frequency of tropical cyclones, second only to the sea around Japan. By combining the tropical cyclone landfalls in China from 1977 to 2018, it is clear that Guangdong, Guangxi, Fujian, Hainan, and Taiwan provinces are the main regions of tropical cyclone landfalls, and all of these regions are close to the South China Sea.

4.2.2. Influence of SST Factors on the Intensity of Tropical Cyclones in the Northwest Pacific Ocean

(1)
The contribution of a single factor to the intensity of tropical cyclones in the thirteen sub-regions was much lower than that of the interaction factor (Figure 15a–c). Among the single factors, the highest contributions of EIOSSTA, SSTG, and El Niño were 0.30, 0.19, and 0.23, respectively. However, the contributions of each subdivision increased significantly and altered the interaction, among which the highest contributions of the EIOSSTA and SSTG, EIOSSTA and El Niño, and SSTG and El Niño interactions were 0.54, 0.57, and 0.73, respectively (Figure 15d–f). Combined with Table 1, it can be found that the interaction types of the three SST factors are also two-factor enhancements, indicating that any combination of two SST factors has played a significant role in promoting the contribution of tropical cyclone intensity. This result is also consistent with the effect of the interaction factor on tropical cyclone frequency in Section 4.2.1.
(2)
The overall contribution of EIOSSTA, SSTG, and El Niño interaction to tropical cyclone intensity in the coastal and eastern regions of Japan was lower than the contribution to frequency under the same conditions. For example, the contribution of EIOSSTA and SSTG interaction to tropical cyclone intensity was 0.54 and 0.42 in the two subdivisions around Japan, which was lower than 0.73 and 0.49 for the frequency. The same situation also occur in some areas of the South China Sea. For Japan [45], although tropical cyclones occur more frequently, they are basically dominated by mildly dangerous tropical cyclones, and the intensity of these cyclones themselves has been significantly reduced when they approach Japan. Therefore, the correlation between the SST factor and intensity was much weaker compared with the frequency. Tropical cyclones with rapidly weakening intensity and those with slowly weakening intensity accounted for 47.6% and 69.2% of the total sample in the South China Sea since 1960 [46], indicating that a significant fraction of tropical cyclones in the South China Sea have a tendency to weaken. The influence of the interaction on the intensity of tropical cyclones was lower than that on the frequency, which may be due to the fact that typhoons were also affected by topography, ocean currents, and other factors during their movement, thus weakening the contribution of sea temperature factors to them.
(3)
The contribution of EIOSSTA interacting with SSTG to tropical cyclone intensity was lower than that of EIOSSTA interacting with El Niño and SSTG interacting with El Niño to tropical cyclone intensity in most subdivisions, indicating that the SST factor interacting with El Niño can explain tropical cyclone intensity better. In the analysis of the influence of the interaction factor and frequency, El Niño also showed a better interpretation effect.

5. Conclusions

This paper is based on 42 years of tropical cyclone data from the Northwest Pacific obtained by global meteorological satellites. In this study, data processing was carried out by means of classification statistics, anomaly analysis, spatial statistical analysis, and correlation analysis. The frequency and intensity of tropical cyclones in the Northwest Pacific were statistically analysed, as were their effects on various regions of China. The main influences on tropical cyclones in the Northwest Pacific Ocean are SST and El Niño events.
From 1977 to 2018, the annual frequency of tropical cyclones decreased. After 1994, the frequency decreased significantly and then rebounded in recent years. In terms of intensity, most cyclones were tropical storms. In terms of seasonal changes, the active periods are mainly summer and autumn, when 85% of cyclones occur. The three densest source areas were in the South China Sea (110–120° N, 10–20° E) and the Northwest Pacific Ocean (5–20° N, 125–145° E, and 5–20° N, 145–155° E). Among them, the South China Sea is the most intense area for tropical cyclones.
A total of 314 tropical cyclones affected China in the study period, including 55 strong typhoons that occurred in 23 provinces, municipalities, and autonomous regions. Among them, Guangdong Province had the most frequent and severe typhoons. In general, coastal areas are more affected by tropical cyclones than inland areas.
By analysing the main influences on tropical cyclones, the trends in SST and maximum cyclone wind speed were found to be similar and highly correlated. During the strongest El Niño event, the annual frequency of tropical cyclones was lower than the multi-year average. Hence, during stronger El Niño events, the number of tropical cyclones in the Northwest Pacific will be less than normal. Furthermore, there were significant correlations between the El Niño index and the frequency and intensity of tropical cyclones. Years with a high El Niño index experienced fewer tropical cyclones of greater intensity.
On this basis, a geographic detector was used to further explore the joint effects of various factors on the frequency and intensity of tropical cyclones in the Northwest Pacific Ocean. From the acquired results, it was demonstrated that the contribution of multiple factors interacting with the variation characteristics of tropical cyclones was significantly better than that of the single factors.
The following aspects warrant further research. Firstly, the source area characteristics were assessed in only three dense areas. In future research, the study area could be divided on a finer scale. Secondly, the intensity statistics were only analysed for landfalling tropical cyclones. Cyclones that did not make landfall but still had an impact were not counted. Finally, this paper only analysed the most important and frequently mentioned influences on tropical cyclones. There are many other factors that may be related and require further study.

Author Contributions

Conceptualization, J.W. (Jie Wang) and Y.Y.; Data curation, S.Z. and P.Y.; Formal analysis, J.W. (Jiarui Wang) and X.W.; Investigation, J.X. and X.W.; Methodology, J.L.; Re-sources, S.Z.; Software, J.L.; Validation, J.X. and X.W.; Writing—original draft, J.W. (Jie Wang) and J.L.; Writing—review & editing, Y.Y. All authors have read and agreed to the published version of the manuscript.

Funding

This research received no external funding.

Institutional Review Board Statement

Not applicable.

Informed Consent Statement

Not applicable.

Data Availability Statement

Data available on request from the authors. The data that support the findings of this study are available from the corresponding author, [Yijie Yang], upon reasonable request.

Acknowledgments

The authors acknowledge NII for Tropical cyclone data (https://www.nii.ac.jp/, accessed on 20 December 2020), El Niño data from http://www.cpc.ncep.noaa.gov/data/indices/sstoi.indices (accessed on 26 May 2019), and ECMWF for providing SST data (https://apps.ecmwf.int, accessed on 30 December 2020). We also acknowledge the grammar guide provided by the Native EE.

Conflicts of Interest

The authors declare that they have no known competing financial interests or personal relationships that could have appeared to influence the work reported in this paper. This research did not receive any specific grant from funding agencies in the public, commercial, or not-for-profit sectors.

References

  1. Li, Z. Research on Typhoon Disaster Loss Prediction Method. Master’s Thesis, South China University of Technology, Guangzhou, China, 2016. [Google Scholar]
  2. Zheng, F.; Zeng, Z.; Lei, X.; Zeng, L. Statistical analysis of sudden intensification of typhoons in China’s coastal waters. Plateau Meteorol. 2016, 35, 198–210. [Google Scholar]
  3. Gong, Z.; Hu, L. Analysis of Influencing Factors in Typhoon Disaster Assessment. J. Nat. Disasters 2015, 24, 203–213. [Google Scholar]
  4. Chen, P.Y.; Yang, Y.H.; Lei, X.T.; Qian, Y.-Z. Cause analysis and preliminary hazard estimate of typhoon disaster in China. J. Nat. Disasters 2009, 18, 64–73. [Google Scholar]
  5. Gu, X.; Wu, Z.; Zhao, P.; Liang, Y. Statistical analysis of typhoons that landed on the inland coast of my country and affected the central and western regions of Huanghuai. In Proceedings of the 32nd Annual Meeting of the Chinese Meteorological Society, Tianjin, China, 14–16 October 2015; pp. 8–10. [Google Scholar]
  6. Kossin, J.P.; Olander, T.L.; Knapp, K.R. Trend Analysis with a New Global Record of Tropical Cyclone Intensity. J. Clim. 2013, 26, 9960–9976. [Google Scholar] [CrossRef] [Green Version]
  7. Stowasser, M.; Wang, Y.; Hamilton, K. Tropical cyclone changes in the western North Pacific in a global warming scenario. J. Clim. 2007, 20, 2378–2396. [Google Scholar] [CrossRef] [Green Version]
  8. Cheng, Y.; Gao, Y.; Tian, M.; Shi, H.; Cao, X.; Gao, J. Preliminary study on variation characteristics of tropical cyclones in the Northwest Pacific Ocean from 1949 to 2017. Bull. Oceanol. Limnol. 2019, 1, 31–38. [Google Scholar] [CrossRef]
  9. Feng, H.; Li, T.; Jia, L.; Bi, M.; Peng, M. Decrease of Tropical Cyclone Genesis Frequency in the Western North Pacific since 1960s. Dyn. Atmos. Ocean. 2017, 81, 42–50. [Google Scholar]
  10. Zhan, R.-F.; Wang, Y.; Tao, L. Intensified impact of East Indian Ocean SST anomaly on tropical cyclone genesis frequency over the western North Pacific. J. Clim. 2014, 27, 8724–8739. [Google Scholar] [CrossRef]
  11. Wang, X.; Ren, F. Variations in Frequency and Intensity of Strong Tropical Cyclones Affecting China During 1957–2004. Adv. Clim. Chang. Res. 2007, 3, 5. [Google Scholar]
  12. Zhou, B.; Cui, X. Sea surface temperature east of Australia: A predictor of tropical cyclone frequency over the western North Pacific? Chin. Sci. Bull. 2011, 56, 196–201. [Google Scholar] [CrossRef] [Green Version]
  13. Zhan, R.-F.; Ying, M.; Chen, P.Y. On tropical cyclone activity over the western North Pacific in 2012. Trop. Cyclone Res. Rev. 2013, 2, 35–44. [Google Scholar]
  14. Sobel, A.H.; Camargo, S.J.; Hall, T.M.; Lee, C.Y.; Tippett, M.K.; Wing, A.A. Human influence on tropical cyclone intensity. Science 2016, 353, 242–246. [Google Scholar] [CrossRef] [PubMed] [Green Version]
  15. Shan, K.; Yu, X. Interdecadal variability of tropical cyclone genesis frequency in western North Pacific and South Pacific ocean basins. Environ. Res. Lett. 2020, 15, 064030. [Google Scholar] [CrossRef]
  16. Mei, W.; Xie, S.P.; Primeau, F.; McWilliams, J.C.; Pasquero, C. Northwestern Pacific typhoon intensity controlled by changes in ocean temperatures. Sci. Adv. 2015, 1, e1500014. [Google Scholar] [CrossRef] [Green Version]
  17. Hu, C.; Zhang, C.; Yang, S.; Chen, D.; He, S. Perspective on the northwestward shift of autumn tropical cyclogenesis locations over the western North Pacificfrom shifting ENSO. Clim. Dyn. 2018, 51, 2455–2465. [Google Scholar] [CrossRef] [Green Version]
  18. Zhao, S.; Gao, G.; Sun, X.; Yang, X. Climatological Characteristics of Tropical Cyclones in the Northwestern Pacific. J. Appl. Meteorol. Sci. 2009, 20, 9. [Google Scholar]
  19. Hsu, P.-C.; Chu, P.-S.; Murakami, H.; Zhao, X. An Abrupt Decrease in the Late-Season Typhoon Activity over the Western North Pacific. J. Clim. 2014, 27, 4296–4312. [Google Scholar] [CrossRef]
  20. Choi, Y.; Ha, K.J.; Ho, C.I.; Chung, C.E. Interdecadal change in typhoon genesis condition over the western North Pacific. Clim. Dyn. 2015, 45, 3243–3255. [Google Scholar] [CrossRef]
  21. Lai, F.; Jing, J. The Inter-annual Variation Characterisitics of the Tropical Cyclone Intensity in the Western North Pacific and Atmospheric Circulation Backgound Analysis. J. Appl. Meteorol. Sci. 2012, 28, 12. [Google Scholar] [CrossRef]
  22. Luo, X.; Yao, C.; Tan, J. Analysis on numbers and intensity characteristics of typhoon landed in the South China. Acta Meteorol. Sin. 2018, 35, 10. [Google Scholar]
  23. He, H.-Z.; Jing, Y.; Gong, D.; Mao, R.; Gao, M. Decadal changes in tropical cyclone activity over the western North Pacific in the late 1990s. Clim. Dyn. 2015, 45, 3317–3329. [Google Scholar] [CrossRef]
  24. Yang, Y.; Ying, M.; Chen, B. Climate change characteristics of tropical cyclones landing in China in the past 58 years. J. Meteorol. 2009, 67, 689–696. [Google Scholar]
  25. Chen, G.H.; Huang, R. Influence of monsoon over thewarm pool on interannual variation of tropical cyclone activityover the western North Pacific. Adv. Atmos. Sci. 2008, 25, 319–328. [Google Scholar] [CrossRef]
  26. Wang, B.; Chan, J. How strong ENSO events affecttropical cyclone activity over the western North Pacific. J. Clim. 2002, 15, 1643–1658. [Google Scholar] [CrossRef]
  27. Kim, H.M.; Webster, P.; Curry, J. Modulation of NorthPacific tropical cyclone activity by three phases of ENSO. J. Clim. 2011, 24, 1839–1849. [Google Scholar] [CrossRef] [Green Version]
  28. Wu, L.; Zhang, H.; Chen, J.; Feng, T. Impact of two types of El Niño on tropical cyclones over the western North Pacific:Sensitivity to location and intensity of Pacific warming. J. Clim. 2018, 31, 1725–1742. [Google Scholar] [CrossRef]
  29. Merrill, R.T. Environmental influences on hurricane intensification. J. Atmos. Sci. 1988, 45, 1678–1687. [Google Scholar] [CrossRef]
  30. Zehr, R. Tropical Cyclogenesis in the Western North Pacific; NOAA Tech. Report NESDIS 61; US Department of Commerce: Washington, DC, USA, 1992; 181p. [Google Scholar]
  31. DeMaria, M. The effect of vertical shear on tropical cyclone intensity change. J. Atmos. Sci. 1996, 53, 2076–2087. [Google Scholar] [CrossRef]
  32. Zhan, R.F.; Wang, Y.; Wen, M. The SST gradient between thesouthwestern Pacific and the western Pacific warm pool: A new factor controlling the northwestern Pacific tropical cy-clone genesis frequency. J. Clim. 2013, 26, 2408–2415. [Google Scholar] [CrossRef] [Green Version]
  33. Chen, G.; Tam, C.Y. Different impacts of two kinds ofPacific Ocean warming on tropical cyclone frequency over the western North Pacific. Geophys. Res. Lett. 2010, 37, L01803. [Google Scholar] [CrossRef] [Green Version]
  34. Chan, J.C.; Liu, K.S. Global Warming and Western North Pacific Typhoon Activity from an Observational Perspective. J. Clim. 2004, 17, 4590–4602. [Google Scholar] [CrossRef]
  35. Li, Z. Research on Statistical Model of Typhoon Intensity Prediction in the Northwest Pacific. Master’s Thesis, Xiangtan University, Xiangtan, China, 2018. [Google Scholar]
  36. Wang, J.F.; Li, X.H.; Christakos, G.; Liao, Y.L.; Zhang, T.; Gu, X. Geographical Detectors-Based Health Risk Assessment and Its Application in the Neural Tube Defects Study of the Heshun Region, China. Int. J. Geogr. Inf. Sci. 2010, 24, 107–127. [Google Scholar] [CrossRef]
  37. Liao, K.T.; Song, Y.J.; Xie, S.H.; Luo, Y.; Liu, Q.; Lin, H. Quantitative Analysis of the Factors Influencing the Spatial Distribution of Benggang Landforms Based on a Geographical Detector. ISPRS Int. J. Geo-Inf. 2022, 11, 337. [Google Scholar] [CrossRef]
  38. Gan, B.; Wu, L. Seasonal and Long-Term Coupling between Wintertime Storm Tracks and Sea Surface Temperature in the North Pacific. J. Clim. 2013, 26, 6123–6136. [Google Scholar] [CrossRef]
  39. Wang, W.; Lin, Y.; Xu, G.; Guo, R.; Cheng, Y.; Chen, S. Influence of El Niño/La Niña events from 1951 to 2016 on typhoons landing in South China. Subtrop. Soil Water Conserv. 2018, 30, 13–19. [Google Scholar]
  40. Zhan, R.; Wang, Y.; Wu, C.-C. Impact of SSTA in the east Indian Ocean on the frequency of northwest Pacific tropical cyclones: A regional atmospheric model study. J. Clim. 2011, 24, 6227–6242. [Google Scholar] [CrossRef]
  41. Huang, Y.; Wang, Y.; Li, L. Study on the changing trend of tropical cyclones in the Northwest Pacific. Meteorol. Hydrol. Equip. 2011, 4, 22. [Google Scholar]
  42. Xu, Y.; Huang, Y. The activity characteristics and forecasting difficulties of tropical cyclones over Western North Pacific and South China Sea in 2015. J. Mar. Meteorol. 2017, 37, 31–41. [Google Scholar]
  43. Cao, Z.; Hu, B.; Yang, X.; Wang, X.; He, X.; Tang, Y. Research on the effects of the ENSO on Tropical Cyclone Activity of different grades over the western North Pacific. Acta Oceanol. Sin. 2013, 35, 21–34. (In Chinese) [Google Scholar]
  44. Zhan, R.F.; Wang, Y.; Zhao, J.W. Contributions of SST Anomalies in the Indo-Pacific Ocean to the Interannual Variability of Tropical Cyclone Genesis Frequency over the Western North Pacific. J. Clim. 2019, 32, 3357–3372. [Google Scholar] [CrossRef]
  45. Xu, X.L.; Shen, Z.C.; Li, J.H.; Wang, S. The spatio-temporal characteristics of tropical cyclones hazard in the Maritime Silk Road. J. Geo-Inf. Sci. 2020, 22, 2383–2392. [Google Scholar] [CrossRef]
  46. Liang, M.; Zhong, X.; Xu, J.; Xu, F. Sudden Changes in Tropical Cyclone Intensity in South China Sea from 1960 to 2017. J. Guangdong Ocean Univ. 2020, 40, 83–91. [Google Scholar]
Figure 1. Track data of tropical cyclones in the Western Pacific from 1977 to 2018.
Sustainability 15 03933 g001
Figure 2. Annual frequency of tropical cyclones in the Northwest Pacific from 1977 to 2018.
Sustainability 15 03933 g002
Figure 3. Climatological monthly (histogram) and seasonal (pie chart) tropical cyclone frequencies in the Northwest Pacific from 1977 to 2018.
Sustainability 15 03933 g003
Figure 4. Frequencies of tropical cyclones of different intensity in the Northwest Pacific, 1977–2018.
Sustainability 15 03933 g004
Figure 5. Frequency of tropical cyclones of each intensity in each year, Northwest Pacific, 1977–2018.
Sustainability 15 03933 g005
Figure 6. Average annual intensity of Northwest Pacific tropical cyclones, 1977–2018.
Sustainability 15 03933 g006
Figure 7. Monthly mean maximum wind speeds of Northwest Pacific tropical cyclones, 1977–2018.
Sustainability 15 03933 g007
Figure 8. Source areas of tropical cyclones in the Northwest Pacific from 1977 to 2018.
Sustainability 15 03933 g008
Figure 9. Frequency and intensity of tropical cyclones in each Chinese province, 1977–2018.
Sustainability 15 03933 g009
Figure 10. Frequency and intensity of tropical cyclones that affected each Chines province, 1977–2018.
Sustainability 15 03933 g010
Figure 11. Correlation analysis of tropical cyclone genesis frequency and the (a) EIO SSTA (b) SSTG (c) Niño3 index in the Northwest Pacific Ocean.
Sustainability 15 03933 g011
Figure 12. Annual average maximum wind speeds of tropical cyclones in the Northwest Pacific and annual average SSTs in the central and eastern and Pacific Ocean, 1977–2018.
Sustainability 15 03933 g012
Figure 13. Scatterplot of tropical cyclone annual average maximum wind speed and (a) equatorial central and eastern Pacific Ocean annual average SST (b) Niño3 index in the Northwest Pacific, with fitted linear model.
Sustainability 15 03933 g013
Figure 14. The contributions of (a) EIOSSTA (b) SSTG (c) El Niño (d) EIOSSTA and SSTG (e) EIOSSTA and El Niño (f) SSTG and El Niño, and the WNP TCGF in the typhoon season in each 10° × 10° grid box during 1977–2018.
Sustainability 15 03933 g014
Figure 15. The contributions of (a) EIOSSTA (b) SSTG (c) El Niño (d) EIOSSTA and SSTG (e) EIOSSTA and El Niño (f) SSTG and El Niño, and the WNP tropical cyclone intensity in the typhoon season in each 10° × 10° grid box during 1977–2018.
Sustainability 15 03933 g015
Table 1. Types of interaction detectors.
DescriptionInteraction
q(X1 ∩ X2) < Min(q(X1),q(X2))Weaken, nonlinear
Min(q(X1),q(X2)) < q(X1 ∩ X2) < Max(q(X1),q(X2))Weaken, single factor nonlinear
q(X1 ∩ X2) > Max(q(X1),q(X2))Enhanced, double factors
q(X1 ∩ X2) = q(X1) + q(X2)Independent
q(X1 ∩ X2) > q(X1) + q(X2)Enhanced, nonlinear
Table 2. Classification of tropical cyclones in China.
Tropical Cyclone RatingMaximum Average Wind Speed Near Bottom Centre (m/s)Maximum Wind Near Bottom Centre (Level)
1—Tropical depression (TD)10.8–17.16–7
2—Tropical storm (TS)17.2–24.48–9
3—Severe tropical storm (STS)24.5–32.610–11
4—Typhoon (TY)32.7–41.412–13
5—Strong typhoon (STY)41.5–50.914–15
6—Super typhoon (SuperTY)≥51.0≥16
Table 3. Annual average frequency of tropical cyclones that affected China by period.
Period1977–19791980–19891990–19992000–20092010–2018
Average annual frequency 77.57.86.88
Table 4. El Niño event statistics, 1977–2018.
NumberTimingDuration (Months)Strength
11982.05–1983.0614Strong
21986.09–1988.0117Medium
31991.06–1992.0613Strong
41994.01–1995.0214Medium
51997.05–1998.0412Strong
62002.06–2003.029Medium
72004.08–2005.038Weak
82009.08–2010.038Medium
92014.11–2016.0519Strong
Disclaimer/Publisher’s Note: The statements, opinions and data contained in all publications are solely those of the individual author(s) and contributor(s) and not of MDPI and/or the editor(s). MDPI and/or the editor(s) disclaim responsibility for any injury to people or property resulting from any ideas, methods, instructions or products referred to in the content.

