Article

Impact Assessment of Tropical Cyclones Amphan and Nisarga in 2020 in the Northern Indian Ocean

by
K. K. Basheer Ahammed
1,
Arvind Chandra Pandey
2,*,
Bikash Ranjan Parida
2,
Wasim
2 and
Chandra Shekhar Dwivedi
1,2
1
Department of Geography, School of Natural Resource Management, Central University of Jharkhand, Ranchi 835222, India
2
Department of Geoinformatics, School of Natural Resource Management, Central University of Jharkhand, Ranchi 835222, India
*
Author to whom correspondence should be addressed.
Sustainability 2023, 15(5), 3992; https://doi.org/10.3390/su15053992
Submission received: 23 November 2022 / Revised: 14 February 2023 / Accepted: 19 February 2023 / Published: 22 February 2023

Abstract

:
The Northern Indian Ocean (NIO) is one of the most vulnerable coasts to tropical cyclones (TCs) and is frequently threatened by global climate change. In the year 2020, two severe cyclones formed in the NIO and devastated the Indian subcontinent. Super cyclone Amphan, which formed in the Bay of Bengal (BOB) on 15 May 2020, made landfall along the West Bengal coast with a wind speed of above 85 knots (155 km/h). The severe cyclone Nisarga formed in the Arabian Sea (ARS) on 1 June 2020 and made landfall along the Maharashtra coast with a wind speed above 60 knots (115 km/h). The present study has characterized both TCs by employing past cyclonic events (1982–2020), satellite-derived sea surface temperature (SST), wind speed and direction, rainfall dataset, and regional elevation. Long-term cyclonic occurrences revealed that the Bay of Bengal encountered a higher number of cyclones each year than the ARS. Both cyclones had different intensities when making landfall; however, the regional elevation played a significant role in controlling the cyclonic wind and associated hazards. The mountain topography on the east coast weakened the wind, while the deltas on the west coast had no control over the wind. Nisarga weakened to 30 knots (56 km/h) within 6 h from making landfall, while Amphan took 24 h to weaken to 30 knots (56 km/h). We analyzed precipitation patterns during the cyclones and concluded that Amphan had much more (1563 mm) precipitation than Nisarga (684 mm). Furthermore, the impact on land use land cover (LULC) was examined in relation to the wind field. The Amphan wind field damaged 363,837 km2 of land, whereas the Nisarga wind field affected 167,230 km2 of land. This research can aid in the development of effective preparedness strategies for disaster risk reduction during cyclone impacts along the coast of India.

1. Introduction

Coastal regions are constantly affected by natural disasters such as cyclones, tsunamis, storm surges, sea-level rise, and shoreline alterations, posing an enormous risk to the human population living in coastal environments [1,2,3]. Changes in the coastline due to rising sea levels may result in permanent waterlogging in the low-lying coastal regions and have a substantial impact on the coastal ecosystem [4,5]. Indian coastal regions are frequently threatened by various climatic and weather phenomena, such as sea-level rise, extreme weather events, El Niño–Southern Oscillation (ENSO), and global teleconnection [6]. India is the second-most vulnerable county to storm surges, following Bangladesh, in South Asia [7]. In view of predicted global warming and sea-level rise, there has been growing worry about the susceptibility of coasts to tropical cyclones (TCs) and related storm surges [8]. Storm surge is a major source of coastal flooding and has a negative impact on coastal urban cities in the future [7,9]. Cyclones and storm surges are not common processes of coastal degradation; however, they can damage entire coastal regions within a short span of time [10].
The Indian Ocean is not perceived as one of the most active cyclonic basins in the globe [11]; nevertheless, it is exposed to nearly 15% of the world’s TCs [12]. In particular, the Northern Indian Ocean (NIO) alone contributes about 7% to global TCs. The majority of TCs in the NIO have their initial genesis over the Bay of Bengal (BOB) and strike the east coast of India [13]. Cyclone activities in the NIO are most dominant during the months of pre (April–June) and post (October–December) monsoon seasons [14]. Typically, over the NIO, TCs are a rotational low-pressure system. According to the Indian Meteorological Department (IMD), they are classified as Depression (D), Deep Depression (DD), Cyclonic Storm (CS), Severe Cyclonic Storm (SCS), Very Severe Cyclonic Storm (VSCS), Extremely Severe Cyclonic Strom (ESCS), and Super Cyclonic Storm (SuCS). The consociated maximum wind speeds in terms of knots are <29 (54 km/h) for D, 30 (55 km/h) to 34 (63 km/h) for DD, 35 (64 km/h) to 49 (91 km/h) for CS, 50 (92 km/h) to 64 (120 km/h) for SCS, 65 (121 km/h) to 89 (165 km/h) for VSCS, 90 (166 km/h) to 119 (220 km/h) for ESCS, and >120 (221 km/h) for SuCS [15,16]. Although they usually affect coastal areas, they could pass through far inland landmasses and cause enormous damage to infrastructure and the economy [15]. Moreover, the frequency and intensity of cyclones in the BOB are five times higher than in the ARS because of the warmer sea surface temperature (SST) in the BOB [17,18,19], which is one of the favorable conditions that sustain TCs. It may be remarked that, over the BOB, the highest SSTs are recorded during May and November. Half of the TCs did not sustain over the ARS because of the colder SST than in other adjacent regions [20]. However, over the last few years (2014–2019), the pattern and occurrence of TCs have significantly increased in the ARS. Typically, one extremely severe cyclone occurred once in every 4–5 years in the ARS. However, during 2014–2019, nine extremely severe cyclones were recorded in the ARS (i.e., Nilofar cyclone in 2014; Mega and Chapala cyclones in 2015; Luban and Mekunu cyclones in 2018; and Vayu, Hika, Kyar and Maha cyclones in 2019) [21,22]. Nevertheless, TCs frequently affected the eastern and western coast of India and account for a large number of deaths as well as loss of livelihood and property [23]. The eastern coast of India is much more affected by cyclones than the western coast [24]. Between 1891 and 2000, nearly 308 cyclones affected the east coast of India, among which 103 cyclones were categorized as severe. In contrast, the western coast of India experienced 48 cyclones during the same period and, among these, 24 cyclones belong to the category of severe storms [23].
Significant research was undertaken to assess the changes in TC activity [24,25] and its link to global warming after the Intergovernmental Panel for Climate Change (IPCC) reported the probability of an increase in the intensity of TCs [26]. The heat transferred from the ocean to atmosphere is the primary source of energy for TCs. Hence, the regional variations in sea thermal states are very important for TC activities [27,28,29]. In addition, the Indian Ocean is the second-most affected by warming of the ocean among the oceans [30]. Many studies revealed that TCs in the Indian Ocean might be influenced by regional SST anomalies in the tropical Indian Ocean and remote SST anomalies in the tropical Pacific Ocean [29]. However, the influences of the tropical Indo-Pacific Ocean SST on TC activities in the whole Indian Ocean on a wide basin scale are still unclear [29].
Assessment of TC precipitation is important because of the massive loss of life and property associated with cyclone-induced flash floods and landslides [31]. Recently, the relationship between cyclone intensity and precipitation has become a considerable topic of interest among researchers, as extreme precipitation when TCs make landfall has devastated coastal areas [31,32]. Therefore, a better understanding of the factors controlling the distribution of cyclonic precipitation is very important for real-time crisis management in the cyclone impact area. Thus, monitoring real-time cyclonic precipitation is crucial during TCs. There are many studies carried out to monitor cyclonic precipitation using Earth observational satellites, as they provide rather precise estimates of precipitation during landfall in comparison with radar estimates and gauge data [33,34,35].
Extreme events are always a threat to the coastal ecosystem and community; however, we have failed to formulate a sustainable conservation policy for coastal ecosystems and habitats. The present study aimed to showcase the spatiotemporal distribution of two selected TCs in the NIO during 2020, that is, Amphan and Nisarga, and the findings will help with policy formulation and conservation at the regional level. According to the IMD classification of TCs, the Amphan cyclone in the BoB was classified as a “Super Cyclonic Storm” [36], whereas the Nisarga cyclone in the ARS was classified as a “Severe Cyclonic Storm” [37]. The NIO experienced a warming trend in 2020, with an intense and sustained positive Indian Ocean Dipole (IOD) event instead of the prevailing El Niño [38]. Both cyclones developed during the positive IOD event, which was very favorable for cyclone formation [38]. Therefore, a comparative analysis was carried out to differentiate the impact in different geological settings (i.e., elevation, coastal bathymetry, and geomorphology) under similar conditions.
The objective of the present study is to characterize two recent cyclones, namely Amphan in the BOB and Nisarga in the ARS, as both cyclones were the most devastating TCs in the year 2020. Therefore, further analysis was carried out between them to assess the potential impact on the coastal region land use land cover (LULC). The study also systematically evaluated the effects of TC intensity on the distribution of precipitation and SST. The investigation provides useful insight into the TCs and their spatiotemporal distribution in the NIO, which helps to understand the pattern of TCs.

2. Materials and Methods

2.1. Historical Cyclones in the Northern Indian Ocean (NIO)

The present study evaluated historical cyclones from 1982 to 2020 to understand the pattern, frequency, and intensity in the northern Indian Ocean. Three-hourly cyclone movement data were collected from the IMD best track data and further categorized into two based on the origin of the cyclone—those originating in the Bay of Bengal and the ARS. During the last 39 years, a total of 344 cyclones were generated and affected the Indian subcontinent; among them, 250 originated in the BOB while 84 originated in the ARS. Furthermore, the study investigated the wind speed during the cyclone formation with 3 h intervals. Using 3-hourly data over the period of 39 years (1982–2020), we calculated the maximum sustained wind and average wind intensity for each cyclone.

2.2. Estimated Trajectory and Wind of Cyclones Amphan and Nisarga

This study investigates the cyclones and their characterization in relation to wind intensity, sea surface temperature, and precipitation over the NIO. In the year 2020, the Indian subcontinent experienced two deadly TCs: one each in the BOB and ARS, and both cyclones devastated the coastal zone. The present study compares the formation, intensification, and impacts of both cyclones. Super cyclone Amphan, pronounced “UM-PAN”, formed in the Indian Ocean on 15 May 2020 and gradually moved into the BOB in the NIO and made its landfall on the coast of West Bengal on 20 May 2020. The SCS Nisarga was the strongest TC, which formed in the southern ARS on 1 June 2020 and gradually moved into the coast of Maharashtra and made its landfall on the coast of Maharashtra on 3 June 2020. The cyclonic track is presented in Figure 1.
The wind intensity and direction of both cyclones were estimated using Scatterometer Satellite-1 (SCATSAT-1) satellite product (Table 1), which provides wind vector data over an oceanic region. The instrument is a pencil beam scatter meter operating at a Ku-band of 13.515 GHz scatter meter from a polar sun-synchronous orbit at an altitude of 730 km [39]. Zonal and meridional wind vector data were collected for both cyclones and the data were plotted with the help of Grid Analysis and Display System (GrADS) software (version 2.2). The trajectories of the cyclones were acquired from the Indian Meteorological Department [21]. The trajectories along with the movement and speed of cyclonic wind were analyzed and mapped using ArcGIS software.
On 16 May 2020, the cyclone Amphan formed as a depression in the NIO near 10° N and 86° E. On May 18, 2020, the trajectory shifted to 13.7° N and 86.2° E, where it intensified into an SCS by 13:30 IST, with extreme wind speeds (120 knots, 222 km/h) and a low central pressure (930 hPa). Amphan’s intensity had decreased to an ESCS with a wind speed of 115 knots (212 km/h) by May 19, 2020. On 20 May 2020, cyclone Amphan made landfall as an ESCS at 21° N and 88° E, with a wind speed of 85 knots (157 km/h) and a central pressure of 960 hPa. Furthermore, it weakened into a VSCS as it moved northeast towards Northeast India through western Bangladesh. The cyclone Amphan had weakened into a well-defined low over north Bangladesh and neighboring countries by the end of 21 May 2020 (Figure 2a).
The cyclone Nisarga originated as a depression on 1 June 2020, in the ARS, near to a geolocation of 13° N and 71° E, and made landfall on 3 June 2020 along the Maharashtra coast. On 2 June 2020, the trajectory moved towards the north direction to 15° N and 71.2° E and intensified into a DD by 05:30 IST, with extreme wind speeds (30 knots, 56 km/h) and a low central pressure (1000 hPa). Furthermore, by 17:30 IST on 2 June 2020, the intensity of the cyclone Nisarga increased to an SCS with a wind speed of 40 knots (74 km/h) and changed its direction to the northwest. On 3 June 2020, the cyclone Nisarga moved to the west coast of Maharashtra and made landfall at 18.35° N and 72.95° E as an SCS with a maximum wind speed of 60 knots (111 km/h) and a central pressure of 988 hPa. Furthermore, it moved to the northwest direction towards northeast Maharashtra and weakened into a cyclonic storm. By the end of 4 June 2020, the cyclone Nisarga moved into Madhya Pradesh as a D and weakened into a well-marked low over parts of southern Madhya Pradesh (Figure 2b).
The cyclone Amphan travelled 1871 km with 73% of its trajectory over BOB, which strengthened the cyclone from a D to an SuCS and created a huge impact over the landmass. By contrast, the cyclone Nisarga travelled about 1298 km with 50.72% of its trajectory over the ARS, which strengthened it from a D to an SCS. SuCS Amphan devastated the Indian state of Odisha, West Bengal, and part of the northeast states and Bangladesh [40,41], while Nisarga impacted Maharashtra, Gujarat, and Madhya Pradesh [21]—over a million people were affected by this severe cyclonic storm.

2.3. Sea Surface Temperature (SST) and Precipitation Product

The hourly NOAA-optimum interpolation (OI) SST product (Table 1) is available at a 0.25° × 0.25° SST grid; it was used to investigate the pattern of SST during the cyclone and was correlated with cyclone intensity and central pressure. The SST value corresponding to the location of the cyclone eye every 3 hours was computed by taking the 3 h mean of SST, because the average cyclone intensity is also estimated over 3 h. The intensity and central pressure data of IMD [21] were correlated with the computed hourly SST for the corresponding position. In other words, for statistical comparisons among them, SST is calculated in the location of the cyclone eye.
In this study, GPM data (Table 1) were utilized to map the spatiotemporal distribution of the precipitation in the Indian peninsular. Variability in precipitation was evaluated between the formation and landfall, along with the assessment of hourly variability on the day of landfall. Furthermore, the precipitation value was evaluated corresponding to the locations of the cyclone eye.

2.4. Land Use Land Cover (LULC) Product

The land use land cover (LULC) product (MCD12Q1) was downloaded from the MODIS data repository (Table 1). The land use classes were reclassified into eight land use classes, such as water bodies, forests, grasslands, wetlands, croplands, built-up lands, snow and ice cover, and barren lands, for analyzing cyclone impacts on LULC. The estimated cyclone wind field intersected with LULC and analyzed the cyclone impact on the various land use classes.

2.5. Regional Elevation and Potential Storm Surge Area

GEBCO data were downloaded from the British oceanographic data center repository (Table 1). GEBCO provides global elevation data for both land and water with 1 arcsec resolution; the data are further classified into five classes, including below 0 (as waterbody or low laying areas), 0–10, 10–20, 20–50, and above 50 m. To map flood water inundation, ALOS-2 PALSAR and Sentinel-1 Synthetic Aperture Radar (SAR) images of 21/05/2020 and 22/05/2020, respectively (Table 1), were employed and superimposed with LULC and population density of the impact area. The classified elevation data were further used to understand the regional characteristics with respect to cyclonic storms and associated floods.

3. Results

3.1. Frequency of TCs in the NIO and Their Wind Speed

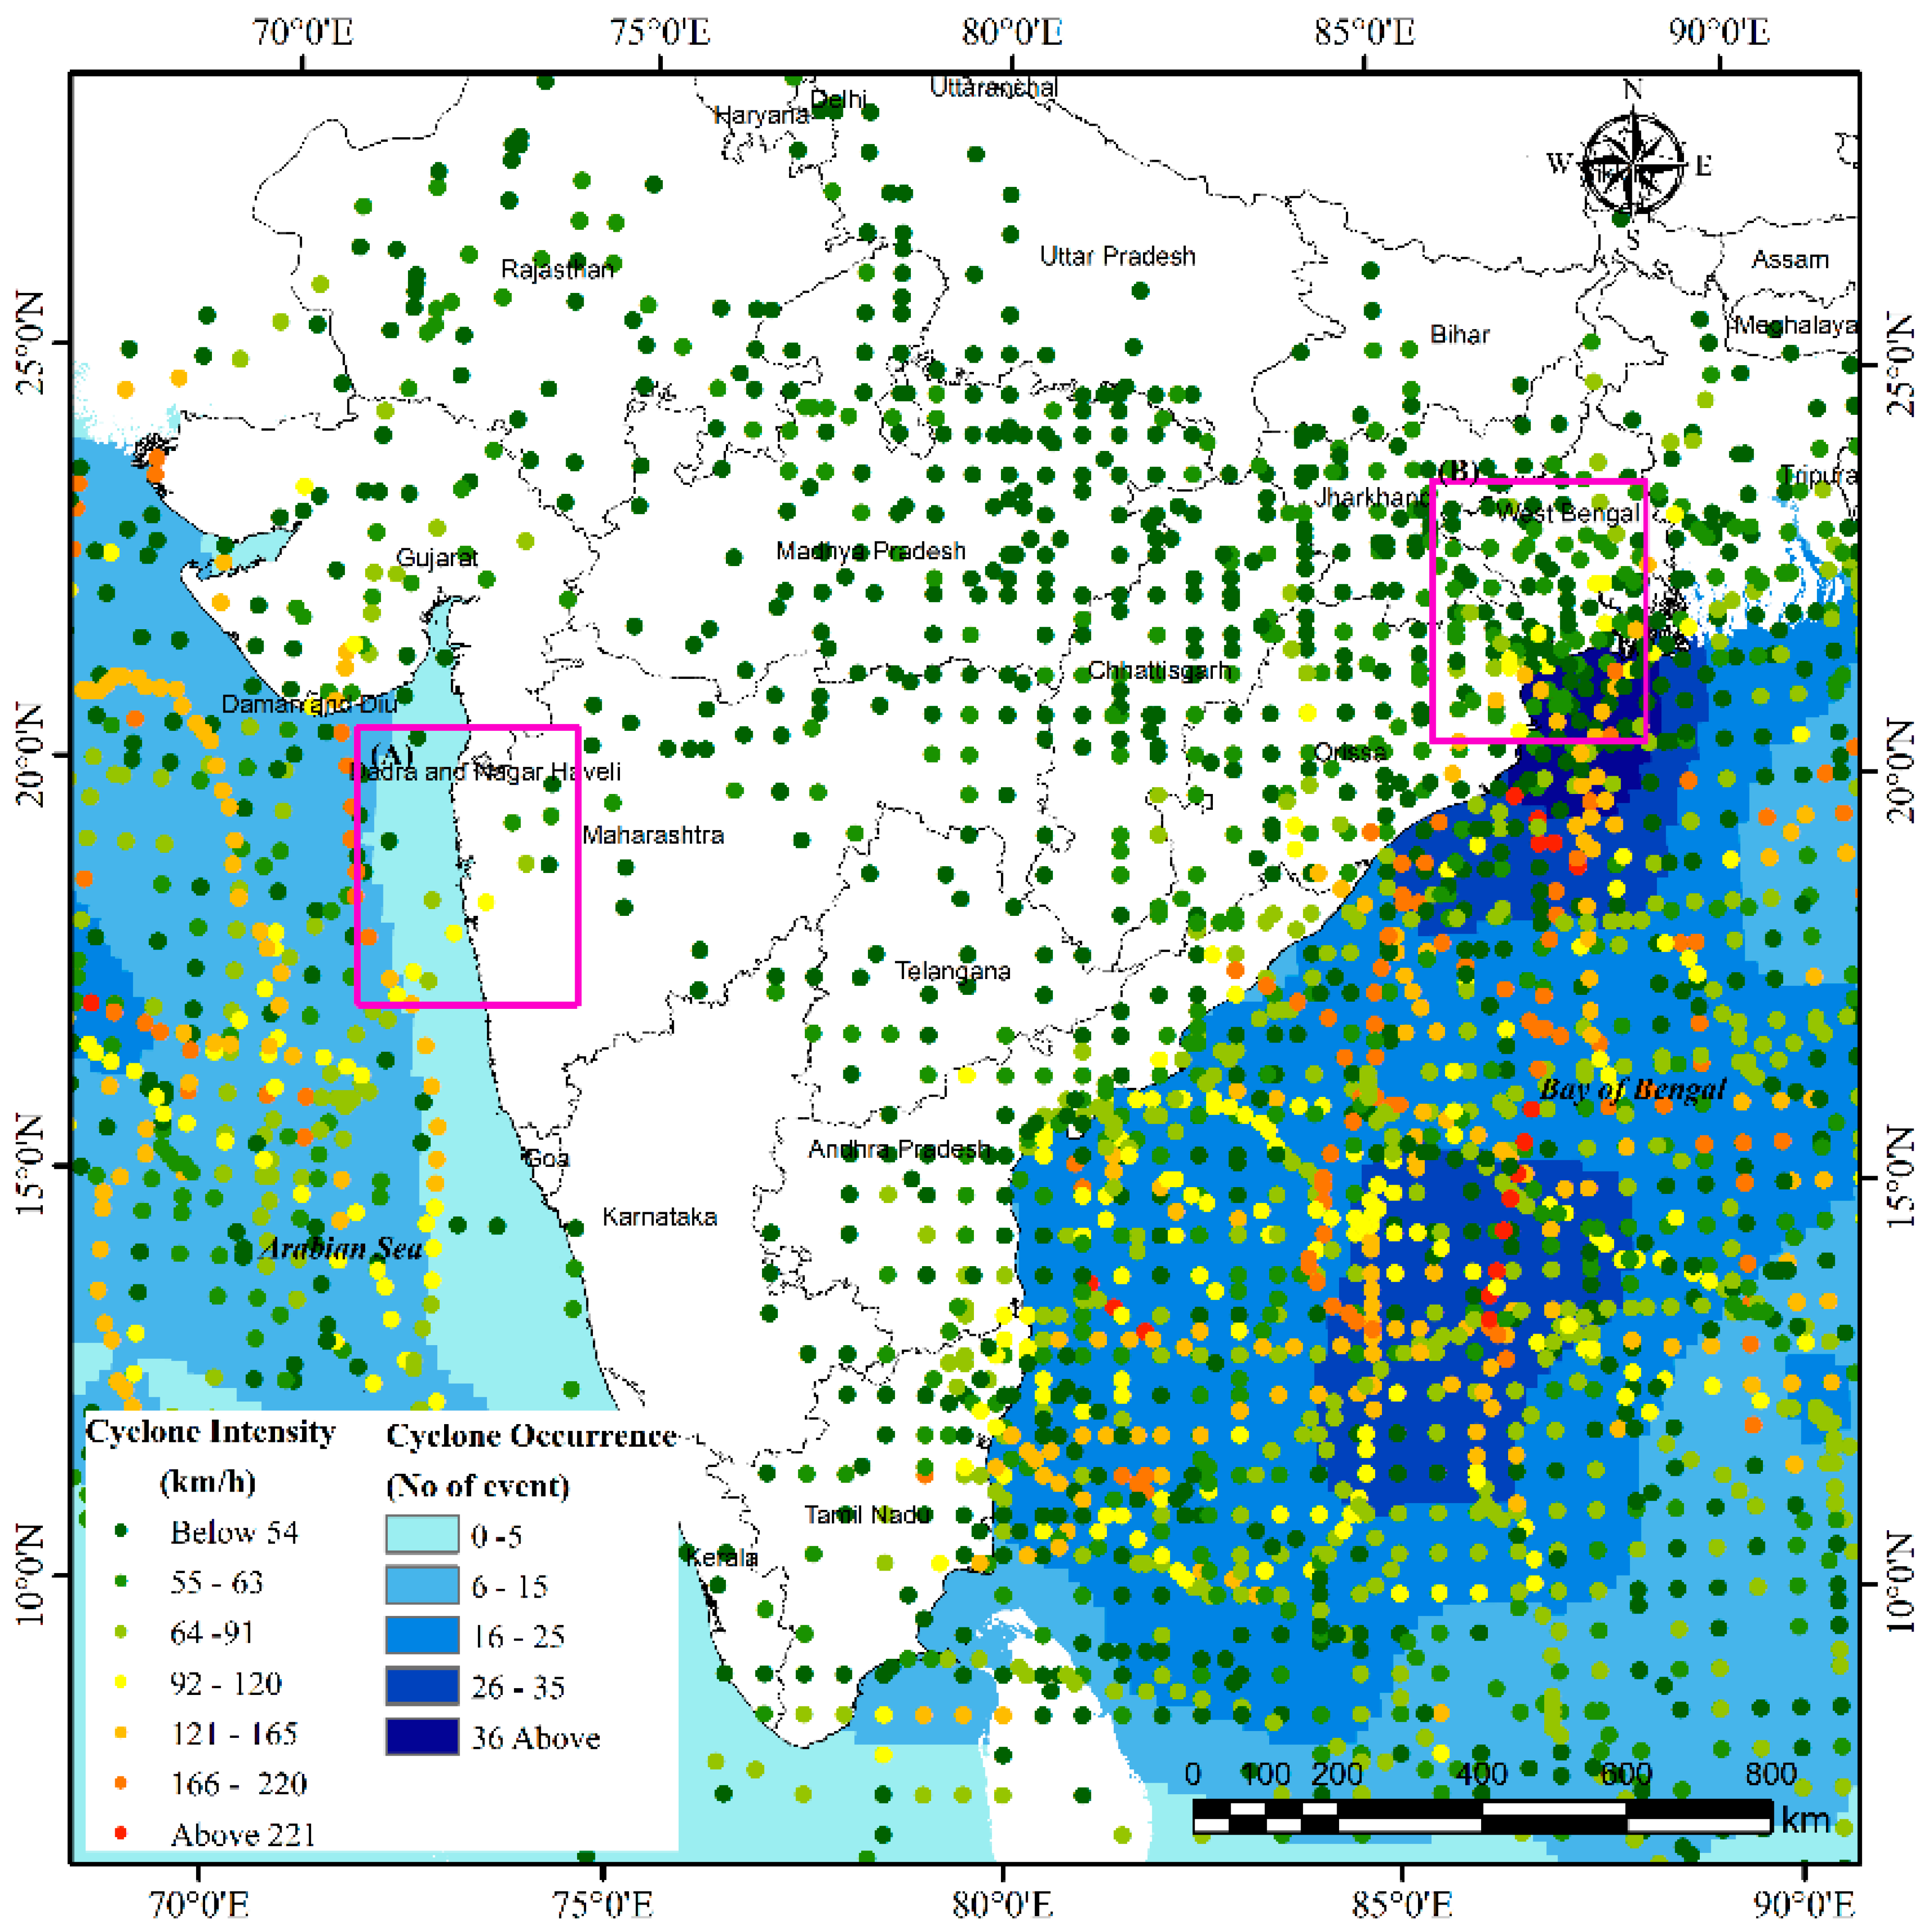
TCs are the most devastating hazard in Southeast Asia, especially in India and Bangladesh. This study analysed historical cyclones from 1982 to 2020, including their windspeed. During the 39 years, a total of 345 cyclones originated in the NIO; among them, 258 originated in the BOB and 87 originated in the ARS. This indicates that the BOB had an average of about six cyclones per year, while the ARS had only about two cyclones per year. The study also evaluated the frequency and wind speed of TCs in the NIO. We identified a considerable prevalence of TCs along the coastal belt between Tamil Nadu and West Bengal, with Odisha and West Bengal exhibiting a very high frequency in terms of cyclone movement, while the coastal regions in the ARS demonstrated a very low frequency (Figure 3). Similarly, the wind speed of the TCs was also evaluated and the average wind speed in the BOB was estimated at 38.35 knots (71 km/h), with a standard deviation of 20.25 knots, while the ARS exhibited wind speeds of 47.07 knots (87 km/h) with a standard deviation of 25.33 knots. The highest intensity of a TC was observed in the BOB in the 1999 Odisha Cyclone (also known as Paradip cyclone), with a wind speed of 140 knots (259 km/h), while the Super Cyclonic Storm Kyarr in the ARS recorded the highest intensity in 2019 with a wind speed of 130 knots (240 km/h). The BOB has witnessed a slight decrease in frequency over the past 39 years, while the ARS has witnessed an increasing trend (Figure 3). The intensity and occurrence of cyclones are shown in Figure 4. It shows that the BoB, especially the Sundarbans region, witnessed a high occurrence of more than 30 cyclones in the last 39 years. Meanwhile, the west coast experienced far less occurrences, with less than five cyclones. Similarly, the cyclone intensity as represented by wind speed is very high in the coastal region of the BOB, whereas wind speed was lower in the ARS. In the year 2020, a total of nine TCs originated in the NIO; among them, five originated in the BOB and four originated in the ARS. Importantly, Amphan and Nisarga were the most devastating among them.

3.2. Assessment of SST during the Cyclone Formation

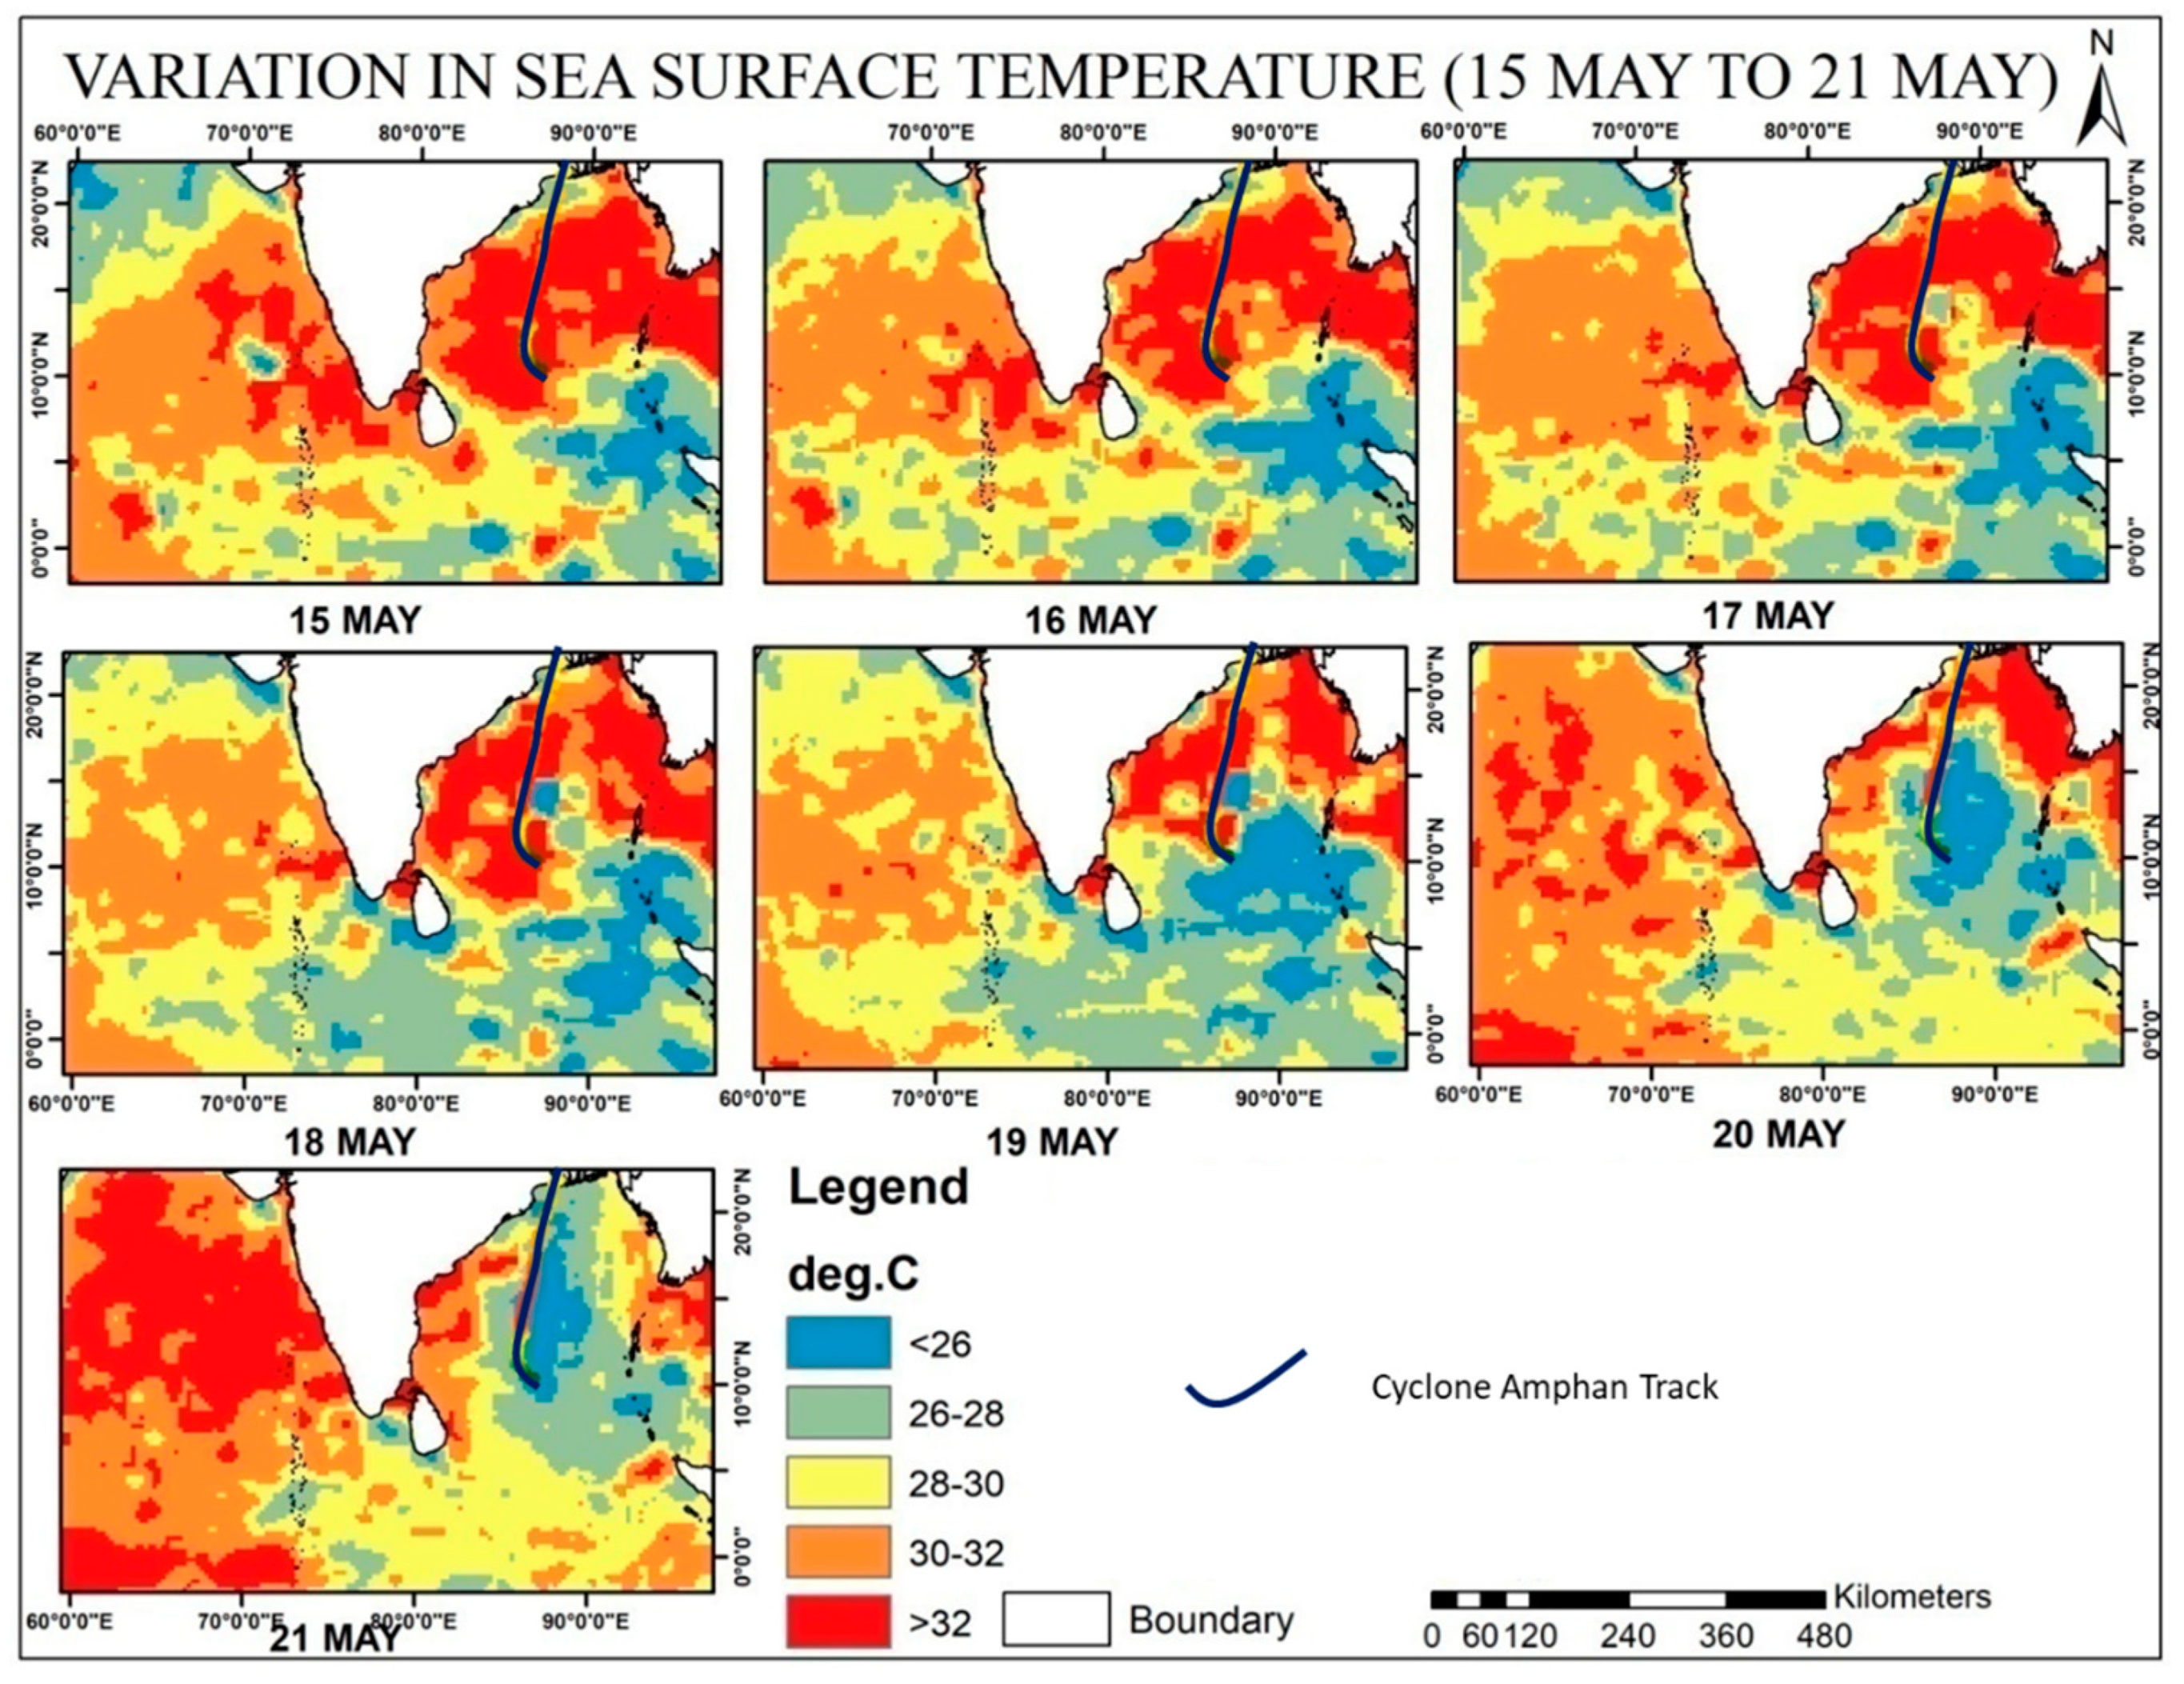
The present study evaluated the SST variations and their impact on TC intensity and central pressure. During TC Amphan, the highest SST observed in the cyclone eye was 32.84 °C on 16 May 2020, where the cyclone intensity (i.e., wind speed) and central pressure were recorded as 25 knots (46 km/h) and 1000 hPa, respectively (Figure 5). The lowest SST (29.36 °C) was observed on 18 May 2020, when the TC intensified into 120 knots (222 km/h) with central pressure falling to 925 hPa.
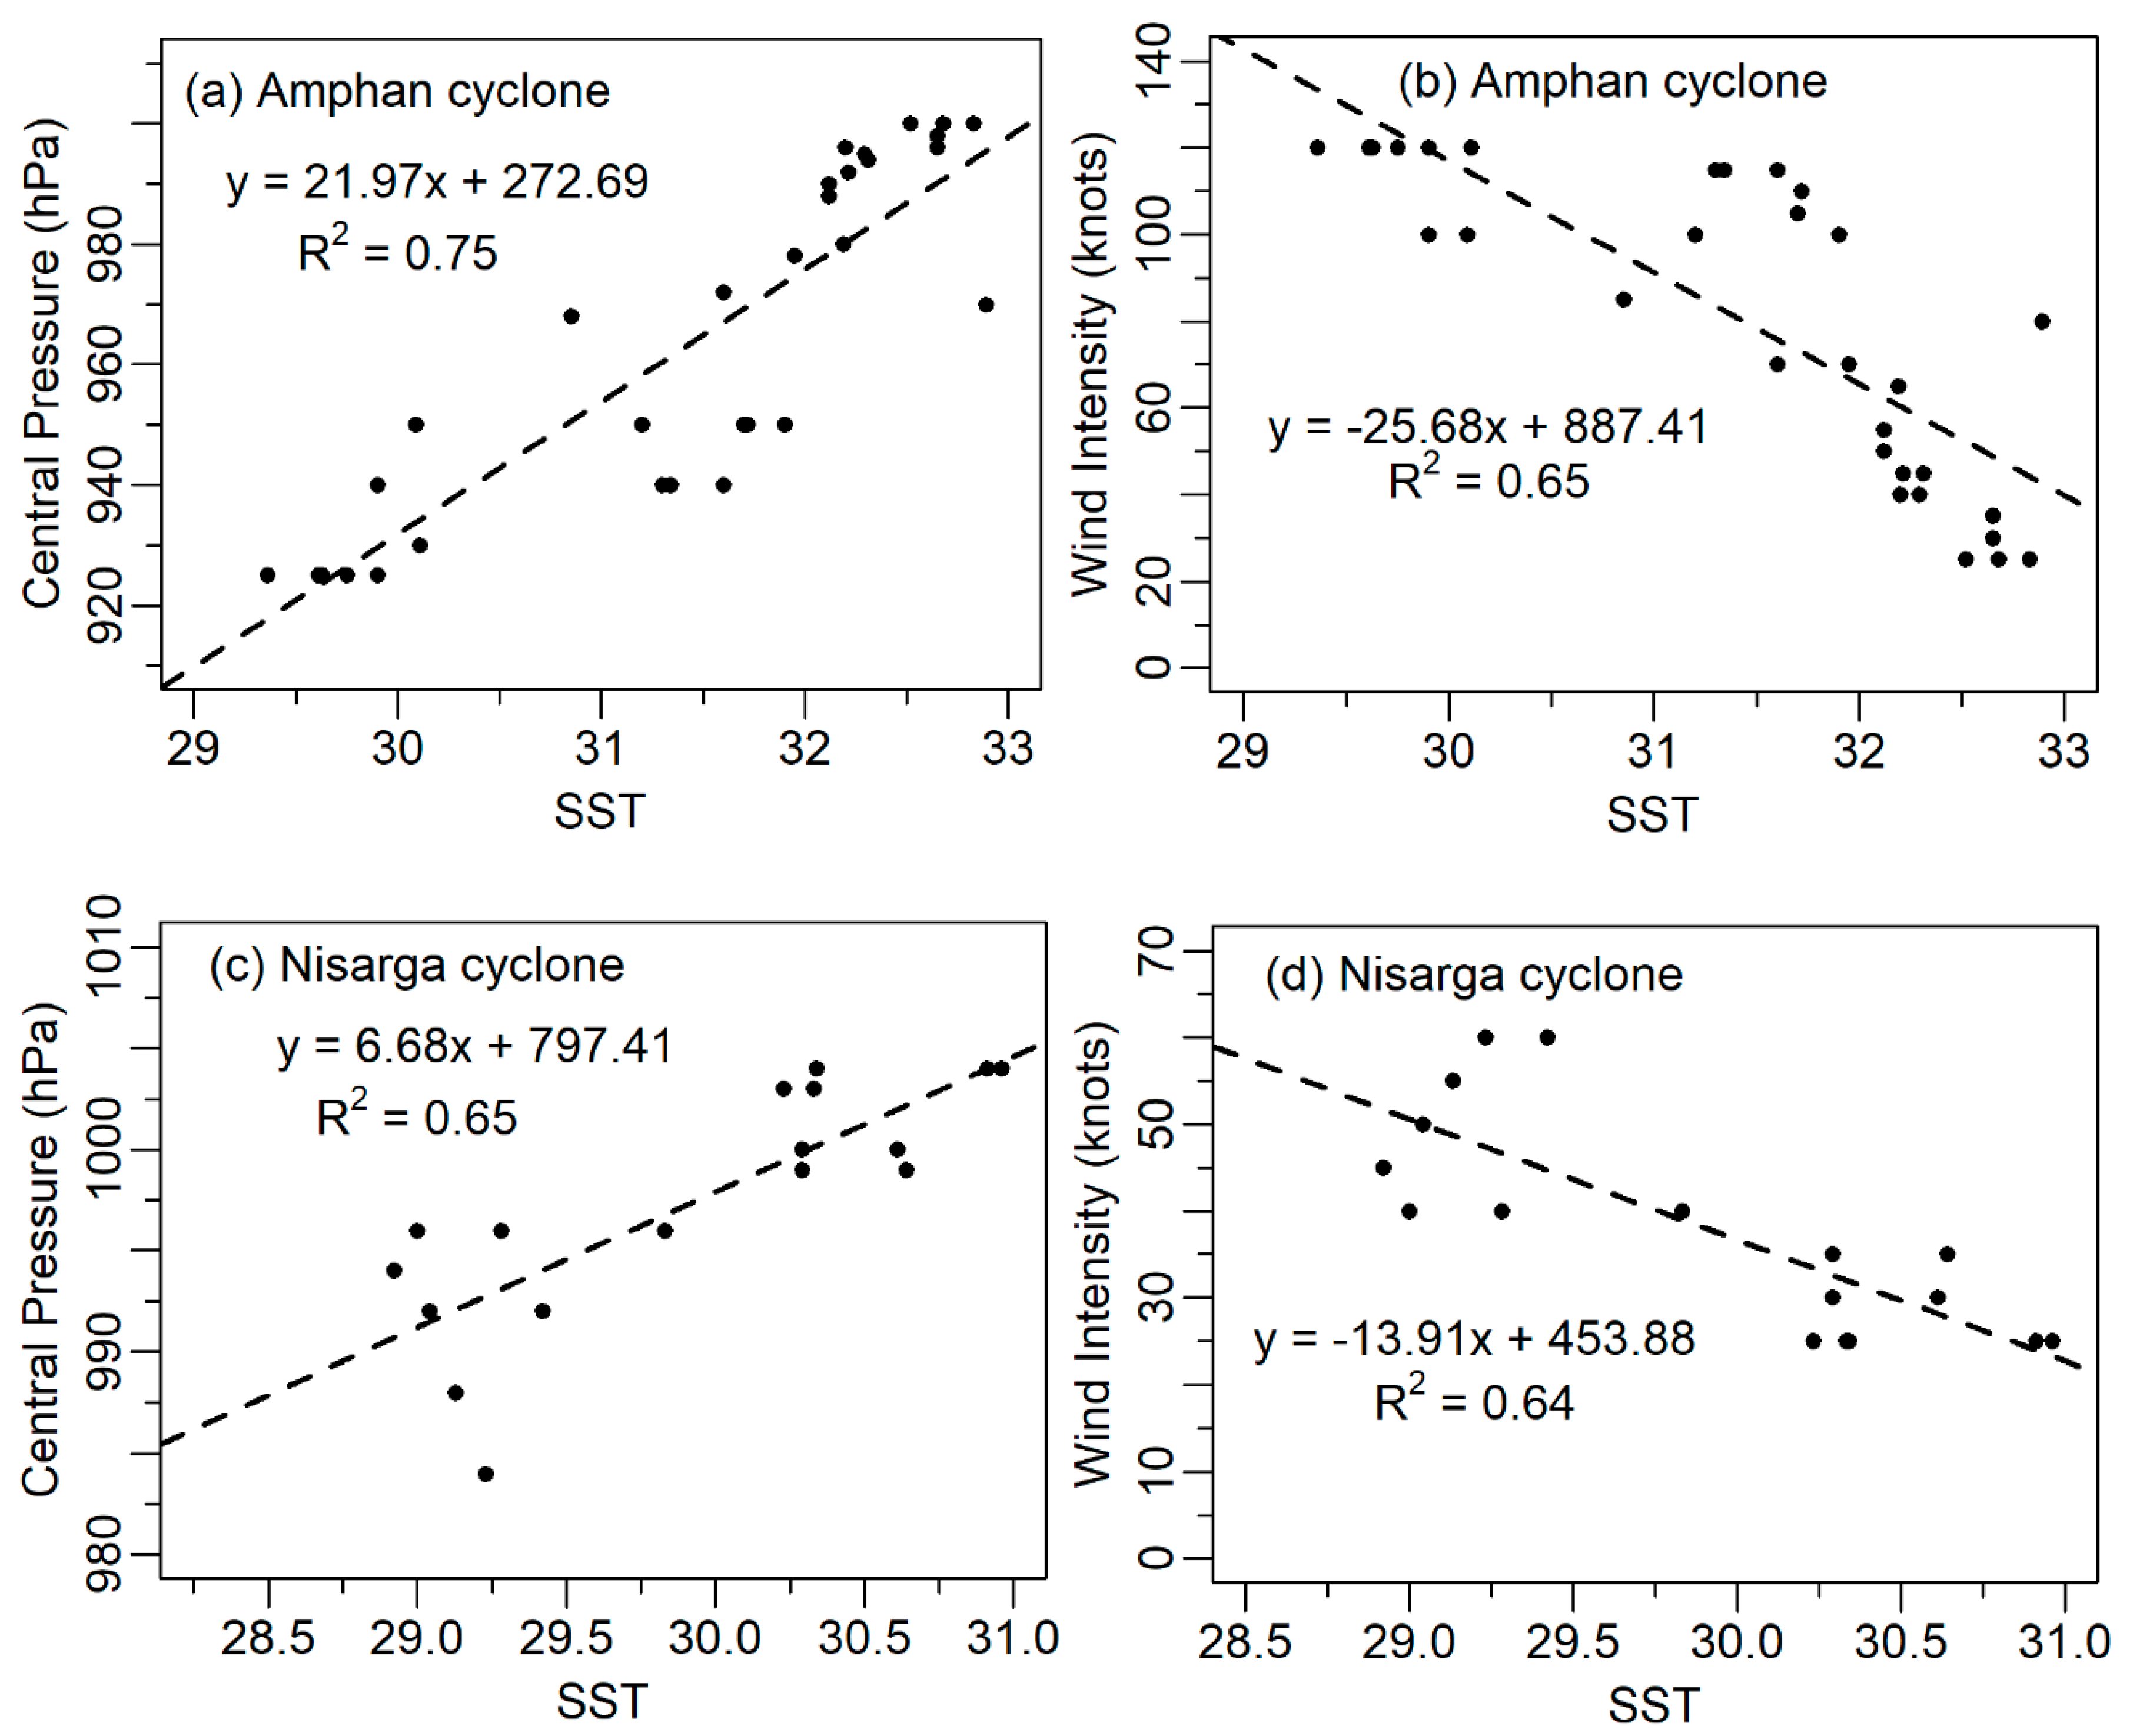
By contrast, during Nisarga, the highest SST in the cyclone eye was observed on 1 June 2020 at 30.96 °C, while the cyclone intensity and pressure were recorded as 25 knots (46 km/h) and 1003 hPa, respectively (Figure 6). The lowest temperature recorded in the cyclone eye was 28.93 °C on 3 June 2020 with a wind speed of 45 knots (83 km/h) and central pressure of 994 hPa. This study indicated that the cyclone intensity and central pressure were significantly correlated with SST (p-value < 0.0001). The correlation between SST and TC’s intensity during Amphan and Nisarga was −0.65 and −0.64, respectively (Figure 7b,d). SST and central pressure exhibited a positive correlation, with 0.75 and 0.65 for Amphan and Nisarga, respectively (Figure 7a,c).

3.3. Assessment of Cyclonic Precipitation Variability

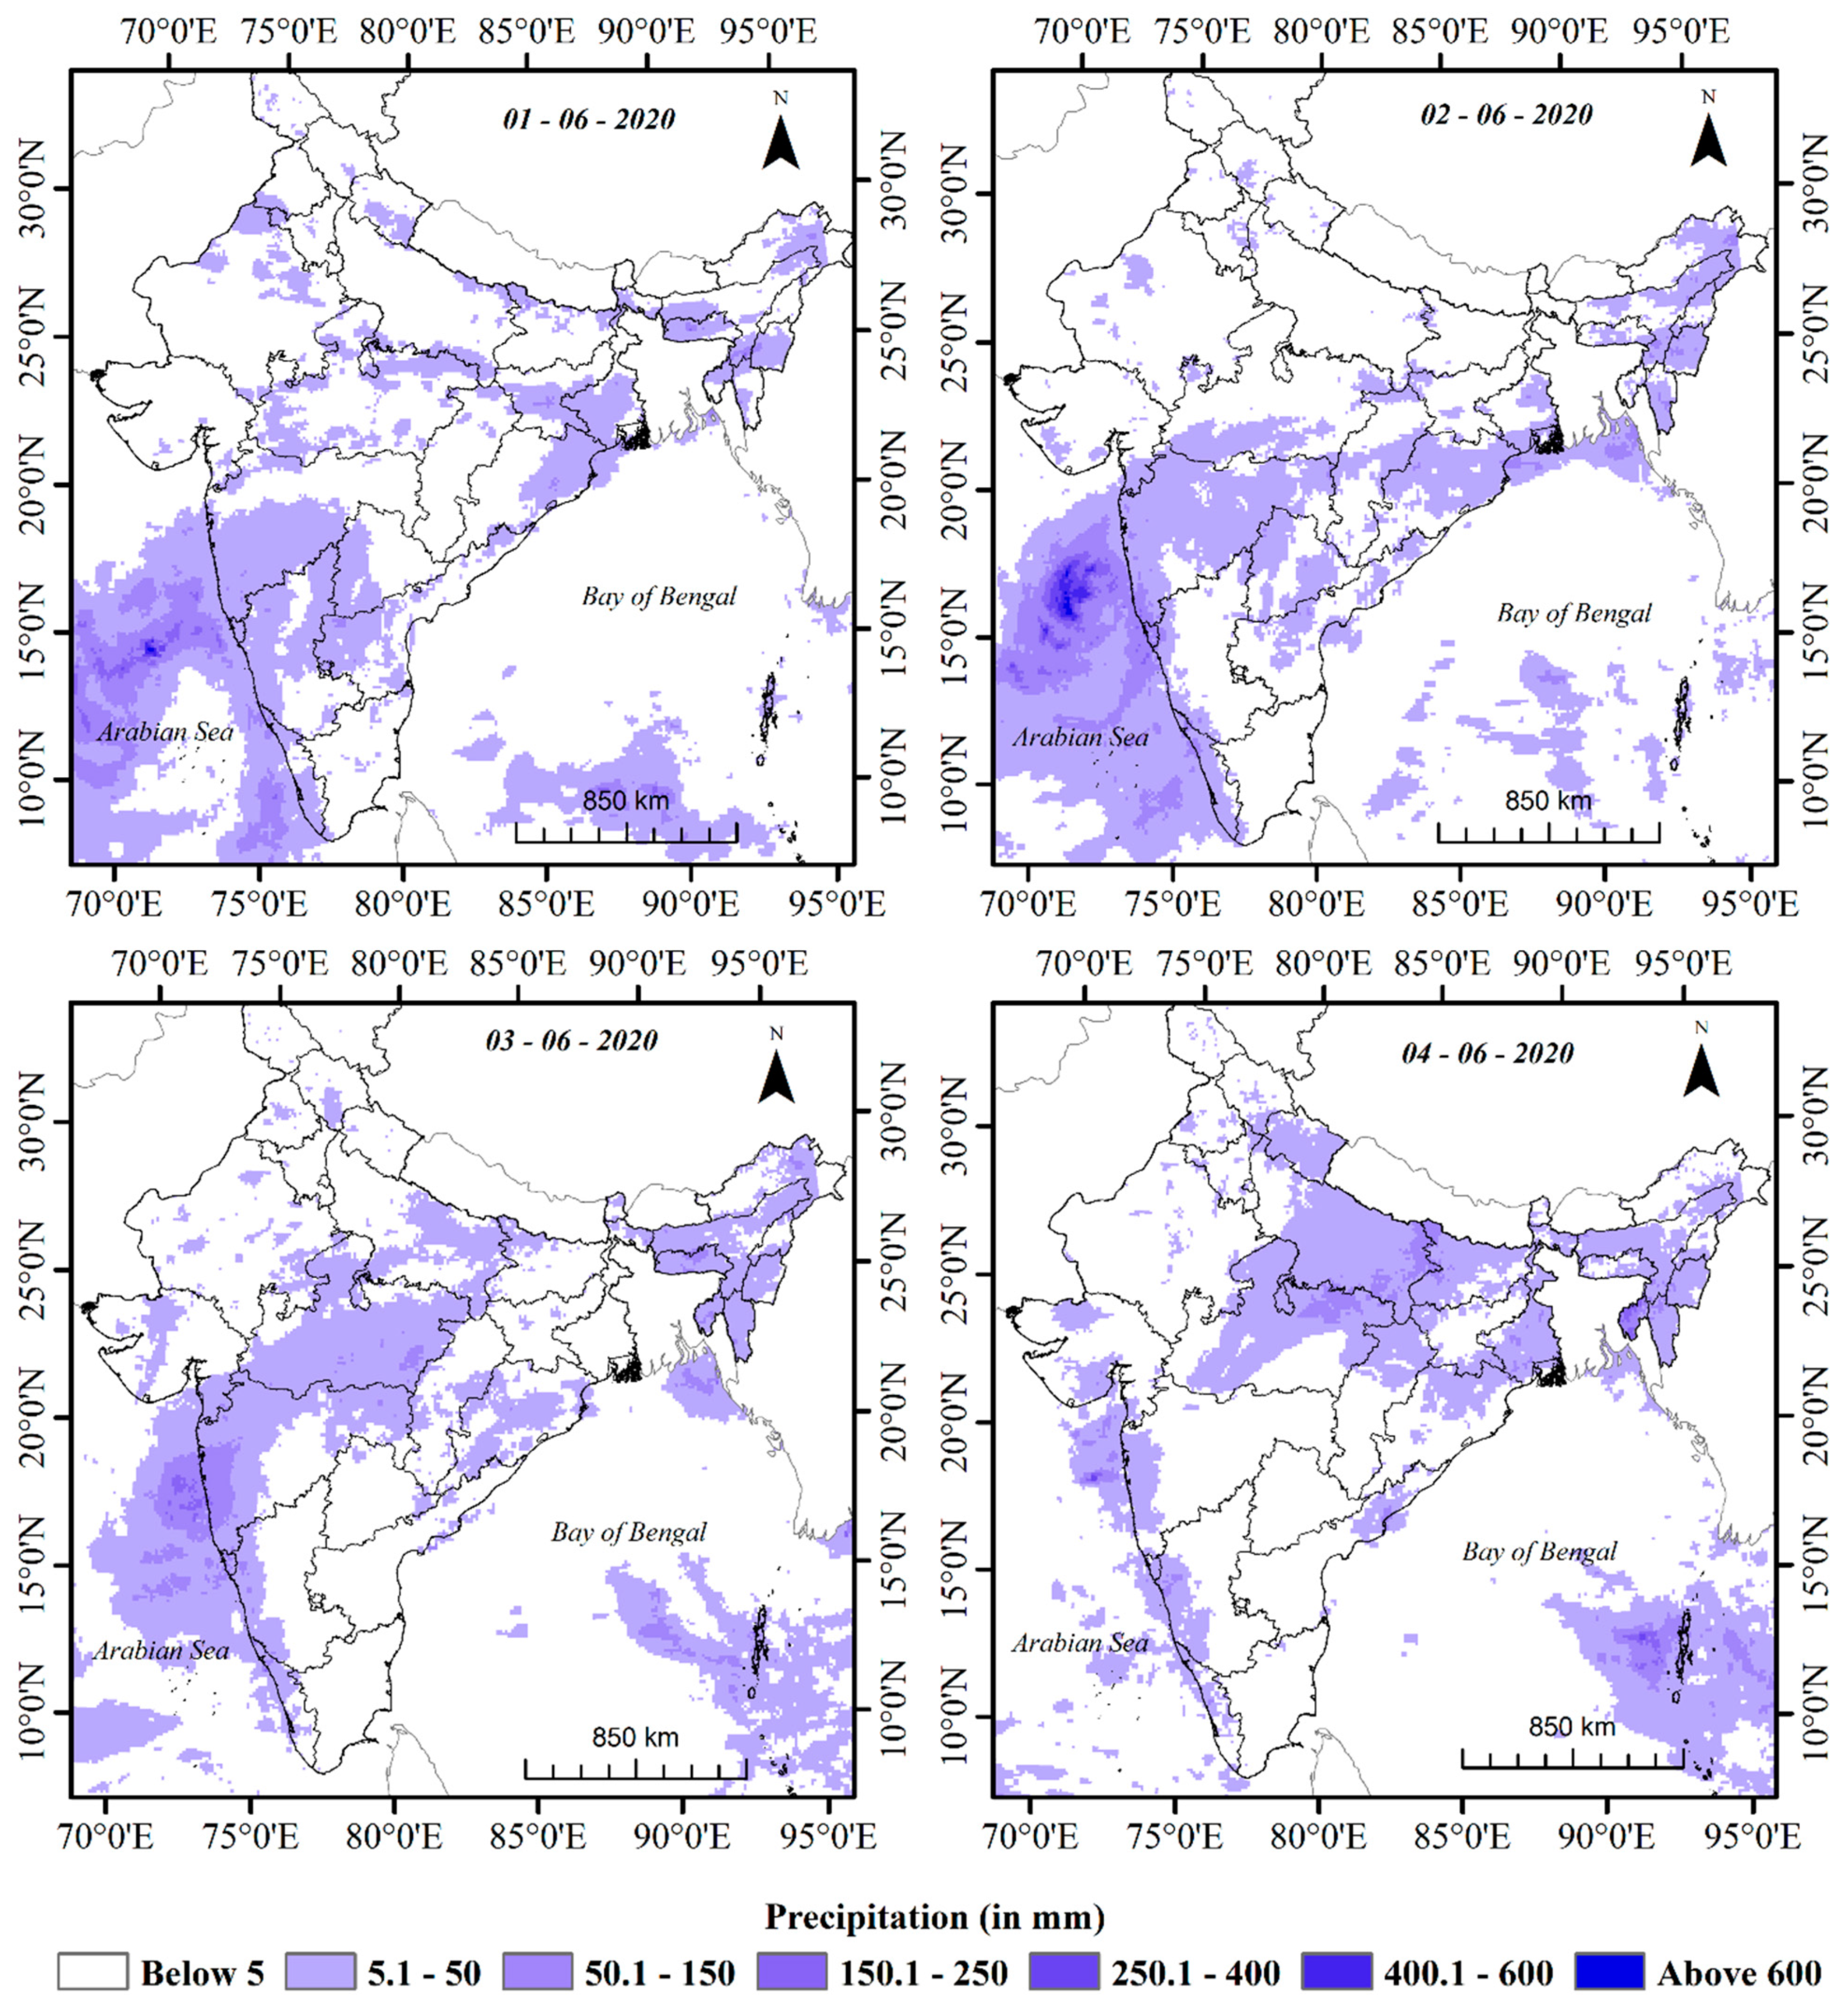
Global precipitation measurement (GPM)-based precipitation data depicted that the cyclone impact area received cumulative precipitation of 1563 mm during the cyclone Amphan (14–21 May 2020), whereas during Nisarga, cumulative precipitation was 684 mm (1–4 June 2020); in both, excess precipitation was observed in the ocean basin. However, the impact area on the land part received cumulative precipitation of 430 mm during the cyclone Amphan, in contrast to 251 mm during the cyclone Nisarga.
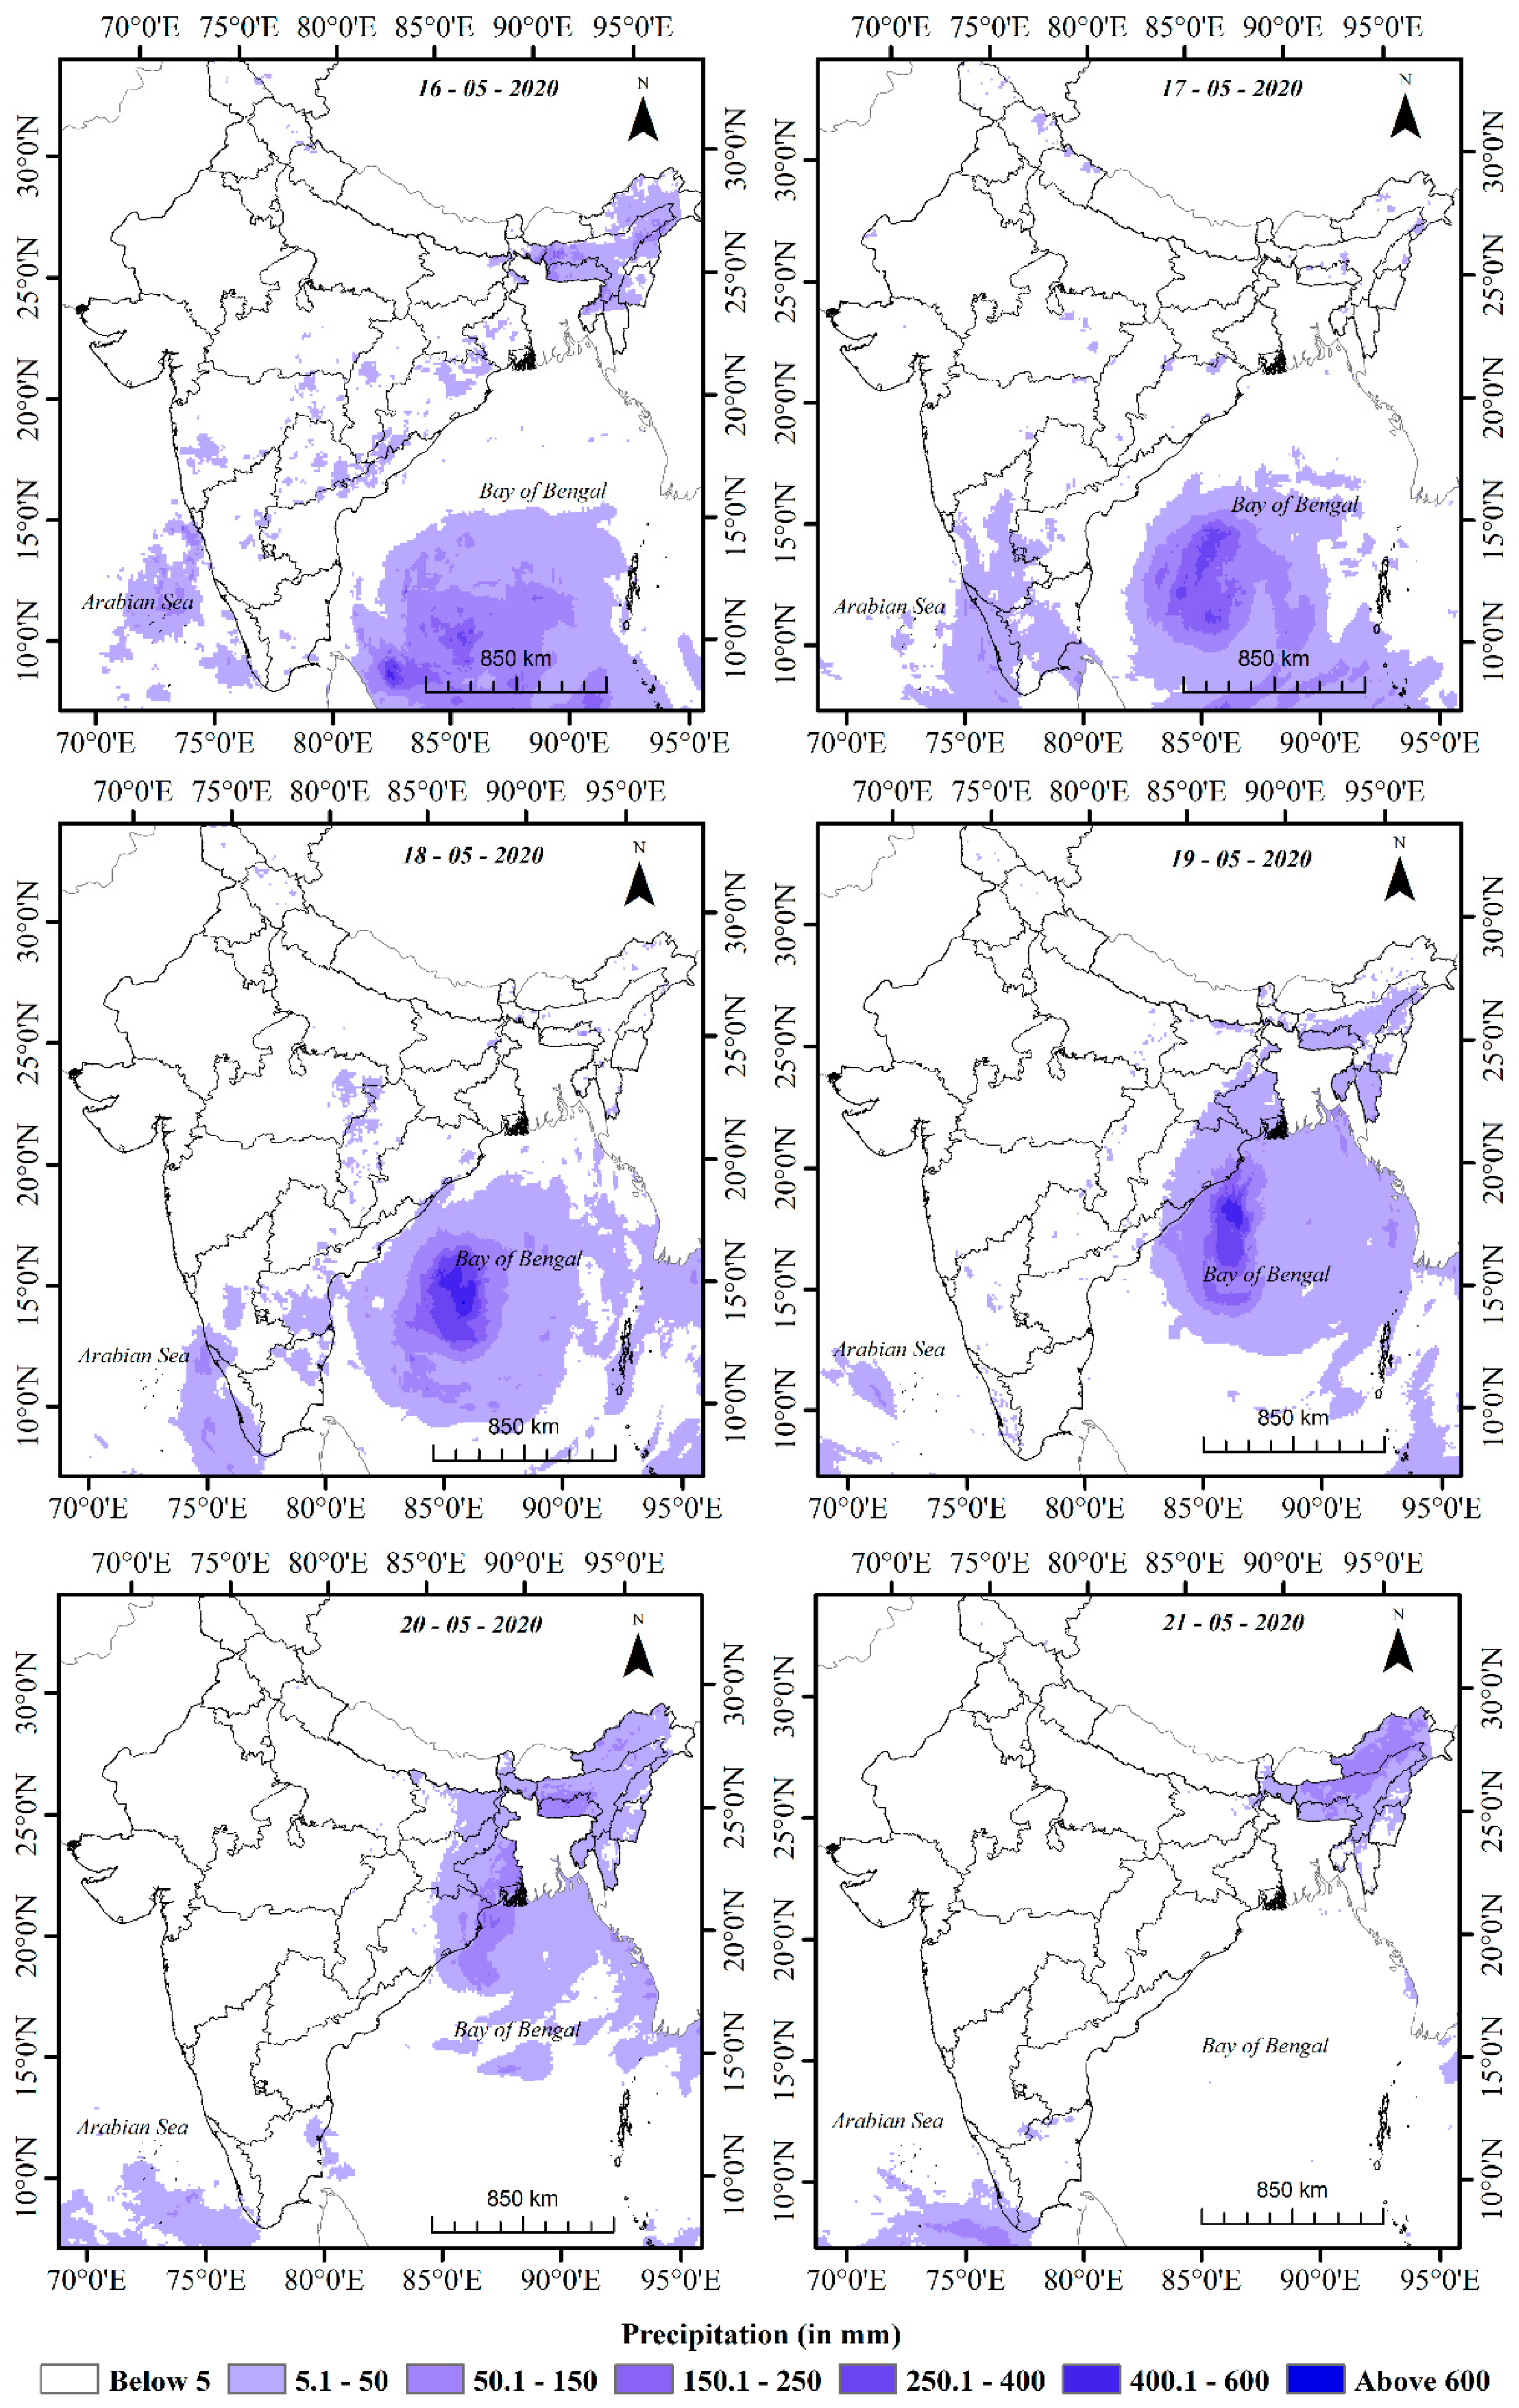
The distribution of precipitation during the formation of Amphan revealed that the maximum precipitation of 828 mm/day was observed on 18 May 2020, near the east coast of Andhra Pradesh in the BOB, where the cyclone Amphan intensified into a Super Cyclone (Figure 8). The lowest precipitation (154 mm/day) was recorded in Bangladesh on 21 May 2020, when the cyclone weakened into a D. However, between 14 and 20 May 2020, average precipitation of 300–500 mm/day was recorded (Figure 8). The amount of precipitation received during Nisarga was much lesser than during Amphan. The cyclone Nisarga contributed the highest precipitation on 3 June 2020 (Figure 9) during its landfall along the western coast of Maharashtra, with a maximum precipitation of 172 mm/day. The lowest precipitation was observed on 1 June 2020 when the cyclone was formed as a Depression, with minimum precipitation of 42.49 mm/day (Figure 9).
The results showed that West Bengal state, particularly the southern districts, experienced very heavy precipitation as a result of the impact of the cyclone Amphan, resulting in coastal flooding. The present study observed extreme precipitation with 309 mm in isolated places over North 24 Parganas district, whereas heavy rainfall was received in isolated places over South 24 Parganas (174.69 mm), Haora (144.08 mm), East Midnapur (142.91 mm), and Nadia (152.49 mm) districts of West Bengal, as well as Kendrapara (155.631 mm), Jagatsinghpur (141.11 mm), Bhadrak (98.65 mm), Puri (76 mm), and Jajpur (74.77) districts of Odisha (Figure 8). Automatic weather station (AWS)-derived rainfall data from IMD also revealed that Kolkata received extreme precipitation during the landfall, with 224 mm rainfall between 11:00 and 23:00 on 20 May 2020, whereas Dumdum and Digha received 194 mm and 87 mm rainfall, respectively, over the same time period, as well as heavy precipitation in isolated locations across Odisha and West Bengal. During Nisarga, heavy rainfall was recorded in isolated places over coastal Karnataka and Maharashtra between 1 and 3 June 2020. Thereafter, moderate rainfall was received in isolated places over Maharashtra, Karnataka, and Madhya Pradesh. The present study observed heavy precipitation, with more than 200 mm in isolated places over Ratnagiri (205.12 mm), Thane (205.24 mm), Nasik (203.138), Raigarh (206.58), and Sindudurg (216.57 mm) districts of Maharashtra, as well as North Goa (211.98 mm) and North Karnataka (219.23) (Figure 9).

3.4. Impact of Cyclonic Wind on Land Use Land Cover (LULC)

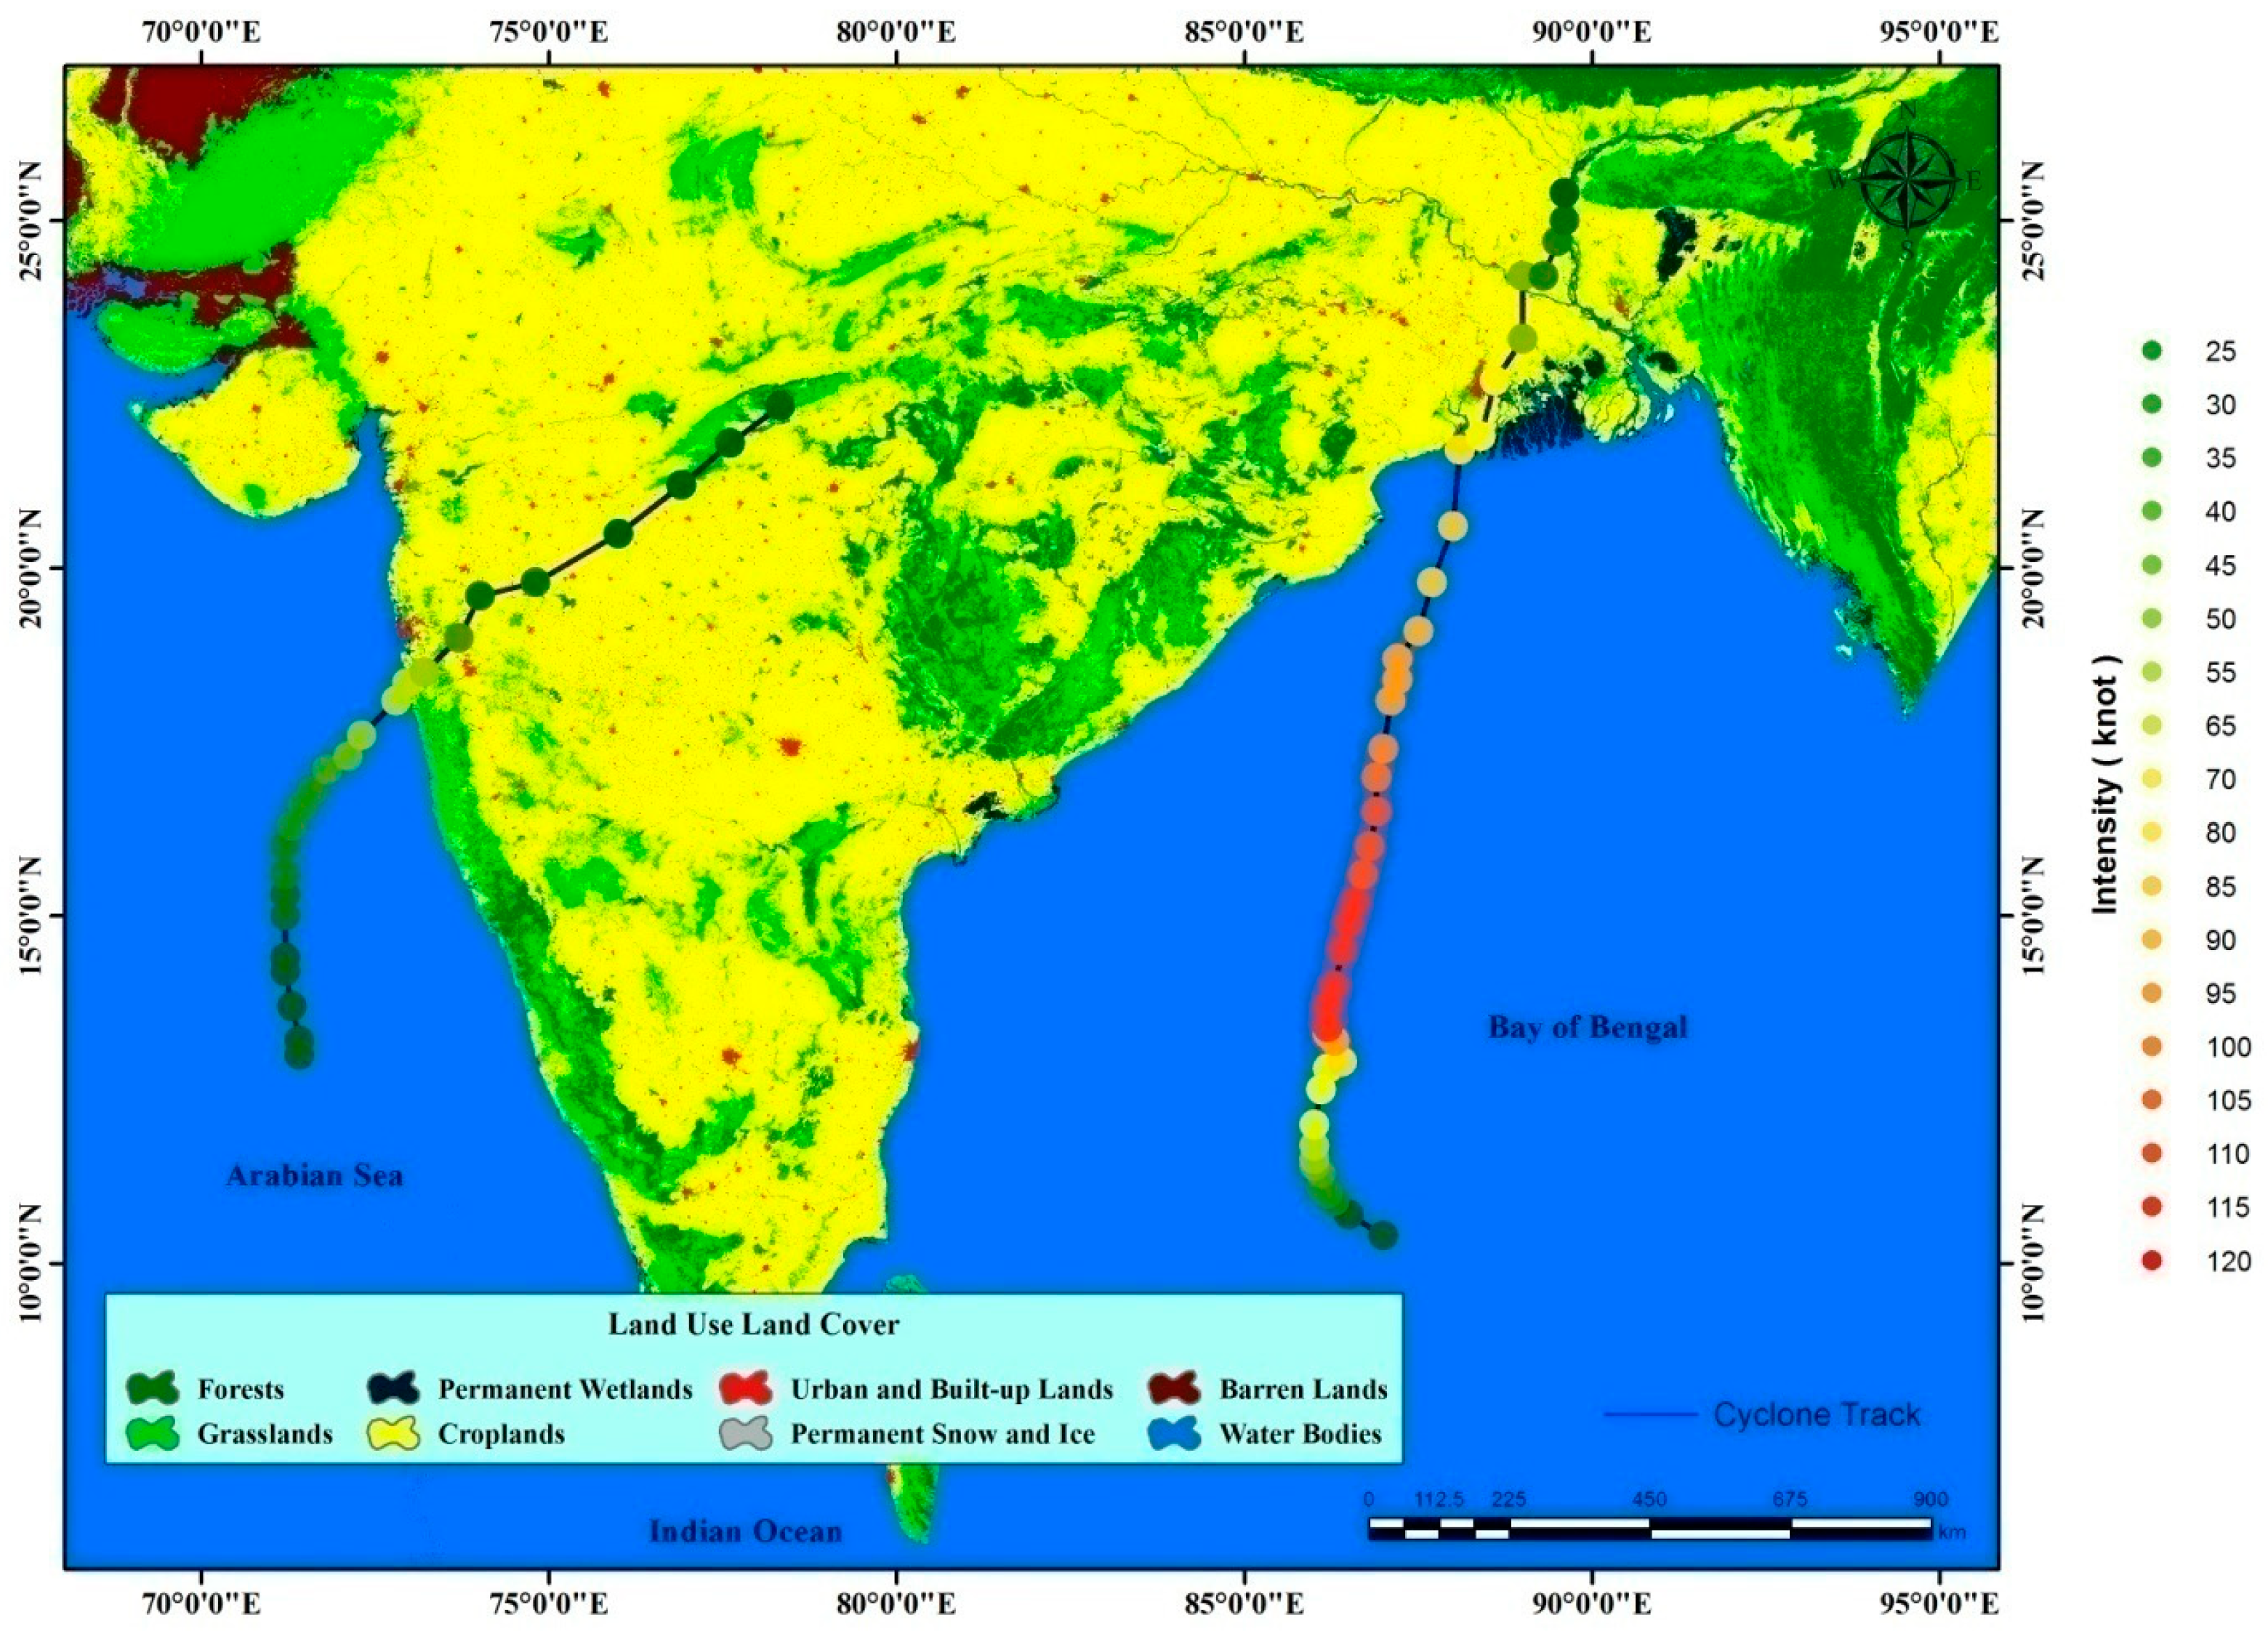
Based on exposure to the cyclone, it was observed that an area of 363,837 km2 was affected by the Amphan wind field, while the Nisarga wind field affected an area of 167,230 km2. This indicated a higher magnitude of devastation by the cyclone Amphan in comparison with Nisarga. On the east coast, within the exposed area of the Amphan cyclone wind field, 64% (233,391 km2) of the LULC is constituted by cropland, whereas along the west coast, about 82% (137,266 km2) of the area exposed to the cyclone was comprised of cropland (Figure 10). In terms of impact on built-up lands, about 1.04% of the exposed area represents built-up land along the eastern coast, whereas about 1.77% of the Nisarga impact field along the western coast falls into the category of built-up land. Wetlands act as a protector of the coast from the impact of cyclones and associated storm surges [40]. Coastal zones constitute major contributors to wetlands across the globe, but in this study, a much smaller wetlands area existed along the western coast within the impact area of the cyclone Nisarga (Table 2).

3.5. Regional Elevation and Cyclonic Storm

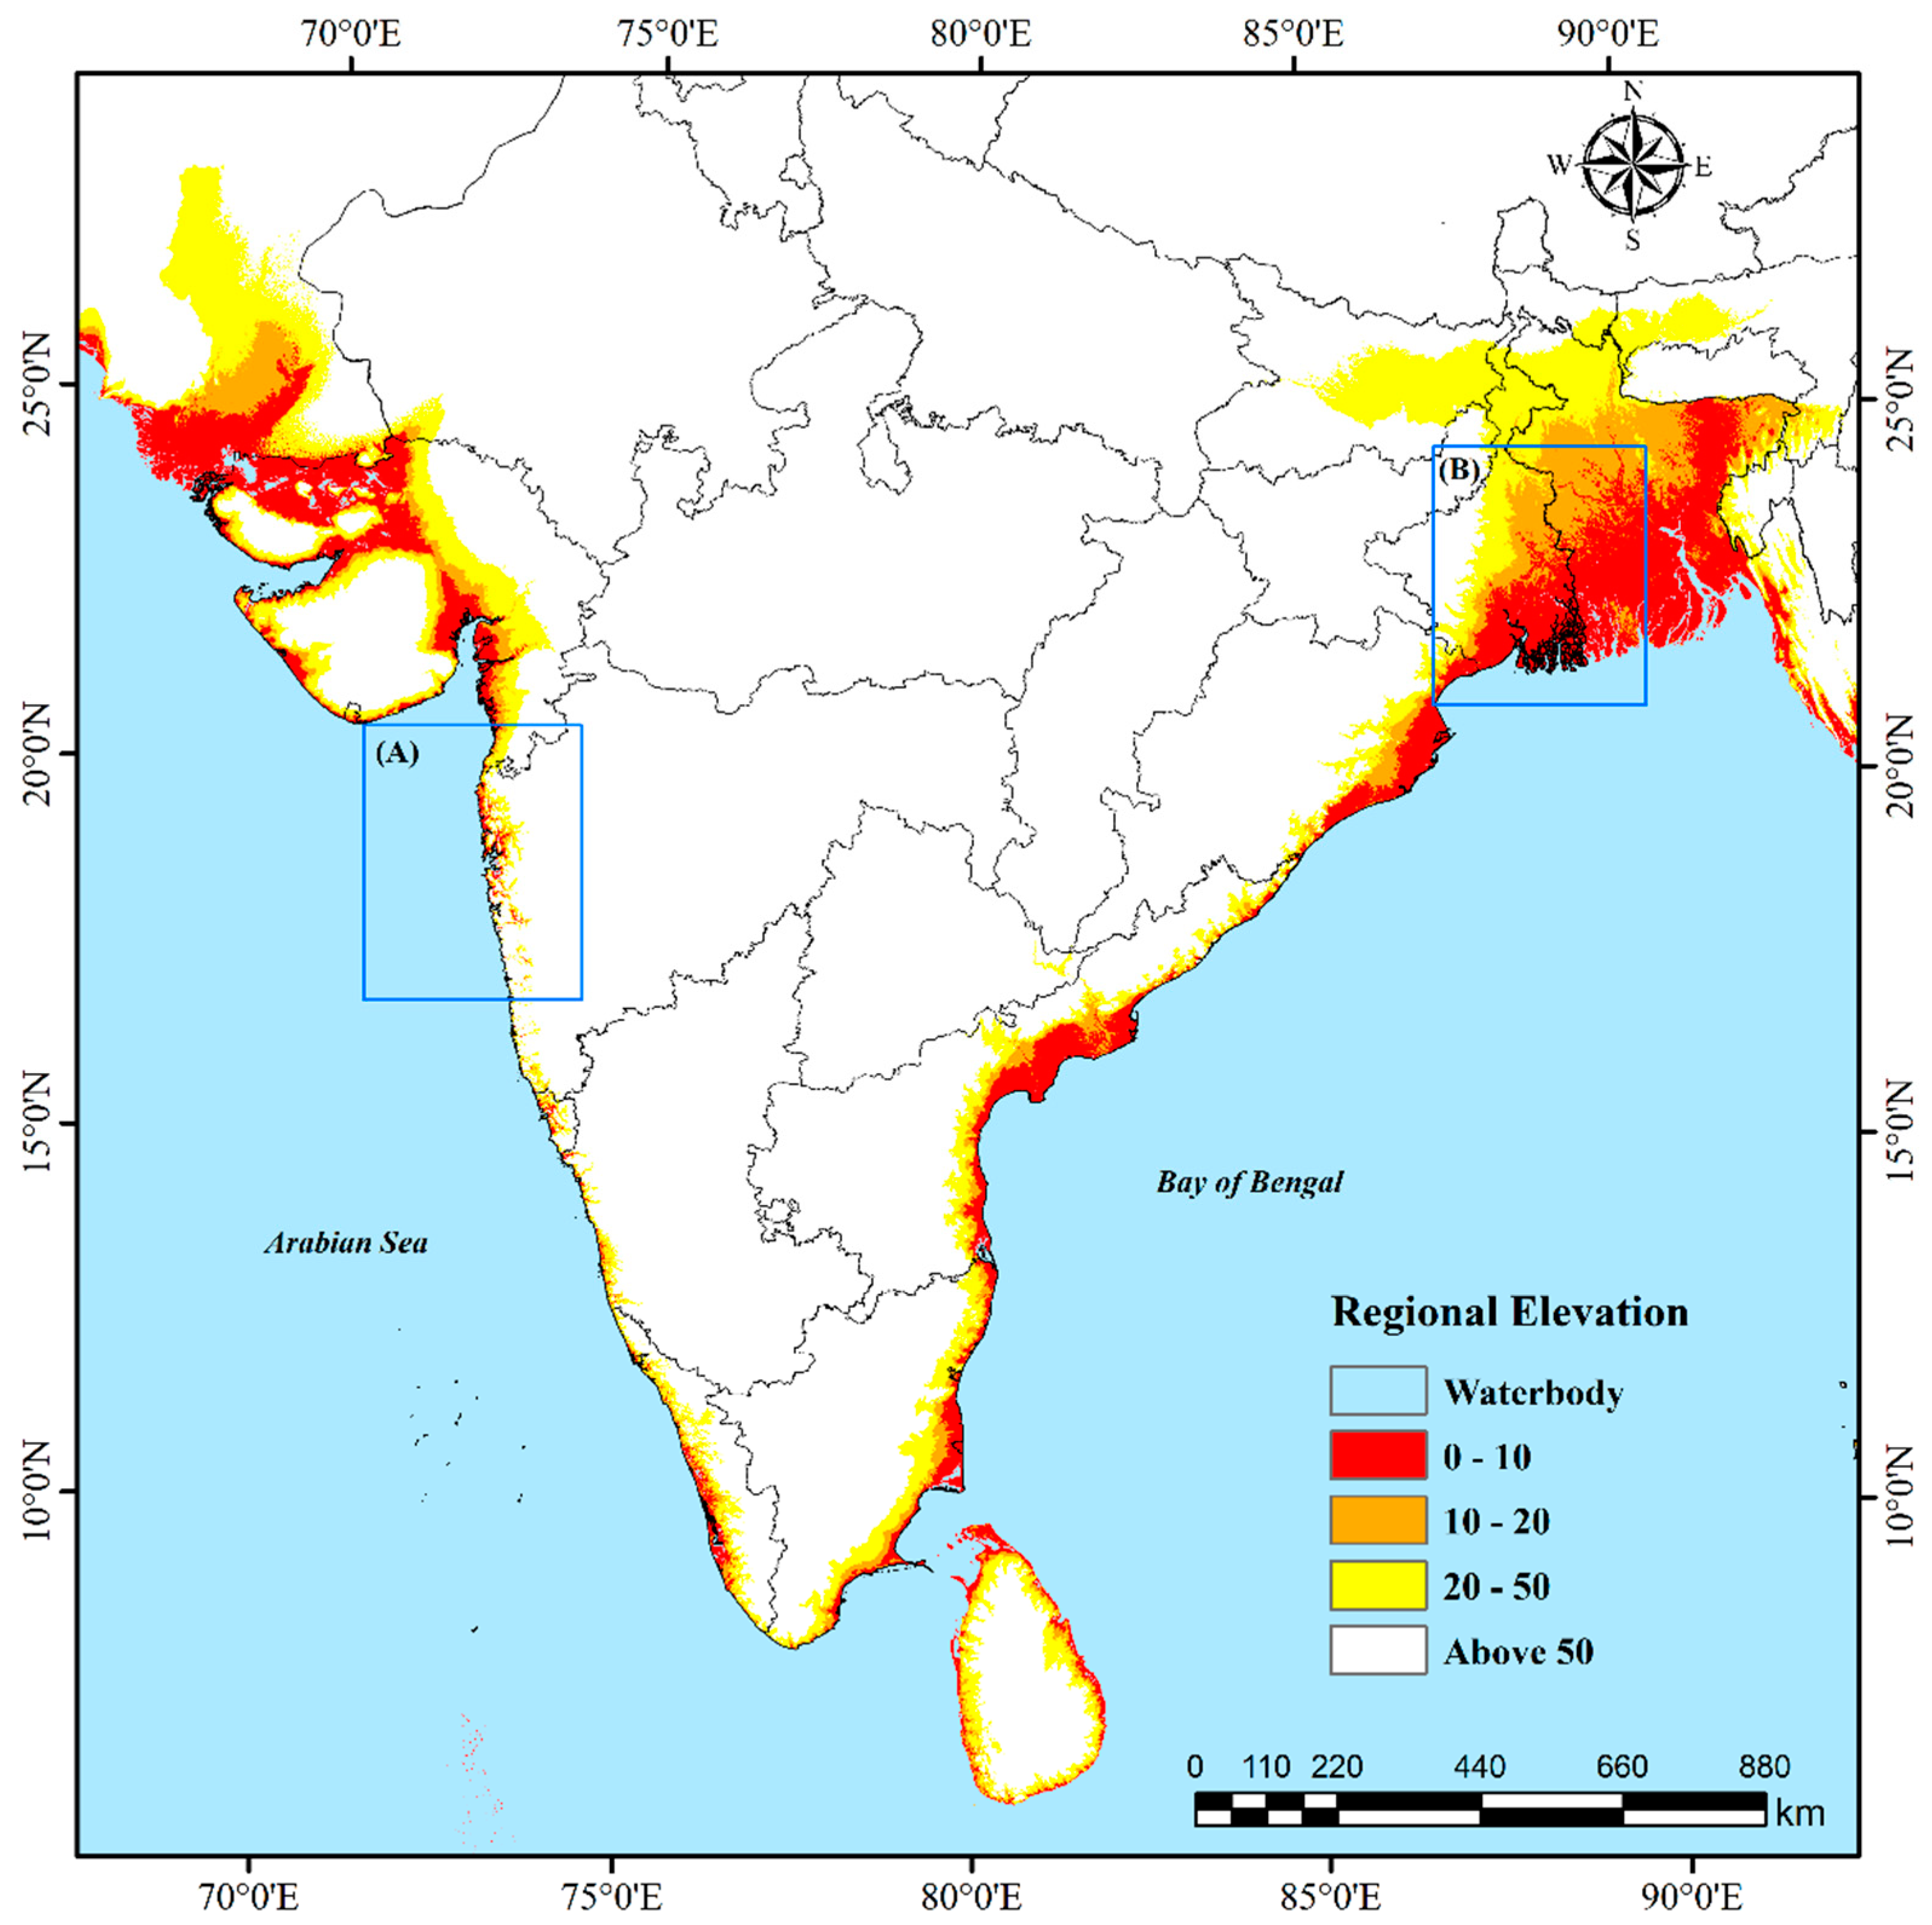
Typically, TCs distress coasts with their high intensity wind, heavy precipitation, and storm surges. Furthermore, low-lying coastal regions receive the maximum impact during the landfall. The western and eastern coastlines of the Indian subcontinent have different geological settings with respect to their elevations, coastal bathymetry, and geomorphology. The east coast lies between the Eastern Ghat and BOB, having a gentle slope, and most of the coastline is under low-lying regions, especially in the Northern region. On the contrary, the west coast is located in the middle of the Western Ghat and ARS, characterized as steeper than the east coast and with elevated terrain owing to the presence of the Eastern Ghat and narrow coastal belts. Therefore, the high precipitation along with the storm surge creates a pile of water in the low-lying areas, which caused inundation in the cyclone-impacted areas. The study investigated the potential impact areas under storm conditions. For instance, we analysed the areas under 10-meter elevation and observed that the cyclone Amphan affected an area of about 64,989 km2, which includes the Sundarbans wetlands that showed the largest affected area below 10 meters of elevation. Meanwhile, the impact area of Nisarga recorded only 2610 km2 below 10 meters of elevation (Figure 11). Hence, a three-meter surge height has the potential to destroy the west Bengal coast. However, the highly elevated Western Ghat mountain range reduces the wind intensity and prevents the CS from moving inland. During the cyclone Amphan, areas of South and North 24 Parganas districts of West Bengal state received almost 4.6 m storm surges [42], whereas the cyclone Nisarga brought 2 m storm surges in the Raigad, Mumbai, and Thane districts of Maharashtra state [21]. However, owing to the narrow topography of the Western Ghat, the storm surge was not sustained for a longer period.
The current study investigated the cyclone’s impact on LULC, finding that, while agricultural land and wetlands were severely affected, a significant amount of built-up area was also severely affected by the high intensity of wind, precipitation, and coastal flooding. Coastal flooding and storm surges caused widespread devastation and damage throughout Southern West Bengal. In some areas of West Bengal, the surge level reached nearly 5 m. As a result, coastal flooding occurred in Kolkata, causing infrastructure damage and affecting a large portion of the population. The study assessed flood inundation using microwave remote sensing data and identified an area under inundation of around 4010.81 km2 within the image area of Kolkata city premises. It was noticed that Kolkata and the surrounding urban environment, with a high population density, were severely affected by inundation (Figure 12).

4. Discussion

The present study analysed past cyclone events from 1982 to 2020 in the NIO and found that the BOB is most vulnerable to cyclone-associated hazards. The most devastating cyclones made landfall in the Odisha and West Bengal states. The west coast is less vulnerable to TC because of the lower number of cyclonic paths in the coastal region with respect to historical events. The impact assessment of two cyclones, namely Amphan in the BOB and Nisarga in the ARS, was also analysed using multi-temporal earth observational data. The cyclone Amphan, with extreme precipitation and highly intensified winds, caused an enormous loss of life and property in the state of West Bengal, Odisha, and neighboring Bangladesh, whereas the cyclone Nisarga had a large impact on parts of Maharashtra, Gujarat, and Madhya Pradesh with comparatively less damage. The cyclone Amphan killed more than 100 persons and more than 7.3 million people were affected, whereas the cyclone Nisarga killed 5 people and affected around 1 million people [43].
Storm intensity and translation speed are properties of TCs that influence the reduction in SST. Larger drops in SST were associated with intense TCs that are translating slowly [44]. SST is the primary oceanographic input in cyclone prediction models, even though storms are influenced by the thermal energy available through oceanic heat content [45]. Variation in SST in the cyclone eye and the periphery either intensifies or weakens the cyclone. Past studies evidenced that about a 3 °C increase in surface temperature would increase the maximum wind magnitude by 15–20% during a cyclone [44,46]. The relationships are consistent with other cyclones reported by various studies [47,48]. Several studies indicated that nearly 50% of the TC intensities were negatively correlated with SST over the NIO [45]. According to that study, SST is not a reliable indicator of cyclone intensity in the NIO. In line with previous findings, the present study also found that SST is negatively correlated with cyclone intensity (i.e., wind speed), but positively correlated with central pressure. Cyclones are controlled by many environmental and atmospheric factors and have interactions with them along with their interactions with SST [45]. Therefore, more detailed study is needed to understand why the intensity of these cyclones has a negative correlation with SST. The change in SST in the cyclone eye is important because reduced SSTs mean reduced fluxes of heat from the ocean to the storm [45]. The reduced surface fluxes beneath the eye wall, rather than a change in surface flux at some distance from the TC’s center, have the potential to impact the storm’s intensity [49,50]. The results indicated that a decreasing trend in SST intensified both of the cyclones, and demonstrated that a 1 °C decrease in SST intensified the wind magnitude by 14 knots (26 km/h) for the cyclone Nisarga and 25.7 knots (47.6 km/h) for the cyclone Amphan. SST cooling caused by TC has received considerable attention in recent decades [51]. The surrounding ocean environment and the TC’s features both have an impact on the extent of cooling of the SST [52]. TCs result in SST cooling through a number of dynamic mechanisms, including upwelling, air–sea heat exchange, and entrainment at the bottom of the mixed layer [53]. The specific effects of TC-induced SST cooling on atmosphere and ocean environment are not examined in this study.
Landfall precipitation and the resultant inland flooding have become the predominant cause of deaths associated with TCs [54]. Excess rainfall during the landfall of TCs leads to hazardous impacts in coastal areas. For real-time rainfall forecasts, it is crucial to have a deeper understanding of the variables influencing rainfall dispersion [55]. Over time, there has been considerable attention paid to the correlation between cyclone intensity and precipitation [32]. In the present study, the spatiotemporal precipitation pattern during the formation and landfall of cyclones was monitored and analyzed using GPM data. The results indicated that cyclone movement over the ocean surface and its landfall on the Indian subcontinent lead to high-speed winds accompanied by high-intensity precipitation in the ocean as well as on the continental landmass. However, both cyclones produced more precipitation at the left side of the trajectory, with a higher population concentration. There are many earlier studies evidencing that precipitation during landfall was often larger on the right side of the TC track [15,56]. Meanwhile, some observational studies evidence that precipitation is higher on the left side of the TC track in some landfalls [57,58]. We found that the cyclone Amphan caused much more intense precipitation than Nisarga, because its wind intensity and travel time were just half of those of the cyclone Amphan. The higher rate of precipitation was closely related to the intensity of the TC [59]. A TC with higher intensity results in higher average rain rates and total rain [31,56]. The intense precipitation during Amphan and subsequent flash flooding and landslides were also reported by previous studies [60,61], which were consistent with our findings. Furthermore, it affected mostly agricultural land and areas with a high population density (e.g., Kolkata city premises) because of inadequate urban structure and community planning [43]. As such, there was no study available on the impacts caused by Nisarga. Nevertheless, one study indicated that it caused erosion of 56% of the shoreline and loss of vegetation in the coastal zone of Maharashtra, India [37].
Cyclones and the associated tidal surges and extreme events represent a direct threat to the physiographic features on the ground [62,63]. Although natural disasters cannot be stopped owing to their regional dimensions, their impact can be reduced by an effective mitigation strategy [59]. Human lives, property, and natural ecosystems over the world are under threat due to recurrent cyclonic events accompanied by storm surges, coastal flooding, and high wind speeds [64]. The present study analysed the potential impact of a cyclone on the LULC and revealed that a large area of cropland and built-up area was severely exposed to high-intensity winds and storm surge. An area of 308 km2 was observed as wetlands on the west coast, while the eastern coast had an area of about 14,384 km2 represented by the world’s largest wetland, ‘Sundarban’, which exists along the Bengal coast. Hence, a significant area was protected from coastal inundation during the cyclone Amphan. The Mumbai metropolitan area along the western coast is one of the most populated and largest economic hubs in the world. The city was developed in an ecologically fragile region [65]. Therefore, small changes in the sea-level rise would cause flooding in the coastal urban area, which can be aggravated by the influence of anthropogenic activities [66]. The intensity of the cyclone wind field plays a significant role in the severity of its impact along on coast. The intensity of the cyclonic wind and concomitant destruction would be very high along the trajectory of the cyclone. During landfall, the wind intensity of the cyclone Amphan was observed to be above 155 km/h, whereas the observed maximum wind intensity during landfall of the cyclone Nisarga was 115 km/h. Therefore, the lower wind intensity during Nisarga in comparison with Amphan resulted in less impact along the western coast. Apart from that, regional elevation plays a significant role in controlling the wind flow and cyclonic storms. We evaluated the regional elevation and found dissimilarity in the east and west coasts. The Amphan impact zone was observed over the flat and widest coastal terrain, while the Nisarga impact zone was observed over a high-elevation steep slope and narrow coastlines. The cyclone Amphan had a wind speed of 85 knots (157 km/h) during landfall and it took 24 h to weaken to 30 knots (56 km/h), while Nisarga made landfall with a wind speed of 60 knots (111 km/h), which weakened to 30 knots (56 km/h) in 6 h. This provides evidence that the topology of the coastal region plays a significant role in controlling cyclonic storms.

5. Conclusions

The present study evaluated historical TCs in the NIO for the period between 1982 and 2020. Among them, the study focused on the impact assessment and characterization of two cyclones that occurred in the NIO in 2020 (Nisarga and Amphan). The major differences between the two TCs indicated that the cyclone Amphan made landfall as an ESCS that caused high intensity precipitation of more than 300 mm/day. However, the cyclone Nisarga made landfall as an SCS with precipitation of 172 mm/day. The key findings indicated that about 233,391 km2 (64%) of cropland in the cyclone Amphan and 137,266 km2 (82%) of cropland in the cyclone Nisarga were affected by extreme wind and precipitation. Furthermore, the study analyzed the regional elevation and found that the eastern coast of India is highly vulnerable to cyclone-induced hazards, owing to its low-elevation gentle topography and high intensity and frequency of TCs, while the west coast is less vulnerable with its steep and narrow coastline and lower intensity and frequency of TCs.
This study provided an accurate assessment of the destructive impacts of the cyclones Amphan and Nisarga and proved that the cyclone Amphan was more destructive than the cyclone Nisarga. The shallow water of the BOB with low-lying, flat coastal terrain and the funnel shape of the coast of West Bengal with high population density, in contrast to the narrow west coast, flanked by the Western Ghats, together with landfall taking place in less populated area, render higher potential damage during Amphan than during Nisarga.
These two TCs also differed by a combination of cyclone intensity, central pressure, SST, high winds, heavy rainfall, and coastal storm surges, as deduced in the study depending on the category of TCs. However, it provided an overall comparison between two severe episodic cyclones and their nature of the impact on hydro-meteorological parameters, built-up land, and agriculture. Thereby, the findings of the study are helpful for developing effective preparedness strategies for disaster risk reduction during cyclones and assessing the associated impacts along the coast of India and regions recurrently affected by TCs. As the east coast of India is facing highly intensified and recurring TCs compared with the west coast, sustainable mitigation strategies are required to cope with the extreme events. The east coast is abundant in deltas and wetlands, thus a nature-based solution for disaster mitigation is recommended. Therefore, conservation of the mangrove ecosystem is urgently needed in the vulnerable coastal states. Moreover, remote sensing satellite data, along with hydro-meteorological parameters, played a vital role in assessing cyclonic events. The study canvassed the potential impact of the cyclones Amphan and Nisarga on the Indian subcontinent using Earth observation satellite products and geospatial applications, which contribute to assessing the aftermath of the cyclone. The findings of the study support the preparation of effective preparedness strategies and disaster risk reduction by assessing the situations in the impact areas.

Author Contributions

K.K.B.A., A.C.P. and B.R.P.: Conceptualization, Investigation, Methodology, Software, Analysis, Visualization, Writing—original draft, review and editing. W. and C.S.D.: Investigation, Supervision, Methodology, Software, Analysis, Visualization, Writing—original draft, review and editing. All authors have read and agreed to the published version of the manuscript.

Funding

This research received no external funding.

Institutional Review Board Statement

Not applicable.

Informed Consent Statement

Not applicable.

Data Availability Statement

All data generated or analyzed during this study are included in the paper. The additional data may be available upon request to the author.

Acknowledgments

The authors wish to acknowledge the IMD, NOAA, JAXA, and NASA, MODIS, MOSDAC, BODC, ESA, Alaska Satellite Facility (ASF) for providing various satellite data free of cost.

Conflicts of Interest

The authors declare no conflict of interest.

References

  1. Adger, W.N.; Hughes, T.P.; Folke, C.; Carpenter, S.R.; Rockström, J. Social-Ecological Resilience to Coastal Disasters. Science 2005, 309, 1036–1039. [Google Scholar] [CrossRef] [Green Version]
  2. Burkett, V.; Davidson, M. Coastal Impacts, Adaptation, and Vulnerabilities; Island Press: Washington, DC, USA, 2012; pp. 1–124. [Google Scholar]
  3. Cochard, R.; Ranamukhaarachchi, S.L.; Shivakoti, G.P.; Shipin, O.V.; Edwards, P.J.; Seeland, K.T. The 2004 Tsunami in Aceh and Southern Thailand: A Review on Coastal Ecosystems, Wave Hazards and Vulnerability. Ecol. Evol. Syst. 2008, 10, 3–40. [Google Scholar] [CrossRef]
  4. Nicholls, R.J.; Wong, P.P.; Burkett, V.; Codignotto, J.; Hay, J.; McLean, R.; Ragoonaden, S.; Woodroffe, C.D.; Abuodha, P.A.O.; Arblaster, J. Coastal Systems and Low-Lying Areas. In Climate Change 2007: Impacts, Adaptation and Vulnerability. Contribution of Working Group II to the Fourth Assessment Report of the Intergovernmental Panel on Climate Change; Cambridge University Press: Cambridge, UK, 2007; pp. 315–356. [Google Scholar]
  5. Williams, S.J. Sea-Level Rise Implications for Coastal Regions. J. Coast. Res. 2013, 63, 184–196. [Google Scholar] [CrossRef]
  6. Mohapatra, M. Cyclone Hazard Proneness of Districts of India. J. Earth Syst. Sci. 2015, 124, 515–526. [Google Scholar] [CrossRef] [Green Version]
  7. United Nations Development Programme. Reducing Disaster Risk: A Challenge for Development; Bureau for Crisis Prevention and Recovery (BRCP): New York, NY, USA, 2015. [Google Scholar]
  8. Dube, S.K.; Jain, I.; Rao, A.D.; Murty, T.S. Storm Surge Modelling for the Bay of Bengal and Arabian Sea. Nat. Hazards 2009, 51, 3–27. [Google Scholar] [CrossRef]
  9. Höffken, J.; Vafeidis, A.T.; MacPherson, L.R.; Dangendorf, S. Effects of the Temporal Variability of Storm Surges on Coastal Flooding. Front. Mar. Sci. 2020, 7, 98. [Google Scholar] [CrossRef] [Green Version]
  10. Rahmstorf, S. Rising Hazard of Storm-Surge Flooding. Proc. Natl. Acad. Sci. USA 2017, 114, 11806–11808. [Google Scholar] [CrossRef] [Green Version]
  11. Hoarau, K.; Bernard, J.; Chalonge, L. Intense Tropical Cyclone Activities in the Northern Indian Ocean. Int. J. Climatol. 2012, 32, 1935–1945. [Google Scholar] [CrossRef]
  12. Reale, O.; Lau, W.K.; Susskind, J.; Brin, E.; Liu, E.; Riishojgaard, L.P.; Fuentes, M.; Rosenberg, R. AIRS Impact on the Analysis and Forecast Track of Tropical Cyclone Nargis in a Global Data Assimilation and Forecasting System. Geophys. Res. Lett. 2009, 36, 1–5. [Google Scholar] [CrossRef]
  13. Sahoo, B.; Bhaskaran, P.K. Assessment on Historical Cyclone Tracks in the Bay of Bengal, East Coast of India. Int. J. Climatol. 2016, 36, 95–109. [Google Scholar] [CrossRef]
  14. Mahendra, R.S.; Mohanty, P.C.; Bisoyi, H.; Kumar, T.S.; Nayak, S. Assessment and Management of Coastal Multi-Hazard Vulnerability along the Cuddalore–Villupuram, East Coast of India Using Geospatial Techniques. Ocean. Coast. Manag. 2011, 54, 302–311. [Google Scholar] [CrossRef]
  15. Parida, B.R.; Behera, S.N.; Oinam, B.; Patel, N.R.; Sahoo, R.N. Investigating the Effects of Episodic Super-Cyclone 1999 and Phailin 2013 on Hydro-Meteorological Parameters and Agriculture: An Application of Remote Sensing. Remote Sens. Appl. Soc. Environ. 2018, 10, 128–137. [Google Scholar] [CrossRef]
  16. WMO. World Meteorological Organization (WMO) Technical Document, 2015. Tropical Cyclone Operational Plan for the Bay of Bengal and the Arabian Sea; Tropical Cyclone Programme Report No. TCP21, 2015 Edition; Tropical Cyclone Programme; World Meteorological Organization: Geneva, Switzerland, 2015. [Google Scholar]
  17. Singh, O.P.; Khan, T.A.; Rahman, M.S. Changes in the Frequency of Tropical Cyclones over the North Indian Ocean. Meteorol. Atmos. Phys. 2000, 75, 11–20. [Google Scholar] [CrossRef]
  18. Alam, E.; Dominey-Howes, D. A new catalogue of tropical cyclones of the northern Bay of Bengal and the distribution and effects of selected landfalling events in Bangladesh. Int. J. Climatol. 2015, 35, 801–835. [Google Scholar] [CrossRef]
  19. Alam, E.; Momtaz, S.; Bhuiyan, H.U.; Baby, S.N. Climate change impacts on the coastal zones of Bangladesh: Perspectives on tropical cyclones, sea level rise, and social vulnerability. In Bangladesh I: Climate Change Impacts, Mitigation and Adaptation in Developing Countries; Springer: Berlin/Heidelberg, Germany, 2018; pp. 145–166. [Google Scholar]
  20. Evan, A.T.; Camargo, S.J. A Climatology of Arabian Sea Cyclonic Storms. J. Clim. 2011, 24, 140–158. [Google Scholar] [CrossRef] [Green Version]
  21. IMD Best Tract Report over the Bay of Bengal (BOB), Arabian Sea (AS) and Land Surface of India. 2020. Available online: https://rsmcnewdelhi.imd.gov.in/report.php?internal_menu=MzM= (accessed on 5 October 2021).
  22. Krishnan, R.; Sanjay, J.; Gnanaseelan, C.; Mujumdar, M.; Kulkarni, A.; Chakraborty, S. Assessment of Climate Change over the Indian Region: A Report of the Ministry of Earth Sciences (MoES), Government of India; Springer Nature: Dordrecht, The Netherland, 2020. [Google Scholar]
  23. Basheer Ahammed, K.K.; Pandey, A.C. Coastal Social Vulnerability and Risk Analysis for Cyclone Hazard Along the Andhra Pradesh, East Coast of India. KN-J. Cartogr. Geogr. Inf. 2019, 69, 285–303. [Google Scholar] [CrossRef] [Green Version]
  24. Lin, I.-I.; Goni, G.J.; Knaff, J.A.; Forbes, C.; Ali, M.M. Ocean heat content for tropical cyclone intensity forecasting and its impact on storm surge. Nat. Hazards 2013, 66, 1481–1500. [Google Scholar] [CrossRef]
  25. Rao, A.D.; Jain, I.; Murthy, M.R.; Murty, T.S.; Dube, S.K. Impact of Cyclonic Wind Field on Interaction of Surge–Wave Computations Using Finite-Element and Finite-Difference Models. Nat. Hazards 2009, 49, 225–239. [Google Scholar] [CrossRef]
  26. IPCC. IPCC Contribution of Working Groups I, II and III to the Fourth Assessment Report of the Intergovernmental Panel on Climate Change; IPCC Climate Change 2007: Synthesis Report; IPCC: Geneva, Switzerland, 2007; p. 104. [Google Scholar]
  27. Gray, W.M. Global View of the Origin of Tropical Disturbances and Storms. Mon. Weather Rev. 1968, 96, 669–700. [Google Scholar] [CrossRef]
  28. Rotunno, R.; Emanuel, K.A. An Air–Sea Interaction Theory for Tropical Cyclones. Part II: Evolutionary Study using a Nonhydrostatic Axisymmetric Numerical Model. J. Atmos. Sci. 1987, 44, 542–561. [Google Scholar] [CrossRef]
  29. Yuan, J.; Gao, Y.; Feng, D.; Yang, Y. The Zonal Dipole Pattern of Tropical Cyclone Genesis in the Indian Ocean Influenced by the Tropical Indo-Pacific Ocean Sea Surface Temperature Anomalies. J. Clim. 2019, 32, 6533–6549. [Google Scholar] [CrossRef]
  30. Hansen, J.; Ruedy, R.; Sato, M.; Lo, K. Global Surface Temperature Change. Rev. Geophys. 2010, 48. [Google Scholar] [CrossRef] [Green Version]
  31. Cerveny, R.S.; Newman, L.E. Climatological Relationships between Tropical Cyclones and Rainfall. Mon. Weather Rev. 2000, 128, 3329–3336. [Google Scholar] [CrossRef]
  32. Yu, Z.; Wang, Y.; Xu, H.; Davidson, N.; Chen, Y.; Chen, Y.; Yu, H. On the Relationship between Intensity and Rainfall Distribution in Tropical Cyclones Making Landfall over China. J. Appl. Meteorol. Climatol. 2017, 56, 2883–2901. [Google Scholar] [CrossRef]
  33. Chen, Y.; Ebert, E.E.; Walsh, K.J.; Davidson, N.E. Evaluation of TMPA 3B42 Daily Precipitation Estimates of Tropical Cyclone Rainfall over Australia. J. Geophys. Res. Atmos. 2013, 118, 11–966. [Google Scholar] [CrossRef]
  34. Jiang, H.; Halverson, J.B.; Simpson, J. On the Differences in Storm Rainfall from Hurricanes Isidore and Lili. Part I: Satellite Observations and Rain Potential. Weather Forecast. 2008, 23, 29–43. [Google Scholar] [CrossRef] [Green Version]
  35. Yu, Z.; Yu, H.; Chen, P.; Qian, C.; Yue, C. Verification of Tropical Cyclone–Related Satellite Precipitation Estimates in Mainland China. J. Appl. Meteorol. Climatol. 2009, 48, 2227–2241. [Google Scholar] [CrossRef] [Green Version]
  36. Maneesha, K.; Ratheesh, S.; Bhaskar, T.V.S. Impact of the Upper Ocean Processes on Intensification of Cyclone Amphan. J. Indian Soc. Remote Sens. 2022, 1–10. [Google Scholar] [CrossRef]
  37. Mishra, M.; Kar, D.; Santos, C.A.G.; da Silva, R.M.; Das, P.P. Assessment of impacts to the sequence of the tropical cyclone Nisarga and monsoon events in shoreline changes and vegetation damage in the coastal zone of Maharashtra, India. Mar. Pollut. Bull. 2022, 174, 113262. [Google Scholar] [CrossRef]
  38. Zhang, Y.; Du, Y. Extreme IOD induced tropical Indian Ocean warming in 2020. Geosci. Lett. 2021, 8, 37. [Google Scholar] [CrossRef]
  39. Johny, C.J.; Singh, S.K.; Prasad, V.S. Validation and Impact of SCATSAT-1 Scatterometer Winds. Pure Appl. Geophys. 2019, 176, 2659–2678. [Google Scholar] [CrossRef]
  40. Li, X.; Bellerby, R.; Craft, C.; Widney, S.E. Coastal Wetland Loss, Consequences, and Challenges for Restoration. Anthr. Coasts 2018, 1, 1–15. [Google Scholar] [CrossRef] [Green Version]
  41. Dare, R.A.; McBride, J.L. Sea Surface Temperature Response to Tropical Cyclones. Mon. Weather Rev. 2011, 139, 3798–3808. [Google Scholar] [CrossRef]
  42. Aid India Amphan: First Situation Report from Sunderbans. Association for India’s Development 2020. Available online: https://aidindia.org/amphan-first-situation-report-from-sunderbans/ (accessed on 21 February 2022).
  43. Basheer Ahammed, K.; Pandey, A.C. Characterization and Impact Assessment of Super Cyclonic Storm AMPHAN in the Indian Subcontinent through Space Borne Observations. Ocean. Coast. Manag. 2021, 205, 105532. [Google Scholar] [CrossRef]
  44. Emanuel, K.A. Thermodynamic Control of Hurricane Intensity. Nature 1999, 401, 665–669. [Google Scholar] [CrossRef]
  45. Ali, M.M.; Swain, D.; Kashyap, T.; McCreary, J.P.; Nagamani, P.V. Relationship Between Cyclone Intensities and Sea Surface Temperature in the Tropical Indian Ocean. IEEE Geosci. Remote Sens. Lett. 2013, 10, 841–844. [Google Scholar] [CrossRef]
  46. D’asaro, E.; Black, P.; Centurioni, L.; Harr, P.; Jayne, S.; Lin, I.-I.; Lee, C.; Morzel, J.; Mrvaljevic, R.; Niiler, P.P. Typhoon-ocean interaction in the western North Pacific: Part 1. Oceanography 2011, 24, 24–31. [Google Scholar] [CrossRef] [Green Version]
  47. Ali, M.M.; Jagadeesh, P.V.; Jain, S. Effects of Eddies on Bay of Bengal Cyclone Intensity. Eos Trans. Am. Geophys. Union 2007, 88, 93–95. [Google Scholar] [CrossRef]
  48. Goni, G.J.; Trinanes, J.A. Ocean Thermal Structure Monitoring Could Aid in the Intensity Forecast of Tropical Cyclones. Eos Trans. Am. Geophys. Union 2003, 84, 573–578. [Google Scholar] [CrossRef] [Green Version]
  49. Cione, J.J.; Uhlhorn, E.W. Sea Surface Temperature Variability in Hurricanes: Implications with Respect to Intensity Change. Mon. Weather Rev. 2003, 131, 1783–1796. [Google Scholar] [CrossRef] [Green Version]
  50. D’Asaro, E.A.; Sanford, T.B.; Niiler, P.P.; Terrill, E.J. Cold Wake of Hurricane Frances. Geophys. Res. Lett. 2007, 34. [Google Scholar] [CrossRef]
  51. Osuri, K.K.; Nadimpalli, R.; Mohanty, U.C.; Niyogi, D. Prediction of rapid intensification of tropical cyclone Phailin over the Bay of Bengal using the HWRF modelling system. Q. J. R. Meteorol. Soc. 2017, 143, 678–690. [Google Scholar] [CrossRef]
  52. Lin, I.I.; Wu, C.; Pun, I.; Ko, D. Upper-Ocean Thermal Structure and the Western North Pacific Category 5 Typhoons. Part I: Ocean Features and the Category 5 Typhoons’ Intensification. Mon. Weather Rev. 2008, 136, 3288–3306. [Google Scholar] [CrossRef] [Green Version]
  53. Pothapakula, P.K.; Osuri, K.K.; Pattanayak, S.; Mohanty, U.C.; Sil, S.; Nadimpalli, R. Observational perspective of SST changes during life cycle of tropical cyclones over Bay of Bengal. Nat. Hazards 2017, 88, 1769–1787. [Google Scholar] [CrossRef]
  54. Rappaport, E.N. Loss of Life in the United States Associated with Recent Atlantic Tropical Cyclones. Bull. Am. Meteorol. Soc. 2000, 81, 2065–2074. [Google Scholar] [CrossRef]
  55. Changnon, S.A.; Huff, F.A.; Vogel, J.L.; Brunkow, D.A.; Staggs, D.W. Rainfall Prediction-Measurement Systems and Rainfall Design Information for Urban Areas; Circular No. 146; Illinois Institute Of Natural Resources: Urbana, IL, USA, 1980. [Google Scholar]
  56. Powell, M.D. Changes in the Low-Level Kinematic and Thermodynamic Structure of Hurricane Alicia (1983) at Landfall. Mon. Weather Rev. 1987, 115, 75–99. [Google Scholar] [CrossRef]
  57. Blackwell, K.G. The Evolution of Hurricane Danny (1997) at Landfall: Doppler-Observed Eyewall Replacement, Vortex Contraction/Intensification, and Low-Level Wind Maxima. Mon. Weather Rev. 2000, 128, 4002–4016. [Google Scholar] [CrossRef]
  58. Parrish, J.R.; Burpee, R.W.; Marks Jr, F.D.; Grebe, R. Rainfall Patterns Observed by Digitized Radar during the Landfall of Hurricane Frederic (1979). Mon. Weather Rev. 1982, 110, 1933–1944. [Google Scholar] [CrossRef]
  59. Jiang, H.; Halverson, J.B.; Sim, J. Difference of Rainfall Distribution for Tropical Cyclones over Land and Ocean and Rainfall Potential Derived from Satellite Observations and Its Implication on Hurricane Landfall Flooding Prediction. In Proceedings of the 27th Conference on Hurricanes and Tropical Meteorology, Monterey, CA, USA, 24 April 2006. [Google Scholar]
  60. Mishra, A.K.; Vanganuru, N. Monitoring a tropical super cyclone Amphan over Bay of Bengal and nearby region in May 2020. Remote Sens. Appl. Soc. Environ. 2020, 20, 100408. [Google Scholar] [CrossRef]
  61. Chatterjee, S.; Roy, S. A Complete Study on the Costliest Super Cyclone Amphan (May 2020) with Its Devastating Impact on West Bengal, India. Remote Sens. Earth Syst. Sci. 2021, 4, 249–263. [Google Scholar] [CrossRef]
  62. Look, C.; Friedman, E.; Godbout, G. The Resilience of Land Tenure Regimes during Hurricane Irma: How Colonial Legacies Impact Disaster Response and Recovery in Antigua and Barbuda. J. Extrem. Events 2019, 6, 1940004. [Google Scholar] [CrossRef]
  63. Yang, D.; Yang, A.; Qiu, H.; Zhou, Y.; Herrero, H.; Fu, C.-S.; Yu, Q.; Tang, J. A Citizen-Contributed GIS Approach for Evaluating the Impacts of Land Use on Hurricane-Harvey-Induced Flooding in Houston Area. Land 2019, 8, 25. [Google Scholar] [CrossRef] [Green Version]
  64. Quesada-Román, A.; Villalobos-Chacón, A. Flash Flood Impacts of Hurricane Otto and Hydrometeorological Risk Mapping in Costa Rica. Geogr. Tidsskr.-Dan. J. Geogr. 2020, 120, 14–155. [Google Scholar] [CrossRef]
  65. Shahare, S. Efficacy of the Coastal Regulation and Policies Towards Urban Disaster Risk Reduction: A Case Study of Mumbai. PhD Thesis, Tata Institute of Social Sciences, Mumbai, India, 2014. [Google Scholar]
  66. Singh, S.; Parida, B.R. Satellite-Based Identification of Aquaculture Farming over Coastal Areas around Bhitarkanika, Odisha Using a Neural Network Method. Proceedings 2018, 2, 331. [Google Scholar] [CrossRef] [Green Version]
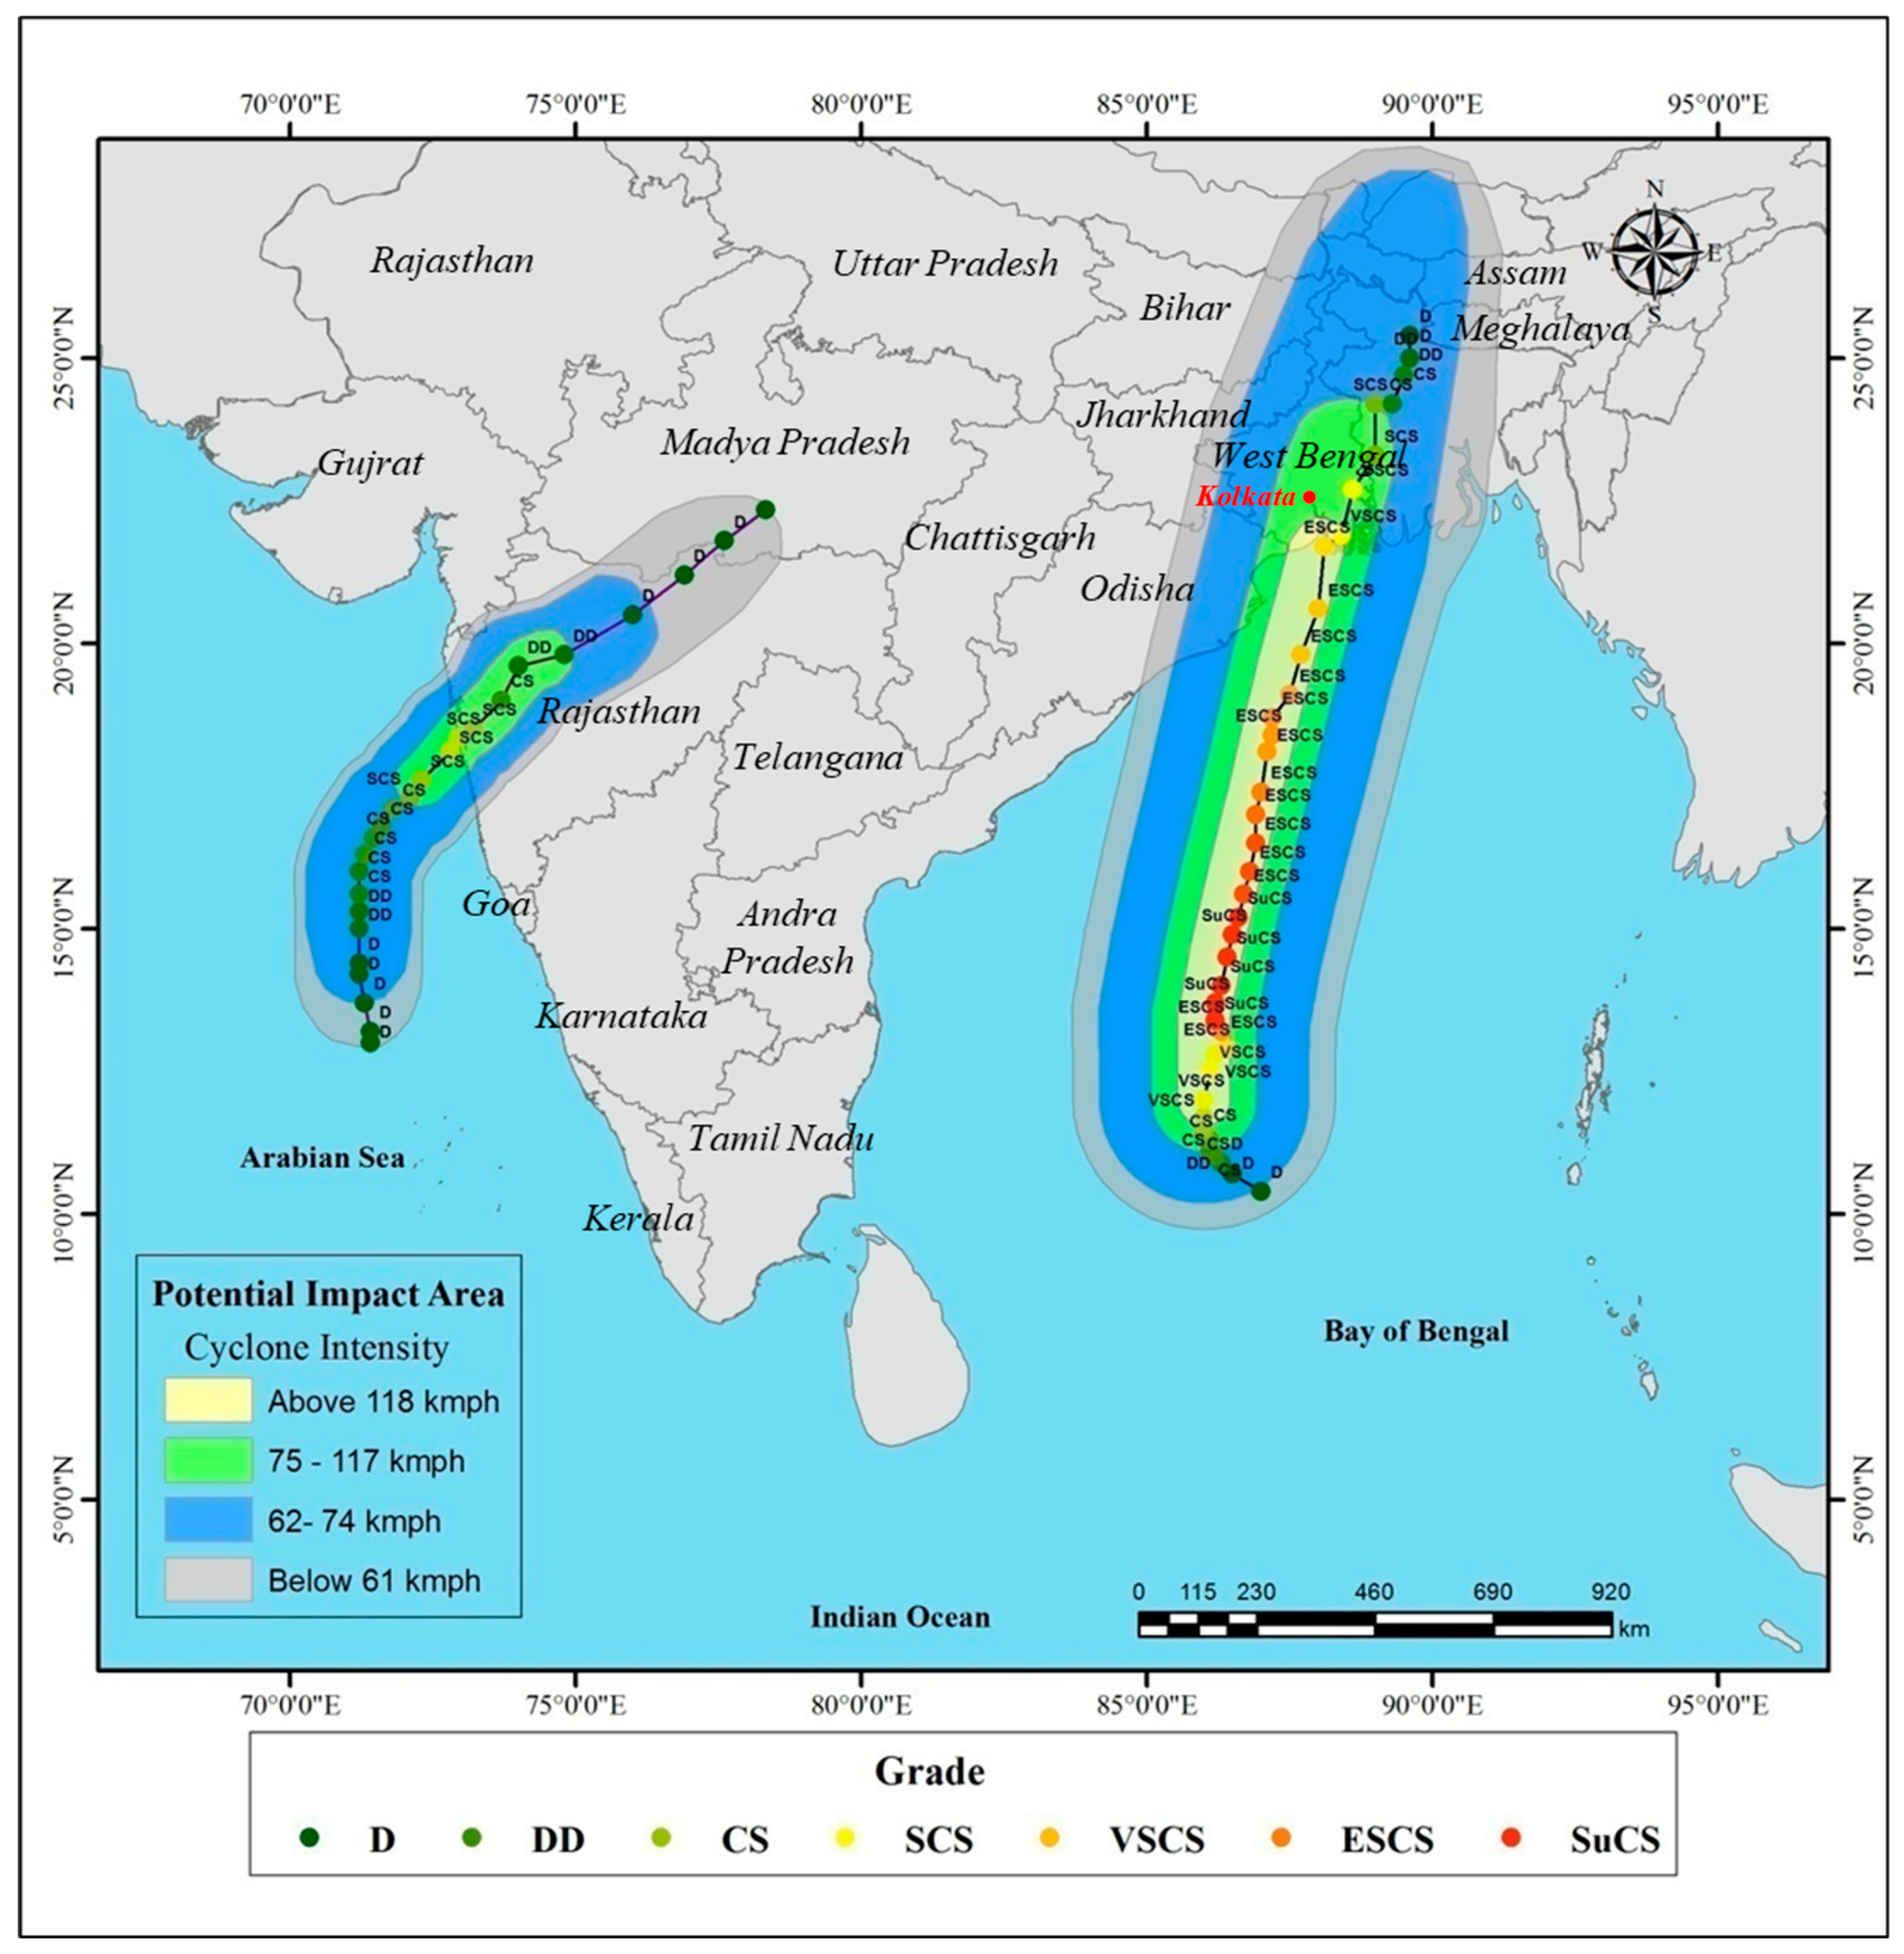
Figure 1. Location map with trajectories of SuCS Amphan in the BOB and SCS Nisarga in the ARS, along with the potential impact zone.
Sustainability 15 03992 g001
Figure 2. Estimated maximum sustained wind (knot) and central pressure (hPa) in (a) Super Cyclone Amphan and (b) Severe Cyclone Strom Nisarga.
Sustainability 15 03992 g002
Figure 3. Frequency of the TCs from 1982 to 2020. BOB represents the Bay of Bengal and ARS represents the ARS.
Sustainability 15 03992 g003
Figure 4. Historical cyclone occurrence and intensity over the NIO (3-hourly data). The Nisarga impact area (A) and Amphan impact area (B) are marked with rectangular boxes.
Sustainability 15 03992 g004
Figure 5. Spatial distribution of the daily SST during Cyclone Amphan between 15 and 21 May 2020.
Sustainability 15 03992 g005
Figure 6. Spatial distribution of the daily SST during Cyclone Nisarga between 1 and 5 June 2020.
Sustainability 15 03992 g006
Figure 7. Correlations of daily SST (°C) with cyclone intensity (i.e., wind speed in knots) and central pressure (hPa) for the cyclone Amphan (a,b) and the cyclone Nisarga (c,d). The corresponding data of SST, wind intensity, and central pressure represent the duration of Amphan (16–20 May 2020) and Nisarga (1–3 June 2020).
Sustainability 15 03992 g007
Figure 8. Spatial distribution of cyclonic precipitation between 16 and 21 May 2020.
Sustainability 15 03992 g008
Figure 9. Spatial distribution of cyclonic precipitation between 1 and 4 June 2020.
Sustainability 15 03992 g009
Figure 10. LULC map with different intensities of wind field and cyclone trajectory.
Sustainability 15 03992 g010
Figure 11. Coastal regional elevation. (A) Nisarga impact area. (B) Amphan impact area. On the map, waterbody can be seen in the low-lying areas of the land part.
Sustainability 15 03992 g011
Figure 12. Inundation map overlaid with LULC (a) and population density (b) of the Kolkata region (the bold black color boundary represents the Kolkata city premises) in West Bengal.
Sustainability 15 03992 g012
Table 1. Data used for the study and their resolutions. All data accessed on 21 July 2022.
Data UsedSpatial and Temporal ResolutionPurposeSource
SCATSAT-1 (wind product)25 × 25 km; dailywind speed and wind direction mappingISRO (https://www.mosdac.gov.in/)
NOAA OI SST0.25 × 0.25 degree; hourlyvariation in SST during cyclones Amphan and NisargaNOAA (https://psl.noaa.gov/)
Global Precipitation Measurement (GPM)0.1 × 0.1 degree; hourlyprecipitation mappingNASA (https://gpm.nasa.gov/)
MCD12Q1 (MODIS)500 m; monthlyLULC mappingUSGS (https://lpdaac.usgs.gov/)
GEBCO1 arc secregional elevationBODC (https://www.gebco.net/)
ALOS-2 PALSAR10 minundation mappingAlaska Satellite Facility (https://asf.alaska.edu/)
Sentinel-110 minundation mappingESA (https://scihub.copernicus.eu/)
Table 2. LULC distribution in km2 with different wind speeds (knots) for Amphan and Nisarga.
Amphan
LULC ClassesAbove 118 Knots117–75 Knots74–62 KnotsBelow 61 KnotsTotal Area (km2)
Forests0.4365.3825,990.6511,232.7637,289
Grassland384.192433.5727,071.4122,579.652,469
Wetland256.052985.527419.033723.5514,384
Cropland3461.1443,109.22130,423.156,397.57233,391
Urban19.21276.421499.06990.613785
Barren33.5896.43907.586253.3310,291
Waterbody24.821206.575399.055597.5812,228
Total area (km2)4179.4151,173.08201,709.9106,775363,837
Nisarga
Forests0504.27558.321898.112961
Grassland03683.945252.8112,714.9821,652
Wetland0141.71105.5761.6309
Cropland022,791.0250,721.4163,753.73137,266
Urban0567.181505.97888.22961
Barren011.9112.7469.6794
Waterbody0418.26705.34862.911987
Total area (km2)028,118.2958,862.1680,249.2167,230
Disclaimer/Publisher’s Note: The statements, opinions and data contained in all publications are solely those of the individual author(s) and contributor(s) and not of MDPI and/or the editor(s). MDPI and/or the editor(s) disclaim responsibility for any injury to people or property resulting from any ideas, methods, instructions or products referred to in the content.