Article

Spatio-Temporal Variability of Soil Properties and Nutrient Uptake for Sustainable Intensification of Rainfed Pigeon Pea (Cajanus cajana) in Semi-Arid Tropics of India

by
Neralikere Lakkappa Rajesh
1,*,
Koluru Narayana Rao
1,
Bheemsain Rao K. Desai
2,
Umapathi Sathishkumar
3,
Kasareddy Basavaraj
1,
Halagappala Verappa Rudramurty
1,
Vijay B. Wali
4 and
Mathada Rangappa Umesh
2,*
1
Department of Soil Science, University of Agricultural Sciences, Raichur 584 101, India
2
Department of Agronomy, University of Agricultural Sciences, Raichur 584 101, India
3
Department of Soil and Water Engineering, University of Agricultural Sciences, Raichur 584 101, India
4
Department of Agricultural Statistics, University of Agricultural Sciences, Raichur 584 101, India
*
Authors to whom correspondence should be addressed.
Sustainability 2023, 15(5), 3998; https://doi.org/10.3390/su15053998
Submission received: 16 December 2022 / Revised: 23 January 2023 / Accepted: 9 February 2023 / Published: 22 February 2023

Abstract

:
A study was conducted at Kalamandari Tanda-1 micro-watershed, Karnataka, India, to assess the spatio-temporal variability of surface soil properties sampled from 23 varied soil-phase units, delineated using IRS P6 LISS-IV merged Cartosat-I imagery (2.5 m spatial resolution). Three sets of surface soil samples (231 in each set) were collected, analyzed, and interpolated to evaluate the soil spatio-temporal variability. Further soil-phase-wise composite representative samples (23 in each set) were collected before the sowing and after the harvest of pigeon peasin January 2019 and 2020. Results showed that the soil OC with N, Mg with Ca, exchangeable sodium percentage (ESP), and cation exchange capacity (CEC) with Mn and K2O have a significantly positive association (p < 0.01) during both years. Similarly, a significantly positive association (p < 0.05) was observed among soil OC and N with Cu, Mn with CEC, and Zn with Fe, while a negative association was seen between available P2O5 and Na. Skewness from descriptive statistics revealed that pH, EC, Cu, Mg, B, and ESP distribution varied temporally, whereas other parameters remained almost unchanged. Geo-statistically, the spatial distribution of measured soil properties was best fitted to exponential, stable, and K-Bessel models. The available N in 2018 and the ESP in 2019 have shown weak spatial dependency, whereas the rest of the soil parameters showed moderate and strong spatial dependency. These interpolated maps were exported as vector layers to quantify soil-phase-wise spatio-temporal variability of soil properties.

1. Introduction

The systematic quantification of soil spatio-temporal variability is key for thesite-specific management of soils. Soil variability is a complex interplay product of extrinsic (associated with land management tools such as artificial drainage, tillage, fertilization, planting, and control of pH) and intrinsic (corresponding to pedological factors of soil formation) factors [1]. A detailed land resource inventory and soil classification provide insight into how soil variability has occurred with the influence of these intrinsic and extrinsic factors. Geostatistics has been an invaluable tool in soil science over the 30 years since the early work by Burgess and Webster [2]. Theoretical developments in geostatistics have allowed a closer integration of soil knowledge into a geostatistical prediction of spatial dependence of soil variables. Geostatistical approaches primarily provide semivariogram statistical input parameters for kriging interpolation. These variogram parameters will depict the spatial dependency of the soil variables by plotting the variance of individual soil parameters against the range, that is, the distance at which the variable shows maximum variance. The semivariogram also depicts the unexplained error by plotting the variance in the data at distance zero, called a nugget, which is a measure of accuracy in the sample collected with respect to sampling distribution, analytical results, or influence of any external factors.
Interpolation of soil fertility parameters using the kriging method with a suitable model helps generate prediction maps of the unsampled area from data of known sampled locations. This allows having a continuous map from discrete point data. Thereby the output soil fertility maps can be compared spatio-temporally for the same area at different time periods with a scale of spatial dependency of individual soil parameters from weak to moderate to strong, which is a measure of the selected kriging model accuracy. Understanding the variability of landscape and soil properties and their effect on pigeon pea crop growth and yield is a critical component of site-specific management under a rainfed semi-arid region. Therefore, it is imperative to geo-statistically assess the spatio-temporal variations in surface soil properties in different soil phases.
The farmers of the region grow pigeon peas as a monocrop under rainfed conditions. The available soil nutrient may vary spatiotemporally with poor soil management and the prevailing weather parameters. With the existing mono-cropping system, variations in soil properties are mostly dependent on prevailing weather conditions. Therefore, a temporal comparison of Pearson’s correlation output may also help in ascertaining these soil parameters’ stability or resistance to change as the weather changes, particularly the precipitation.
There is a need for integrated, balanced, and efficient fertilizer management to take care of proper replenishment and compensation of nutrient losses from the soil and locked-up nutrients for the growth of crops [3]. Therefore, the primary objective of this study was to evaluate and map the spatial distribution of soil fertility parameters and their temporal variations in the pigeon pea growing areas of Kalmandari Tanda-1 MWS through a geostatistical method. This learning would lead to adopting site-specific management practices and, inturn, increase the production and productivity of pigeon peas. Previous studies have not covered these aspects in the region; this study could provide insight into spatial variability of important soil fertility parameters useful for appropriate nutrient management and soil management in Kalmandari Tanda-1 MWS.

2. Material and Methods

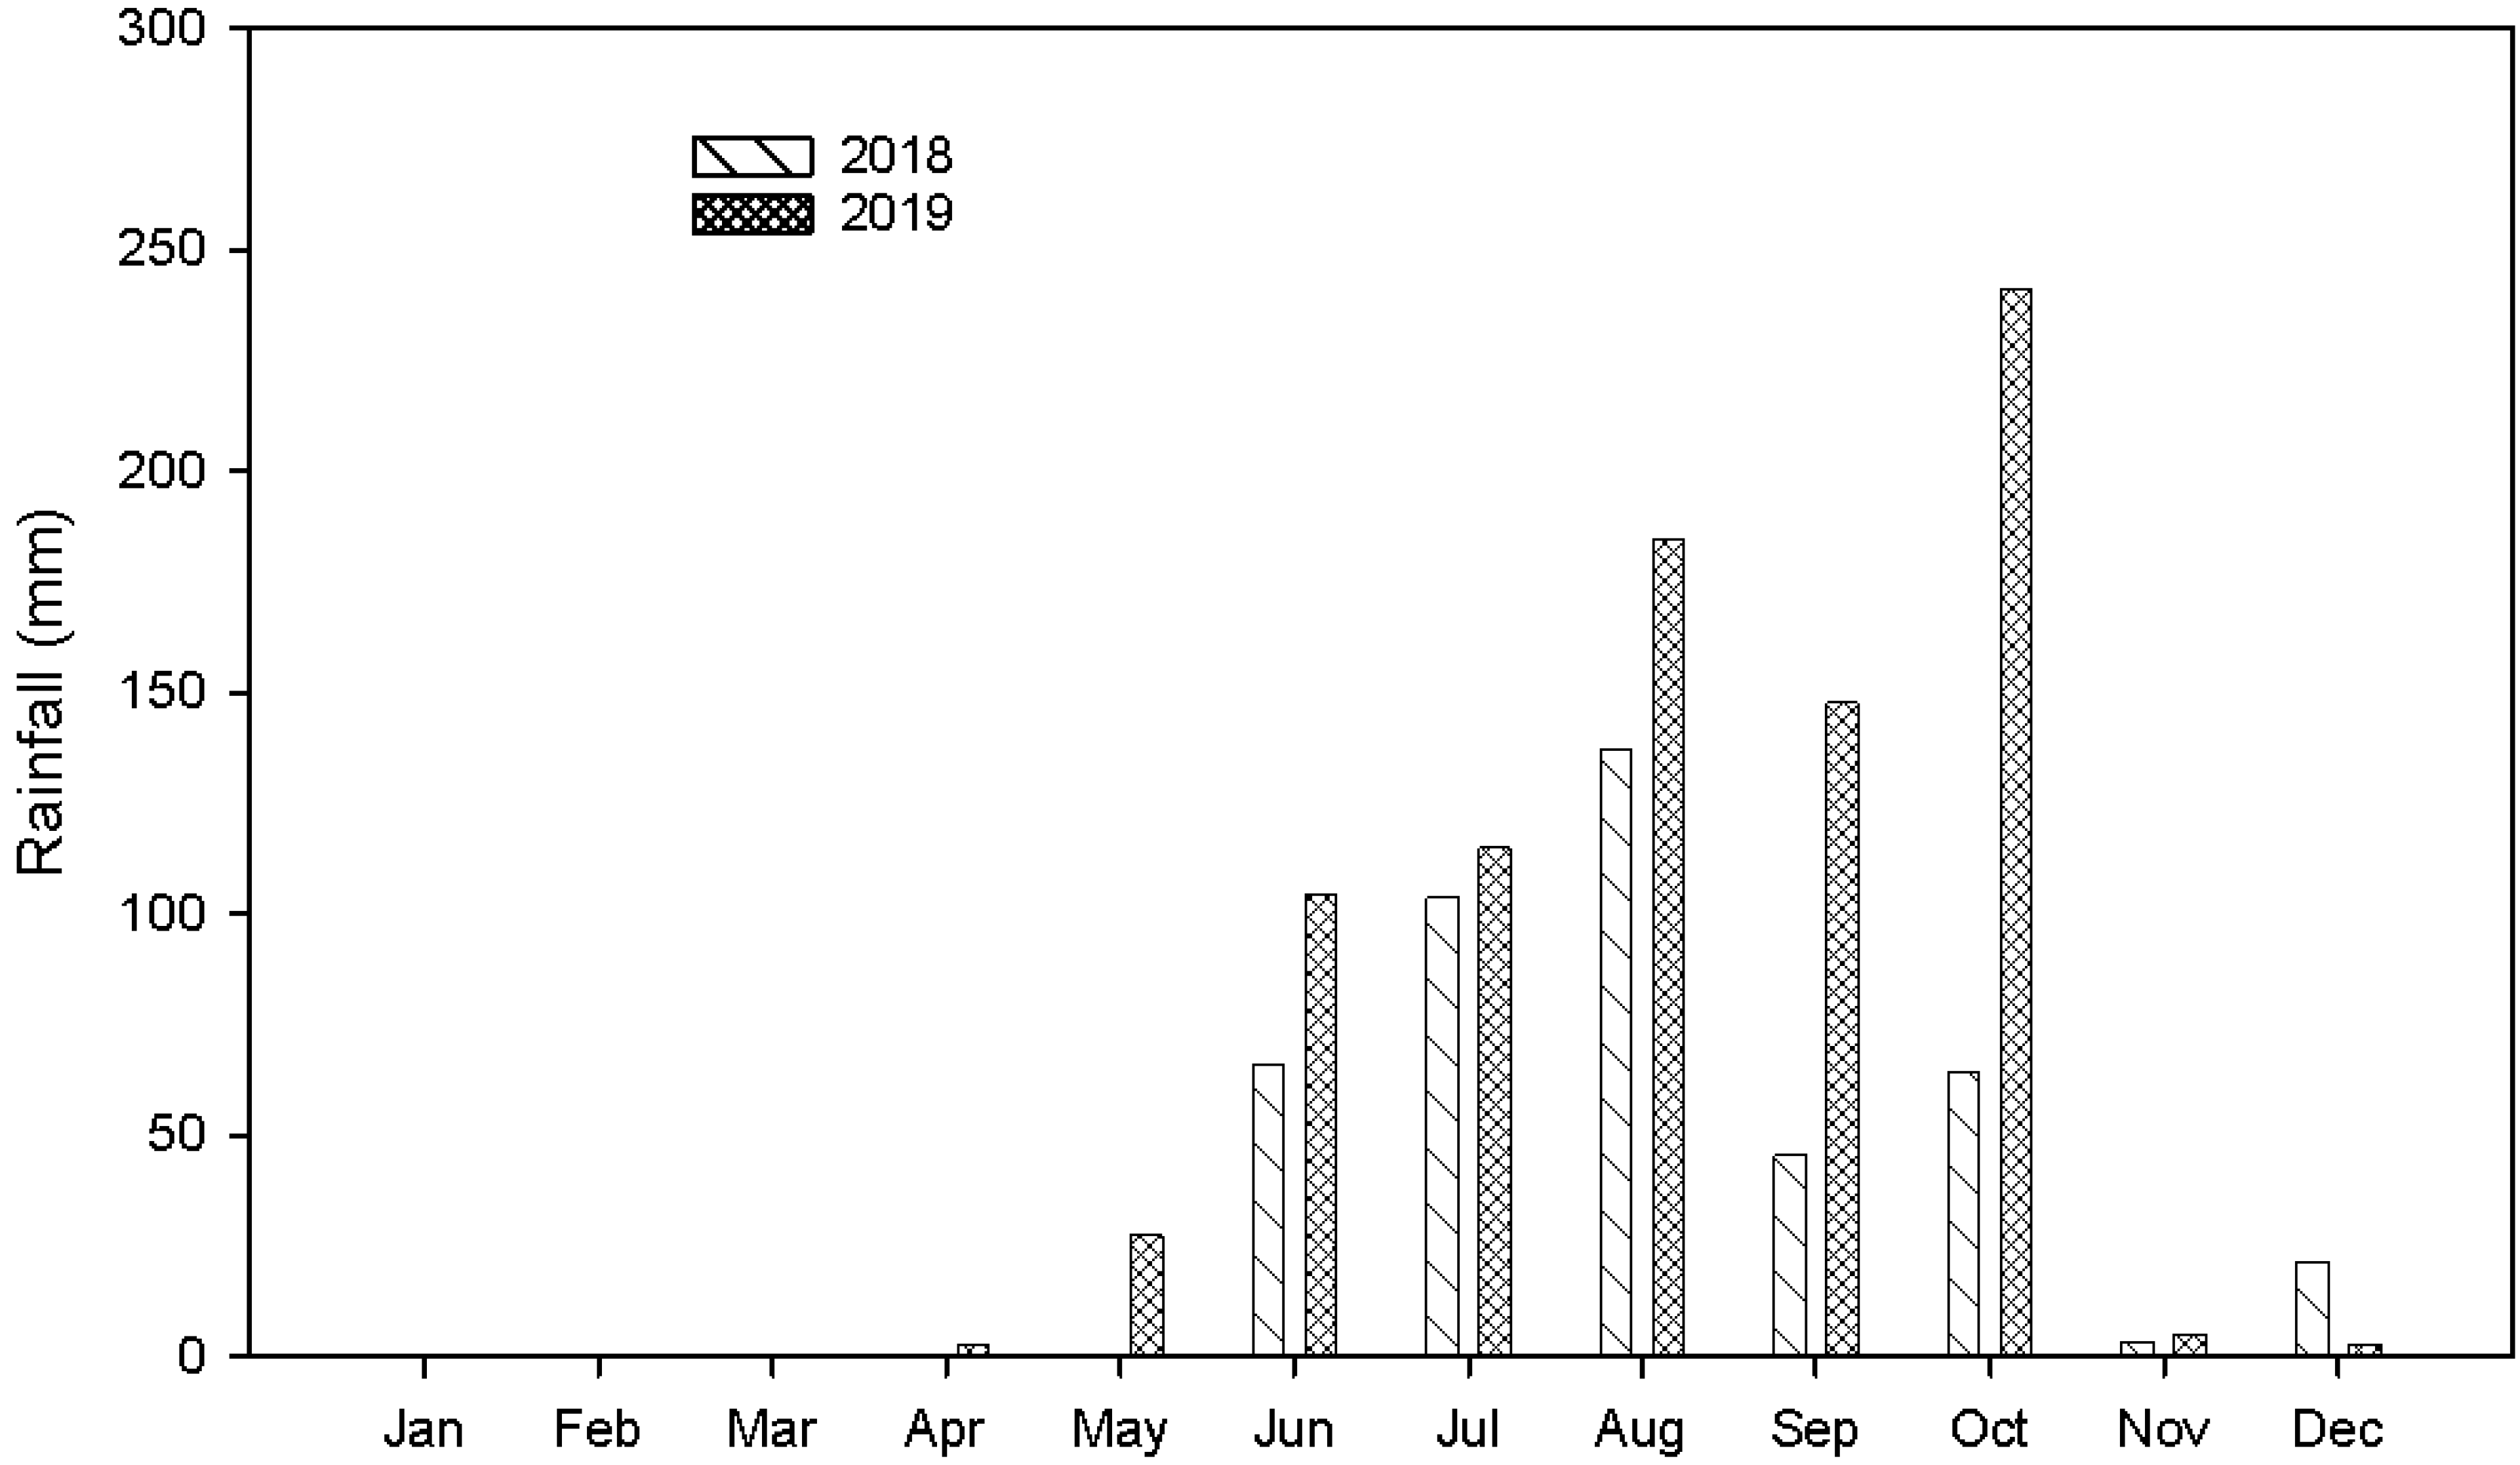
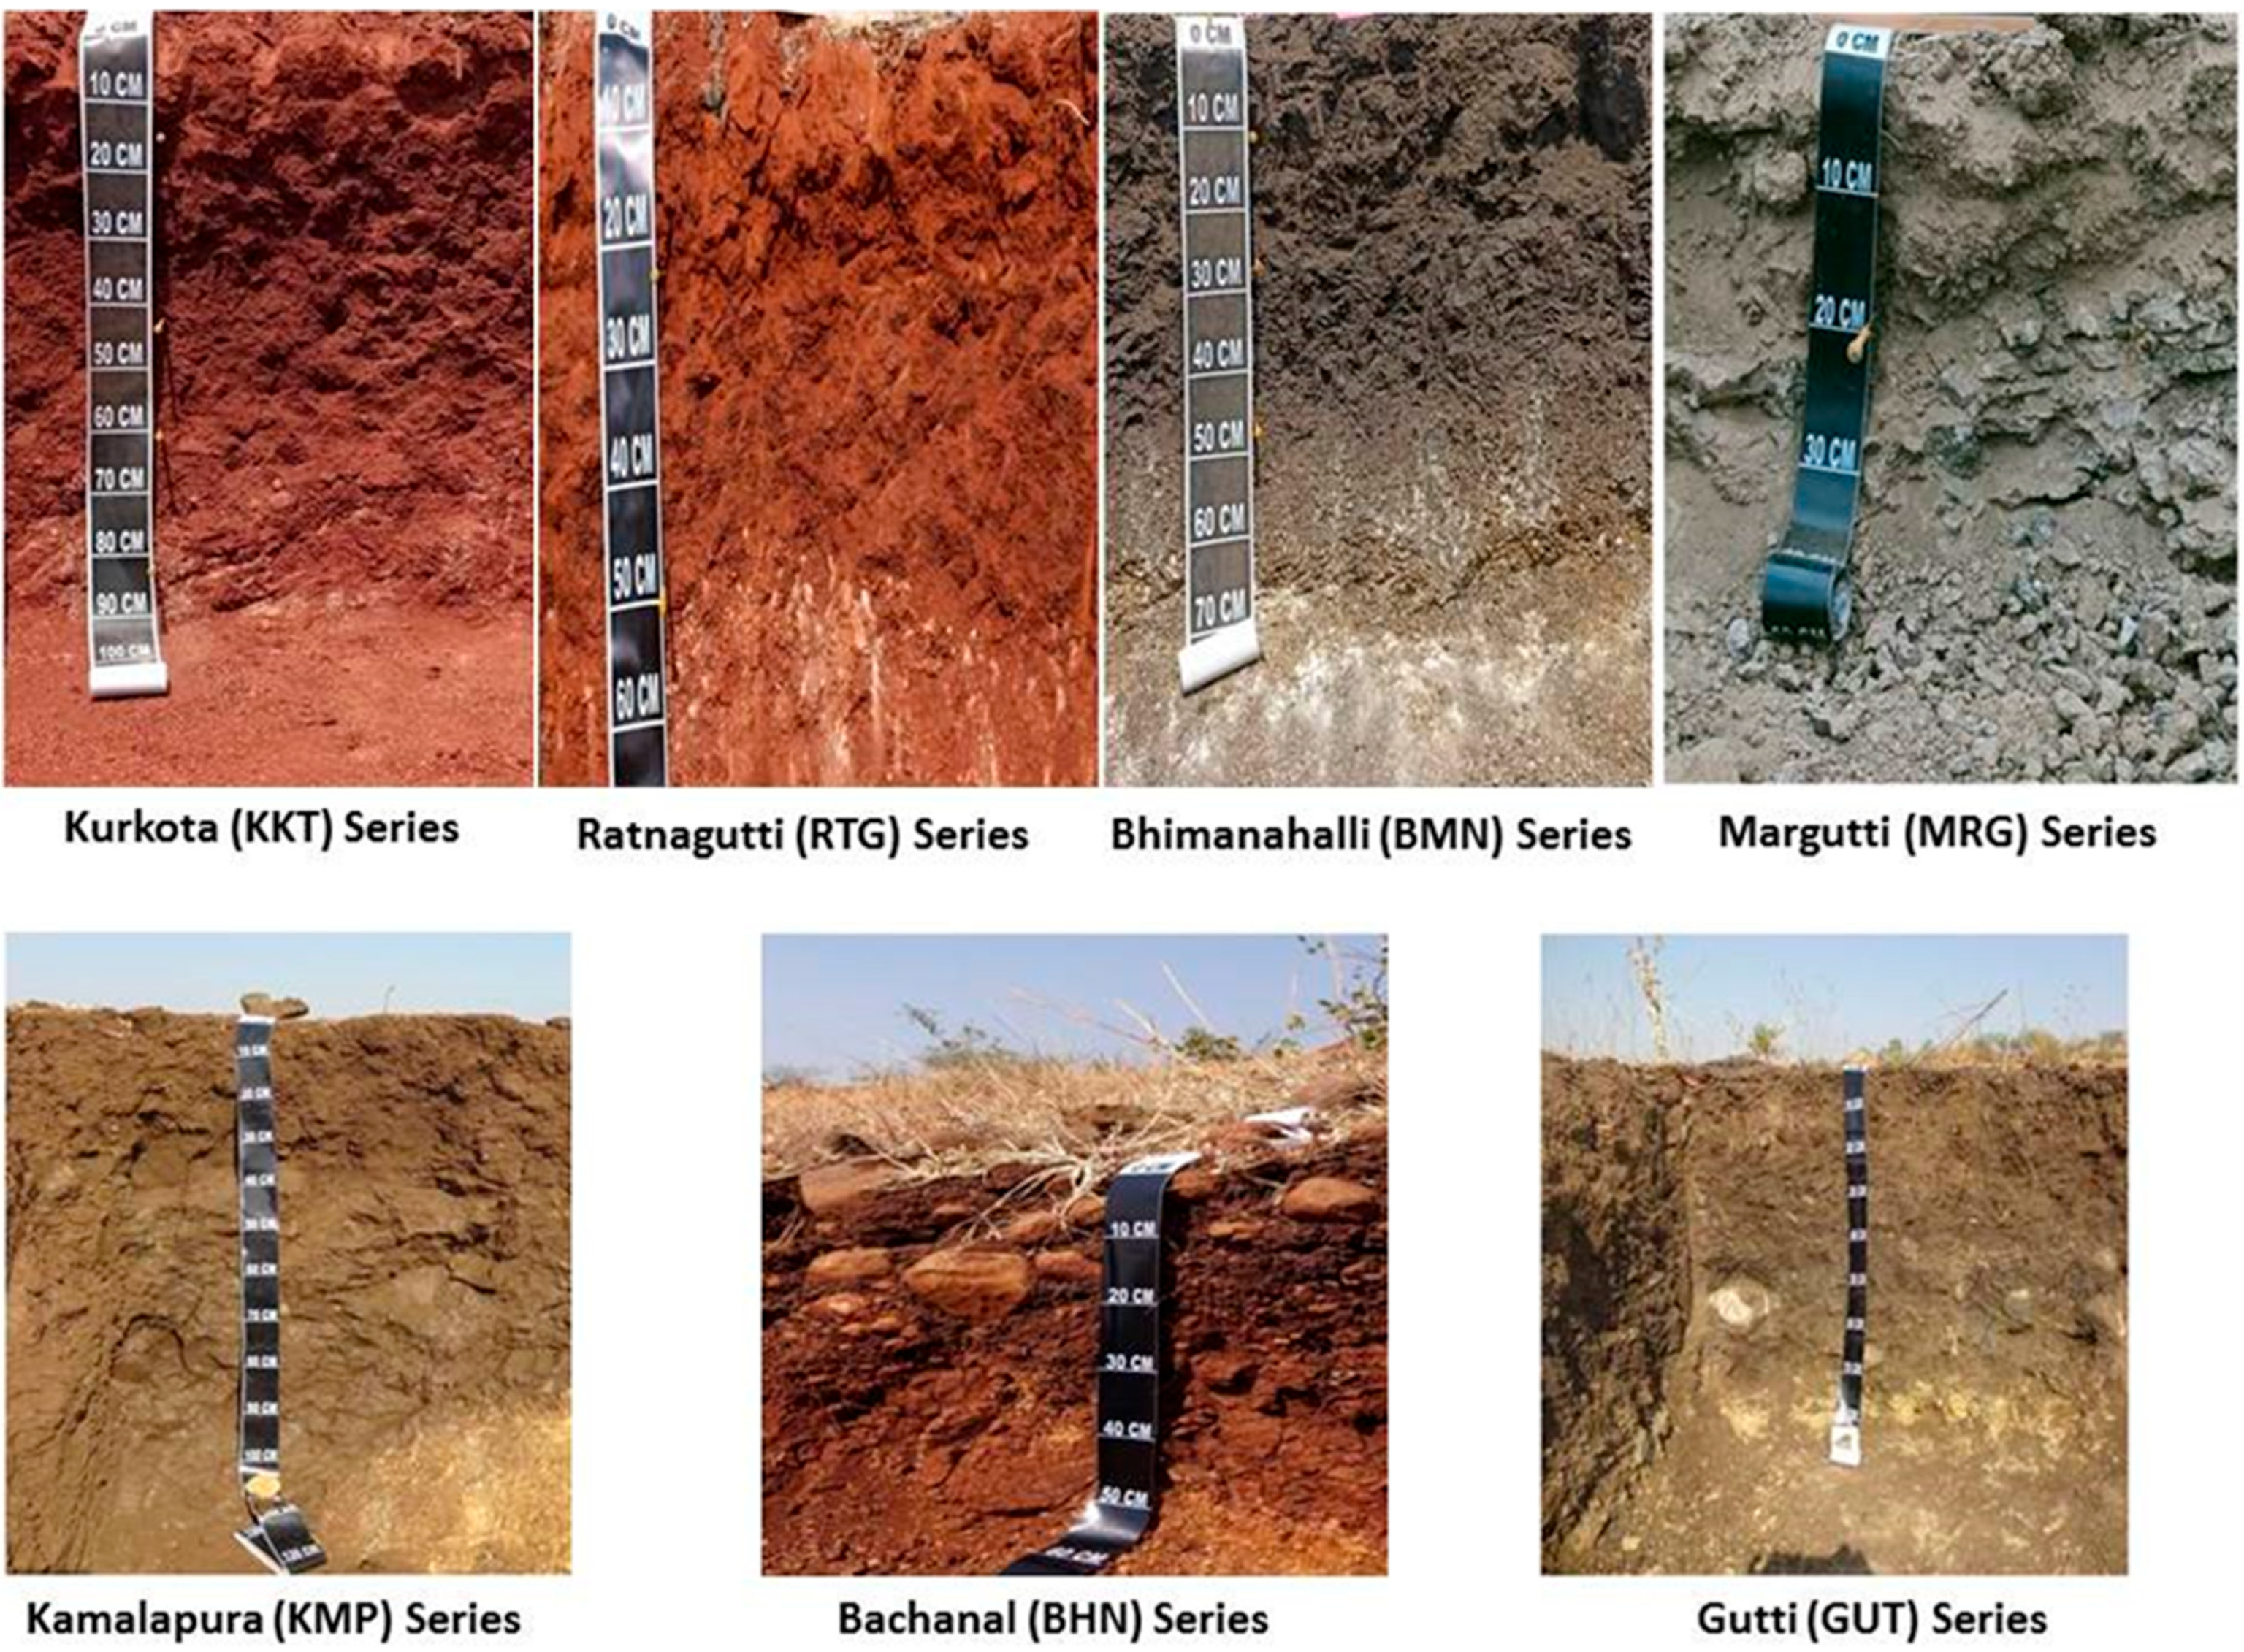
Kalmandari Tanda-1 MWS is located in Kalaburagi district, Karnataka state, India, covering 645.20 ha, lying between 17°40′ N—76°59′ E and 17°39′ N—77°1′ E (Figure 1). The average annual rainfall was 442 mm and 831.5 mm in 2018 and 2019, respectively, in the rainfed area (Figure 2). The purpose of the soil resources inventory is to delineate similar areas that respond or are expected to respond similarly to a set level of management practices [4]. Satellite image (Cartosat—I merged LISS-IV satellite imagery overlaid with cadastral map) interpretation was carried out at 1:8000 scale for delineation of homogenous boundaries with respect to imagery spectral signatures and slope (information derived from 1:25,000 scale Survey of India toposheets) and each polygon delineated was assigned with a soil physiographic map unit. After the intensive traversing of each physiographic unit, uplands, lowlands, midlands, and riverbanks were marked. Based on the variability observed on the surface, transects were selected across the slope, covering all the landform units, such as a break in slope, erosion, gravel, and stones. Then, a detailed soil survey was carried out (at 1:8000 scale) in the study areas in March 2018. Geomorphological features (slope, surface stoniness, erosion, drainage, gravels, etc.) of the landscape and morphological features (soil depth, texture, color, structure, consistency, coarse fragments, porosity, soil reaction, etc.) of the pedons were recorded (Figure 3). The soil and site characteristics were recorded for all profile sites on a standard proforma as per the guidelines given in the “field guide for land resources inventory” [5]. Horizon-wise soil samples were collected for chemical and physical characterization.

3. Soil Sampling

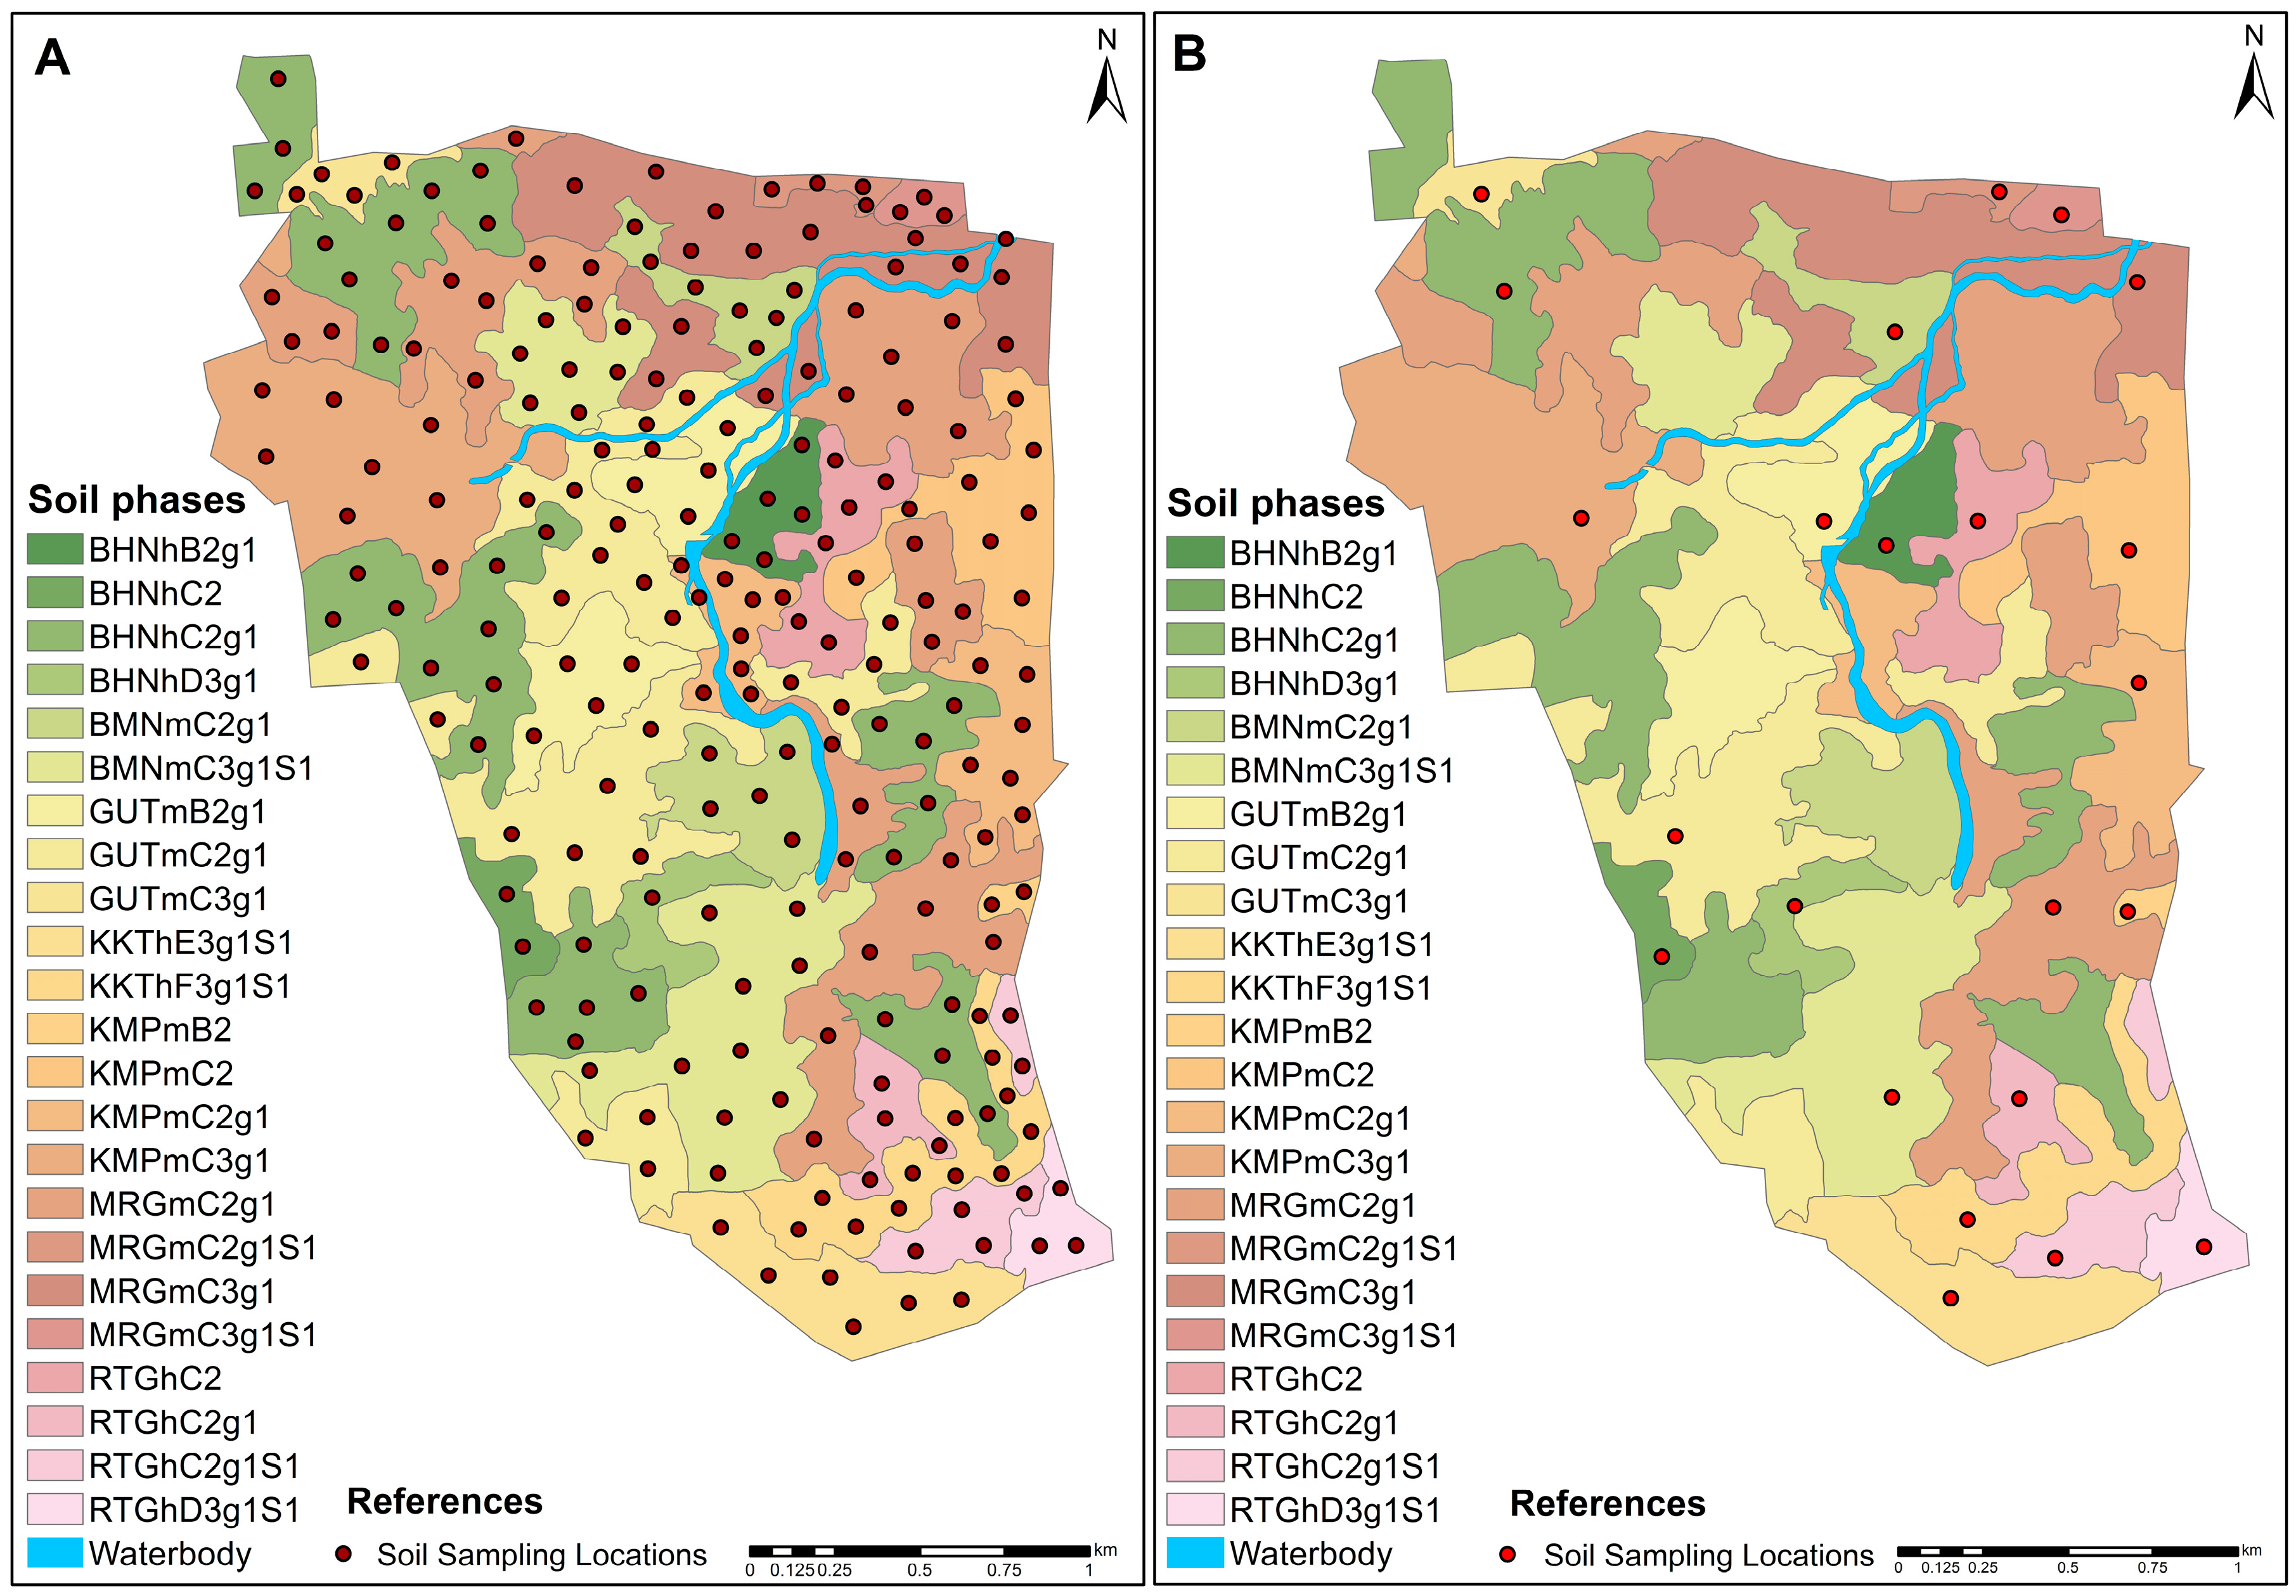
Three sets of surface soil samples (231 each set) were collected from 0–0.2 m depth separated rocks and wastes, ground, and sieved by using 0.2 mm mesh. Then they were analyzed and interpolated to evaluate the soil spatio-temporal variability. One set of samples was collected before the sowing of pigeon peas in June 2018 and the other two after harvesting pigeon peas in January 2019 and January 2020 (Figure 4). Meanwhile, soil-phase-wise composite representative soil samples (23 in each set) were collected. The Pigeonpea crop was cultivated by the adoption of regional production practices recommended by the University. Further plant samples, including seed and stover, were collected and analyzed for nutrient uptake studies.

4. Classification of Soil Series and Phases

Based on the recorded observations, such as soil depth, amount and nature of gravel, depth of occurrence of gravel layer, and nature of substratum present below soil and horizon sequence characteristics, the soils were grouped into different series in the area [6]. Further, soil series were divided into soil phases based on the surface characteristics with respect to soil texture, slope, erosion, and gravelliness.
The classification of soil series was made as per soil taxonomy [7]. Seven soil series were identified and further mapped into 23 soil-phase units, and their area distribution and description were mapped. Further, the physiographic unit boundaries were corrected as per the mapping unit area extent and distribution in the GIS environment using ArcGIS 10.7. The areas typically had slopes varying from 1% to 25%. Erosion hazards were judged through the visible soil erosion method by assessing the presence of rills and gullies within a field, as well as their associated deposits [8]. Soil texture was evaluated using the feel method and slope with the help of a dumpy level. Organic carbon (OC) was determined using the Walkley and Black [9] wet oxidation method. Available N was determined by a modified alkaline potassium permanganate method, as described by Subbiah and Asija [10]. Available P2O5 was determined using Olsen’s method. Available K2O was estimated using a flame photometer after extraction with ammonium acetate. Soil reaction (pH) was determined in 1:2.5 soil water suspensions using a glass electrode [11]. Electrical conductivity was measured in the soil water (1:2.5) suspension using a conductivity bridge [12]. The level of free calcium carbonate ions in soil samples was determined using a rapid titration method with standard HCl [11]. Cationic micronutrients like iron, copper, manganese, and zinc were extracted using diethylene triaminepentacetic acid (DTPA, 0.005 M and 0.01 M CaCl2 + 0.1 N tri-ethanol-amine at pH 7.3), and the concentration was measured using an atomic absorption spectrophotometer (ContrAA 700 Make) as outlined by Lindsay and Norvell [13]. Available boron in soil was estimated with a colorimetric method using hot water as an extractant and expressed in mg kg−1 [14]. Available sulfur in the soil was extracted with CaCl2·2H2O (0.15%), and the extract was reacted with barium chloride crystals. The intensity of the resulting turbidity was measured using a spectrophotometer at a wavelength of 420 nm [12].
Plant samples used for studying dry matter production were used for estimating nitrogen, phosphorus, potassium, sulfur, zinc, and iron content in the whole plant. The samples were powdered in a grinder and stored in a butter paper cover, and used for further analysis. Total nitrogen was determined by Kjeldahl’s method of nitrogen determination. In this method, a powdered sample of 0.5 g was digested with concentrated H2SO4in the presence ofa digestion mixture (K2SO4:CuSO4·5H2O:Se in the proportion of 100:20:1) and distilled under an alkaline medium. Liberated NH3 was trapped in boric acid containing a mixed indicator and titrated against standard H2SO4. From the volume of acid consumed by ammonia, the percent of nitrogen content was calculated.
Nitrogen   % = TV   mL × N · H 2 SO 4 × 0.014 × Vol .   of   digested   sample Weight   of   sample   taken   g × Aliquot   taken × 100
where TV is the titer value, and N·is normality.
Wet ashing of plant samples for nutrient analysis (total P, K, S, and Micronutrients); One gram plant sample was first pre-digested with 5 mL nitric acid and then digested with a di-acid mixture consisting of nitric acid and perchloric acid (10:4). The clear digested materials were made up to 50 mL volume using 6 N HCl and were subsequently used for the analysis of P, K, S, and Micronutrients. The standard methods of analysis were followed.
Plant Nutrient uptake was calculated by using the following equation;
Uptake   kg / ha = Nutrient   Concentration % ×   Biomass   kg / ha 100
Exploratory data analysis was performed with SPSS 2016 software. The data distributions were analyzed using classical statistics (mean, maximum, minimum, standard deviation, skewness, and kurtosis). The descriptive statistics of the soil data suggested that these were not normally distributed. The Pearson correlation coefficients were estimated for all possible paired combinations of the response variables to generate a correlation coefficient matrix. Correlation analysis has been carried out to study the association among the soil fertility variables
r = xy n x ¯ y ¯ i 1 r i j 2 + i 1 U
where ‘x’ and ‘y’ are two variables with means, and ‘r’ is the correlation coefficient.
All discrete observations with their location details, such as soil physico-chemical properties for two site years(after harvest) and before the sowing of pigeon peas, were assessed for their spatial variability by generating prediction maps using the “Kriging” interpolation technique [15] in ESRI (Environmental Systems Research Institute) make ArcGIS 10.7.Spatial dependency was measured as strong, moderate, and weak, based on the nugget (variance at distance zero) by sill (measure variance) ratio. Further, the soil fertility maps derived from the kriging interpolation were exported as vector data for limiting the fertility classes as per IISS-ICAR (Indian Institute of Soil Science—Indian Council of Agricultural Research) classification, and then these maps were assessed for their spatio-temporal variability for soil-phase wise site-specific nutrient management.
A variogram is defined as a measure of spatial variability.
r h = 1 2 N i = 1 N z x i z x i + h 2
The variogram distance measures the degree of dissimilarity γ(h) between paired sample points separated by distance h. If z(xi) and z(xj + h) are pairs of samples lying within a given class of distance and direction, given N(h) is the number of data pairs within this class, the experimental semivariogram can be defined as the average squared difference between the components of data pairs [16] as in the following equation.
The information derived through a semivariogram determines the continuation of different spatial characteristics for soil properties. C0 is the nugget variance, C is the structural variance, and sill (C0 + C) represents the degree of spatial variability, which is affected by both structural and stochastic factors. The nugget–sill ratio (C0/sill) indicates the percentage of the variation caused by stochastic factors to the total variation of the system. A higher value indicates that the stochastic factor plays a major role in the variation. From the point of view of structural factors, the ratio of C0/sill can manifest the autocorrelation among many systematic variables. If C0/sill < 25%, it means that there exists a strong spatial autocorrelation; if C0/sill ranges from 25% to 75%, it suggests there exists a moderate spatial autocorrelation; if C0/sill > 75%, it indicates that there is only a weak spatial autocorrelation [17].

5. Results and Discussion

Soils of Kalmadari Tanda-1 were derived from the basalt parent material. Bachinaal, Kurkota, and Ratnagutti soil series of Kalmandari Tanda-1 belong to the soil order Alfisol, whereas all other soil series of the MWS were of the Vertisol soil order. The majority of soils of the Kalmandari Tanda-1 micro-watershed area varied from very shallow to moderately deep. The MRG soil series was very shallow (<25 cm), BHN, RTG, and BMN series were shallow (25–50 cm), the GUT series was moderately shallow (50–75 cm), and the KMP and KKT series were moderately deep (75–100 cm) [18].The soil of the MRG, GTT, BMN, and KMP series belongs to clay texture, whereas that of the RTG, KKT, and BHN series belongs to sandy clay loam texture. The soils have 15–35% gravelliness. To a larger extent, gentle sloping was dominant in Kalmandari Tanda-1, followed by a strong to very strong slope. Soil erosion was found to be moderate to severe in the soils of Kalmandari Tanda-1 (Table 1).
Skewness from descriptive statistics (Table 2) revealed that pH, EC, Cu, Mg, B, and ESP distribution varied temporally, whereas other parameters remained almost unchanged. A decline in the trend of soil fertility (Soil OC, available N, P, K, S, Zn, Fe, Cu, Mn, Mg, and B) from 2018 to 2019 was observed in the soil parameters due to better uptake of nutrients by pigeon peas during site year-2 supported by normal precipitation (Figure 2).
All the micronutrients were decreased from year 1 to 2 due to the uptake by the crop. These nutrients are known to form relatively stable chelates with organic ligands, which decrease their susceptibility to adsorption, fixation, and precipitation [19]. Organic materials might have enhanced the microbial activity, and the added fertilizers in higher doses might have helped in better root growth, higher biomass, and root exudates and ultimately provided carbon and energy to the soil microbes. Farmyard manure (FYM) applied 15 days prior to planting releases complex organic substances like chelating agents that could have prevented micronutrients from precipitation, fixation, oxidation, leaching, and also the addition of these nutrients in the soil. The application of FYM significantly increased the availability of micronutrients due to the decomposition of FYM and the consequent release of micronutrients [20]. The results are well supported by the findings of Ramesh et al. [21] and Gunjal and Chitodkar [22].
The free CaCO3 content of soil phases ranged from 5.23 to 9.00 and 5.73 to 9.25 with a mean of 6.67 and 7.16 during the year 2018–2019 and 2019–2020, respectively, in Kalmandari Tanda-1 MWS. Accumulation of bases, especially Ca2+ and Mg2+ in semi-arid climates, is known to favor the calcification process leading to the accumulation of free lime in the soil. The higher accumulation of free lime in soils was due to their base-rich parent materials [23].
The CEC of soil series of soil phases ranged from 28.53 to 35.70 Cmol(p+) kg−1 and 29.29 to 36.45 Cmol(p+) kg−1 with a mean of 33.15 Cmol(p+) kg−1 and 33.90 Cmol(p+) kg−1 in Kalmandari Tanda-1 MWS, respectively in the year 2018–2019 and 2019–2020. Increased CEC below 15 cm from site year-1 (2018–2019) to site year-2 (2019–2020) was due to increased Ca, Mg, and Na concentrations [24]. This is due to the accumulation of clay and the presence of a greater extent of the expanding type of clay [25,26].
The variation in the exchangeable sodium percentage (ESP) due to Na and CEC was greatly influenced by factors such as the type of minerals, concentration of electrolytes, and status of soluble cations in the soil. The findings are in accordance with the works of Srinath [27].
It was observed that the soil parameters, such as soil OC with N, Mg with Ca, ESP with Na, and CEC with Mn and K2O, showed a significant, high positive association (p < 0.01) during both site years. The mixing roots and shoots of pigeon peas in soils have increased the formation of free micro-aggregates and improved OC and N stabilization and mineralization in the semi-arid agro ecosystem [28]. Similarly, a significant moderate positive association (p < 0.05) was observed among soil OC and N with Cu, Mn and CEC, and Zn with Fe (p < 0.05). Higher CEC usually indicates the presence of more clay and organic matter in the soil. Organic molecules produced hold and protect micronutrients. Available P2O5 has a significant moderate negative association (p < 0.05) with Na in two site years. A similar trend of association between soil parameters in both the site years (Table 3 and Table 4) indicates their resistance to change.

6. Spatial Dependency of Soil Fertility Parameters of Kalmandari Tanda-1 MWS

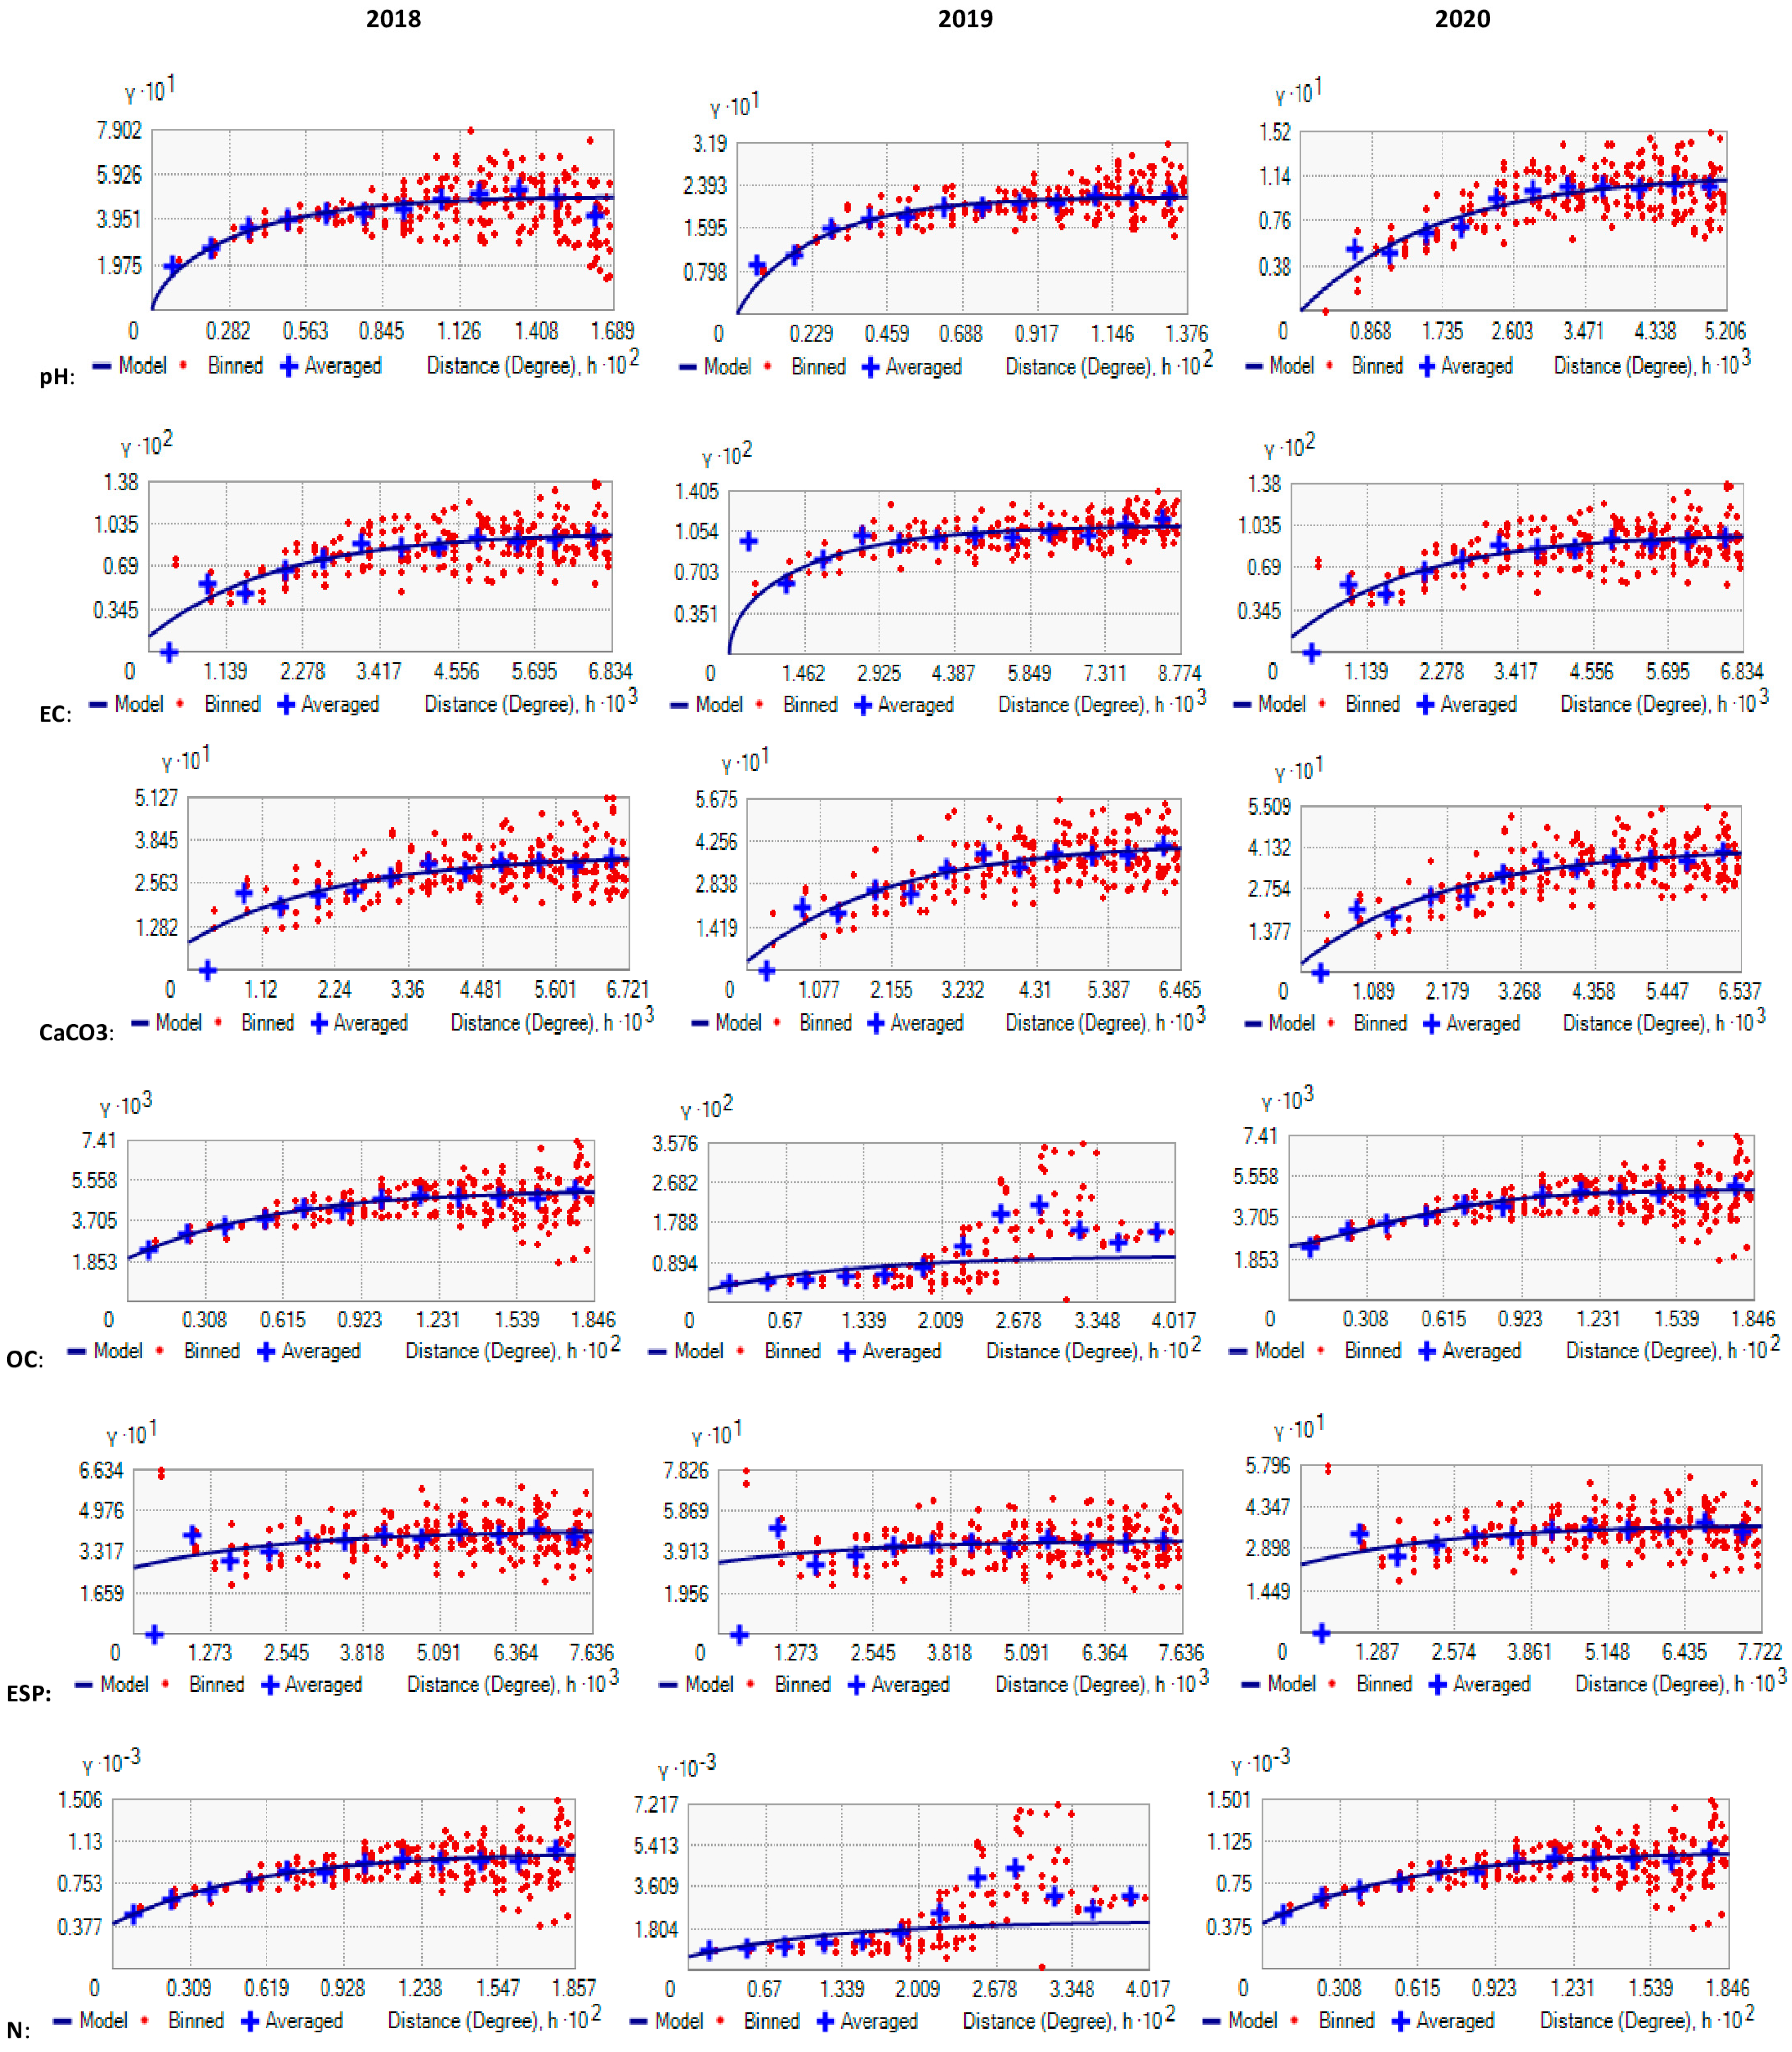
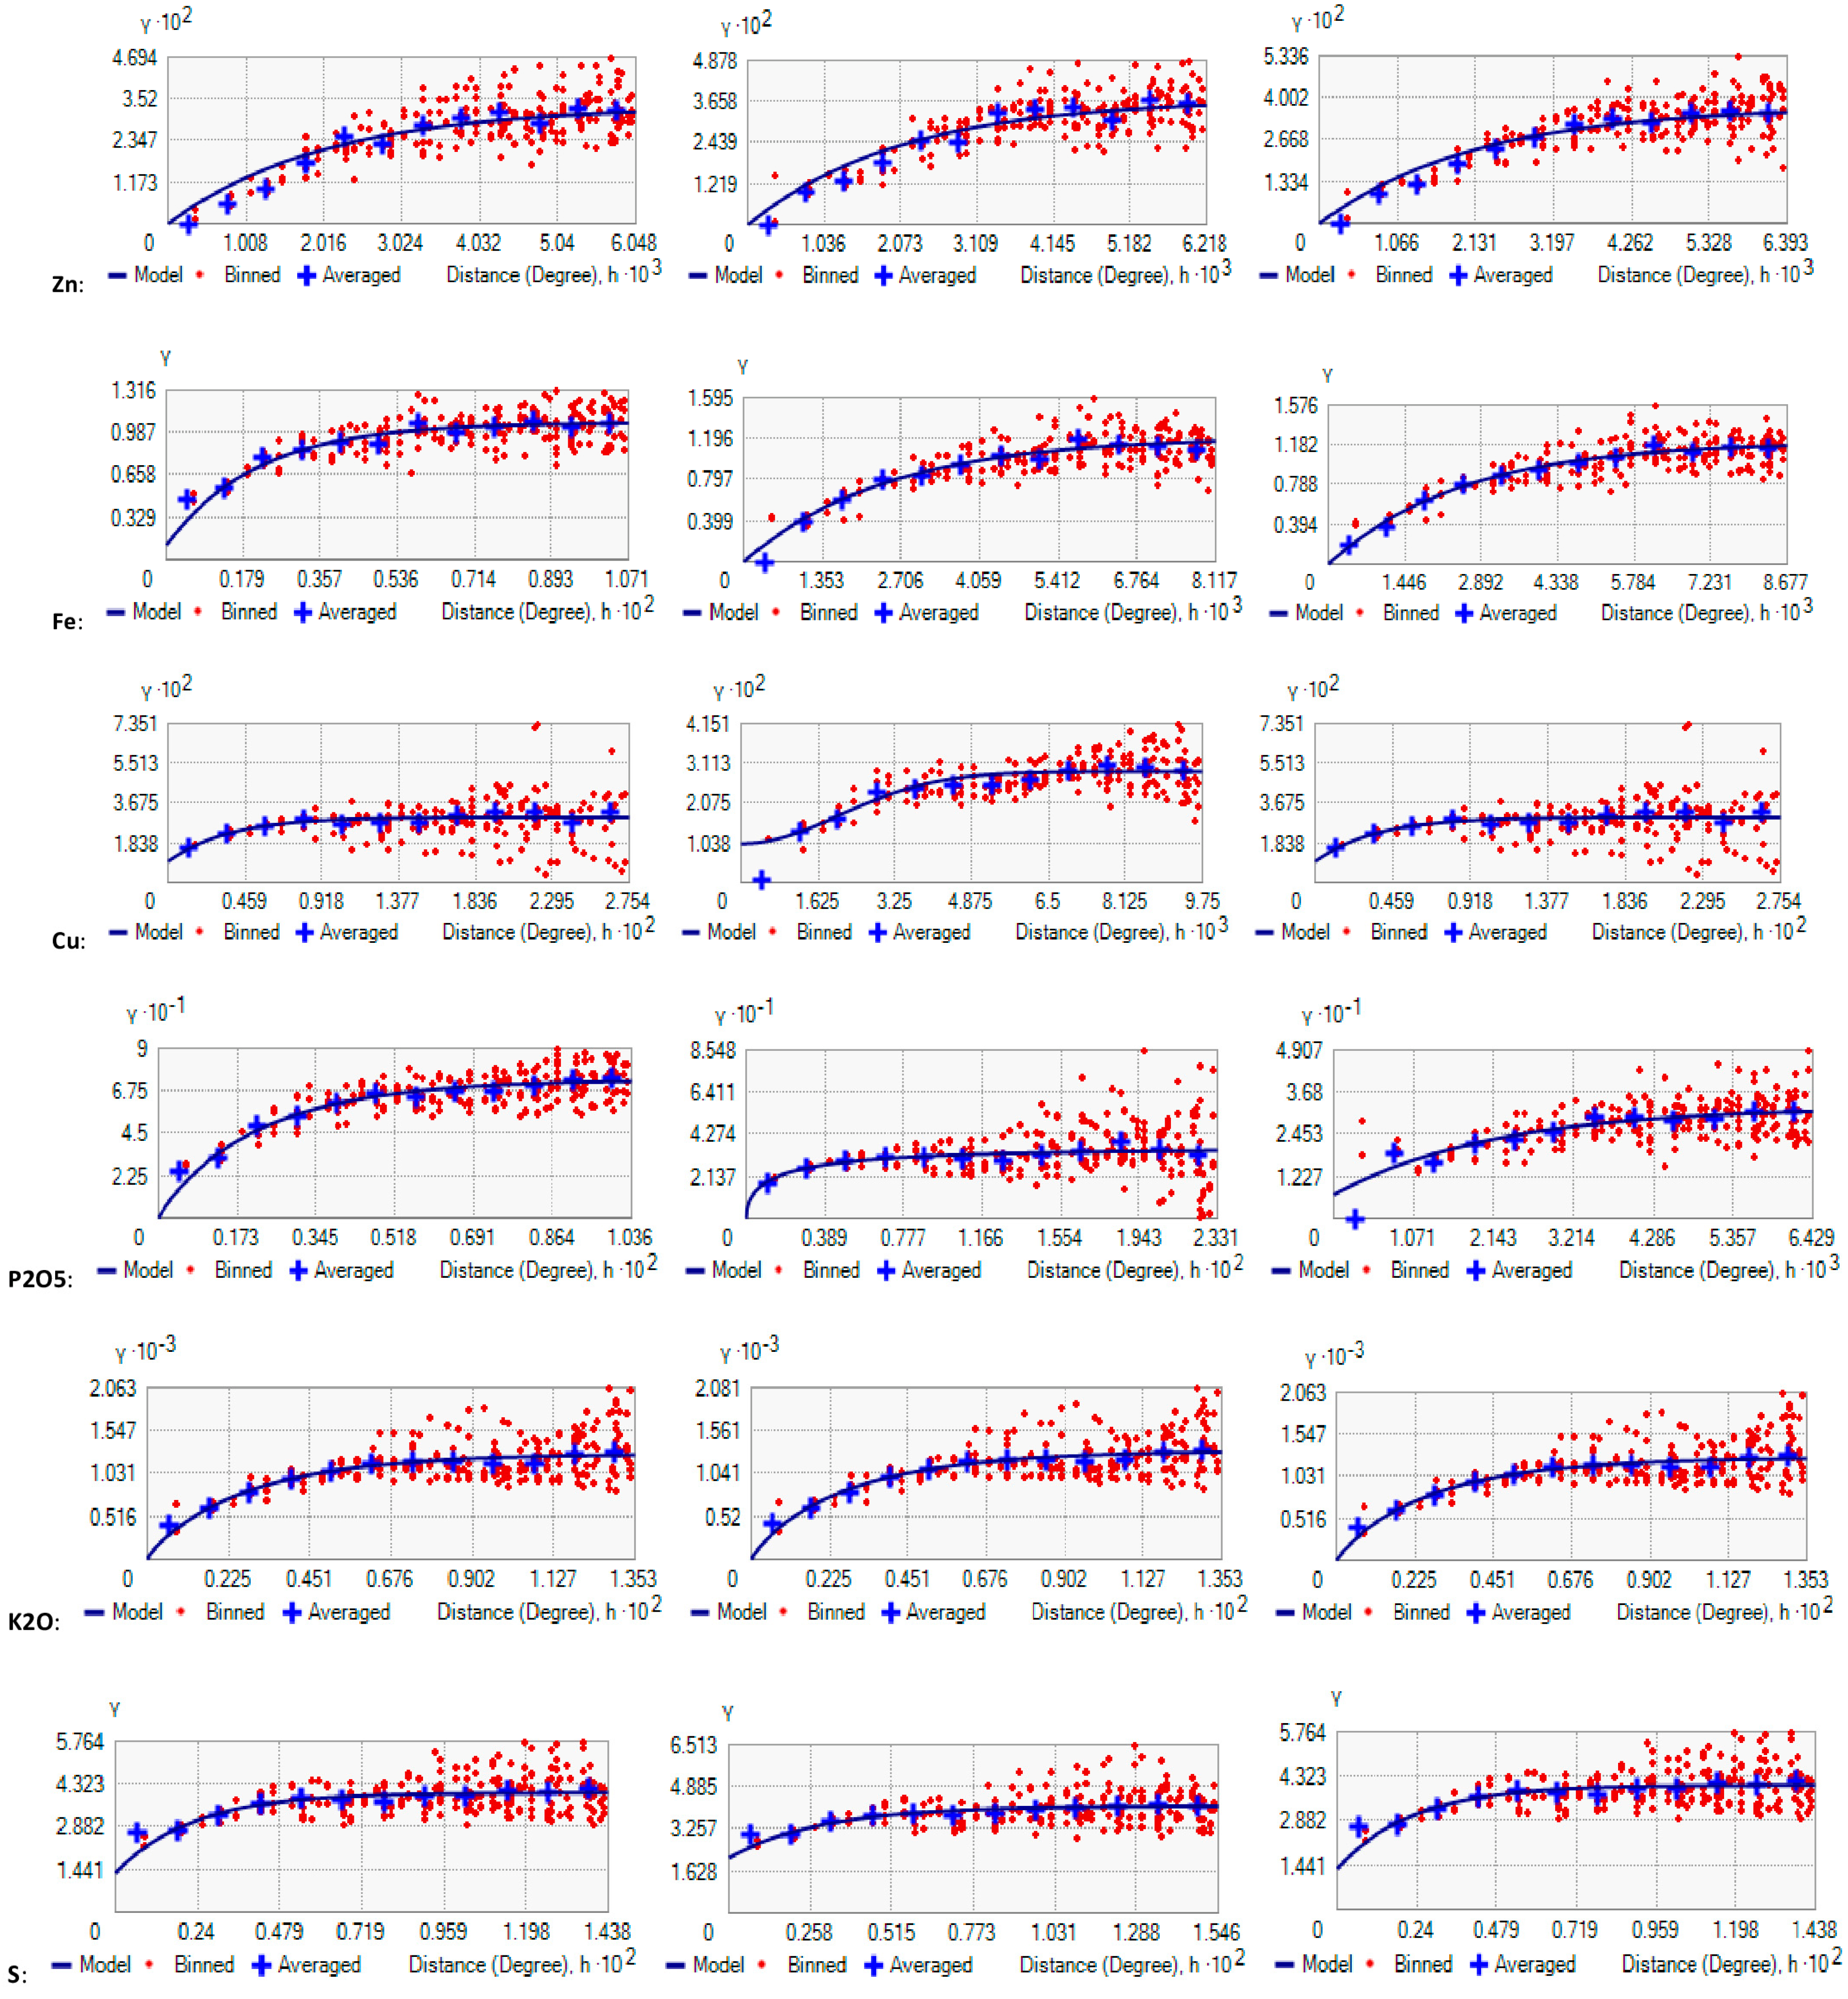
The data pertaining to semivariogram parameters of soil fertility of Kalmandari Tanda-1 MWSs for the years 2018, 2019, and 2020 are presented in Table 5, Table 6 and Table 7, respectively. Different semivariogram models were tested to the empirical semivariogram model (Figure 5 and Figure 6) to best fit various soil fertility parameters. All soil parameters were characterized by using models dependent on the distance function. Analysis of the variogram indicated that most of the soil parameters’(site year 1 and site year 2) semivariograms were well described with the exponential model, except for pH, available K, and exchangeable Ca and Mg, which were best fitted to K-Bessel model for the soil samples collected in June 2018. Available P was a best fitted to Stable model. Nugget (C0) usually expresses the variations caused by experimental error or a smaller sampling scale. Available N had bigger C0 = 399.96, 586.33, and 402.21 during 2018, 2019, and 2020, respectively. The initial very high variance at zero distance in available N induced by the application of high contributions of N fertilizer, namely Urea and DAP at the rate of 25 kg ha−1 and 50 kg ha−1, respectively, in addition to the biological N fixed by Rhizobium of pigeon pea root nodules. High variance in the soil available N at zero distance was also contributed by the addition of FYM and leaf shedding of pigeon peas.
Soil OC showed a maximum range of 19,060.798 m and 4458.93 in June 2018 and June 2019, respectively. Exchangeable Mg had 3320.28 m as the maximum range in 2020. Soil EC showed the lowest range in June 2018 (635.43) and January 2020 (446.89), whereas Cu (562.01)showed the lowest range in June 2019. This shows the maximum variance at a closer distance, and further, there will not be any spatial autocorrelation after this minimum distance. The variance becomes constant among the observed soil variables.
The Nugget–Sill (spatial dependency) higher ratio indicates that the spatial variability is primarily caused by stochastic factors, such as fertilization, farming measures, cropping systems, and other human activities. The lower ratio suggests that structural factors, such as climate, parent material, topography, soil properties, and other natural factors, play a significant role in spatial variability. The values of <0.25, 0.25–0.75, and >0.75 show strong, moderate, and weak spatial autocorrelation in soil properties, respectively. The spatial dependency for the soil OC, available N, S, and Cu was moderate, with nugget–sill ratios– of 0.385, 0.385, 0.328, and 0.324, respectively, in June 2018. Similarly, available N (0272), S (0.517), Cu (0.353), and B (0.500) were moderate in spatial dependence in January 2019, whereas ESP (0.760)showed weak spatial dependency in January 2019.Soil OC (0.385), available N (0.385), S (0.328), Cu (0.324), and ESP (0.628) had moderate spatial dependency in January 2020.The moderate spatial dependence of these soil parameters may be due to the fact that the variability was controlled by both external factors (fertilization and mono-cropping system of pigeon peas) and internal factors (climate, parent material, topography, soil type)that contributed to the variation. Similar results were also reported by Rakesh and Kunal [3]. In both years, the standardized root mean square error (RMSE) was close to one; hence the selected model was best fitted. ESP has exhibited the variance at distance zero [Nugget (C0) = 0.342] almost the same as that of the sill the maximum variance = 0.449. Since ESP is a cause of excess Na accumulation, which is a rare phenomenon in the study area, therefore it reflects a weak spatial dependency.

7. Spatio-Temporal Variability of Soil Fertility of Kalmandari Tanda-1 MWS

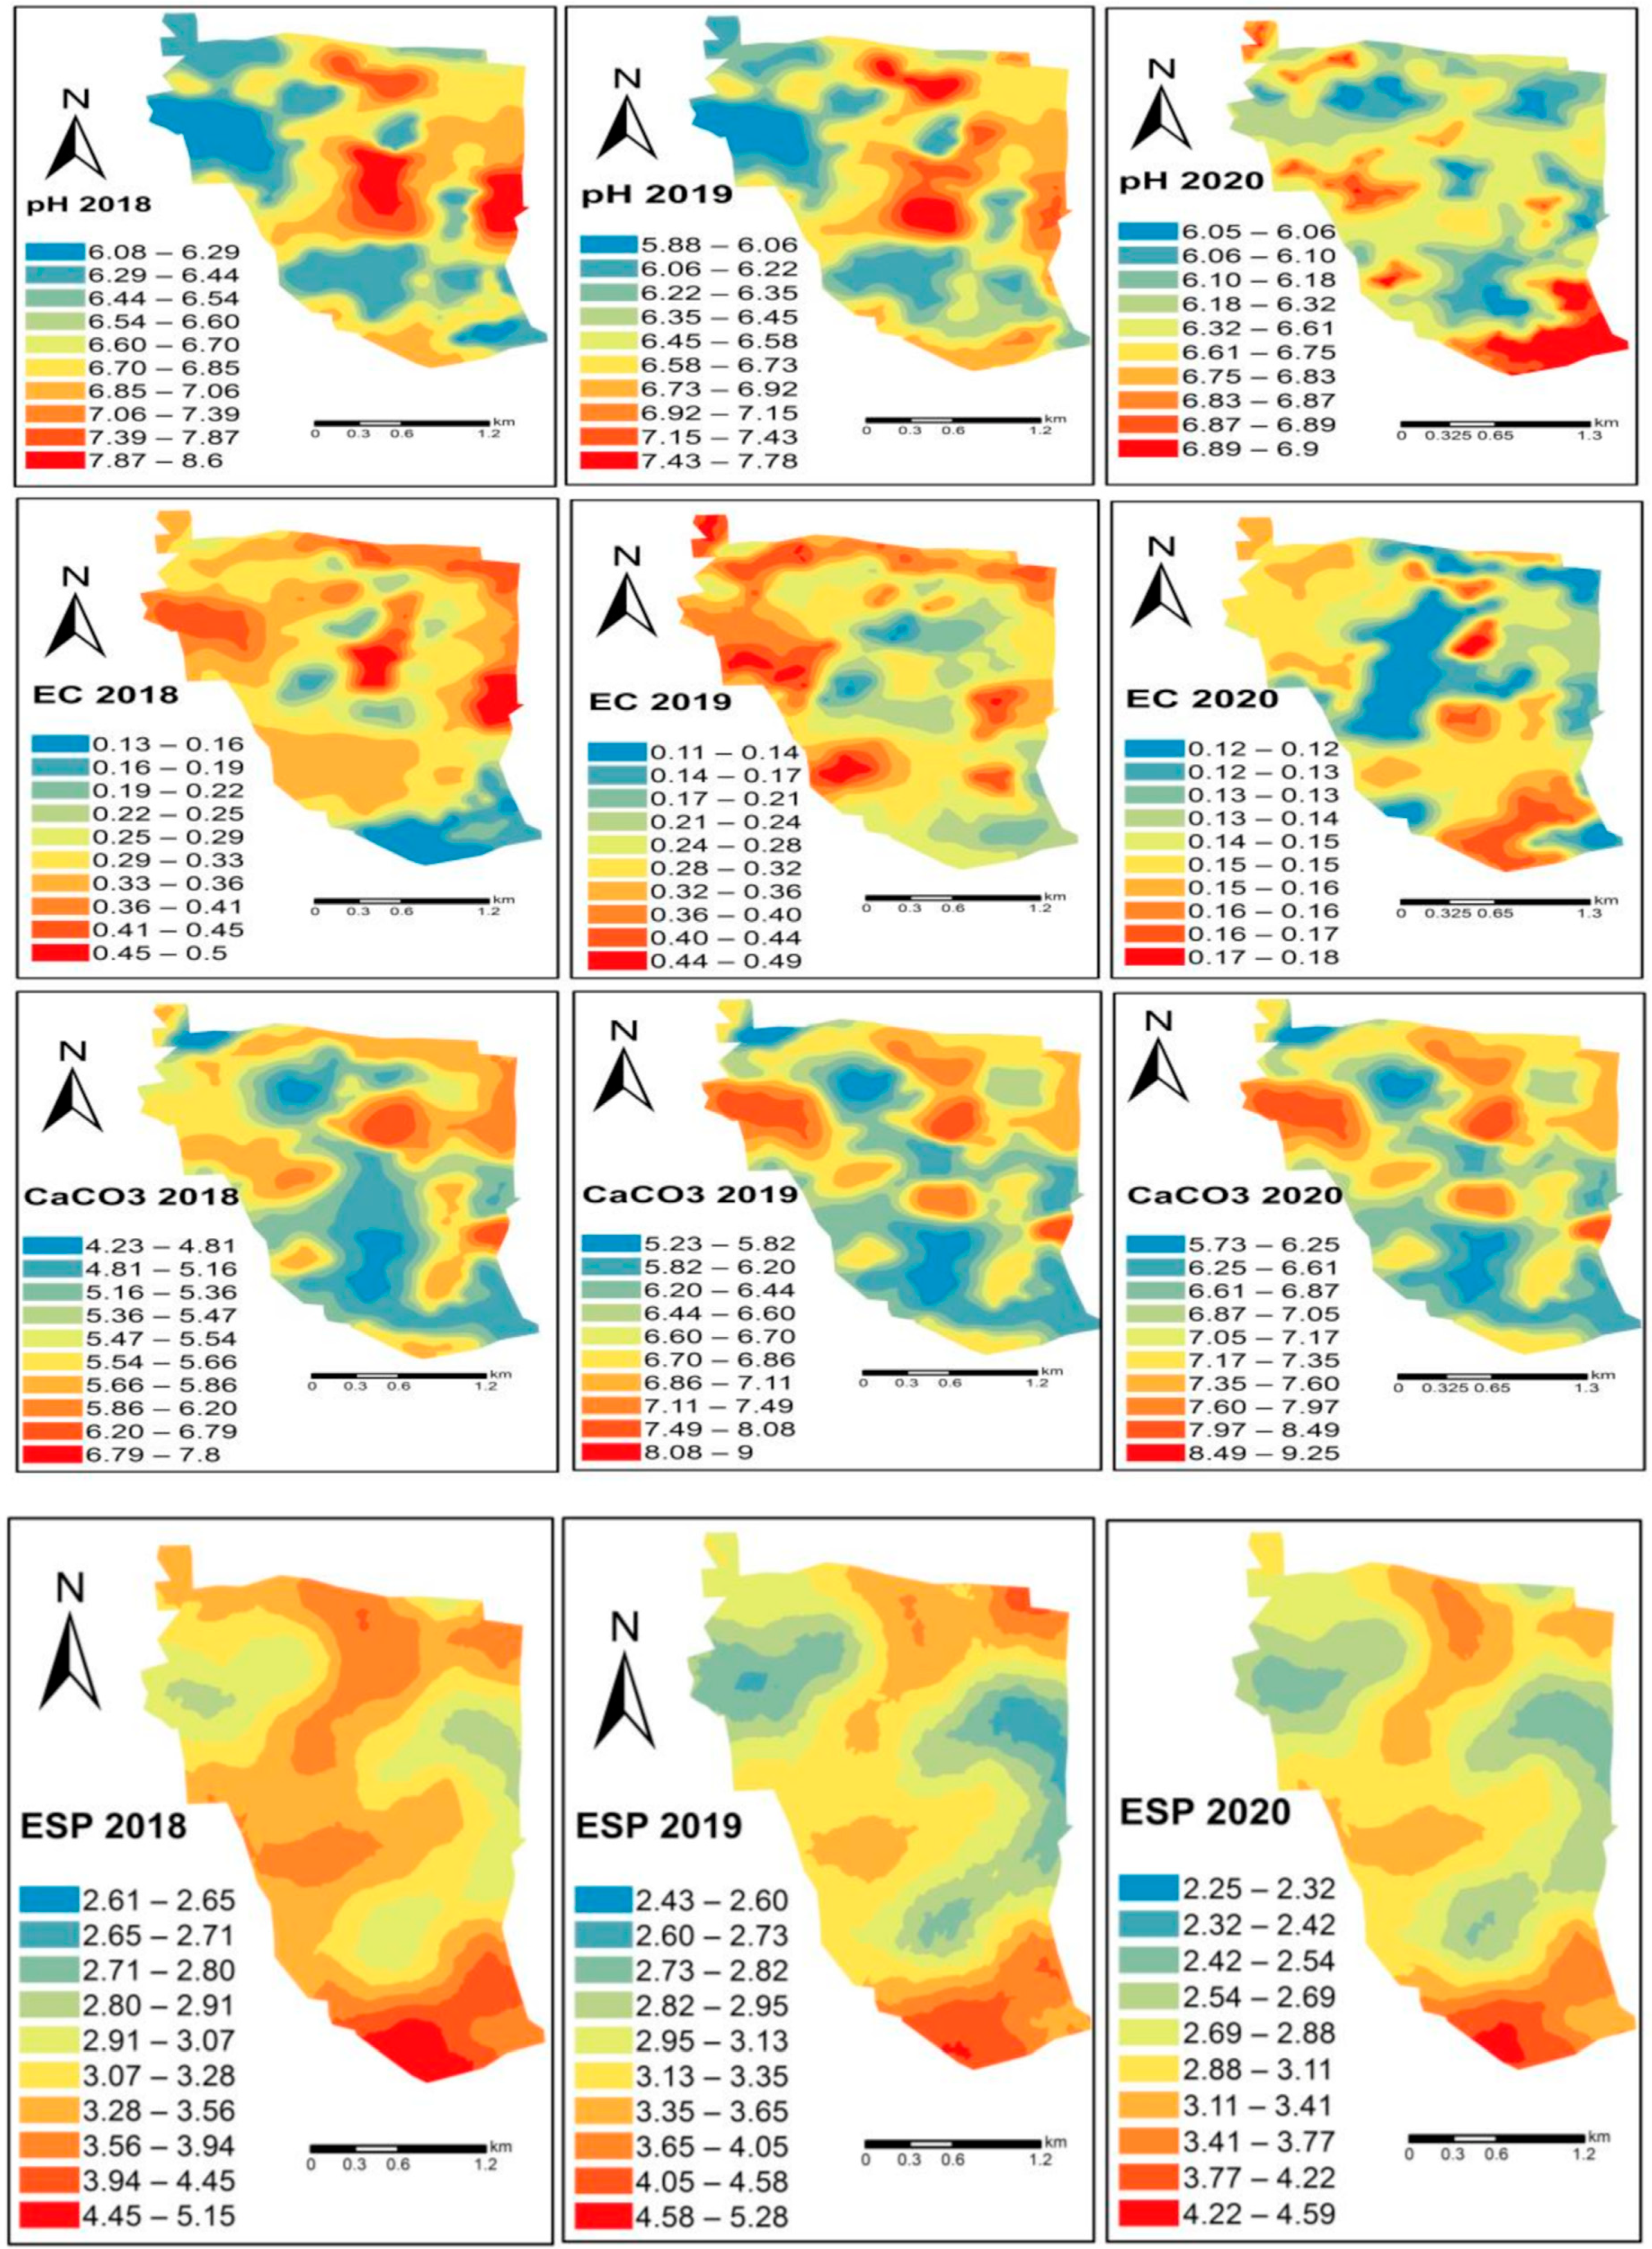
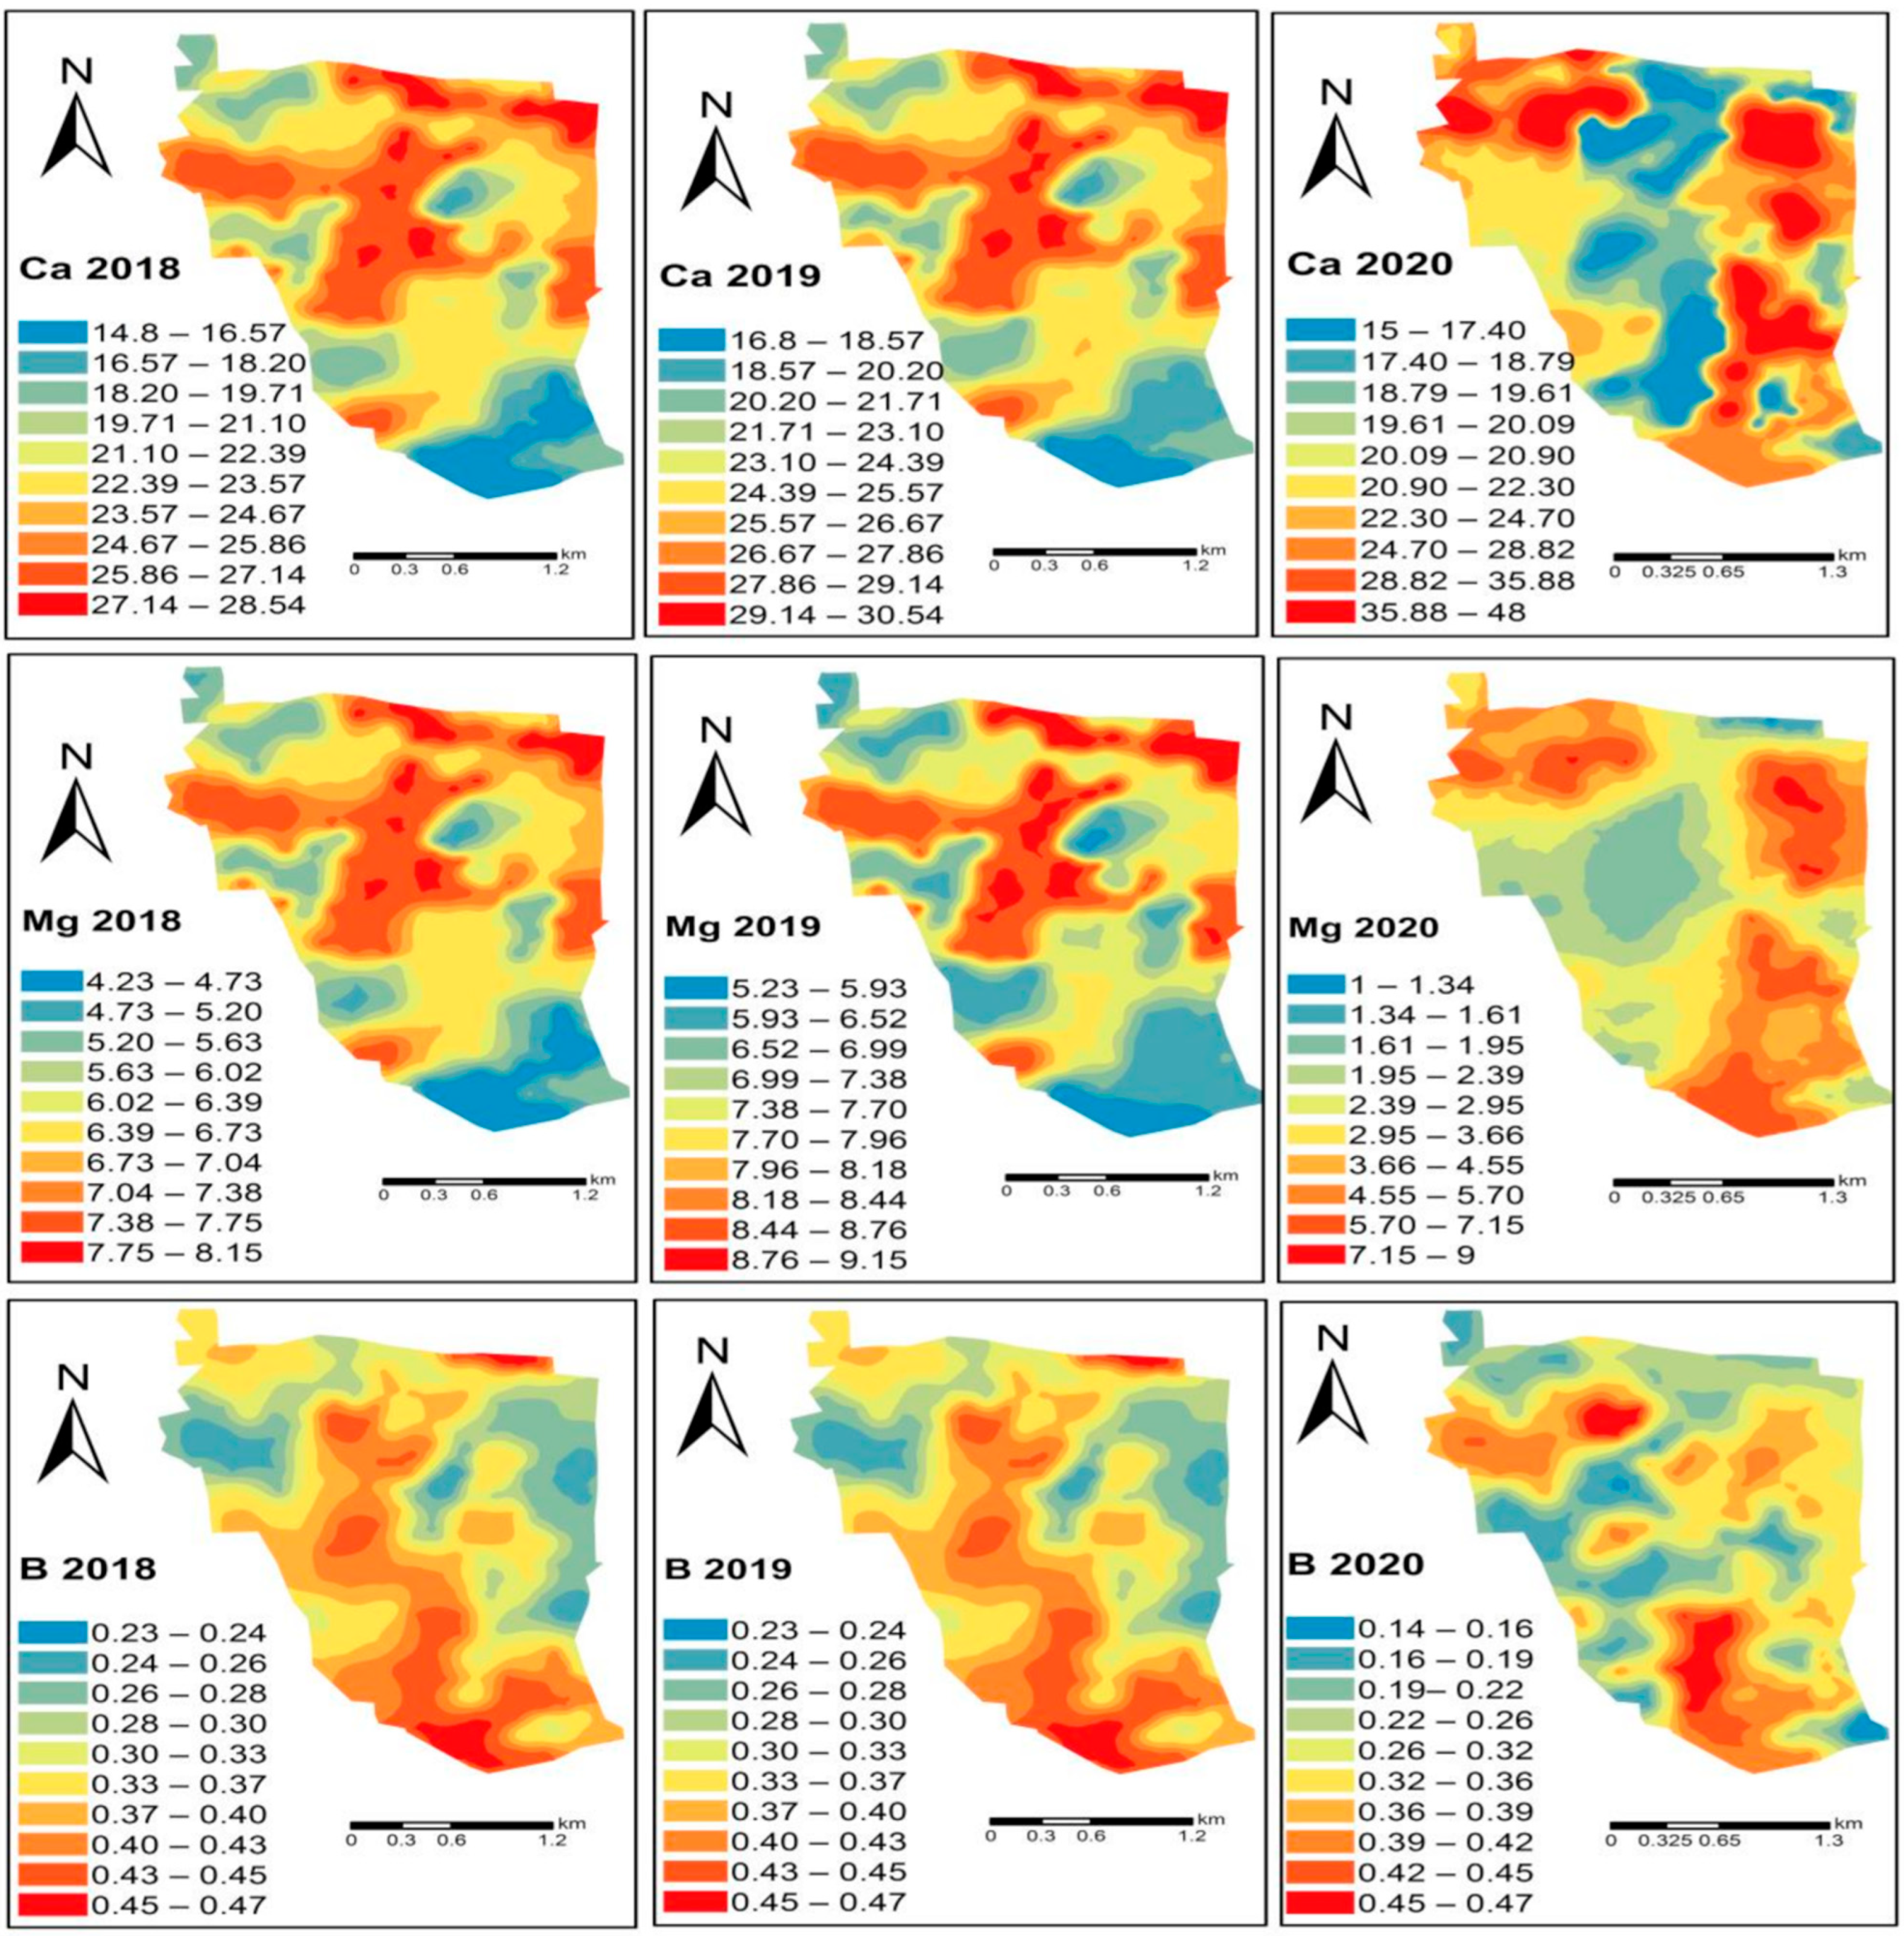
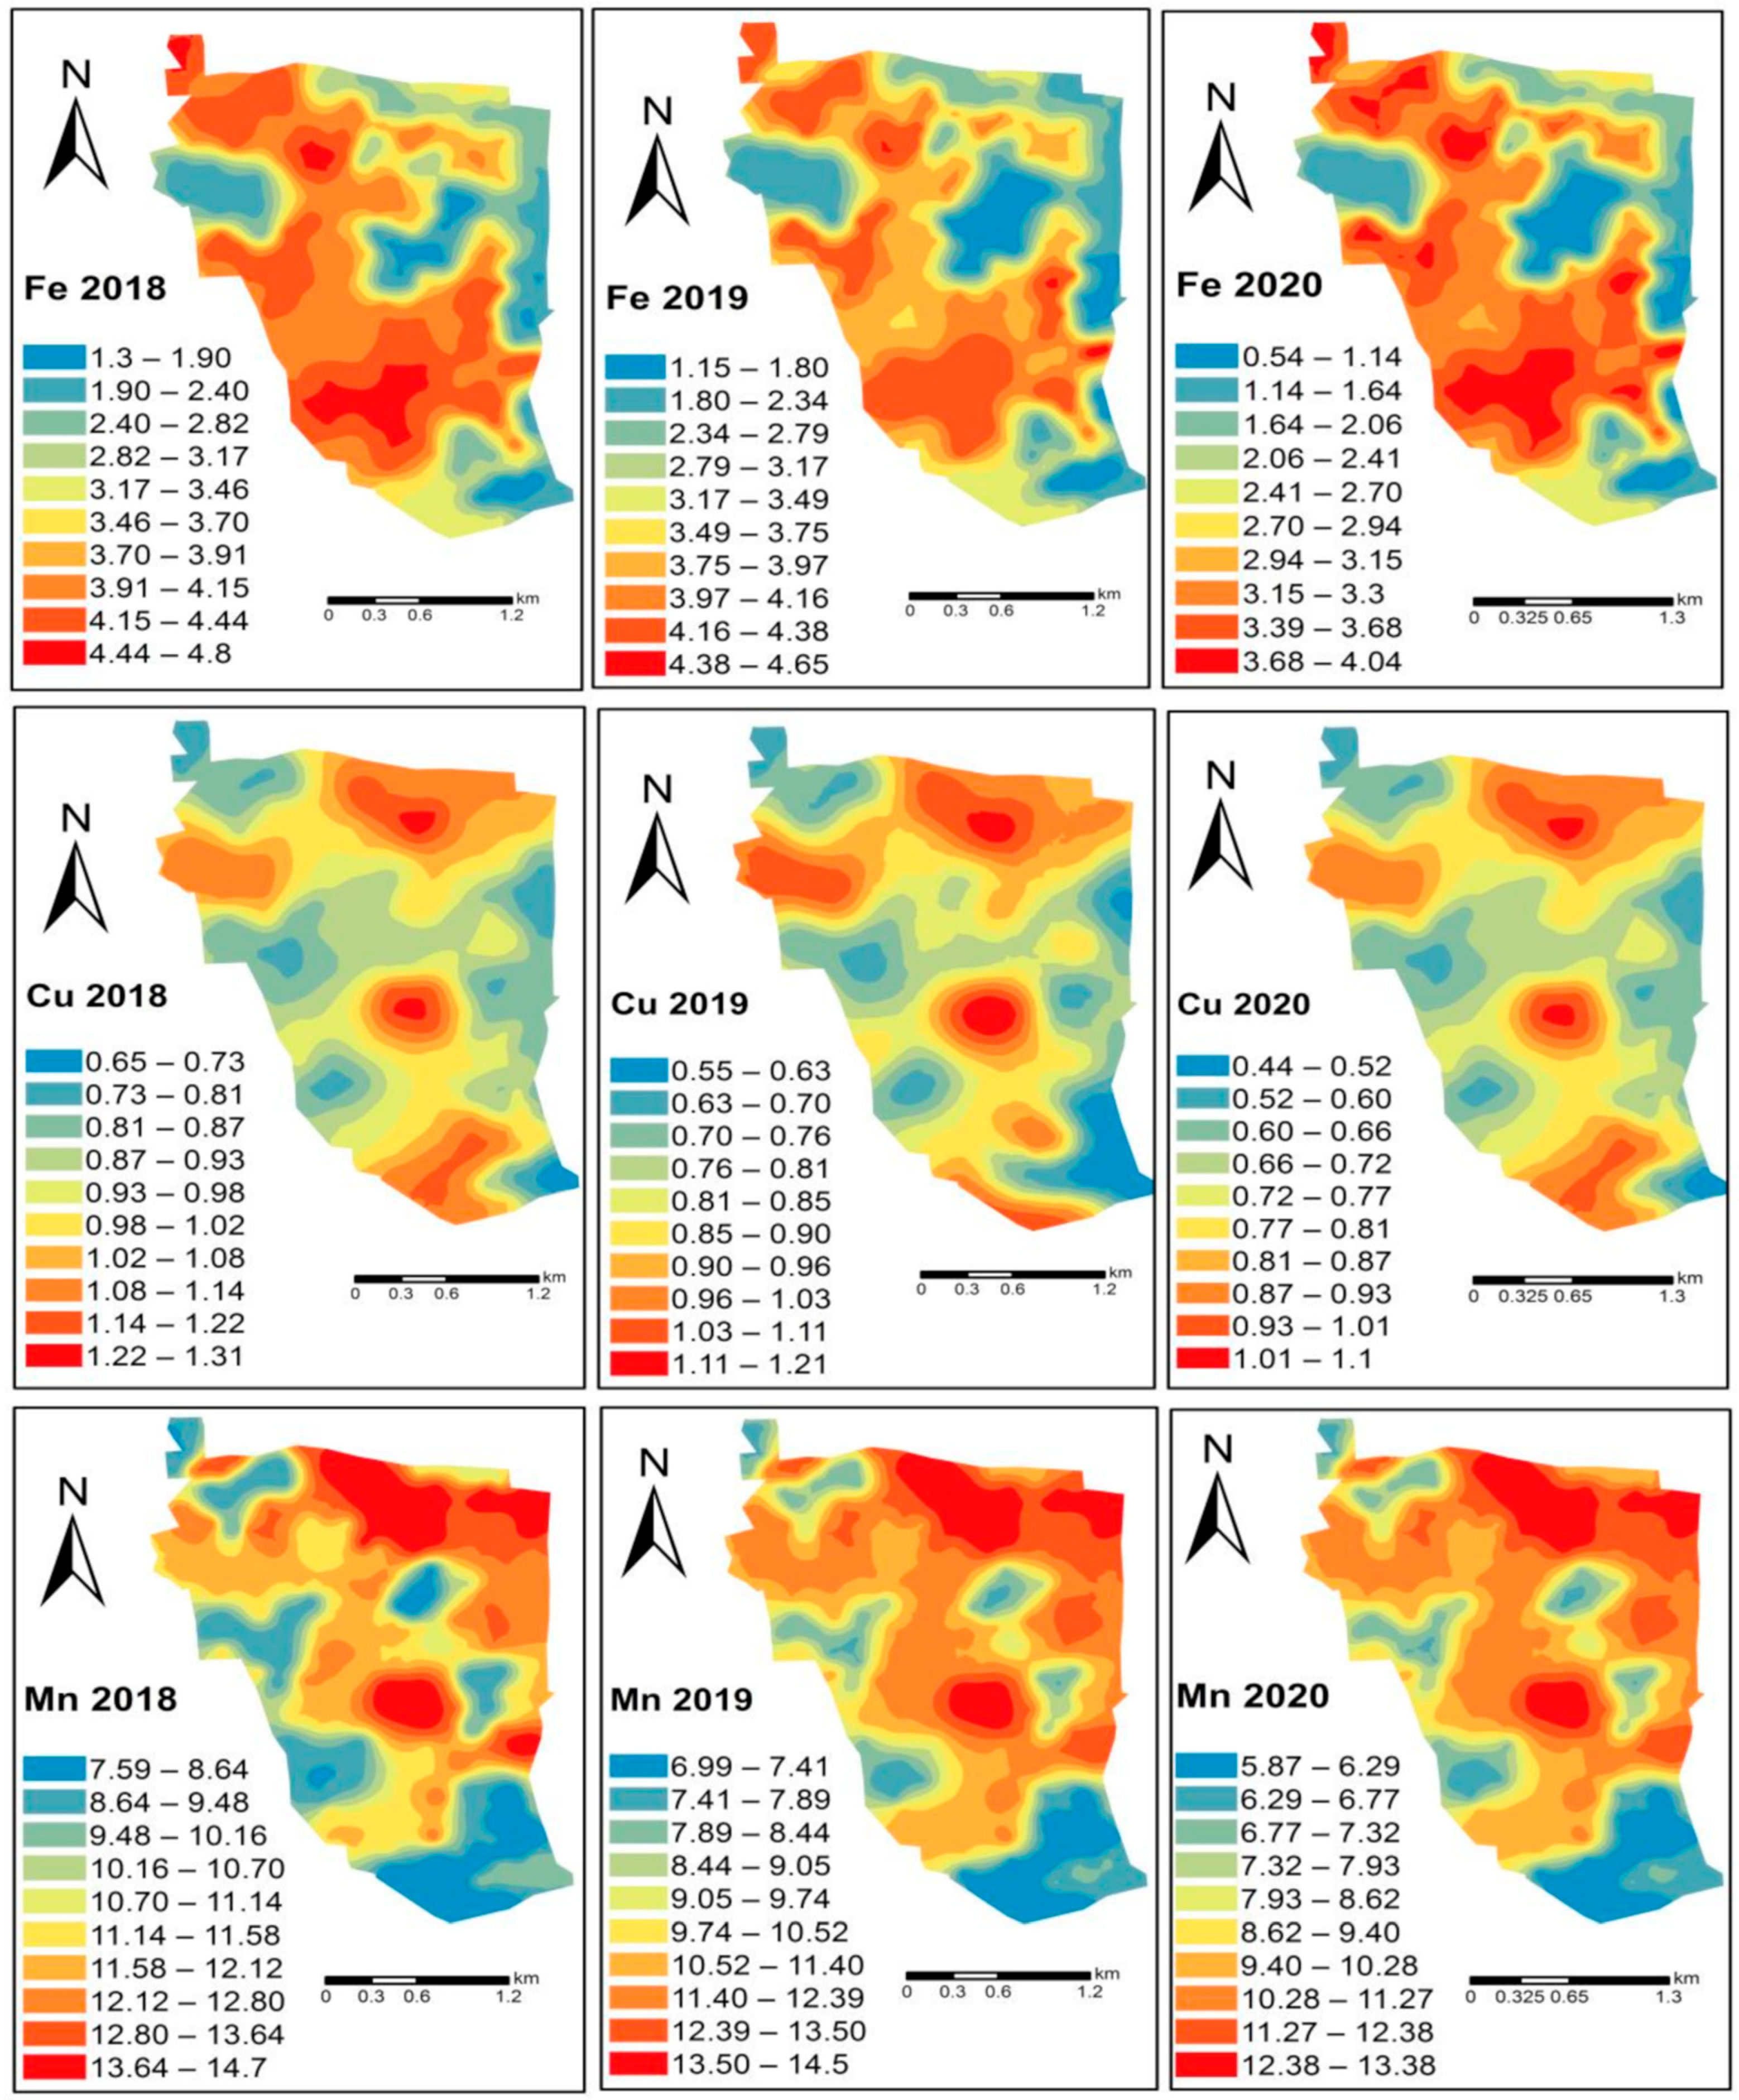
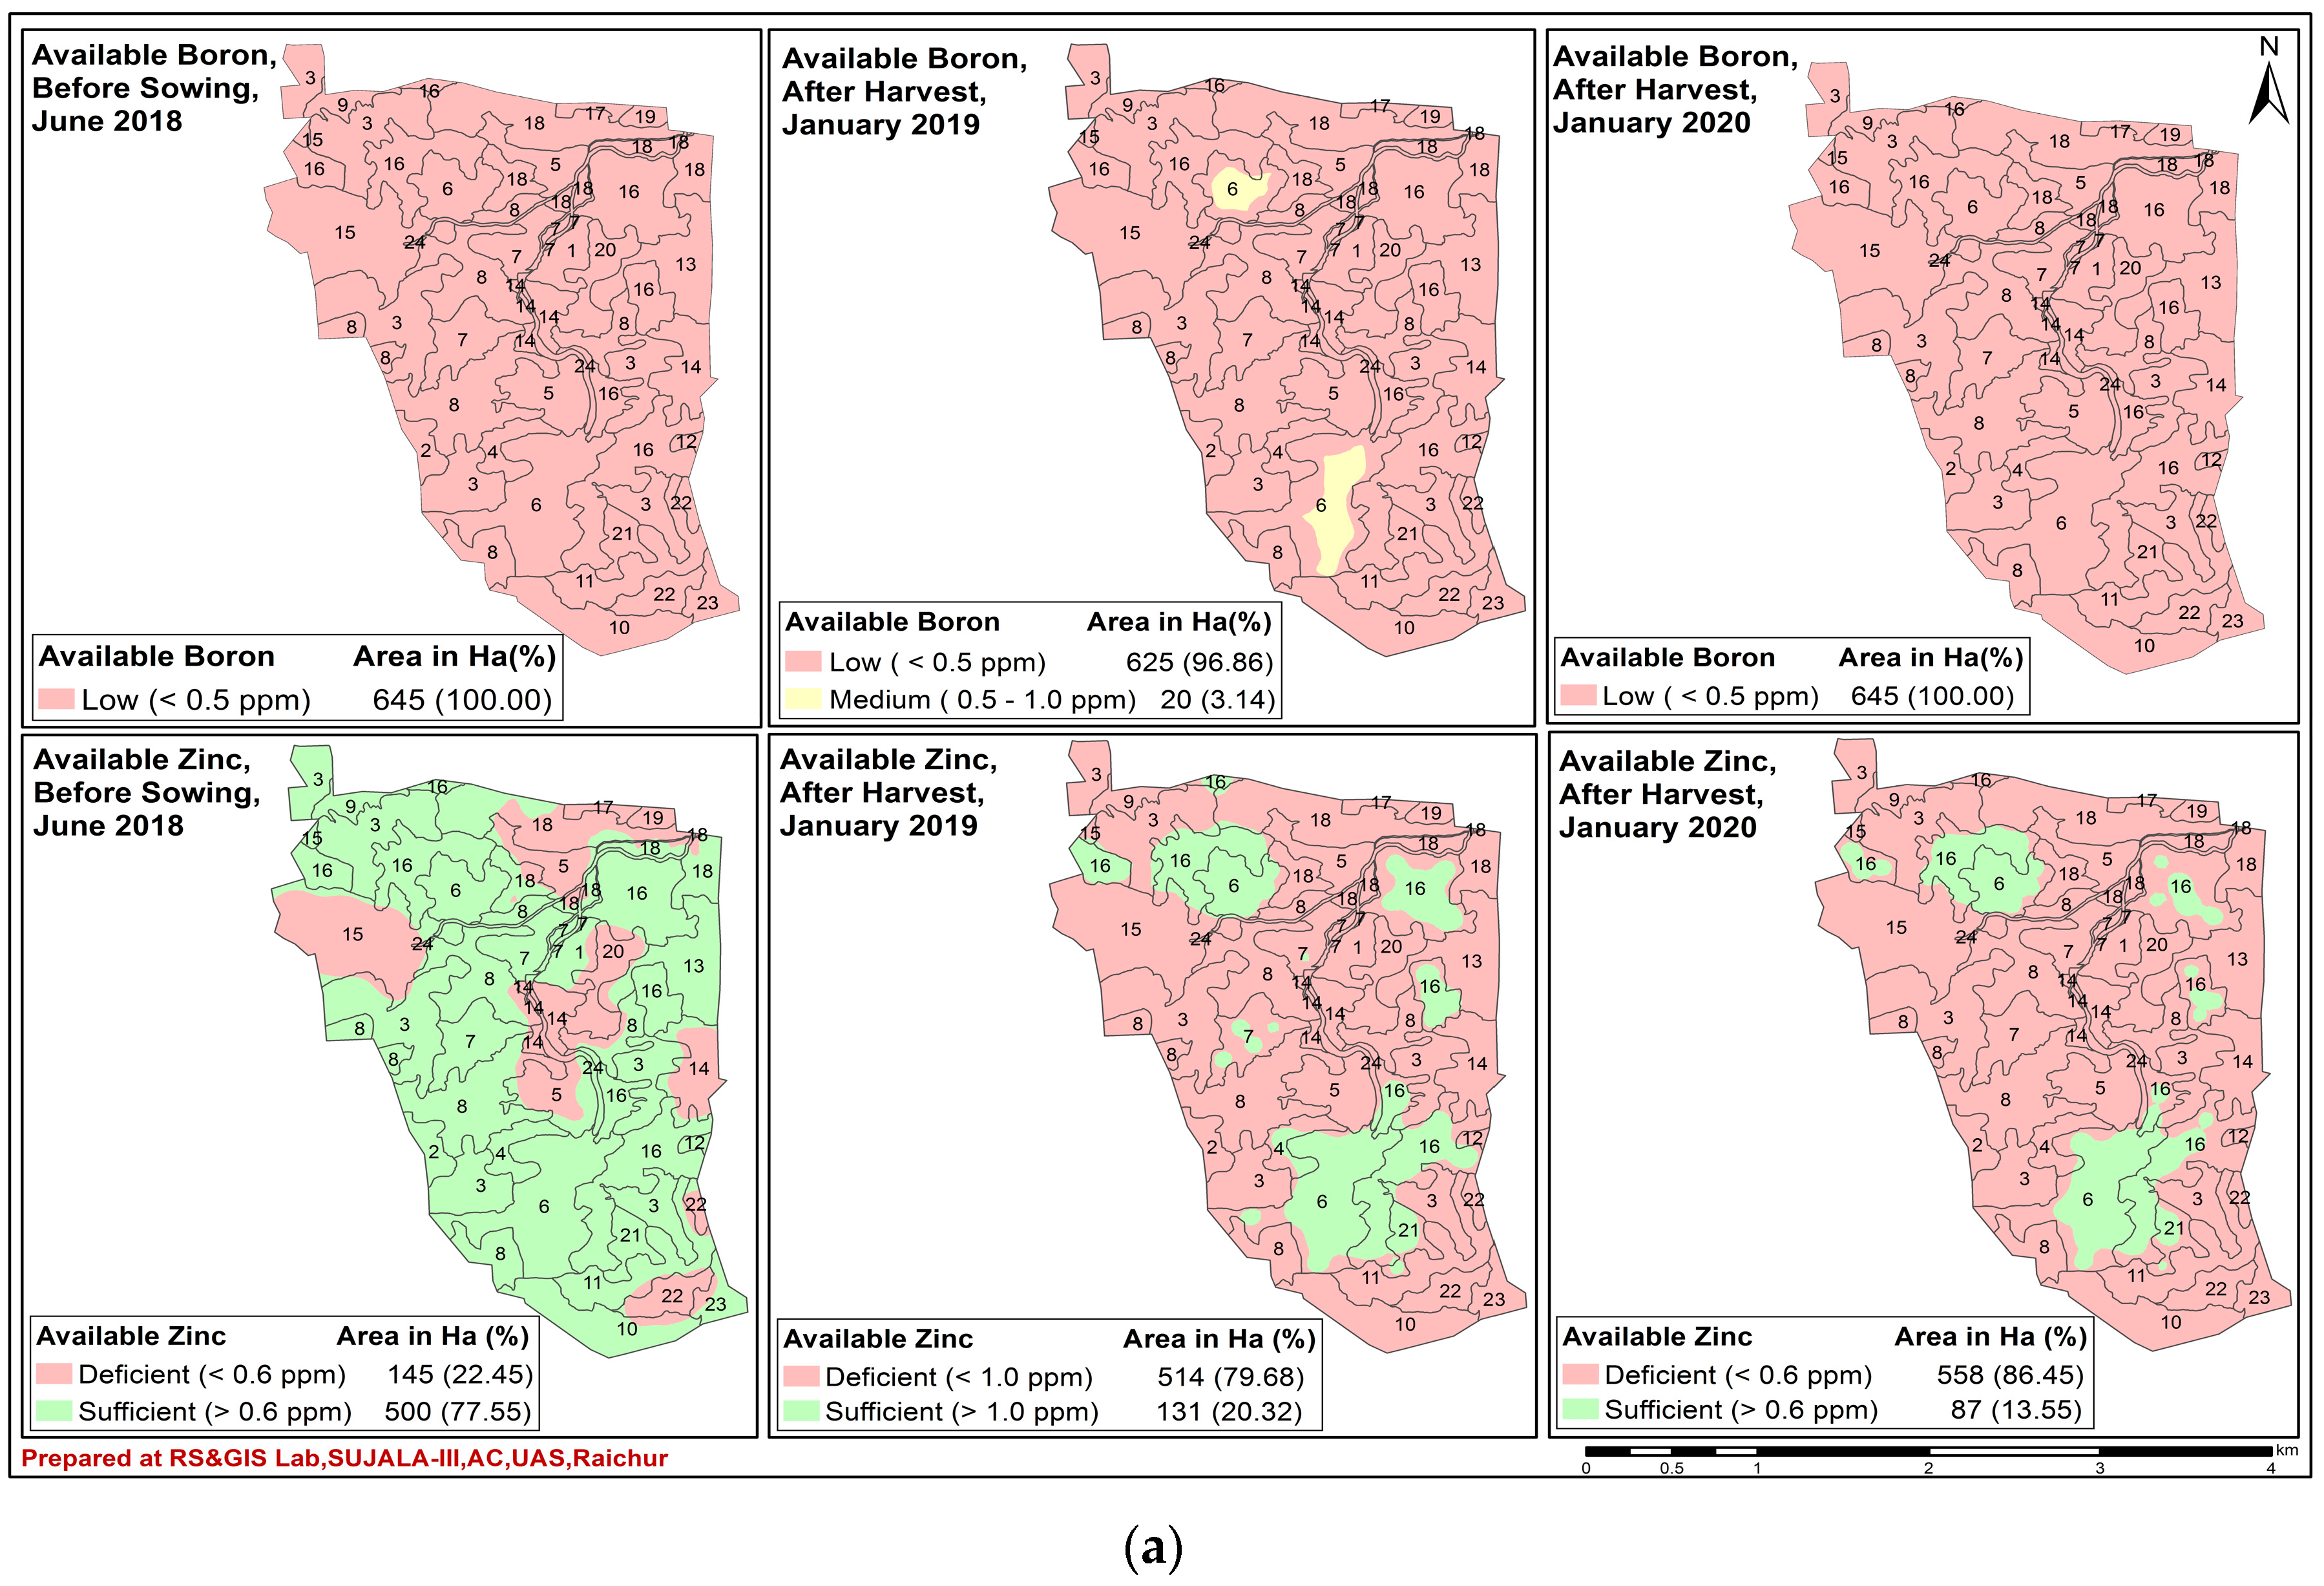
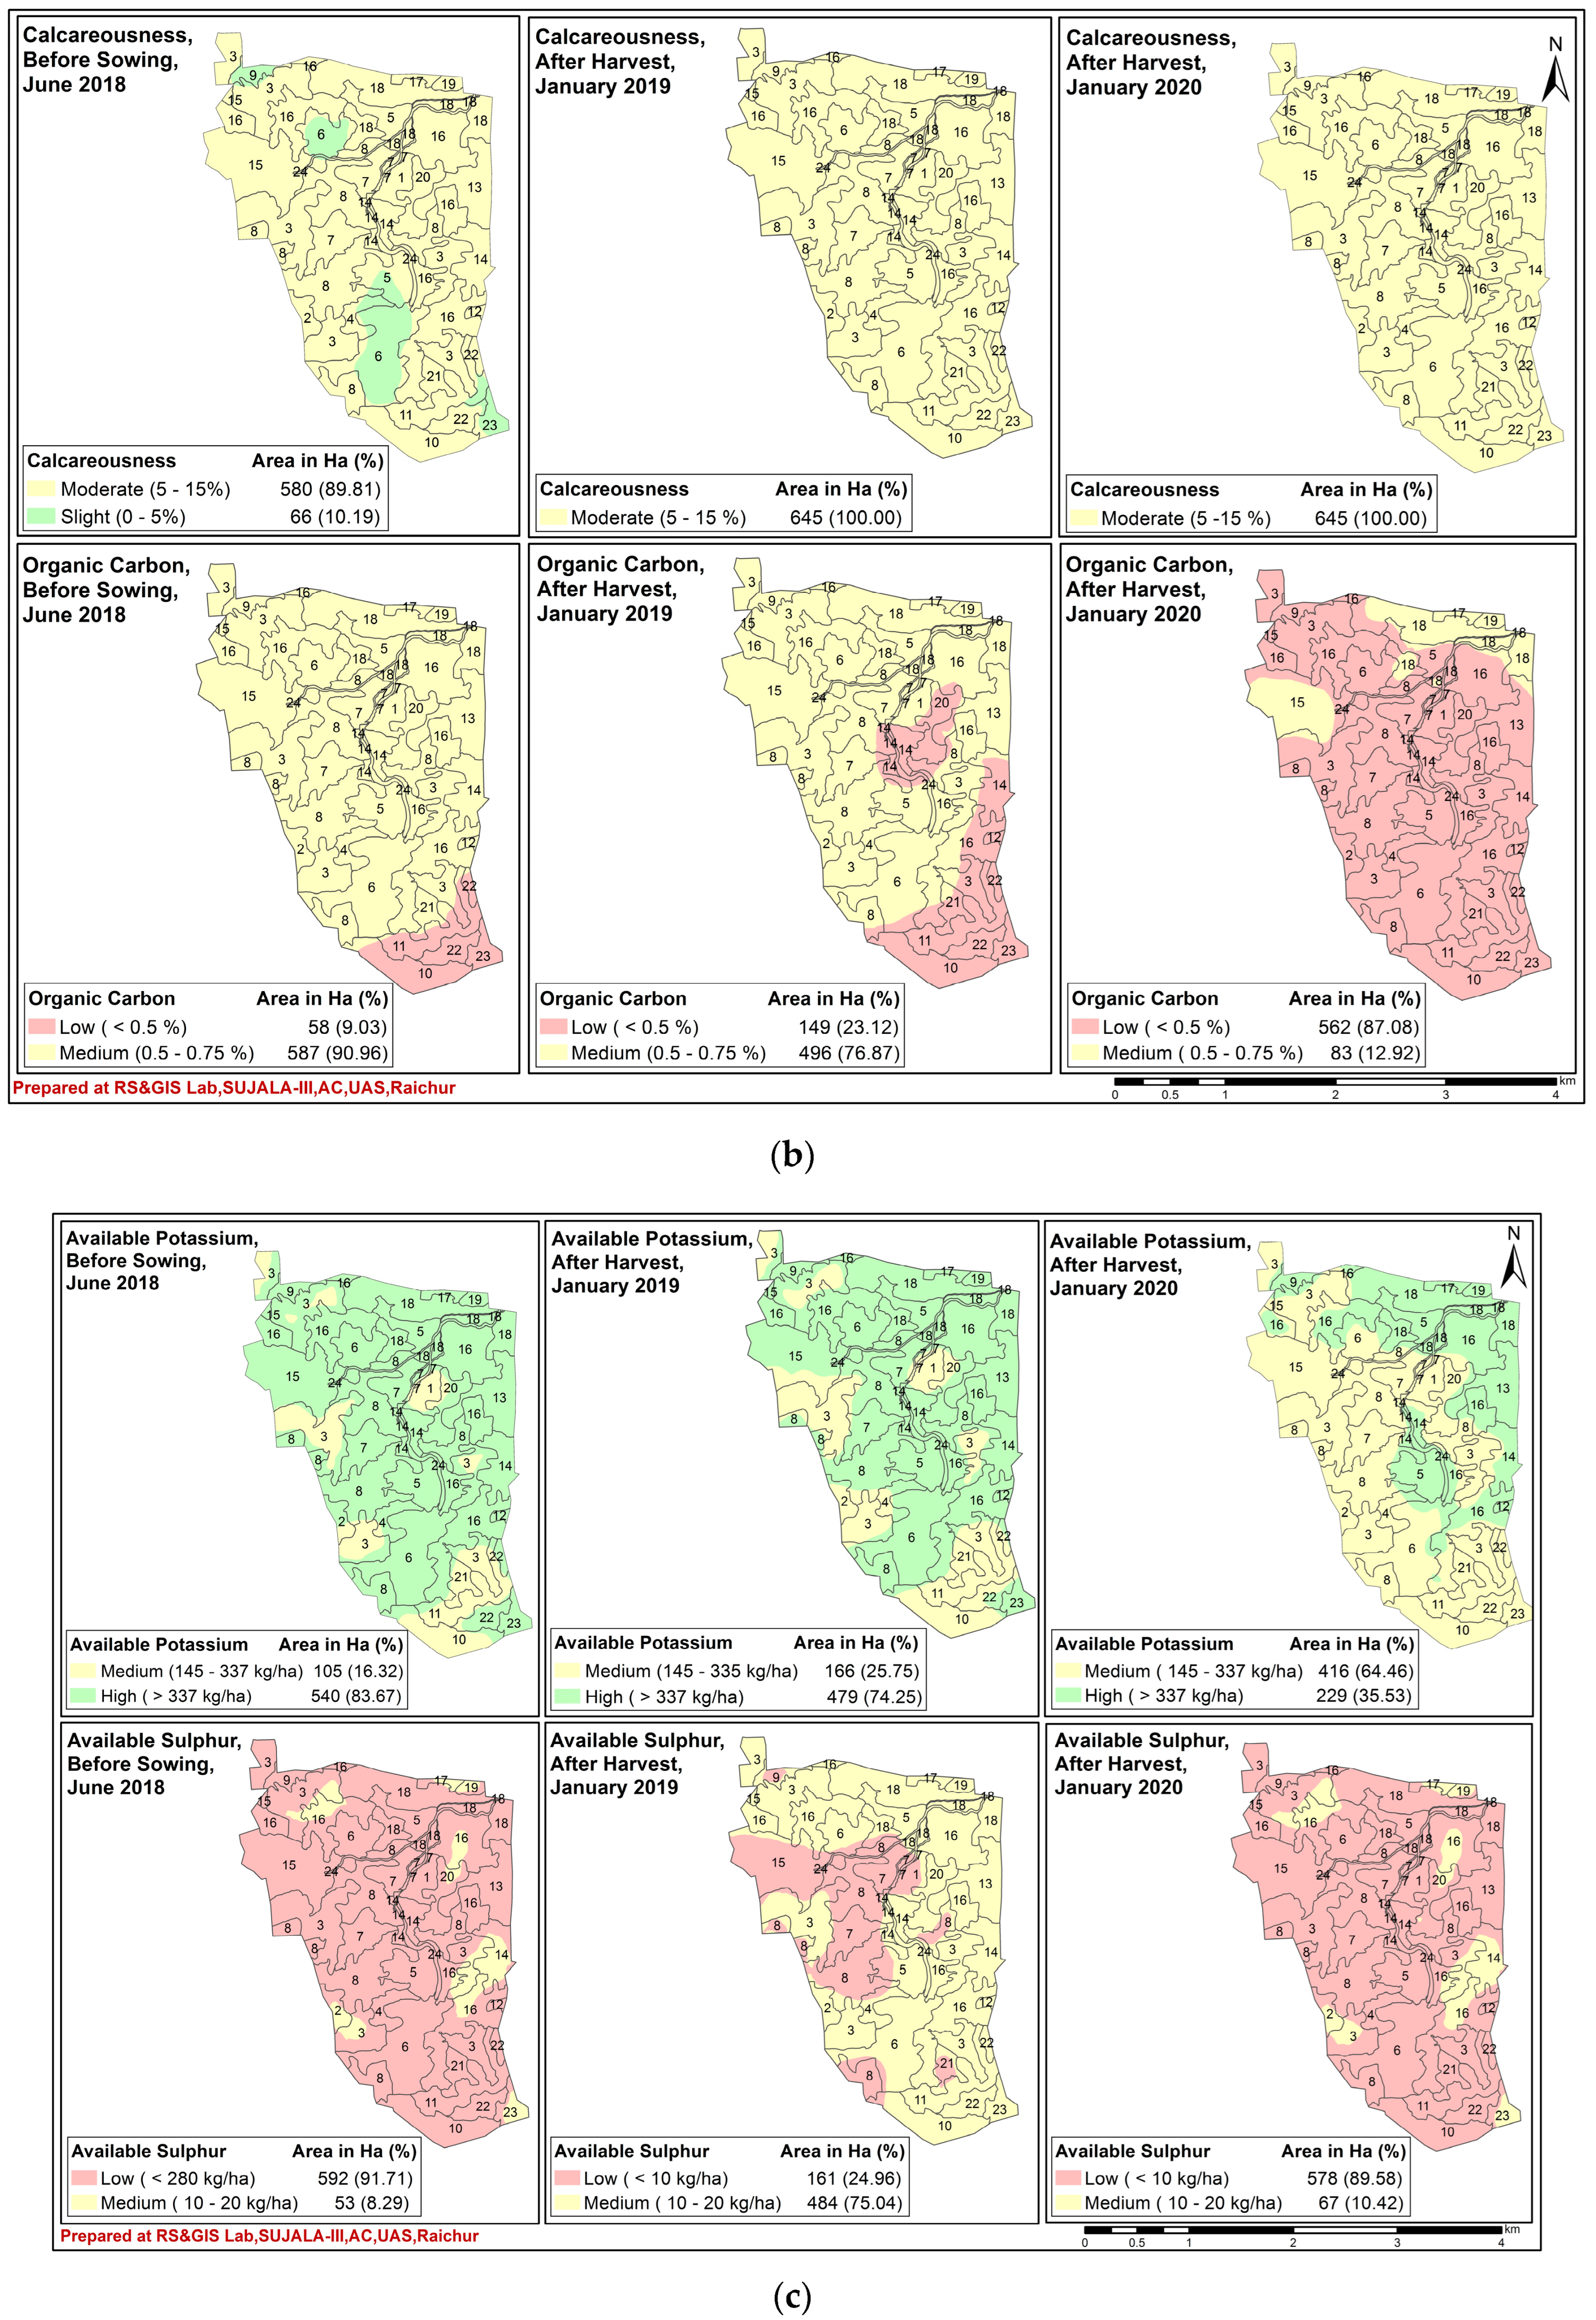
The main application of geostatistics is the estimation and mapping of soil properties at unsampled locations. The original kriged output surface has been exported as vector data for the convenience of presenting actual soil fertility classes (IISS-ICAR, Bhopal) with the corresponding area covered. The prediction maps of soil fertility parameters assessed for three different years (June 2018, January 2019, and January 2020) are presented in Figure 7.
The Kamalpur series (KMPmC2g1) and Bhimanhalli series (BMNmC2g1) soil phases are slightly alkaline (38 ha, 5.87% of total area) and moderate to strongly alkaline (32 ha, 4.96%) nature in June 2018, before the sowing of pigeon pea, and the rest of the phases showed slightly acidic (183 ha, 28.39% including soil phases BHNhB2g1, BHNhC2g1, BMNmC3g1S1, GUTmC3g1, KMPmC3g1, RTGhC2g1S1, and RTGhD3g1S1) to neutral pH (covering 392 ha, 60.77% including soil phases BHNhC2, GUTmB2g1, GUTmC2g1, KKThE3g1S1, KKThF3g1S1, KMPmB2, KMPmC2, MRGmC2g1, MRGmC3g1, MRGmC3g1S1, RTGhC2, RTGhC2g1). The initial alkalinity may be due to the accumulation of bases during the prolonged dry spell from previous years and the nature of basic basalt parent material. The gradual decline in the alkalinity in 2019 and 2020 may be due to the application of acidic fertilizer. Additionally, adequate rainfall might have helped in decomposing the litters of pigeon peas which releases organic acids to reduce the soil pH. Soil EC (Non-saline), ESP (Non-alkaline), available P2O5 (medium), Fe (deficient), Mn (sufficient), Cu (sufficient), exchangeable Ca (sufficient), and Mg (sufficient)have shown a similar trend in both site years 1 and 2 as that of before sowing to corresponding soil parameters. Since the Fe uptake by pigeon pea stover is more (Table 8) and has no external application to soil, hence Fe is found deficient. Therefore, it may be recommended the application of FeSO4 @ 10 kg ha−1 for rainfed areas.
Soil OC in phases of Kurkota series (KKThE3g1S1 and KKThF3g1S1), Ratnagutti series (RTGhC2g1S1and RTGhD3g1S1) showed low (58 ha, 0.03% of total area), whereas the rest of the soil phases had medium soil OC in June 2018. Further, it has shown a temporally declining trend in both site years 1 & 2. This may be due to water erosion caused by heavy rain. The available N showed a declining trend temporally. During June 2018, that is, before the sowing of pigeon peas, the available N was medium in Kamalapur series (KMPmC3g1) and Margutti series (MRGmC2g1S1 and MRGmC3g1) soil phases covering 96 ha, 14.93% of 645 ha total area of the micro watershed and rest of the study area showed low available N covering 549 ha (85.07%) of the total area. In the subsequent year, January 2019, a few parts of soil phase MRGmC3g1 retained medium level (11 ha, 1.75%) available N, whereas the rest two soil phases have declined to low N, covering a maximum area of 634 ha (98.25%). During January 2020, all soil phases had low available N. This declining trend from medium available N to low N may be due to the uptake by pigeon pea crops in two site years, 2018–2019 and 2019–2020. This is also supported by the increased uptake of available nutrients and increased seed yield during 2019–2020 with a good amount of rainfall. Therefore, soil-available N has been utilized by the pigeon pea.
Soil CaCO3 was slight (BMNmC2g1, BMNmC3g1S1, GUTmC3g1, and RTGhD3g1S1 covering a smaller area of 61 ha, 9.51%)in June 2018 before sowing and has shown increasing accumulation after the harvest of the pigeon pea in both the site years, this may be due to a corresponding increase in exchangeable Ca and Mg. Available K2O and Zn showed a similar spatio-temporal trend that is from high to medium and sufficient to deficient, respectively, from June 2018 before sowing to after harvest in both site years. This may be due to variation in uptake in K2O & Zn by pigeon peas as influenced by rainfall and exhausted during the initial rainfall after a long dry spell and with no external application of these nutrient elements. Available B has shown an initial slight increase in a few areas of the Bhimanhalli series (BMNmC3g1S1) of January 2019 when compared to June 2018. Further, the decline in trend was observed in January 2020 from medium to low nutrient levels. Whereas, available S has increased in a larger area during 2019 when compared to 2018, then showed a decline in trend temporally during 2020. This may be due to low rainfall till June 2018, causing medium S availability in January 2019, and subsequently, the high rainfall during 2019 made the pigeon pea uptake these nutrient elements causing low soil available S and B in 2020.

8. Nutrient Uptake in Pigeon Pea

Nitrogen uptake by pigeon peas ranged from 60.75 (KKThF3g1S1) to 73.36 (GUTmB2g1) and from 63.96 (BHNhD3g1) to 81.65 (KMPmB2) with a mean of 66.01 and 73.21 in Kalmandari Tanda-1 MWS during 2019 and 2020 respectively. The uptake of nutrients by the crop is mainly a function of the yield and efficient development of roots. The nitrogen uptake by the pigeon pea grain was higher than by the stalk during both years. This may be due to the fact that the larger part of nitrogen absorbed by the plant would have migrated into the grains at the time of harvest. Nitrogen was absorbed in greater amounts than any other nutrient elements studied. This might be due to more availability of nutrients through fertilization, which increased the cation exchange capacity of plant roots. Thus, it makes the plant roots more efficient in absorbing nitrogen [29], which directly influences the activity of microorganisms which enables the N-fixing by Rhizobium to fix atmospheric nitrogen by symbiotic association with legumes, making plant roots more efficient at absorbing the nitrogen nutrient from soil [30].
Phosphorous uptake by pigeon peas ranged from 8.38 (KKThF3g1S1) to 12.34 (GUTmB2g1) and from 11.55 (KKThF3g1S1) to 16.29 (KMPmB2) with a mean of 10.23 and 13.96 in Kalmandari Tanda-1 MWS during 2019 and 2020, respectively. The increase in uptake of P with a successive increase in P fertilization and added supply of nutrients increases the CEC of root and root proliferation by stimulating the cellular activities and translocation of certain growth-stimulating compounds to roots. Thus, the extensive root system development with balanced fertilization along with organic fertilizers in adequate amounts might have assisted in the efficient absorption and utilization of other nutrients [31].
Potassium Uptake by pigeon peas ranged from 35.08 (BHNhC2g1) to 49.93 (KMPmB2) and from 39.10 (BHNhC2g1) to 57.75 (KMPmB2) with a mean of 43.39 and 48.32 in Kalmandari Tanda-1 MWS during 2019 and 2020, respectively. The increased uptake of K by pigeon peas may be due to the release of potash from the K-bearing minerals by complex agents and organic acids produced during the decomposition of FYM. In addition, it might be due to bacterial activities and applied fertilizers that were being made available to the crop via N-fixation as well as the release of native potassium in soil [32].
Sulfur uptake by pigeon peas ranged from 4.95 (KKThF3g1S1) to 10.35 (MRGmC2g1S1) and from 5.98 (KKThF3g1S1) to 11.22 (MRGmC2g1S1) with a mean of 7.44 and 8.17 in Kalmandari Tanda-1 MWS during 2019 and 2020 respectively. Uptake of S might be due to the favorable influence of NPK on a higher degree of root proliferation, anchorage, and deep penetration which in turn absorb a higher amount of nutrients from the Rhizosphere and supply to the crop resulting in higher plant height, LAI, and dry matter production and higher S content in the grain and stalk of the pigeon pea [33].
Iron uptake by pigeon peas ranged from 389.87 (KKThF3g1S1) to 483.95 (GUTmB2g1) and from 398.20 (BHNhD3g1) to 506.55 (KMPmB2) with a mean of 432.94 and 451.28 in Kalmandari Tanda-1 MWS during 2019 and 2020, respectively. The uptake of Fe was increased in general under the conjoint use of chemical fertilizers along with organic, which improved fertility levels and would be attributed to the better availability of micronutrients and their transport into the plant [34].
Zinc uptake by pigeon peas ranged from 96.76 (BHNhD3g1) to 114.63 (BHNhB2g1) and from 97.32 (BHNhD3g1) to 118.95 (KMPmB2) with a mean of 104.59 and 110.62 in Kalmandari Tanda-1 MWS during 2019 and 2020, respectively. The increased zinc uptake with the increase in fertility levels with FYM is attributed to the better availability of nutrients and their transport to the plant from the soil [35]. This may also be attributed to higher biomass production and the fact that the decomposition of FYM releases zinc cations, which were easily taken up by plants [36].

9. Seed Yield

Seed yield ranged from 1207 kg ha−1 (MRGmC3g1S1) to 1394 kg ha−1 (GUTmB2g1) and 1325 kg ha−1 (BHNhD3g1) to 1496 kg ha−1 (GUTmB2g1) with a mean of 1301 to 1421kg ha−1 in Kalmandari Tanda-1 MWS, respectively, in the year 2018–2019 and 2019–2020 (Figure 8).
The source-sink relationship and the rate at which translocation takes place from source to sink during the reproductive stage largely determine grain yield. Pigeonpea yield is a function of different yield components, such as the number of pods per plant. Source components such as LAI and dry matter accumulation play an important role in determining the final grain yield [37]. Jat and Ahlawat [38] also reported that the combined application of various organic and inorganic sources resulted in higher production by improving physical soil conditions and soil productivity. The low yield was attributed due to slightlyless improvement in growth and yield parameters. It also may be due to less limitation of land components like erosion, slope, texture, etc. [39].

10. Conclusions

The spatio-temporal variability of soil fertility parameters was generated using the k riging technique. It was observed that the maximum area was under neutral pH (392 ha, 60.77%) in 2018, and soil phases with slightly alkaline (38 ha, 5.87% of total area) showed a gradual decline in the pH to neutral in 2019 and 2020 after the harvest of pigeon pea in Kalmandari Tanda-1.Assessment of spatio-temporal variability of soil properties and nutrient uptake studies at mapping unit/soil-phase unit level includes the results drawn from both the soil intrinsic and extrinsic properties. Soil pH, organic carbon, available K, S, and Zn have shown significant spatio-temporal variations among three different sets of surface soil samples analyzed, one before the maturity of the pigeon pea (June 2018) and the other two after maturity (January 2019 and January 2020) of the pigeon pea. Assessment of soil-phase-wise soil properties and nutrient uptake studies will help to identify the limitations of the soil in management units in supporting plant growth and enables to address the site-specific nutrient reclamation.
The higher nutrient uptake and pigeon pea yield were observed in GUTmB2g1 and KMPmB2 soil phases of Kalmandari Tanda-1 MWS, which were characterized by moderate to deep soil depth, good soil properties with clay texture, and very gently sloping with moderate erosion. Though KKThE3g1S1 and KKThF3g1S1 soil phases of Kalmandari Tanda-1 MWS had moderately deep soils, showed less nutrient uptake and pigeon pea seed yield because of low to medium soil fertility, strong to very strong slope with severe erosion, which needs to be intervened with soil and water conservations measures to control maximum runoff, loss of soil and nutrients from land leveling, erosion barriers, and by addition of organic manures to improve soil physical and chemical properties of these phases. Therefore, the soil fertility and nutrient uptake was found to be low in soil phases wherever a strong to very strong slope existed, which is a major yield-limiting factor. Hence, precision land leveling and soil fertility management are necessary for all the pigeon pea-growing soils to maximize the production and productivity of the region. The spatio-temporal variability in soil properties, yield, and nutrient uptake of pigeon peas was attributed to slope and availability of soil moisture in this mono-cropping rainfed condition.

Author Contributions

Methodology, N.L.R.; Software, M.R.U.; Validation, K.N.R. and S.U.; Formal analysis, N.L.R., H.V.R., V.B.W. and M.R.U.; Investigation, N.L.R., S.U., B.K. and H.V.R.; Resources, K.N.R., B.R.K.D. and H.V.R.; Data curation, N.L.R.; Writing—original draft, N.L.R.; Writing—review & editing, S.U.; Supervision, K.N.R., B.R.K.D. and S.U.; Project administration, B.R.K.D. All authors have read and agreed to the published version of the manuscript.

Funding

This work was supported by The World Bank, Watershed Development Department, Government of Karnataka, State, Bengaluru, and also NBSSLUP, Regional Centre, Bengaluru. The funders had no role in study design, data collection and analysis, the decision to publish, orthepreparation of the manuscript.

Conflicts of Interest

The authors declare no conflict of interest.

References

  1. Görres, J.H.; Amador, J.A. Spatial Patterns. In Encyclopedia of Soils in the Environment; Elsevier: Amsterdam, The Netherlands, 2005; pp. 562–570. [Google Scholar] [CrossRef]
  2. Lark, R.M.; Cullis, B.R.; Welham, S.J. On spatial prediction of soil properties in the presence of a spatial trend: The empirical best linear unbiased predictor (E-BLUP) with REML. Eur. J. Soil Sci. 2006, 57, 787–799. [Google Scholar] [CrossRef]
  3. Rakesh, S.; Kunal, S. Characterization of spatial variability of soil parameters in apple orchards of Himalayan region using geostatistical analysis. Commun. Soil Sci. Plant Anal. 2020, 51, 1065–1077. [Google Scholar]
  4. Berkes, F.; Colding, J.; Folke, C. Rediscovery of traditional ecological knowledge as adaptive management. Ecol. Appl. 2000, 10, 1251–1262. [Google Scholar] [CrossRef]
  5. Natarajan, A.; Reddy, R.S.; Niranjana, K.V.; Rajendra, H.; Srinivasan, R.; Dharumarajan, S.; Srinivas, S.; Dhanokar, B.A.; Vasundhara, R. Field Guide for Land Resources Inventory, Sujala III Project, Karnataka; NBSS Publ., ICAR-NBSS & LUP: Bangalore, India, 2016; p. 154. [Google Scholar]
  6. Soil Survey Staff. Keys to Soil Taxonomy, 12th ed.; USDA-Natural Resources Conservation Service: Washington, DC, USA, 2014. [Google Scholar]
  7. Soil Survey Staff. Keys to Soil Taxonomy, 8th ed.; SCS, USDA: Washington, DC, USA, 2008. [Google Scholar]
  8. Evans, R. Assessment and monitoring of accelerated water erosion of cultivated land–when will reality be acknowledged? Soil Use Manag. 2013, 29, 105–118. [Google Scholar] [CrossRef]
  9. Walkley, A.; Black, C.A. Organic carbon. Methods of soil analysis. Am. Soc. Agron. 1965, 37, 1372–1375. [Google Scholar]
  10. Subbaiah, B.Y.; Asija, G.L. A rapid procedure for the estimation of available nitrogen in soils. Curr. Sci. 1956, 25, 259–260. [Google Scholar]
  11. Piper, C.S. Soil and Plant Analysis; Academic Press: New York, NY, USA, 1966; p. 367. [Google Scholar]
  12. Jackson, M.L. Soil Chemical Analysis; Prentice Hall of India, Pvt. Ltd.: New Delhi, India, 1973. [Google Scholar]
  13. Lindsay, W.L.; Norvell, W.A. Development of a DTPA soil test for zinc, iron, manganese and copper. Soil Sci. Soc. Am. J. 1978, 42, 421–428. [Google Scholar] [CrossRef]
  14. Page, A.L.; Miller, R.H.; Kenay, D.R. Methods of Soil Analysis. Part-II Chemical and Microbiological Properties; American Society of Agronomy Inc.: Madison, WI, USA, 1982. [Google Scholar]
  15. Oliver, M.A. (Ed.) Geostatistical Applications for Precision Agriculture; Springer Science & Business Media: Berlin, Germany, 2010; p. 146. [Google Scholar]
  16. Goovaerts, P. Geostatistics in Soil Science: State-of-the-Art and Perspectives. Geoderma 1999, 89, 1–45. [Google Scholar] [CrossRef]
  17. White, J.G.; Welch, R.M.; Norvell, W.A. Soil zinc map of the USA using geostatistics and geographic information systems. Soil Sci. Soc. Am. J. 1997, 61, 185–194. [Google Scholar] [CrossRef]
  18. Mishra, B.B. Indian system of soil classification: A way forward. Agric. Res. Technol. 2016, 3, 555–606. [Google Scholar] [CrossRef]
  19. Subehia, S.K.; Dhanika; Rana, S.S. Effect of continuous cropping and fertilization on availability of nutrients in acidic soil. Agropedology 2011, 21, 18–22. [Google Scholar]
  20. Swarup, A. Long-term effect of green manuring (Sesbania aculeata) on soil properties and sustainability of rice and wheat yield on sodic soil. J. Indian Soc. Soil Sci. 1991, 39, 777–780. [Google Scholar]
  21. Ramesh, P.; Singh, M.; Panwar, N.R.; Singh, A.B.; Ramana, S. Response of pigeonpea varieties to organic manures and their influence on fertility and enzyme activity of soil. Indian J. Agric. Sci. 2006, 76, 252–254. [Google Scholar]
  22. Gunjal, B.S.; Chitodkar, S.S. Effect of integrated nutrient management on soil properties and soil fertility under in sweet corn-potato cropping sequence in Vertisols of Deccan plateau of India. Int. J. Chem. Stud. 2017, 5, 1343–1351. [Google Scholar]
  23. Dasog, G.S.; Patil, P.L. Genesis and Classification of Black, Red and Lateritic Soils of North Karnataka. In Proceedings of the Special Publ. on Soil Science Research in north Karnataka, 76th Annual Convention of ISSS, Dharwad Chapter of ISSS, Dharwad, India, 15–18 November 2011; pp. 1–10. [Google Scholar]
  24. Sainju, U.M.; Allen, B.L.; Caesar-TonThat, T.; Lenssen, A.W. Dryland soil chemical properties and crop yields affected by long-term tillage and cropping sequence. Springer Plus 2015, 4, 320. [Google Scholar] [CrossRef] [Green Version]
  25. Landey, R.I.; Hirekerur, L.R.; Krishnamurthy, P. Morphology, genesis and classification of black soils. Review of Soil Research in India Part–II. In Proceedings of the 12th International Congress of Soil Science, New Delhi, India, 8–17 February 1982; pp. 484–498. [Google Scholar]
  26. Das, D.K. Role of soil information systems in sustainable use of land resources. J. Indian Soc. Soil Sci. 1999, 47, 584–610. [Google Scholar]
  27. Srinath, K. A study of physico-chemical characteristics of some salt affected soils of Tungabhadra river valley project left bank canal area. Master´s Thesis, University of Agricultural Sciences, Bangalore, India, 1979. [Google Scholar]
  28. Almagro, M.; Ruiz-Navarro, A.; Díaz-Pereira, E.; Albaladejo, J.; Martínez-Mena, M. Plant residue chemical quality modulates the soil microbial response related to decomposition and soil organic carbon and nitrogen stabilization in a rainfed Mediterranean agroecosystem. Soil Biol. Biochem. 2021, 156, 108198. [Google Scholar] [CrossRef]
  29. Tamhane, R.V.; Motiramani, D.P.; Bali, V.D.; Roy, L.D. Soil: Their Chemistry and Fertility in Tropical Asia; Prentice Hall of India Pvt. Ltd.: New Delhi, India, 1964. [Google Scholar]
  30. Rana, N.S.; Singh, G.V.; Ahlawat, I.P.S. Effect of nitrogen, Rhizobium inoculation and phosphorous on root nodulation, dry matter yield and nutrient uptake in pigeonpea (Cajanus cajan). Indian J. Agron. 1998, 43, 102–105. [Google Scholar]
  31. Sutaria, G.S.; Akbari, K.N.; Vora, V.D.; Hirpara, D.S.; Padmani, D.R. Response of legume crops to enriched compost and vermicompost on Verticustochrept under rain fed agriculture. Leg. Res. 2010, 33, 128–130. [Google Scholar]
  32. Rana, R.; Badiyala, D. Effect of integrated nutrient management on seed yield, quality and nutrient uptake of soybean (Glycine max) under mid hill conditions of Himachal Pradesh. Indian J. Agron. 2014, 59, 641–645. [Google Scholar]
  33. Mere, V.; Singh, A.K.; Singh, M.; Jamir, Z.; Gupta, R.C. Effect of nutritional schedule on productivity and quality of soybean varieties and soil fertility. Leg. Res. 2013, 36, 528–534. [Google Scholar]
  34. Gupta, S.; Handore, K. Direct and residual effect of zinc and zinc amended organic manures on the zinc nutrition of field crop. Int. J. Agric. Sci. 2009, 1, 26–29. [Google Scholar]
  35. Tiwari, A.; Dwivedi, A.K.; Dikshit, P.R. Long term influence of organic and inorganic fertilization on soil fertility and productivity of soybean-wheat system in Vertisol. J. Indian Soc. Soil Sci. 2002, 50, 472–475. [Google Scholar]
  36. Jadhav, A.B.; Kadlag, A.D.; Patil, V.S.; Bachkar, S.R.; Dale, R.M. Response of chickpea to conjoint application of inorganic fertilizers based on STCR approach and vermicompost on Inceptisol. J. Maharashtra Agric. Univ. 2009, 34, 125–127. [Google Scholar]
  37. NarayanaRao, K.; Rajath, E.; Kumara, K. Yield, quality parameters and economics of sunflower (Helianthus annuus L.) as influenced by micronutrient mixture foliar application. Int. J. Curr. Microbiol. App. Sci. 2020, 9, 1999–2005. [Google Scholar]
  38. Jat, H.S.; Ahlawat, I.P.S. Response of pigeonpea (Cajanus cajan) + groundnut (Arachis hypogea) intercropping system to planting and phosphorus management. Indian J. Agron. 2003, 48, 156–159. [Google Scholar]
  39. Abdel Rahman, M.A.; Natarajan, A.; Hegde, R. Assessment of land suitability and capability by integrating remote sensing and GIS for agriculture in Chamarajanagar district, Karnataka, India. Egypt. J. Remote Sens. Space Sci. 2016, 19, 125–141. [Google Scholar]
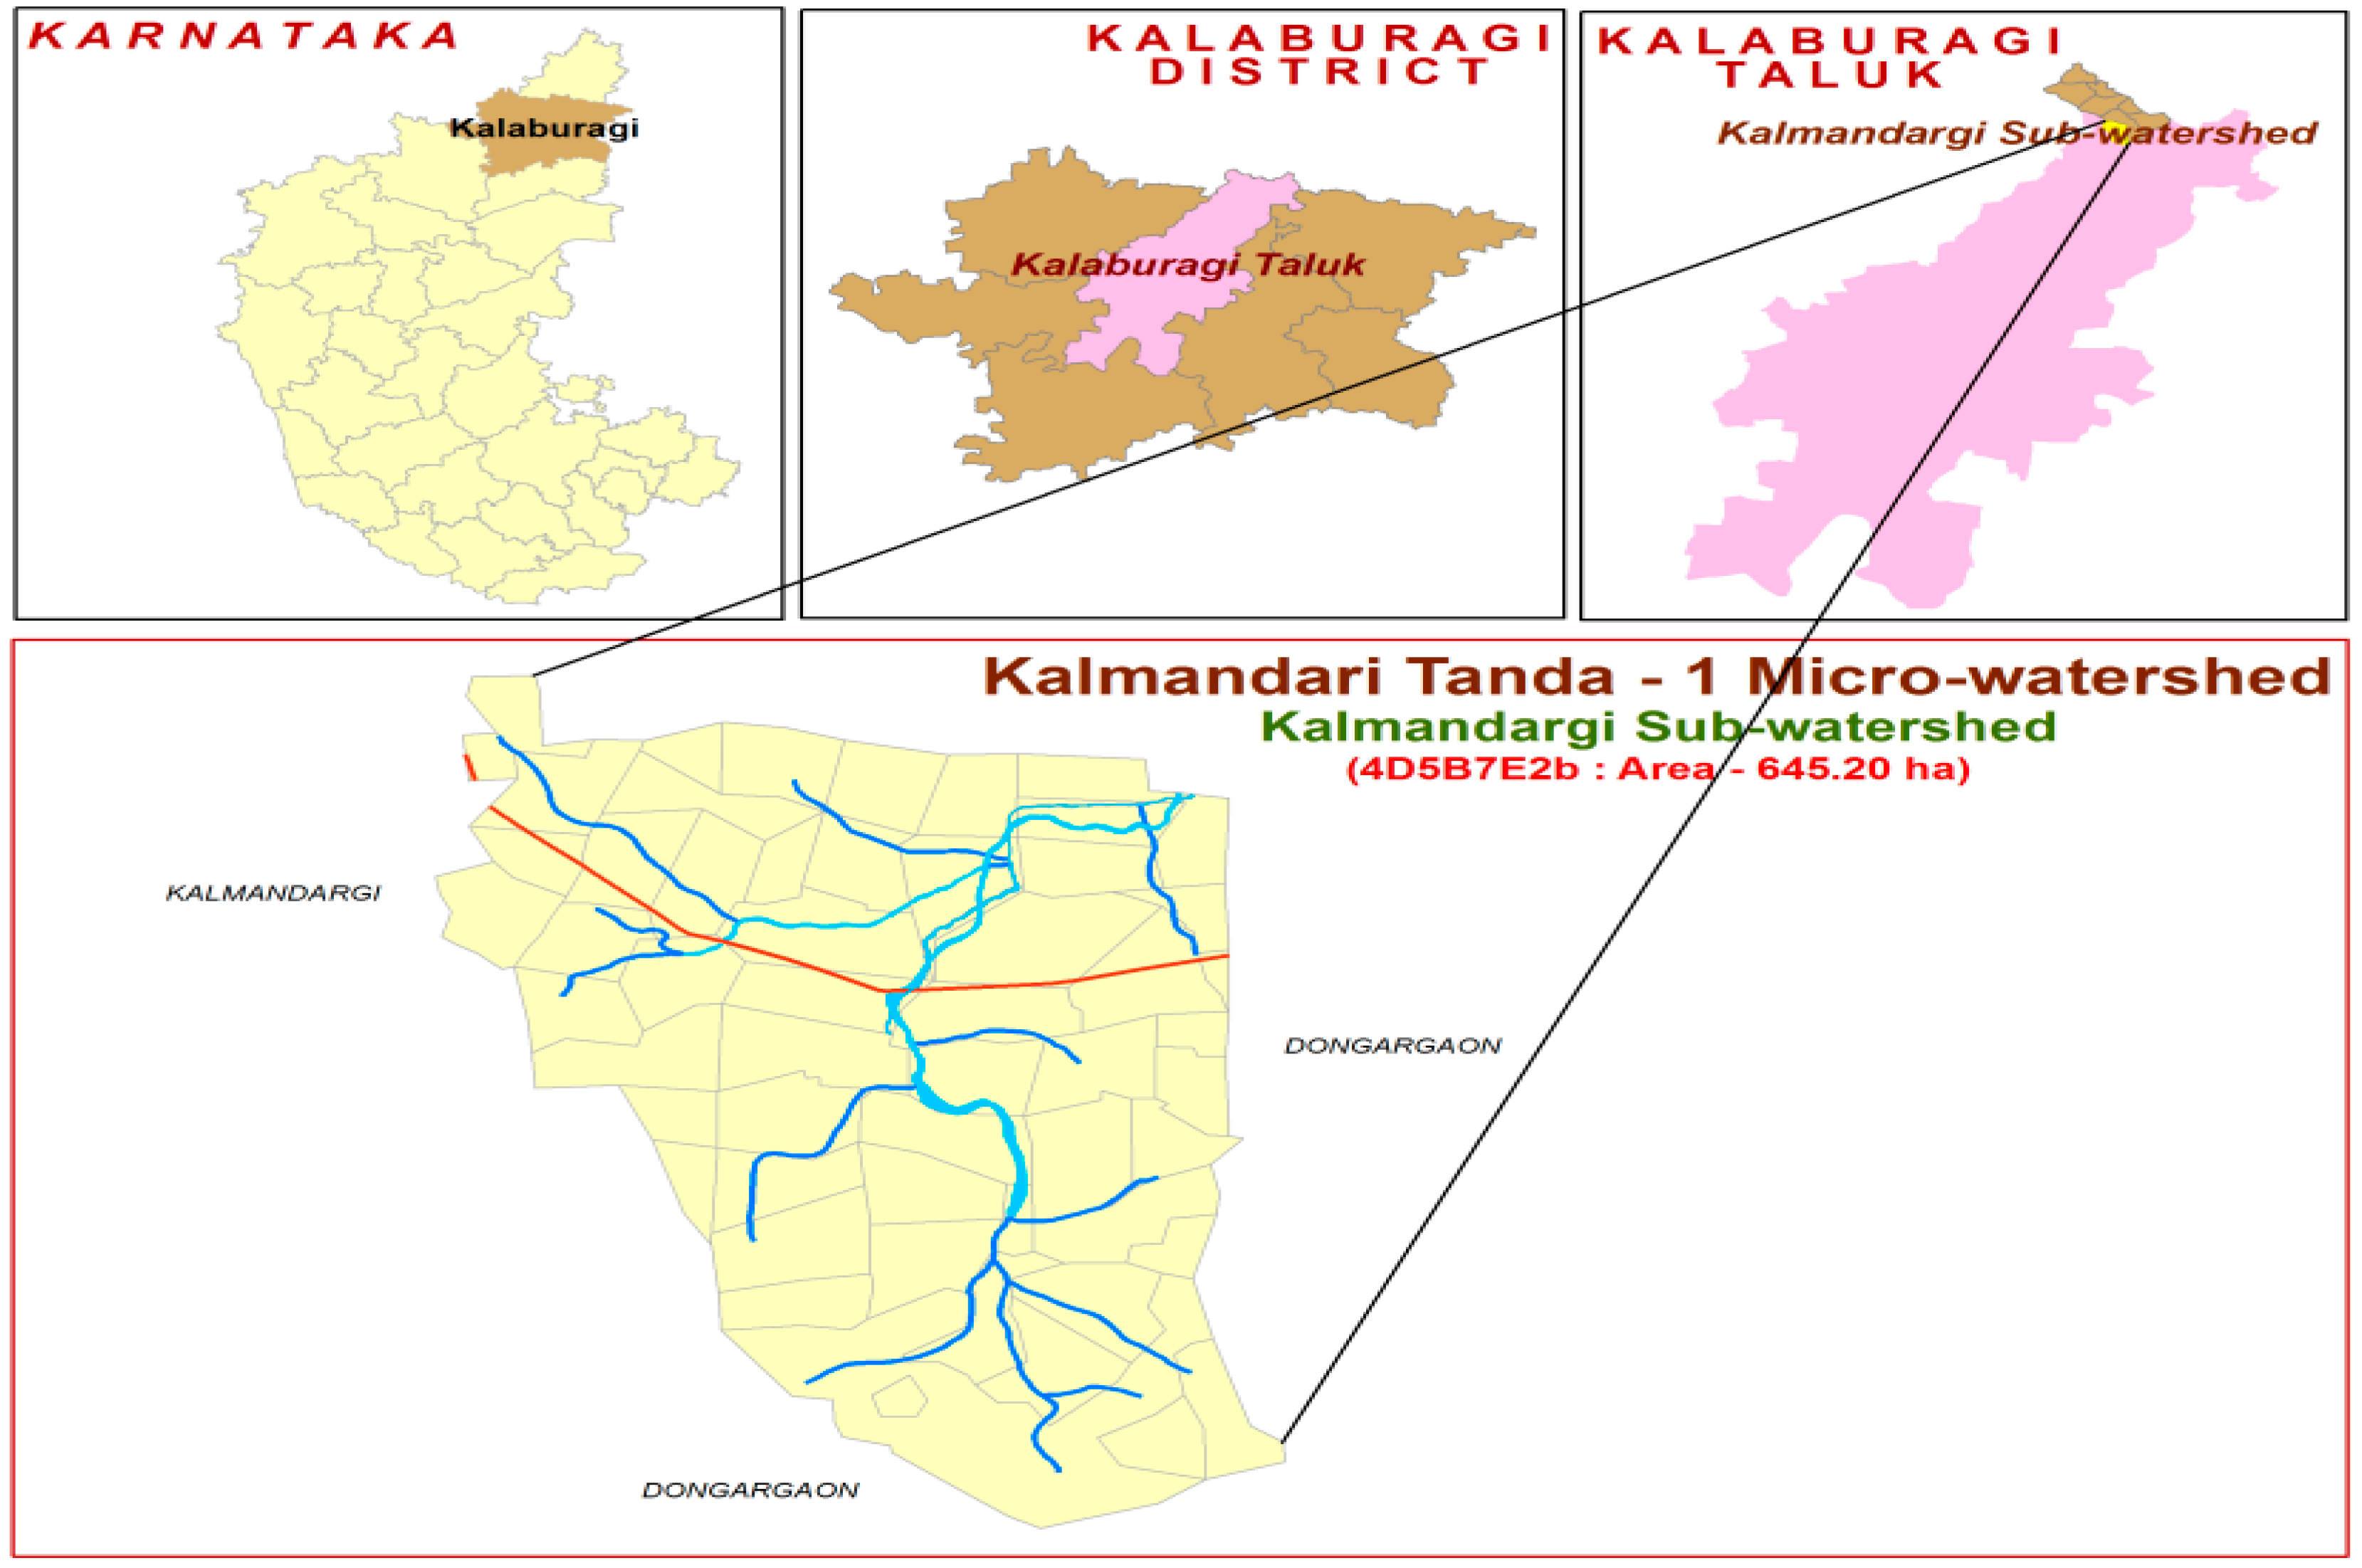
Figure 1. Location map of Kalmandari Tanda-1 MWS.
Sustainability 15 03998 g001
Figure 2. Mean monthly rainfall at Kalmandari Tanda-1 MWS during 2018 and before 2019.
Sustainability 15 03998 g002
Figure 3. Soil profiles of identified soil series of Kalmandari Tanda-1 MWS.
Sustainability 15 03998 g003
Figure 4. Soil sampling locations (A) for quantification of spatial variability through kriging, (B) for soil-phase-wise uptake studies.
Sustainability 15 03998 g004
Figure 5. Spatiotemporal (2018, 2019 & 2020) variability in soil properties.
Sustainability 15 03998 g005aSustainability 15 03998 g005bSustainability 15 03998 g005c
Figure 6. Semivariogram models of soil properties.
Sustainability 15 03998 g006aSustainability 15 03998 g006bSustainability 15 03998 g006c
Figure 7. Spatiotemporal (2018, 2019 & 2020) variability in soil fertility during different growing seasons of pigeon pea (ad).
Sustainability 15 03998 g007aSustainability 15 03998 g007bSustainability 15 03998 g007c
Figure 8. Spatio-temporal variability of seed yield in Kalmandari Tanda-1 micro watershed.
Sustainability 15 03998 g008
Table 1. Pedon’s morphological features of Kalmandari Tanda-1 MWS.
Sl.
No.
Soil SeriesMapping UnitDepth
(cm)
Slope
(%)
ColorTextureDrainagePhysiographyGeologyConsistencyStoninessErosion
SurfaceSub
Surface
SurfaceSub
Surface
1Bachnal
(BHN)
BHNhB2g125–501–35 YR 3/25 YR 4/3sclMWDPdBasalt *sh, fri, ss, sph, fri, ss, sp-M
BHNhC2 & g125–503–55 YR 3/25 YR 4/3sclMWDPdsh, fri, ss, sph, fri, ss, sp-M
BHNhD3g125–505–105 YR 3/25 YR 4/3sclMWDPdsh, fri, ss, spsh, fri, ss, sp-S
2Bheemanhalli
(BMN)
BMNmC2g125–503–510 YR 3/110 YR 4/3cWDPdBasaltsh, fm, s, pvh, fm, s, p-M
BMNmC3g1S125–503–510 YR 3/110 YR 4/3cWDPdsh, fm, s, pvh, fm, s, pStrongS
3Gutti
(GUT)
GUTmB2g150–751–310 YR 3/210 YR 3/1cSPWDLpdpsh, fm, s, pvh, fm, s, p-M
GUTmC2g150–753–510 YR 3/210 YR 3/1cSPWDLpdpsh, fm, s, pvh, fm, s, p-M
GUTmC3g150–753–510 YR 3/210 YR 3/1cSPWDLpdpsh, fm, s, pvh, fm, s, p-S
4Kurkota
(KKT)
KKThE3g1S175–10010–155 YR 3/45 YR 3/4sclWDLpdpBasalt *sh, fri, ss, sph, fri, ss, spStrongS
5Kamalapur
(KMP)
KMPmB20.75–1.01–310 YR 3/210 YR 3/1cSPWDLpdpBasaltsh, fm, s, p.vh, fm, s, p-M
KMPmC2 & g175–1003–510 YR 3/210 YR 3/1cSPWDLpdpBasaltsh, fm, s, pvh, fm, s, p-M
KMPmC3g175–1003–510 YR 3/210 YR 3/1cSPWDLpdpsh, fm, s, pvh, fm, s, p-S
6Margutti
(MRG)
MRGmC2g10–253–510 YR 4/310 YR 4/3cMWDPdsh, fm, s, psh, fm, s, p-M
MRGmC2g1S10–253–510 YR 4/310 YR 4/3cMWDPdsh, fm, s, psh, fm, s, pStrongM
MRGmC3g10–253–510 YR 4/310 YR 4/3cMWDPdsh, fm, s, psh, fm, s, p-S
MRGmC3g1S10–253–510 YR 4/310 YR 4/3cMWDPdsh, fm, s, psh, fm, s, pStrongS
7Ratnagutti
(RTG)
RTGhC2 & g125–503–55 YR 3/35 YR 3/3sclMWDLpdpBasalt *sh, fri, ss, sph, fri, ss, p-M
RTGhC2g1S125–503–55 YR 3/35 YR 3/3sclMWDLpdpsh, fri, ss, sph, fri, ss, pStrongM
RTGhD3g1S125–505–105 YR 3/35 YR 3/3sclMWDLpdpsh, fri, ss, sph, fri, ss, pStrongS
Note: Structure: 2: At both surface and subsurface, is 2 msbk moderate, m: medium, sbk: subangular blocky. Consistency: vh: very hard, h: hard, sh: slightly hard, fri: friable, fm: firm, s: sticky, p: plastic, ss: slightly sticky, sp: slightly plastic. Drainage: MWL: Moderately well drained, WD: Well drained, SPWD: somewhat poorly well drained. Physiography: Pd: Pediment, Lpdp:Lower pediplain, Land use: Agriculture in all the soil phases. * Basalt with lateritic intrusion.
Table 2. Descriptive statistics of physicochemical properties of surface soil samples (after harvest) of Kalmandari Tanda-1 MWS during 2018–2019 and 2019–2020.
Parameter20182019
MinMaxMeanSDSkewnessKurtosisMinMaxMeanSDSkewnessKurtosis
pH5.887.786.630.440.710.656.056.96.500.33−0.14−1.66
EC0.110.490.270.090.640.230.120.180.150.02−0.06−1.08
CaCO35.239.006.670.840.841.525.739.257.160.810.640.85
OC0.270.690.500.09−0.521.120.190.610.420.09−0.521.12
N121.5310.5225.640.7−0.511.14104.0283.5199.439.7−0.370.75
P2O520.244.730.76.30.880.2720.341.728.56.20.72−0.34
K2O302.4449.8361.745.70.45−0.91273.3417.9333.941.90.57−0.67
S7.0013.6010.692.08−0.27−1.105.0511.658.742.08−0.27−1.10
Zn0.220.750.440.180.69−0.910.190.690.380.170.81−0.85
Fe1.154.652.971.12−0.18−1.570.544.042.360.2−0.04−0.81
Cu0.551.210.850.19−0.06−0.790.441.100.742.530.1−1.4
Mn6.9914.5010.442.550.08−1.445.8713.389.324.080.02−1.15
Ca16.830.5423.884.070.01−1.1715.0048.0021.891.130.04−1.19
Mg5.239.157.251.150.03−1.181.009.003.280.15−0.34−1.39
B0.190.520.370.10−0.35−1.380.140.470.320.291.351.25
Na0.741.851.090.281.331.240.711.801.040.851.360.85
ESP2.435.283.280.841.340.892.255.043.062.36−0.45−1.44
CEC28.5435.7033.162.35−0.48−1.5029.2936.4533.919.44−0.04−0.53
Table 3. Association between chemical properties of surface soil samples (after harvest) of Kalmandari Tanda-1 MWS of 2018–2019.
ParametersECOCNP2O5K2OZnMnCaMgNaESP
EC1
OC0.484 *1
N0.483 *1.000 **1
P2O50.0410.1570.1601
K2O0.0130.3430.345−0.2091
Zn0.0840.1280.127−0.010−0.1091
Fe0.1180.0090.010−0.0300.0650.532 **
Cu0.1330.456 *0.459 *−0.168−0.0310.018
Mn0.0020.479 *0.483 *−0.2930.778 **0.0441
Ca0.0910.590 **0.591 **−0.2690.616 **−0.1410.786 **1
Mg0.0590.491 *0.493 *−0.3490.599 **−0.1780.775 **0.980 **1
Na0.106−0.183−0.180−0.486 *0.068−0.2130.1020.0800.1541
ESP0.090−0.335−0.332−0.403−0.131−0.226−0.143−0.160−0.0850.963 **1
CEC0.0740.481 *0.483 *−0.3470.700 **0.0790.879 **0.833 **0.834 **0.160−0.105
* and ** significant at p = 0.05 and p = 0.01 respectively.
Table 4. Association between chemical properties of surface soil samples (after harvest) of Kalmandari Tanda-1 MWS in 2019–2020.
ParameterspHOCNP2O5K2OZnFeCuMnCaMgBNaESP
OC−0.461 *
N−0.465 *0.999 **
P2O5−0.1390.1700.160
K2O−0.0170.3270.3230.016
Zn−0.2130.1630.158−0.040−0.210
Fe0.0710.0090.0130.0250.0260.506 *
Cu−0.452 *0.456 *0.451 *−0.030−0.0500.0630.030
Mn−0.1760.479 *0.478 *−0.2300.721 **0.0240.2580.190
Ca−0.277−0.049−0.0600.2210.1610.2100.1830.1130.130
Mg−0.264−0.088−0.0970.0670.1310.3150.2170.2390.0800.845 **
B−0.320−0.083−0.073−0.290−0.459 *0.440 *0.0820.205−0.2000.1000.346
Na0.310−0.186−0.171−0.439 *0.111−0.3000.0980.0790.100−0.2000.008−0.150
ESP0.391−0.332−0.317−0.380−0.060−0.3100.0350.024−0.100−0.2000.016−0.1100.967 **
CEC−0.2950.481 *0.486 *−0.3200.627 **0.0760.3540.2140.879 **0.1200.053−0.0600.160−0.090
* and ** significant at p = 0.05 and p = 0.01 respectively.
Table 5. Semivariogram parameters of best-fitted kriging model to predict soil properties of Kalmandari Tanda-1 in 2018.
ParameterModelNugget
(Co)
Partial SillRange
in m
Sill
(Co + C)
Ratio Co/
(Co + C)
SDRMS
pHK Bessel0.0000.5011181.4680.5010.000Strong0.829
ECExponential0.0010.008635.4280.0100.127Strong0.894
CaCO3Exponential0.0810.261746.0170.3420.237Strong0.898
OCExponential0.0020.00319,060.7980.0050.385Moderate0.958
NExponential399.960638.6521899.0301038.6120.385Moderate0.958
PStable0.00073.775775.11373.7750.000Strong0.967
KK Bessel0.0001265.411960.0641265.4110.000Strong0.956
SExponential1.3262.716745.6844.0420.328Moderate0.965
ZnExponential0.0000.033671.3230.0330.000Strong0.878
FeExponential0.1120.952702.0491.0640.105Strong0.880
CuExponential0.0100.0211186.9360.0300.324Moderate0.946
MnExponential0.0003.818829.0233.8180.000Strong0.963
CaK Bessel0.00014.4551024.41414.4550.000Strong0.973
MgK Bessel0.0001.2471119.7381.2470.000Strong0.975
BExponential0.0010.005749.1520.0060.175Strong0.914
ESPExponential0.0270.152847.6410.1790.150Strong0.921
Table 6. Semivariogram parameters of best-fitted kriging model to predict soil properties of Kalmandari Tanda-1 in 2019.
ParameterModelNugget
(Co)
Partial
Sill
Range
in m
Sill
(Co + C)
Ratio Co/(Co + C)SD
Dependence
RMS Statd.
pHK Bessel0.0000.209863.7150.2090.000Strong0.870
ECK Bessel0.0000.011586.3020.0110.000Strong0.971
CaCO3Exponential0.0030.394717.5770.3970.007Strong0.926
OCExponential0.0010.0084458.9310.0090.110Strong0.976
NExponential586.3311570.1864457.7302156.5170.272Moderate0.977
PStable0.00035.5961794.97335.5960.000Strong0.901
KStable0.0001324.7211054.8801324.7210.000Strong0.952
SExponential2.1472.006983.9124.1530.517Moderate0.954
ZnExponential0.0000.037690.2220.0370.000Strong0.902
FeExponential0.0001.214808.2151.2140.000Strong0.901
CuExponential0.0100.019562.0160.0290.353Moderate0.973
MnK Bessel0.0005.7961393.5085.7960.000Strong0.947
CaK Bessel0.00014.0201012.73914.0200.000Strong0.987
MgExponential0.0301.045747.2001.0750.028Strong1.016
BExponential0.0120.012720.8090.0240.500Moderate1.007
ESPExponential0.3420.108847.6410.4490.760Weak0.915
Table 7. Semivariogram parameters of best-fitted kriging model to predict soil properties of Kalmandari Tanda-1 in 2020.
ParameterModelNugget
(Co)
Partial
Sill
Range
in m
Sill
(Co + C)
Ratio
Co/
(Co + C)
SDRMS
pHExponential0.0000.116554.5470.1160.000Strong0.826
ECExponential0.0000.000446.8940.0000.000Strong0.894
CaCO3Exponential0.0290.385725.5910.4140.070Strong0.974
OCExponential0.0020.0031906.0800.0050.385Moderate0.976
NExponential402.215642.4391905.0661044.6540.385Moderate0.898
PExponential6.99525.561713.60432.5560.215Strong0.958
KStable0.0001271.490993.8811271.4900.000Strong0.958
SExponential1.3262.716745.6844.0420.328Moderate0.976
ZnExponential0.0000.037709.6530.0370.000Strong0.880
FeExponential0.0001.214836.7761.2140.000Strong0.878
CuExponential0.0100.0211186.9360.0300.324Moderate0.957
MnStable0.0005.9461617.6415.9460.000Strong0.965
CaExponential0.000112.696624.561112.6960.000Strong0.946
MgStable0.0007.8873320.2767.8870.000Strong0.963
BExponential0.0010.012720.0450.0130.073Strong0.914
ESPExponential0.2360.140857.1060.3770.628Moderate0.921
Table 8. Nutrient uptake (kg ha−1) by pigeon pea at Kalmandari Tanda-1 MWS in 2019 and 2020.
Soil Phase20192020
NPKSFeZnNPKSFeZn
BHNhB2g171.0410.7747.477.19453.19114.6375.8914.0951.438.25463.66118.63
BHNhC264.909.6137.516.55425.96102.1672.3113.2542.127.75442.82107.94
BHNhC2g166.129.7435.085.56421.17104.1171.9613.2039.596.72442.03110.42
BHNhD3g161.099.3236.658.99401.3796.7663.9612.1439.109.76398.2097.32
BMNmC2g169.9010.9146.375.21439.67111.2176.7014.5750.726.28448.90115.44
BMNmC3g1S170.3011.4145.806.77440.15107.9476.4014.9750.167.88452.20112.47
GUTmB2g173.3612.3448.637.93483.95111.2279.5915.9752.919.05494.17115.39
GUTmC2g167.9110.7147.799.31432.97101.9376.5814.7753.697.61456.78109.30
GUTmC3g169.2010.7146.269.83433.3097.1176.0514.3950.919.16447.39101.92
KKThE3g1S162.849.1341.257.01395.60108.0366.9612.2344.838.01404.24111.51
KKThF3g1S160.758.3839.314.95389.87104.4765.3311.5543.365.98404.07109.28
KMPmB271.5211.8349.936.80462.21107.1781.6516.2957.758.42506.55118.95
KMPmC268.1710.8846.095.73421.3698.1874.8314.6050.786.87435.73103.15
KMPmC2g167.2410.2746.919.33446.45101.8674.5414.1052.658.38472.90109.31
KMPmC3g166.5210.8146.298.28432.00102.1673.9314.6651.538.81451.61108.44
MRGmC2g167.3810.3647.428.81440.71102.6077.4114.7354.867.27485.99114.51
MRGmC2g1S164.1110.5647.8010.35448.98103.7975.0515.0855.1211.22484.74114.11
MRGmC3g163.3910.3446.605.60435.16106.8272.8814.5551.566.87455.77114.10
MRGmC3g1S164.6010.2745.746.06442.11105.3474.9414.5751.917.42467.25113.57
RTGhC261.919.3436.365.51440.70107.3167.9312.7139.806.49444.07110.10
RTGhC2g162.879.4437.078.69426.33108.7169.3612.9341.2810.06439.65113.79
RTGhC2g1S161.919.3039.218.74428.48101.8168.9612.8943.9810.95447.49107.93
RTGhD3g1S161.099.0336.487.94415.85100.1870.6412.9441.458.92433.22106.64
Disclaimer/Publisher’s Note: The statements, opinions and data contained in all publications are solely those of the individual author(s) and contributor(s) and not of MDPI and/or the editor(s). MDPI and/or the editor(s) disclaim responsibility for any injury to people or property resulting from any ideas, methods, instructions or products referred to in the content.