Article

Quantification of Floc Growth for Sediment with Mixing Intensity

Department of Civil Engineering, Hongik University, 94, Wausan-ro, Mapo-gu, Seoul 04066, Republic of Korea
*
Author to whom correspondence should be addressed.
Sustainability 2023, 15(5), 4073; https://doi.org/10.3390/su15054073
Submission received: 31 December 2022 / Revised: 18 February 2023 / Accepted: 21 February 2023 / Published: 23 February 2023
(This article belongs to the Section Sustainable Water Management)

Abstract

:
Pollutants related to water quality often exist in rivers and form clusters. These pollutants adversely affect river environments and ecosystems. In Korea, the public’s interest in water quality has been increasing for decades. Many studies on water quality and pollutants in sewage treatment plants have been conducted; however, studies on the formation of flocs based on the flow characteristics of rivers are insufficient. In general, it is known that floc formation is influenced by hydraulic characteristics, such as velocity and turbulence, and that it combines them with contaminants in the river. However, studies that quantitatively analyze this topic are also insufficient. An analysis of floc formation between sediments must be conducted to understand the formation process of sediments and contaminants. Therefore, in this study, kaolin, which is a cohesive sediment, was used to quantify the floc formation process according to the mixing intensity. Turbidity was analyzed to observe the amount of floc formation, and samples were collected to confirm the concentration. Additionally, the turbidity concentration relationship according to the mixing intensity was quantified using an optical microscope. Regarding the mixing intensity, when the rotation speed was 200 rpm or more, the separation of the flocs was dominant. In contrast, when the rotation speed was 100 rpm or less, turbidity changes due to sedimentation and floc formation were dominant. Analyzing mixing intensities and their association with the flow characteristics of rivers may be useful for the management of contaminants in rivers.

1. Introduction

Contaminants have continuously accumulated in riverbeds due to concentrated urban populations and industrial development which can accelerate water pollution. The effects of trace contaminants are important to consider when studying water quality. When a flood occurs, contaminants on the riverbed resuspend and cause water pollution. Fine sediment offers a large surface area relative to its volume and has adsorption potential that leads to the agglomeration of contaminants on particle surfaces (Kuhn and Jirka 2005) [1]. It can act as a sink for various pollutants, such as heavy metals, but it can also become a source of contaminants under certain circumstances (Ahlf et al. 2002; Hollert et al. 2000, 2003; Forstner, Muller 1974) [2,3,4,5]. Contaminated sediment is known to cause various adverse effects for organisms, even when the contaminant level in the water is low (Chapman 1989) [6]. To understand the complex relations of sediment-bound contaminants, the binding mechanism of single particles should be studied. This process is the first step toward managing water pollutants. Since flocculation changes the size and form of particles, the physical and chemical properties of flocs also change. These changes are mainly explained by chemical properties, but in this study, an experimental study was conducted to confirm the relationship between hydraulic properties, which are physical properties, and the formation, precipitation, and resuspension of pollutants.
River flow is divided into average velocity and fluctuation. Fluctuation directly affects the shear stress that acts on the sediment (van Leussen 1994) [7], and this stress determines sediment aggregation and disaggregation. Since flow fluctuation is the main parameter that determines turbulence characteristics, it can be assumed that turbulence is the main determinant of sediment flocculation. Many studies have been conducted under this assumption. Muller et al. (2007) [8] investigated sediment dynamics by conducting a benthic chamber test on turbulence and pollutant mobilization. Kuhn and Jirka (2005) [1] developed an experimental system for generating turbulence columns to investigate the relationship between fine sediment behavior and open channel turbulence. They reproduced natural turbulence in a vertical direction and identified the motion of the sediment. Many studies on turbulence and sediment have focused on sediment-moving mechanisms but not on flocs. Ditchke and Markofsky (2006) [9] observed the aggregation and disaggregation of flocculation through experiments. They quantitatively analyzed flocculation based on depth and used the same tank as Kuhn and Jirka (2005) [1]. Many other studies have identified the relationship between sediment flocculation and turbulence and considered the material properties of the research area (Kapsimalis et al. 2004; Gonzalez et al. 2004; Manning 2004; Christie et al. 1997) [10,11,12,13]. In a more recent study, Bubakova et al. (2013) [14] observed changes in the breakages and restructurings of flocs over time. In addition, Zhu et al. (2016) [15] conducted a study on the steady state of flocculation of kaolinite. They confirmed differences in floc sizes according to shear stress.
However, turbulence is difficult to measure in experiments and in the field. Even if it is measured, it is difficult to define the turbulence of a certain area as a representative value by measuring it at a local point rather than at a partial section. Accordingly, many researchers have presented indicators that define the flow characteristics that affect the flocculation of sediment. In the field of water quality, the relationship between flow characteristics and flocculation has been shown by focusing on the mixing strength of the mixture pond. Camp and Stein (1943) [16] suggested the concept of mixing and flocculation by presenting the mixing strength as the velocity gradient (G). This indicator is also used in the waterworks facility standards established by the Ministry of Environment in Korea. Nevertheless, few studies have clearly and quantitatively approached sediment flocculation and hydraulic characteristics. Therefore, in this study, the relationship between fine sediment flocculation and external influences was presented through an experiment in a cylindrical tank. Since the experiment’s stirring type was similar to mechanical stirring, the mixing intensity in this study was based on the concept of velocity gradient. Flocculation was quantified using this indicator.

2. Material and Methods

2.1. Mixing Intensity (GT)

The most important mechanism in this study is to quantify floc formation. Most studies have explained the flocculation process through chemical actions, but analyses of its relationship with hydraulic characteristics have been insufficient. In this study, the behavior of flocs and their flow characteristics focused on four behaviors. As shown in Figure 1, these behaviors included aggregation and disaggregation between particles, resuspension, and deposition of the formed floc. These behaviors relate to the water’s flow characteristics and the turbidity used to measure water quality in this study.
Hydraulic characteristics, which can be viewed as physical actions, have been presented with various indices. In this study, it was necessary to investigate how hydraulic effects influence the formation and separation of flocculation. An index, which was previously applied only to the waterworks treatment process, was applied to the channel flow. This index was based on the possibility of aggregation due to an increase in the number of collisions and disaggregation due to shear stress, which depends on flow characteristics. These aggregation and disaggregation processes generate flocs of various sizes. It can be assumed that flocs aggregate and grow while colliding with each other due to the flow velocity of natural rivers. The process described above was explained by Camp and Stein (1943) as a basic theoretical equation. Equation (1) describes particle collisions:
N = 1 6 n n G ( d + d ) 3  
where N is the number of floc collisions in unit volume in unity time (m−3·s−1); n′ is the number of floc particles in diameters d′ in a unit volume (m−3); n″ is the number of floc particles in diameter d″ in a unit volume(m−3); G (= P / μ ) is the velocity gradient (s−1); P is the power per unit volume (N·m·s−1·m−3); and μ is the viscosity coefficient (kg·m−1·s−1).
G is the velocity gradient presented by Camp and Stein (1943) [16], which can represent the flow characteristics of the stirrer (Equation (2)). It quantifies flow characteristics by reflecting the characteristics and capacity of the fluid and the characteristics of the stirrer. Additionally, it is used as the waterworks facility standard in Korea, and the G value exists in various forms, depending on the mixing method and tank type. In this study, flow characteristics were shown using the G value of the rapid mixing type and the experimental device.
G = ρ C i ( a i v i 3 ) 2 μ V  
where C is the resistance coefficient of the stirring blade and is generally a value of 1.5; ai is the area (m2) perpendicular to the direction of the stirrer blade’s movement I; vi is the average speed (m/s) of the stirrer blade i; V is the capacity of the mixing tank; and ρ is the density of the fluid (kg·m−3).
The dimension of G is s−1. The size of the velocity gradient may influence flocculation, but the mixing time could also have an important effect. Therefore, GT, which is dimensionless with the mixing time, is defined as the mixing intensity. It is a value that reflects the duration of the flow characteristic.
G T = G × t  
where GT is the mixing intensity and t is the mixing time (s).

2.2. Experiments for Flocculation

This study focused on floc targets, flow characteristics, and measurement factors for quantification. Figure 2 shows the processes of the preliminary experiment, the main experiment, and the measurement method. A pre-experiment was performed. The dry and weight method was used to verify the concentration conditions. The theoretically calculated concentration and the actual concentration measured by the dry and weight method were compared. Flocculation can be seen as flocculation between sediments, flocculation between the floc and the contaminant, and flocculation between flocs. In this main experiment, flocculation between sediments was tested as a single sediment, i.e., kaolin. The study used rpm and kaolin concentration as representative factors. Finally, to quantify the flocculation, changes in the turbidity and the size and number of the particles were observed.
The experiment used two methodologies. Case 1 is shown in Figure 3a. It explored the formation and behavior of flocculation when different flow characteristics were used and judged to be sufficiently mixed with single particles. It was assumed that the sediment of the constant concentration was sufficiently mixed, and there was a strong disturbance at the beginning and no aggregation between the particles. It was also assumed that turbidity was determined by sedimentation or flocculation. In contrast, Case 2 explored changes in turbidity and particle sizes by inflowing sediment into clear water, as shown in Figure 3b. This experiment’s purpose was to confirm the effect of flocculation on inflow.

2.3. Equipment and Experimental Conditions

Since kaolin is generally the largest fraction in river sediments, it was considered a single particle in this study. The concentration of kaolin ranges from 100 to 1000 mg/L under different turbulent conditions (Kuhn and Jirka 2005) [1], and its size is between 20 and 30 µm (Yahaya et al. 2017) [17]. A specification analysis showed that the kaolin used in this experiment contained chlorine (Cl), arsenic (As), iron (Fe), and heavy metals, such as Pb (Samcheon Pure Chemical Co., Ltd., 2022) [18]. Kaolin’s density ranges from 1.8 to 2.6 (g/cm3), according to KOSHA (2022) [19]. The density used in this experiment was 2.6 g/cm3. It was not easy to directly observe the small particles; therefore, an indirect and cost-effective measure was used. This method, which used turbidity measurements, had many potential benefits when compared with the time-consuming standard filtration and gravimetric methods. Turbidity, as a surrogate for sediment concentration, offered an attractive solution (Gippel 1989, 1995; Lawler and Brown 1992) [20,21,22], and Riley (1998) [23] verified the accuracy of this indirect method. To apply this method to sediment flocculation analysis, it was assumed that turbidity was only a function of sediment concentration. In addition, particle sizes and the number of flocs were analyzed to confirm the flocculation process. This study also assumed that particle sizes were the result of the flocculation process. The experiment was carried out in a cylindrical tank that had a diameter of 10 cm (Figure 4a). Its shape helped provide nearly constant flow characteristics and energy. The experiment was carried out by putting 400 mL of fluid into this tank. A stirrer (EUROSTAR 20) with an electric motor was used under the control of rpm (Figure 4b). Turbidity was measured using a turbidimeter (LTE-2000E), and an electronic scale (FX-2000i) whose accuracy weighs up to 10−4 g of kaolin was used (Figure 4c,d). For particle observation, an optical microscope was used and could magnify up to 40 times (Figure 4e). The samples required for observation were collected using a pipette that was capable of quantitative collection. A microscope camera (Axiocam 208) from ZEISS, which is mounted on an optical microscope, was used for the sample picture. The camera has a resolution of up to 4k.
The rpms generated for the mixing intensity inside the tank were 30, 60, 90, 100, 120, 150, 200, 250, 300, 400, and 500, and the averaging function of the turbidimeter was used to measure the turbidity (Table 1). The experiments were repeated three times under the same experimental conditions to minimize the uncertainty of the turbidity, and the turbidity measurement of each sample was also measured 10 times. The arithmetic average of the results was presented as a value. The overall experimental times were determined by performing preliminary experiments for each case of rpm. The equilibrium time without turbidity change was about 9 h at rpm 60 and about 14 h at rpm 30. However, in most cases, about 80% of the total turbidity change occurred within 120 min from the beginning of each experiment. Therefore, in this study, 120 min, which is a relatively short time, was regarded as the quasi-reaction time, and the sediment flocculation occurring within this time was observed in detail. As shown in Table 1, the kaolin was also divided into 0.02 g (Case A), 0.04 g (Case B), and 0.06 g (Case C) to confirm changes in the turbidity and particle sizes according to the amount of kaolin. Table 1 shows the measured factors, and all the experiments measured turbidity. Optical microscopic observations were performed for several cases to confirm the formation of flocculation. The experimental conditions are shown in Table 1.

3. Results of the Experiments

3.1. Turbidity

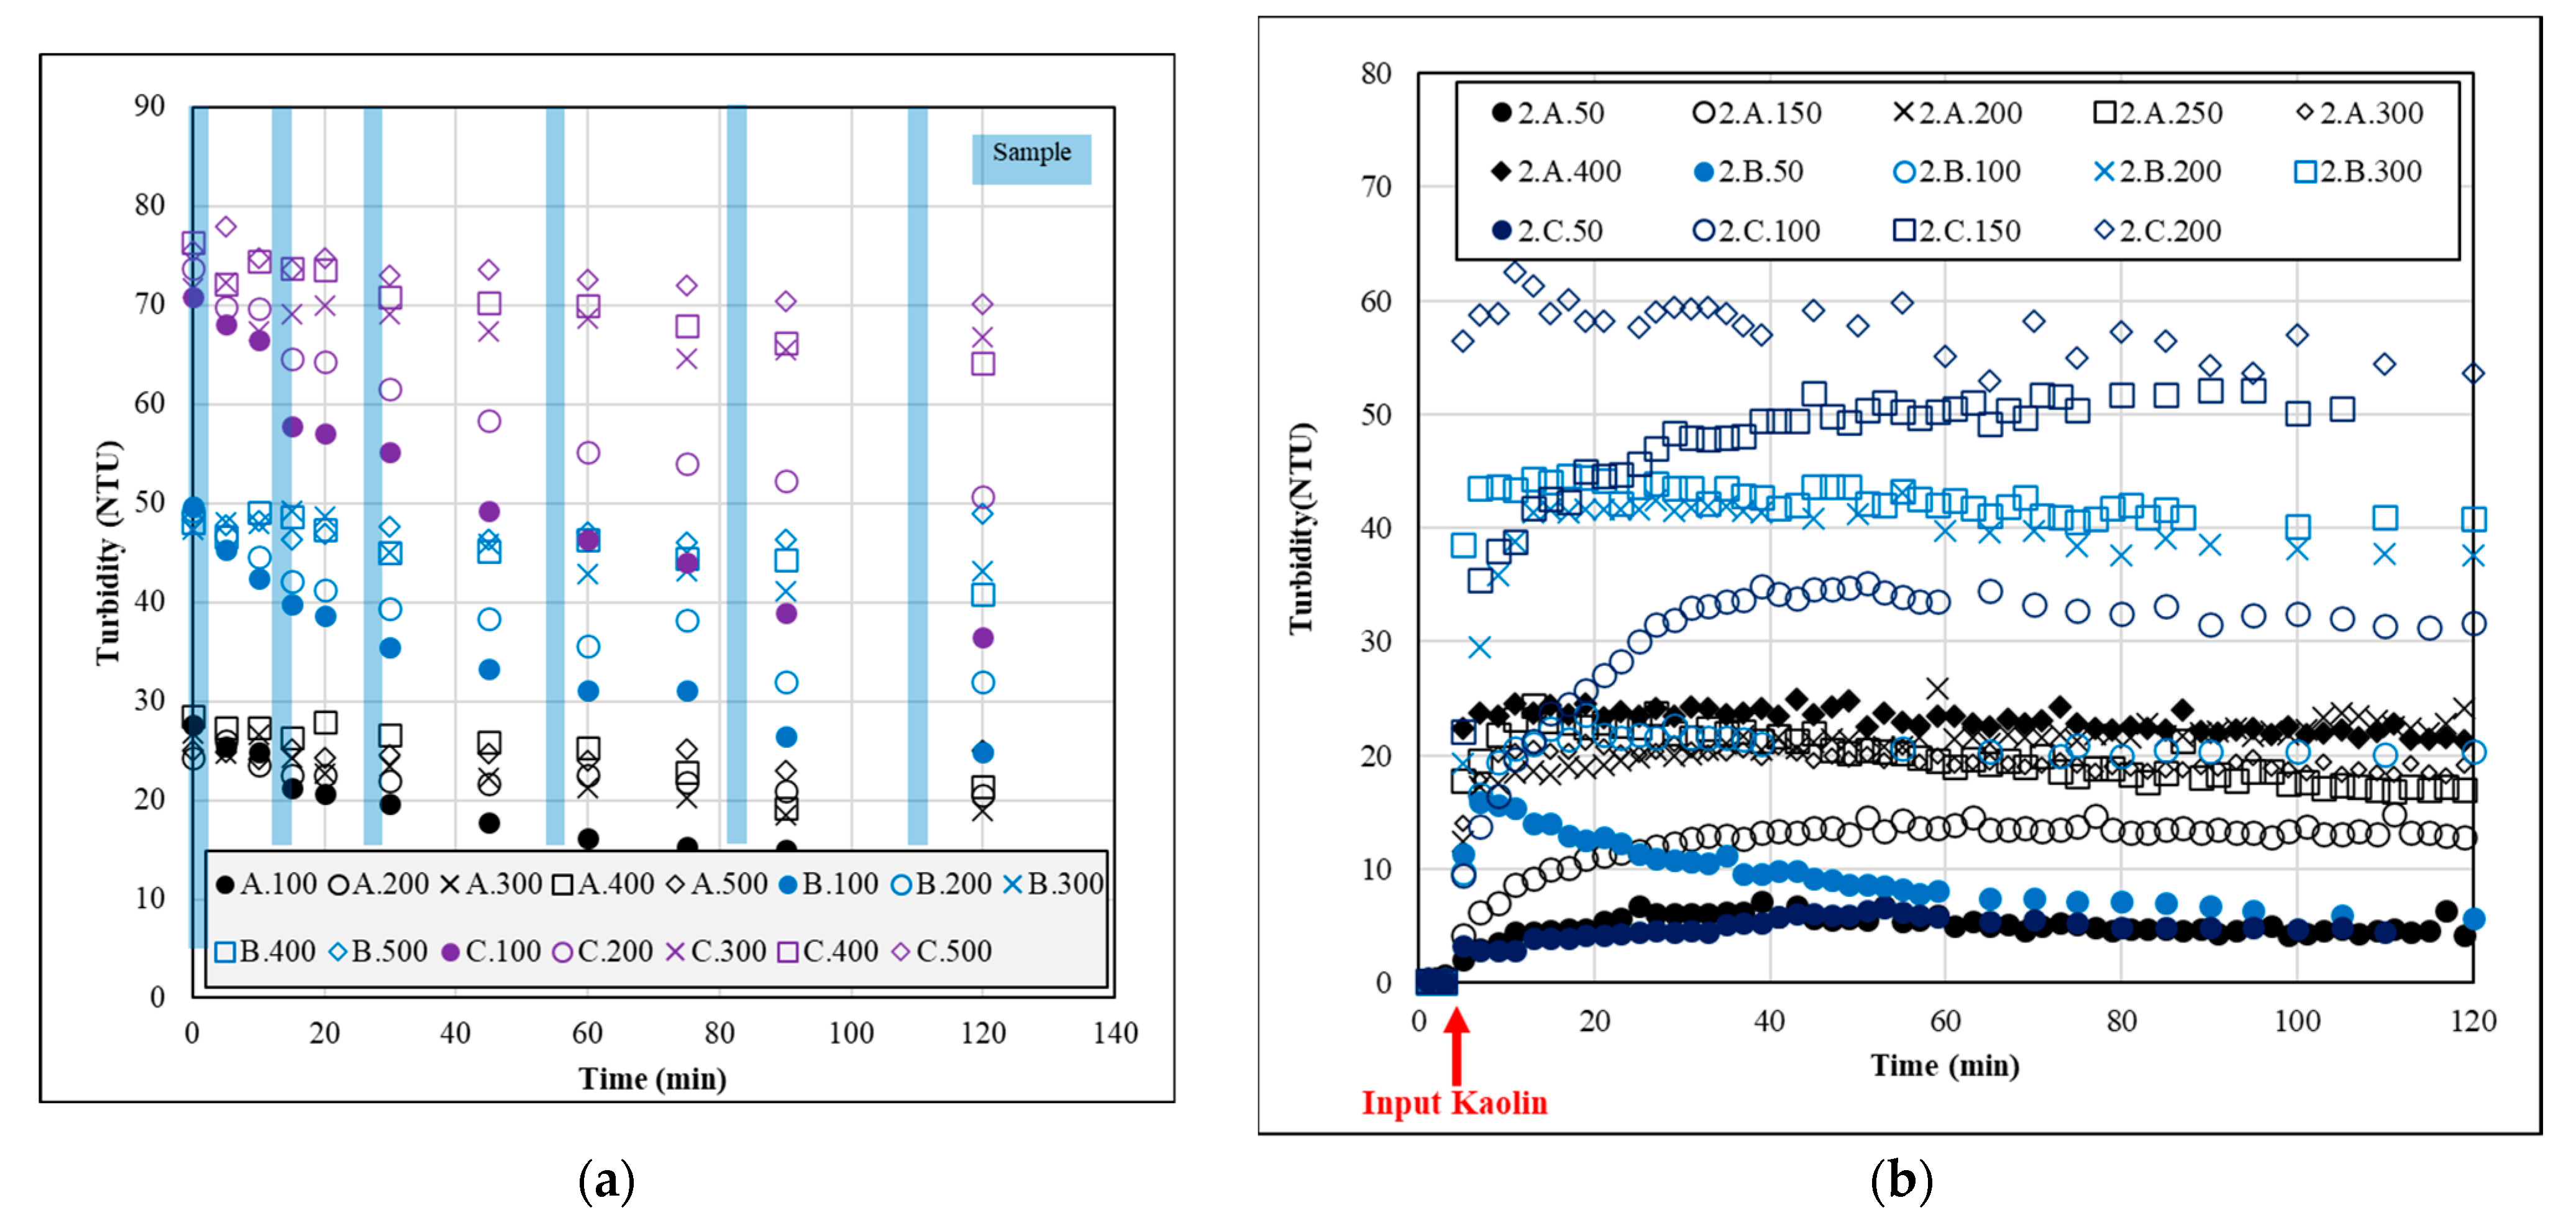
Changes in turbidity over time were observed for the three concentrations of kaolin (Figure 5). The measured turbidity decreased over time due to the flocculation of kaolin in the cylindrical tank (Figure 5a). Case 2, which is displayed in Figure 5b, showed a tendency for the turbidity to increase rapidly at the initial inflow of kaolin and then decrease over time, which was similar to Case 1. Velocity is responsible for the collision of particles (van Leussen 1994) [7], and flocculation increases with increasing turbulence due to the higher collision probability of particles (Dyer 1989) [24]. However, the presented results showed that the floc of single, cohesive, fine sediment did not reflect the general relationship between collision and flocculation.
Case 1 confirmed that the average turbidity increased as rpm increased. In addition, the increase in the rpm also decreased turbidity over time. The cause of the decrease in turbidity can be hypothesized as follows. First, the passage of time is related to the increase in large-sized flocs, which is caused by aggregation and sedimentation. At a low rpm, the change rate of turbidity is greater than at a high rpm because sedimentation is more dominant than flocculation. In contrast, at a high rpm, flocculation dominates sedimentation, so the turbidity change rate is smaller than at a low rpm (Figure 5a). Case 2 showed a similar pattern to Case 1. However, the initial turbidity increased rapidly immediately after inputting kaolin at 0 NTU. After that, the turbidity decreased over time. The turbidity change rate confirmed that the lower the rpm, the larger the amount of sediment that sinks without flocculation.

3.2. Particle Measurement

The observation of turbidity is an indirect measurement method, and it is difficult to accurately identify the process of flocculation. Therefore, in this study, flocculation was directly observed using an optical microscope, which can be magnified from 10 to 100. The microscope magnification was set to 40 times in consideration of the uncertainty that may occur depending on the floc diameter and window size. Figure 6a is the original image observed under an optical microscope after extracting 10 mL of solution from the tank. Images were extracted according to the time and rpm, as shown in Figure 6b. Image J was used for image processing, which is a public domain Java image processing and analysis program. It can calculate area and pixel value statistics for user-defined selections and measure distances and angles. It can also create density histograms and line profile plots. It supports standard image processing functions, such as contrast manipulation, sharpening, smoothing, edge detection, and median filtering.
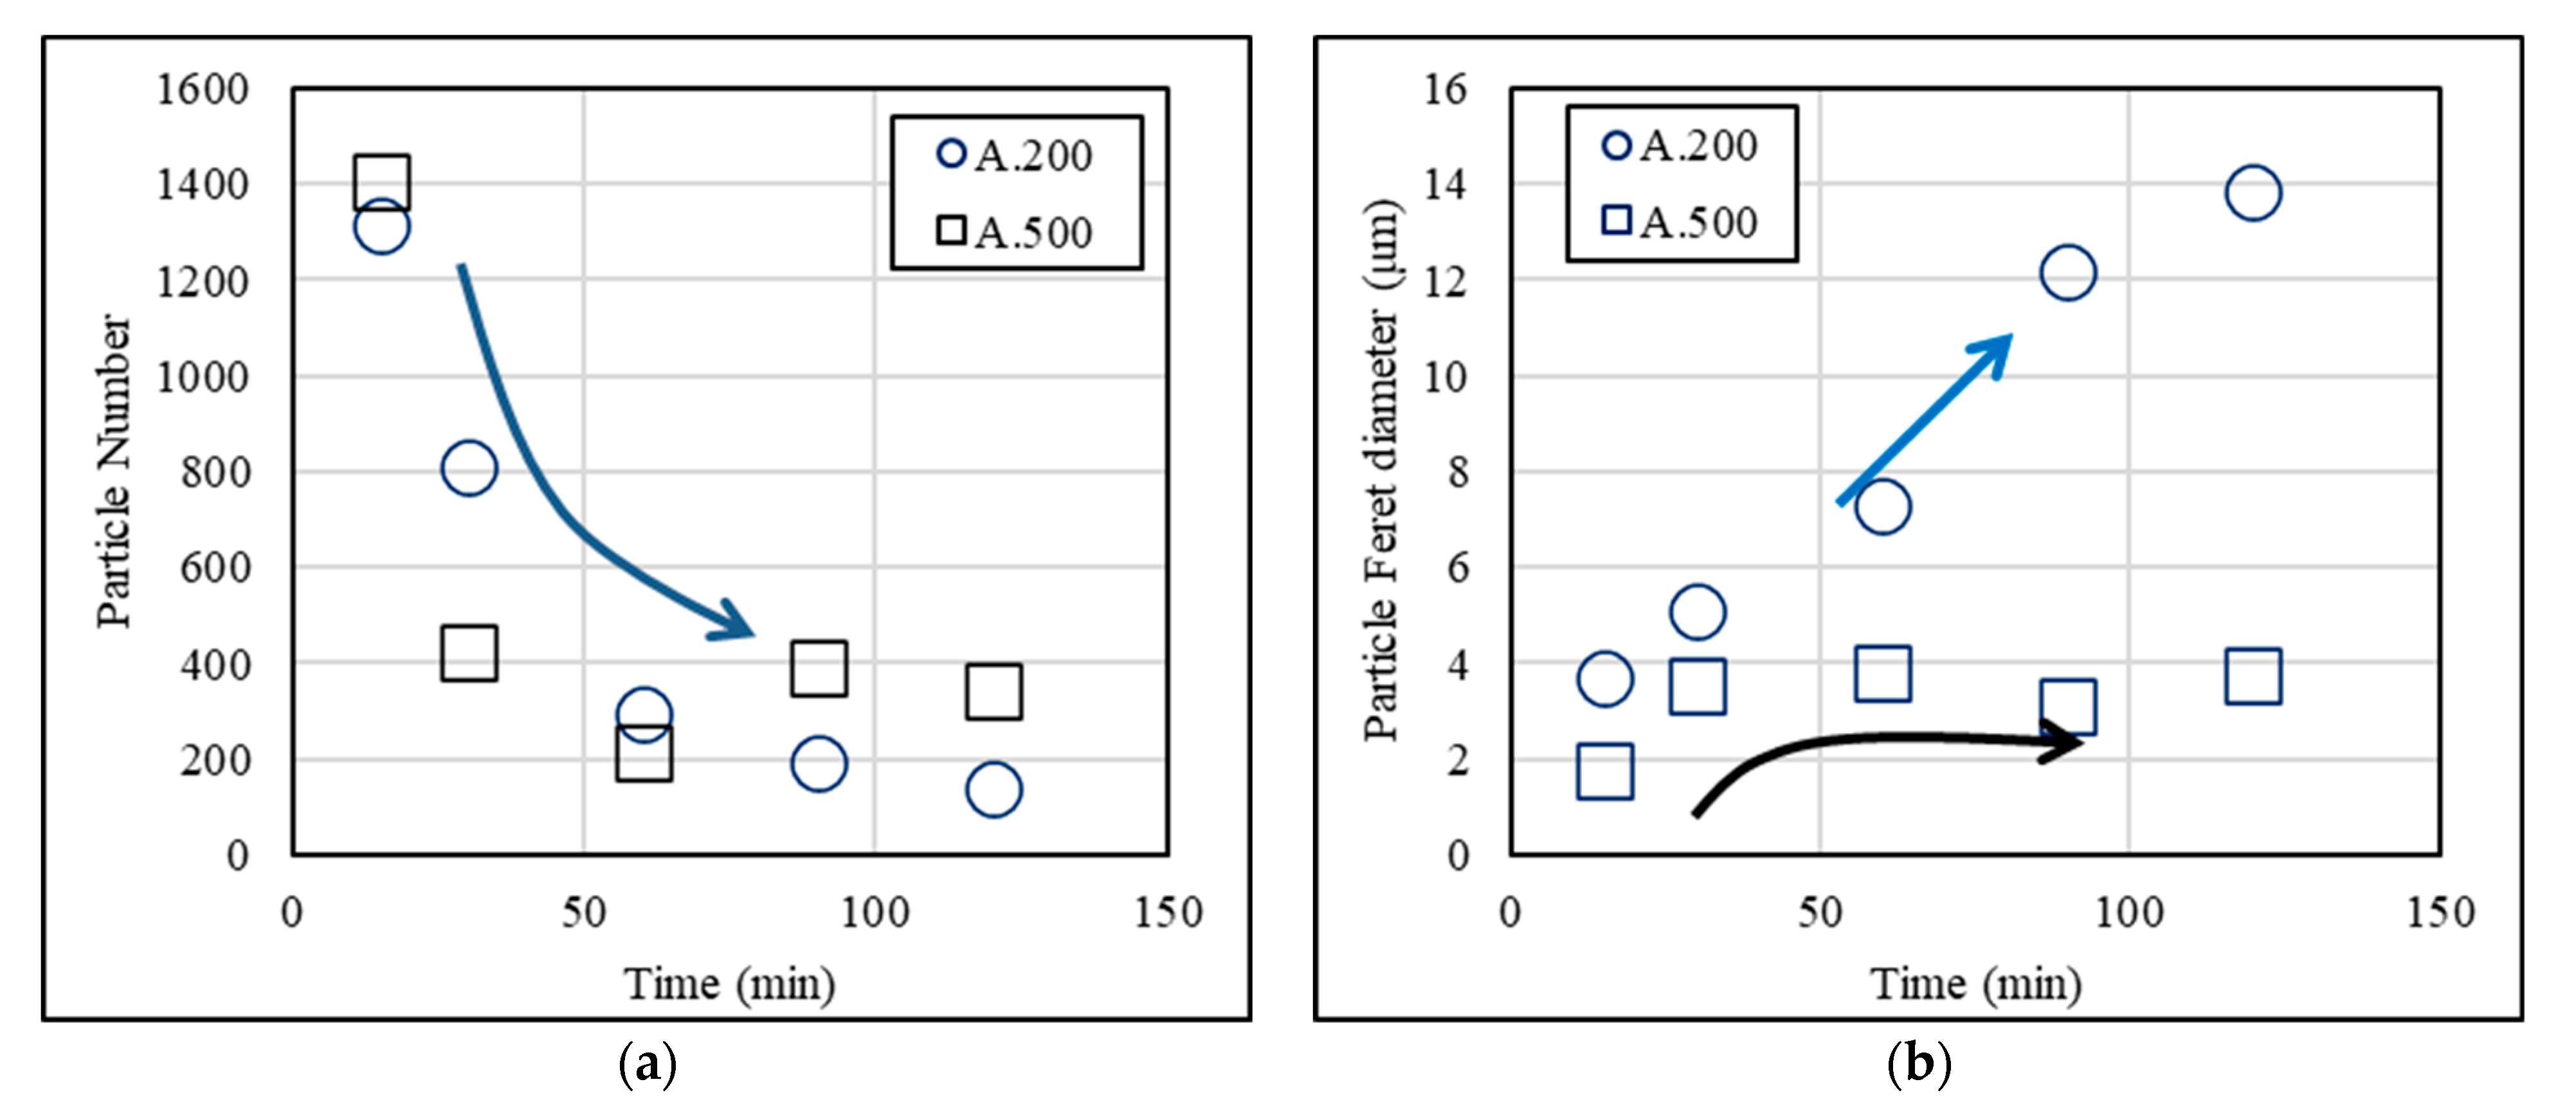
To verify the hypothesis previously established by turbidity measurement, the particle size and number of flocs were analyzed using images extracted by the optical microscope. Figure 7 shows differences in particle analysis results between rpm 200 and 500 under the condition of Case 1.A (kaolin 0.02 g). As shown in Figure 7a, the number of observed particles decreased over time, which was similar to the turbidity result. This appears to be due to the particles settling over time. In contrast, the Feret diameter results in Figure 7b show different patterns depending on the rpm. The Feret diameter is a measure of particle size along a specified direction. In general, it can be defined as the distance between the two parallel planes that restricts the object perpendicular to that direction. At low rpm, the size increased over time, but at a high rpm, it gradually increased and then became constant. This means that at a low rpm, the size gradually increased due to particle collision, but at high rpm, flocs actively performed aggregation and disaggregation at the same time. Therefore, as in the previous hypothesis, it was confirmed that the increase in the rpm caused the flocculation to act more dominantly than the sedimentation, and the change rate of the turbidity was small.

4. Discussion

Mixing intensity (GT) was applied to analyze the relationship between flow characteristics given by rpm and turbidity change over time. As described above, mixing intensity is a dimensionless number and is calculated by the velocity gradient (or the rpm in this experiment) and the mixing time. As shown in the Materials and Methods section, the dependent variable, turbidity, has different values depending on the initial concentration of kaolin. The turbidity over time was divided into the initial turbidity to make it dimensionless (Tt/Ti) and confirm the change rate of the turbidity, regardless of the concentration. Figure 8 shows the relationship between the mixing intensity and the turbidity change rate. According to Figure 8a, the GT and turbidity change rate showed the relationship between the three groups—regardless of the concentration, the turbidity change rate changed in three forms depending on the flow characteristics. Group 1 had a mechanism in which the turbidity changed due to sedimentation when the GT was less than 5.0 (×104) and the rpm was less than 100. Group 2 had a mechanism in which sedimentation or flocculation actively occurred when the rpm was between 200 and 300 with a GT of 20.0 (×104) or less. In contrast, in the rpm range of 400 to 500, the aspect was different and depended on the GT, but most had a mechanism in which resuspension, aggregation, and disaggregation were performed simultaneously.
GT is defined by the mixing time and velocity gradient. Among these two factors, the range of the velocity gradient, which is a flow characteristic, can explain the mechanism of flocculation. This is confirmed in Figure 8b. The turbidity change rate according to the rpm was analyzed at 120 min, which was assumed to be the equilibrium time. It was confirmed that the turbidity change rate showed a relationship, regardless of the initial concentration (0.005%, 0.010%, and 0.015%). The initial concentration is the weight concentration, which is expressed as the ratio of the weight of kaolin to the weight of the water. The density of water was assumed to be 1 g/cm3. Relationships appeared in the three groups as shown in Figure 8a. Since the time is the same, the velocity gradient by the rpm can be referred to as the GT. As a result, it was confirmed that the pattern of change rate appeared clearly for each group. However, when the velocity gradient was the same, the mixing time confirmed the process of flocculation. As shown in Figure 8c and the particle analysis results of Group 2, it was confirmed that the floc with a large particle area gradually increased over time and then decreased again. This result confirms the occurrence of floc aggregation and disaggregation. In Figure 7, up to the time of 90 min, the number of particles decreased, and the particle Feret diameter increased. This was due to aggregation. As shown in Figure 8c, the number of particles with a large area increased. However, after 90 min, as shown in Figure 8c, the total number of particles decreased, but the number of particles with small areas increased. At the same time, as shown in Figure 7b, the increase in the Feret diameter was an elongated ellipse due to the disaggregation of the floc. That is, the velocity gradient was constant, but the mixing time and GT value increased, indicating that this could affect the turbidity. In this study, the flow characteristics were expressed as GT, and the turbidity change rate and the number and size of the particles were analyzed to identify the mechanisms of flocculation, sedimentation, and resuspension.

5. Summary and Conclusions

The use of water has increased due to industrial development and urbanization. In the past, these changes have resulted in an increased inflow of pollutants into rivers. Managing the accumulation of pollutants in riverbeds is urgently needed. The natural purification capacity of rivers and lakes is deteriorating; therefore, water quality is also gradually deteriorating. However, analyzing the mechanisms of water contaminants is incomplete. Therefore, in this study, the formation process and behavior of floc were analyzed. Additionally, the flocculation of sediments and flow characteristics were studied, and quantitative analyses of fine sediment flocculation were performed by measuring major factors, such as the particle number, area, and Feret diameter of samples and their turbidity. The flow characteristics were the rpms of the stirrer. Experiments were conducted in Case 1, which was performed with a pre-mixed kaolin solution, and Case 2, which was performed by pouring kaolin into a water tank. To explain the flocculation process of kaolin, turbidity observation and particle analysis through a microscope were performed.
The flow characteristics that affect flocculation are presented as GT which can also be presented as G expressed as the velocity gradient and mixing time. The velocity gradient, G, is determined by the rpm. According to flow characteristics, flocculation mechanisms can be divided into three groups. We identified the dominant mechanism for each group. At an rpm below 100, which was Group 1, the turbidity change rate was large, and this was mostly due to sedimentation. In Group 2 (rpm 200~300), the sedimentation and flocculation reactions were mixed. In Group 3 (rpm 400~500), it was confirmed that continuous floc aggregation and disaggregation occurred rather than sedimentation at a high rpm. The increase in the mixing time eventually increased the mixing intensity. In Group 3, the aggregation and disaggregation processes increased repeatedly, resulting in a decrease in turbidity. Therefore, it was confirmed that the floc formation mechanisms, depositions, and resuspensions were different and depended on the mixing intensity (GT) and different flow characteristics.
Future studies should analyze the flocculation of various contaminants by the impact of hydraulic characteristics. In this study, we attempted to quantitatively analyze the relationship between turbidity and floc particle numbers; however, it was not easy to accurately count the flocs within a rotational flow. Additionally, this study does not reflect all of the factors related to the floc mechanism. Therefore, future studies should identify the floc mechanism in more detail and directly observe the concentration of flocs, their flow characteristics in open channels, and their relationship with turbulence characteristics.

Author Contributions

Conceptualization, D.H.K.; methodology, D.H.K.; validation, H.J.Y.; formal analysis, Y.J.B.; investigation, Y.J.B.; resources, Y.J.B.; data curation, H.J.Y.; writing—original draft preparation, D.H.K.; writing—review and editing, D.H.K.; visualization, D.H.K.; supervision, S.O.L.; project administration, S.O.L.; funding acquisition, S.O.L. All authors have read and agreed to the published version of the manuscript.

Funding

This research was supported by the Basic Science Research Program through the National Research Foundation of Korea (NRF) funded by the Ministry of Science, ICT & Future Planning (No.2021R1A2C2013158).

Institutional Review Board Statement

Not applicable.

Informed Consent Statement

Not applicable.

Data Availability Statement

Data sharing is not applicable to this article.

Conflicts of Interest

The authors declare no conflict of interest.

References

  1. Ahlf, W.; Hollert, H.; Neumann-Hensel, H.; Ricking, M. A guidance for the assessment and evaluation of sediment quality a German Approach based on ecotoxicological and chemical measurements. J. Soils Sediments 2002, 2, 37–42. [Google Scholar] [CrossRef]
  2. Bubakova, P.; Pivokonsky, M.; Filip, P. Effect of shear rate on aggregate size and structure in the process of aggregation and at steady state. Powder Technol. 2013, 235, 540–549. [Google Scholar] [CrossRef]
  3. Camp, T.R.; Stein, P.C. Velocity gradients and internal work in fluid motion. J. Boston Soc. Civ. Eng. 1943, 30, 219–237. [Google Scholar]
  4. Chapman, P.M. Current approaches to developing sediment quality criteria. Environ. Toxicol. Chem. Int. J. 1989, 8, 589–599. [Google Scholar] [CrossRef]
  5. Christie, M.C.; Quartley, C.P.; Dyer, K.R. The development of the POST system for in-situ intertidal measurements. In Proceedings of the 7th International Conference on Electrical Engineering in Oceanography, Southampton, UK, 23–25 June 1997; IET: London, UK, 1997; Volume 439, pp. 39–45. [Google Scholar]
  6. Ditschke, D.; Markofsky, M. A non-equilibrium, multi-class flocculation model. In Proc. SEDYMO International Symposium; Hamburg University of Technology: Hamburg, Germany, 2006. [Google Scholar]
  7. Dyer, K.R. Sediment processes in Estuaries: Future research requirements. J. Geophys. Res 1989, 94, 14327–14332. [Google Scholar] [CrossRef]
  8. Forstner, U.; Muller, G. Schwermetalle in Flussen und Seen; Springer: Heidelberg, Germany, 1974; p. 225. [Google Scholar]
  9. Gippel, C.J. The use of turbidimeters in suspended sediment research. Hydrobiologia 1989, 176, 465–480. [Google Scholar] [CrossRef]
  10. Gippel, C.J. Potential use of turbidity monitoring for measuring the transport of suspended solids in streams. Hydrol. Process. 1995, 9, 83–99. [Google Scholar] [CrossRef]
  11. Gonzalez, R.; Ciavola, P.; Corbau, C.; Falati, S.; Ferreira, O. Mixing depth experiments on an estuarine dissipative beach; St.Georges Beach, Gironde (France). J. Coast. Eng. 2004, 20, 43–52. [Google Scholar]
  12. Hollert, H.; Duerr, M.; Erdinger, L.; Braunbeck, T. Cytotoxicity of settling particulate matter and sediments of the Neckar River (Germany) during a winter flood. Environ. Toxicol. Chem. 2000, 19, 528–534. [Google Scholar] [CrossRef]
  13. Hollert, H.; Keiter, S.; König, N.; Rudolf, M.; Ulrich, M.; Braunbeck, T. A new sediment contact assay to assess particle-bound pollutants using zebrafish (Danio rerio) embryos. J. Soils Sediments 2003, 3, 197–207. [Google Scholar] [CrossRef] [Green Version]
  14. Kapsimalis, V.; Masse, L.; Tastet, J.P. Tidal impact on modern sedimentary facies in the Gironde Estuary, southwestern France. J. Coast. Res. 2004, 20, 1–11. [Google Scholar]
  15. KOSHA, Material Safety Data Sheet. Kaolin. 2022. Available online: https://msds.kosha.or.kr/ (accessed on 1 January 2023.).
  16. Kühn, G.; Jirka, G.H. Fine Sediment Behavior in Open Channel Turbulence: An Experimental Study; Vortrag: Saga, Japan, 2005. [Google Scholar]
  17. Lawler, D.M.; Brown, R.M. A simple and inexpensive turbidity meter for the estimation of suspended sediment concentrations. Hydrol. Process. 1992, 6, 159–168. [Google Scholar] [CrossRef]
  18. Manning, A.J.; Dyer, K.R.; Lafite, R.; Mikes, D. Flocculation Measured by video based instruments in the Gironde estuary during the european commission SWAMIEE project. J. Coast. Res. 2004, 20, 58–69. [Google Scholar]
  19. Müller, V.; Seibel, A.; Kisacik, D.; Gust, G. Simulation of Water Column Hydrodynamics by Benthic Chambers. Analysis 2007, 16, 3113–3130. [Google Scholar]
  20. Riley, S.J. The sediment concentration—Turbidity relation: Its value in monitoring at Ranger Uranium Mine. Northern Territory, Australia. Catena 1998, 32, 1–14. [Google Scholar] [CrossRef]
  21. Samcheon Pure Chemical Co., Ltd. Specification Sheet, Kaolin. 2022. Available online: http://www.samchun.com/ (accessed on 1 January 2023.).
  22. van Leussen, W. Estuarine Macroflocs and Their Role in Fine-Grained Sediment Transport. Ph. D. Thesis, University of Utrecht, Utrecht, The Netherlands, 1994. [Google Scholar]
  23. Yahaya, S.; Jikan, S.S.; Badarulzaman, N.A.; Adamu, A.D. Chemical composition and particle size analysis of Kaolin. Path Sci. 2017, 3, 1001–1004. [Google Scholar] [CrossRef]
  24. Zhu, Z.; Wang, H.; Yu, J.; Dou, J. On the kaolinite floc size at the steady state of flocculation in a turbulent flow. PLoS ONE 2016, 11, e0148895. [Google Scholar] [CrossRef] [PubMed] [Green Version]
Figure 1. Sediment transport and flocculation.
Sustainability 15 04073 g001
Figure 2. The entire process of the experiment.
Sustainability 15 04073 g002
Figure 3. Experimental concept. (a) Case 1. (b) Case 2.
Sustainability 15 04073 g003
Figure 4. Experimental equipment: (a) setup of the experiment, (b) stirrer, (c) electronic scale, (d) turbidimeter, and (e) optical microscope.
Sustainability 15 04073 g004aSustainability 15 04073 g004b
Figure 5. Turbidity with time: (a) Case 1 and (b) Case 2.
Sustainability 15 04073 g005
Figure 6. Particle observation with rpm and time: (a) the original image and (b) the results after image processing.
Sustainability 15 04073 g006
Figure 7. (a) Particle number decreased with time under all rpm conditions (b) However, the particle Feret diameter is a different aspect depending on the rpm. When the rpm is 200, it continuously increases with time, but when the rpm is 500, it increases and then becomes constant.
Sustainability 15 04073 g007
Figure 8. Flocculation mechanism: (a) turbidity change rate with GT; (b) turbidity change rate with rpm (t = 120 min); and (c) particle number with time and area (rpm = 200).
Sustainability 15 04073 g008aSustainability 15 04073 g008b
Table 1. Conditions of the experiments. ⊙ represents the turbidity and ★ represents the optical microscope.
Case 1KaolinRPMRemarksCase 2KaolinRPMRemarks
1.A.300.05g/L
(0.02g(A))
302.A.500.05g/L
(0.02g(A))
50
1.A.60602.A.100100
1.A.90902.A.150150
1.A.100100⊙★2.A.200200
1.A.1201202.A.250250
1.A.1501502.A.300300
1.A.200200⊙★2.A.400400
1.A.250250---
1.A.300300⊙★---
1.A.400400⊙★---
1.A.500500⊙★---
1.B.1000.04g(B)100⊙★2.B.500.04g(B)50
1.B.200200⊙★2.B.100100
1.B.300300⊙★2.B.200200
1.B.400400⊙★2.B.300300
1.B.500500⊙★----
1.C.1000.06g(C)100⊙★2.C.500.06g(C)50
1.C.200200⊙★2.C.100100
1.C.300300⊙★2.C.200200
1.C.400400⊙★2.C.300300
1.C.500500⊙★----
Disclaimer/Publisher’s Note: The statements, opinions and data contained in all publications are solely those of the individual author(s) and contributor(s) and not of MDPI and/or the editor(s). MDPI and/or the editor(s) disclaim responsibility for any injury to people or property resulting from any ideas, methods, instructions or products referred to in the content.