Article

Effect of Nitrification Inhibitors on Photosynthesis and Nitrogen Metabolism in ‘Sweet Sapphire’ (V. vinifera L.) Grape Seedlings

1
Department of Horticulture, Agricultural College of Shihezi University, Shihezi 832003, China
2
Key Laboratory of Special Fruits and Vegetables Cultivation Physiology and Germolasm Resources Utilization of the Xinjiang Production and Construction Crops, Shihezi University, Shihezi 832003, China
*
Author to whom correspondence should be addressed.
Sustainability 2023, 15(5), 4130; https://doi.org/10.3390/su15054130
Submission received: 18 January 2023 / Revised: 21 February 2023 / Accepted: 22 February 2023 / Published: 24 February 2023

Abstract

:
Nitrogen loss after urea application and the low nitrogen utilization rate of plants are major issues in fertilizer application. We therefore adopted a combination of urea and 3,4-dimethylpyrazole phosphate (DMPP) applications in order to investigate the response of DMPP in ‘sweet sapphire’ (V. vinifera L.) grape seedlings growth. Three combinations of DMPP and urea were tested to screen suitable DMPP application concentrations for grape seedlings’ growth. Transcriptome differential expression analysis was adopted to elucidate the regulation mechanism of DMPP. The results showed that the application of DMPP with urea significantly increased grape seedlings’ root dry weight, as well as the above-ground dry weight. The application of DMPP with urea significantly improved the total root length, surface area, volume, and root vigor. The application of urea nitrogen content with 1% of DMPP (T2) showed optimum effects. The application of DMPP can also significantly increase the net photosynthetic rate, photosynthetic pigments, and fluorescence intensity of grape leaves. Furthermore, the transcriptome differential expression analysis under T2 treatment revealed that members of the Nar (7) and NRT (12) gene families were up-regulated, which promotes nitrogen uptake and metabolism. Moreover, the LHC (11), Psa (7), Pet (4), and Psb (5) genes were up-regulated, which promotes photosynthesis.

1. Introduction

Grape is a berry fruit of the genus Vitis L. in the family Vitaceae. It is native to Europe and western Asia and is mostly found in temperate and subtropical zones. In recent years, ‘Sweet sapphire’ has been the most popular grape variety due to its excellent quality for storage and transportation, naturally seedless state, and comparatively more resistance to disease as compared to other Eurasian species. However, Sweet sapphire requires more nitrogen or frequent fertilization for growth and development [1].
Nitrogen is one of the most important nutrients required for grape seedlings’ growth and development and is also a major component of protein, chlorophyll, and photosynthetic enzymes. Nitrogen is important for photosynthesis and, therefore, it plays a significant role in crop or fruit yield [2,3]. In order to achieve higher economic returns, farmers often apply larger amounts of nitrogen fertilizer [4,5]. Urea is a widely used nitrogen fertilizer in agricultural production. However, after application, urea typically remains in the soil as inorganically or organically bound N. A part of the nitrogen is lost from the soil–plant systems to the environment through ammonia (NH3) volatilization, denitrification, nitrous oxide (N2O) emissions, nitrate leaching, or runoff. These lead to environmental problems such as water pollution and increased greenhouse gas emissions, resulting in low urea utilization [6,7,8,9].
3,4-dimethylpyrazole phosphate (DMPP) is considered one of the effective measures to improve nitrogen fertilizer utilization, promote crop production, and reduce environmental pollution. In recent years, the mechanism through which DMPP inhibits soil nitrification has been investigated [10]. DMPP reduced the NO3-N concentration by inhibiting the abundance of AmoA. DMPPS encodes the first subunit of aminomonooxygenase (AMO), thereby reducing NO3-N [11,12,13,14]. According to some studies, DMPP application may increase the amount of NH4+-N in the soil and convert it to NH3 [15,16]. Tobias et al. found that nitrification inhibitor application can increase the NH4+-N concentration and decrease NO3-N production [17]. Recently, nitrification inhibitors have been used on field crops, and one study found that urea used in conjunction with nitrification inhibitors reduced soil nitrogen loss and increased wheat yields when compared to conventional N application rates [18]. In a study by Sha Zhipeng et al., it was found that nitrification inhibitors can increase soil nitrogen retention, thereby improving N fertilizer utilization and reducing N losses [19]. In addition, DMPP was found to increase the NH4+-N content of grassland soil and reduce the accumulation of N2O emissions [20,21]. However, little research has been reported on the effects of nitrification inhibitors on regulating the ratio of nitrogen forms in grapes. In this study, three DMPP concentrations were applied to ‘sweet sapphire’ (V. vinifera L.) grape seedlings, and a control (CK) without DMPP was used as a comparison. The responses of DMPP application on grape seedlings’ growth, photosynthesis, nitrogen metabolism, and transcriptome differential expression with GO and KEGG pathways were analyzed. The aims of this study were to identify the suitable DMPP concentration for grape seedlings and to expound the mechanism of DMPP in activating the signaling pathway.

2. Materials and Methods

2.1. Overview of the Experimental Site

The experiment was conducted in the greenhouse of the comprehensive experimental station of the Faculty of Agriculture of Shihezi University in 2022. The grape seedlings were planted in cultivation bags of 27 cm (height) × 30 cm (diameter) with a substrate of field soil: organic matter = 2:1. The seedling distance was 40 cm × 80 cm. Soil moisture was controlled to between 25 and 35% with an automatic irrigation system. The soil pH was 8.12. Soil organic matter, total nitrogen content, alkaline decomposition nitrogen, fast-acting phosphorus, and fast-acting potassium contents were 28.60 g kg−1, 0.64 g kg−1, 50.86 mg kg−1, 49.68 mg kg−1, and 46.48 mg kg−1, respectively.

2.2. Experimental Design

In this study, two-year-old ‘sweet sapphire’ (V. vinifera L.) grape seedlings with a height of 15–20 cm, 4–5 functional leaves, and a strong root system were used. The nitrogen fertilizer was urea (N = 46%). The phosphate fertilizer was potassium dihydrogen phosphate (P2O5 = 52%, K2O = 34%) and water-soluble potassium sulphate (K2O = 52%). The nitrification inhibitor was 3,4-dimethylpyrazole phosphate (DMPP = 95%). In the experiment, a randomized complete block design was adopted. The conventional fertilizer application of 10.87 g/seedling urea, 4.81 g/seedling potassium phosphate, and 6.46 g/seedling water-soluble potassium sulphate was used as the control (CK). Based on the urea application concentration of CK, 0.5% DMPP of urea nitrogen content (T1), 1% DMPP of urea nitrogen content (T2), and 2% DMPP of urea nitrogen content (T3) were added. The phosphate and potassium fertilizer application was the same as the control. There were 15 seedlings in each treatment. The fertilizers were dissolved in 1 L of water before being irrigated into cultivation bags. Throughout the trial, seedling management was consistent across all treatments.

2.3. Assay Items and Methods

2.3.1. Seedlings Biomass Analysis

Three grape seedlings were randomly selected from each treatment and sampled 90 days after fertilizer application. Each treatment had three replications. Seedling roots were quickly collected and washed on a 100-mesh steel screen to minimize root loss. The above-ground vines were divided into stems and leaves and then rinsed three times with water, 1% hydrochloric acid, and deionized water. After washing, the roots, stems, and leaves were oven dried at 105 °C for 30 min and then at 80 °C for 48 h. The seedling samples were then weighed, respectively.

2.3.2. Roots Phenotype Characteristics Analysis

Three grape seedlings were chosen at random for each treatment 90 days after fertilization, with three replicates. The roots were washed and scanned using an EPSON Expression 2400 Scanner (EPSON, Suwa, Nagano Prefecture, Japan). The scanned images were analyzed using WinRHIZO image analysis software (Regent Instrument Inc., Québec City, Canda) to obtain the total root surface area (cm2), total root length (cm), and total root volume (cm3).
In this study, TTC (2, 3, 5- triphenylammonium tetrachloride) method was used to determine root activity [22]. First, 0.3 g of root tips were removed from each sample, then a 0.4% TTC solution, 0.1 mol/L phosphate buffer (pH = 7.0), and 2 mL 1 mol/L sulfuric acid were added to the beaker. Then, ethyl acetate and quartz sand were added and ground. Finally, ethyl acetate was added to the ground solution, and its absorbance at 485 nm was measured. According to the standard curve, we calculated the TTC content.
TTC = TTC   reduction   volume   g Root   weight   g × Time   h

2.3.3. Photosynthetic Pigment Content Analysis

The concentration of chlorophyll was determined by the colorimetric method. After treatment for 15, 30, 60, and 90 days, the freshly harvested grape leaves were cut into small segments (0.2 g) and soaked in 20 mL of the extraction reagent (80% acetone and 95% ethanol) in the dark for 24 h. Then, the leaf extracts were measured at 663 nm and 645 nm, and the concentrations of total chlorophyll, chlorophyll a, and chlorophyll b were calculated, and the light absorption values were measured at 470 nm to calculate carotenoids.

2.3.4. Photosynthetic Parameters Measurement

At 15, 30, 60, and 90 days after treatment, three seedlings with the same growth conditions (equal seedling height and ground diameter) were selected from each treatment. Three fully developed mature leaves from the middle part of each seedling were selected and labeled. The net photosynthetic rate (Pn), intercellular CO2 concentration (Ci), transpiration rate (Tr), and stomatal conductance (Gs) were measured using the LI-6800 portable photosynthesis system apparatuses (LI-COR) and portable photosynthesiser. The average value of three leaves of measured data was one replication. For each treatment, three seedlings were measured as three replications.

2.3.5. Chlorophyll Fluorescence Parameters Measurement

Chlorophyll fluorescence parameters were determined using an Imaging-PAM (IMAG-MINI; Walz, Effeltrich, Germany). At 15, 30, 60, and 90 days after treatment, three functional leaves were selected and labeled for each seedling. The average value of three leaves of measured data was one replication. For each treatment, three seedlings were measured as three replications. The measurement time was between 10:30 and 12:00 a.m. After measurement, the same leaves were dark-treated for 30 min with dark-adapted clamps for the dark response. The labeled leaves were tagged for subsequent measurement.

2.3.6. RNA Extraction and Transcriptome Sequencing

Fresh leaves and roots of grape seedlings were collected at 60 days after treatment from three seedlings as three replicates. After 60 days of treatment, 3 grape seedlings were selected from the CK and t2 treatments. Each sample had 3 biological replicates, and the roots and leaves were then isolated and quick-frozen in liquid nitrogen. As per the manufacturer’s instruction, total RNA was extracted using the HiPure Plant RNA Mini Kit. RNA integrity was evaluated using the Agilent 2100 Bioanalyzer (Agilent Technologies, Santa Clara, CA, USA). Only samples with RNA integrity number (RIN) ≥7 were used for subsequent analysis. The libraries were constructed using the TruSeq Stranded mRNA LTSample Prep Kit (Illumina, San Diego, CA, USA). These libraries were sequenced on the Illumina sequencing platform, and 125 bp/150 bp paired-end reads were generated. Then, differential expression analysis across samples was conducted in the edgeR package to obtain DEGs (FDR < 0.05, |log2FC| > 1) [23]. To identify significantly enriched GO terminology and metabolic pathways, gene ontology (GO) and the Kyoto Encyclopedia of Genes and Genomes (KEGG) were used for analysis. GO enrichment analysis was conducted in the GOSeq R program, and KEGG pathway analysis was conducted using the KEGG Orthology program [24]. Finally, the part we wanted to obtain was selected for subsequent analysis through calculation and screening.

2.4. Statistical Analysis

All statistical analyses were performed using a one-way analysis of variance (ANOVA) using SPSS 26.0 (SPSS Inc., Chicago, IL, USA). The LSD multiple range test was used to compare the two groups. The Tukey test was used to calculate the mean difference with a significance level of 5%, and Origin 2022 and TBtools were used for plotting.

3. Results

3.1. Effect of DMPP on Grape Seedlings Biomass

The effects of DMPP on the total biomass, above-ground biomass, and roots biomass of grape seedlings are shown in Table 1. Compared with CK, when DMPP application concentrations were from 0.5% to 1% of the urea nitrogen content, seedlings’ biomass significantly increased. When DMPP application concentrations reached 2% of the nitrogen content of urea, the increasing effect on seedlings’ biomass was reduced. Compared with CK, the total biomass for grape seedlings treated with 0.5% (T1), 1% (T2), and 2% (T2) DMPP increased by 18.42%, 52.22%, and 7.78%, respectively. Moreover, grape seedlings’ above-ground biomass increased by 18.30%, 43.22%, and 7.17%, respectively. Grape seedlings’ roots biomass increased by 18.74%, 77.71%, and 9.53%, respectively. The T2 treatment had significantly greater effects than T1 and T3 on total biomass, shoot biomass, and root biomass.

3.2. Effect of DMPP on Grape Roots Characteristics

In comparison with CK, the total root length, total root surface area, total root volume, and root vigor increased as the DMPP concentration increased (Table 2). The total root length was T2 > T1 > T3 > CK, and the differences among treatments were significant. Compared with CK, the total root surface area increased by 22.44%, 34.51%, and 12.93% in T1, T2, and T3, respectively. The total root surface area of T2 was significantly higher than those of CK but not significantly different from T1 and T3. The total root volume of T2 was significantly higher than that of CK, T1, and T3. The root vigor of the T2 treatment was significantly higher than that of CK and T3.

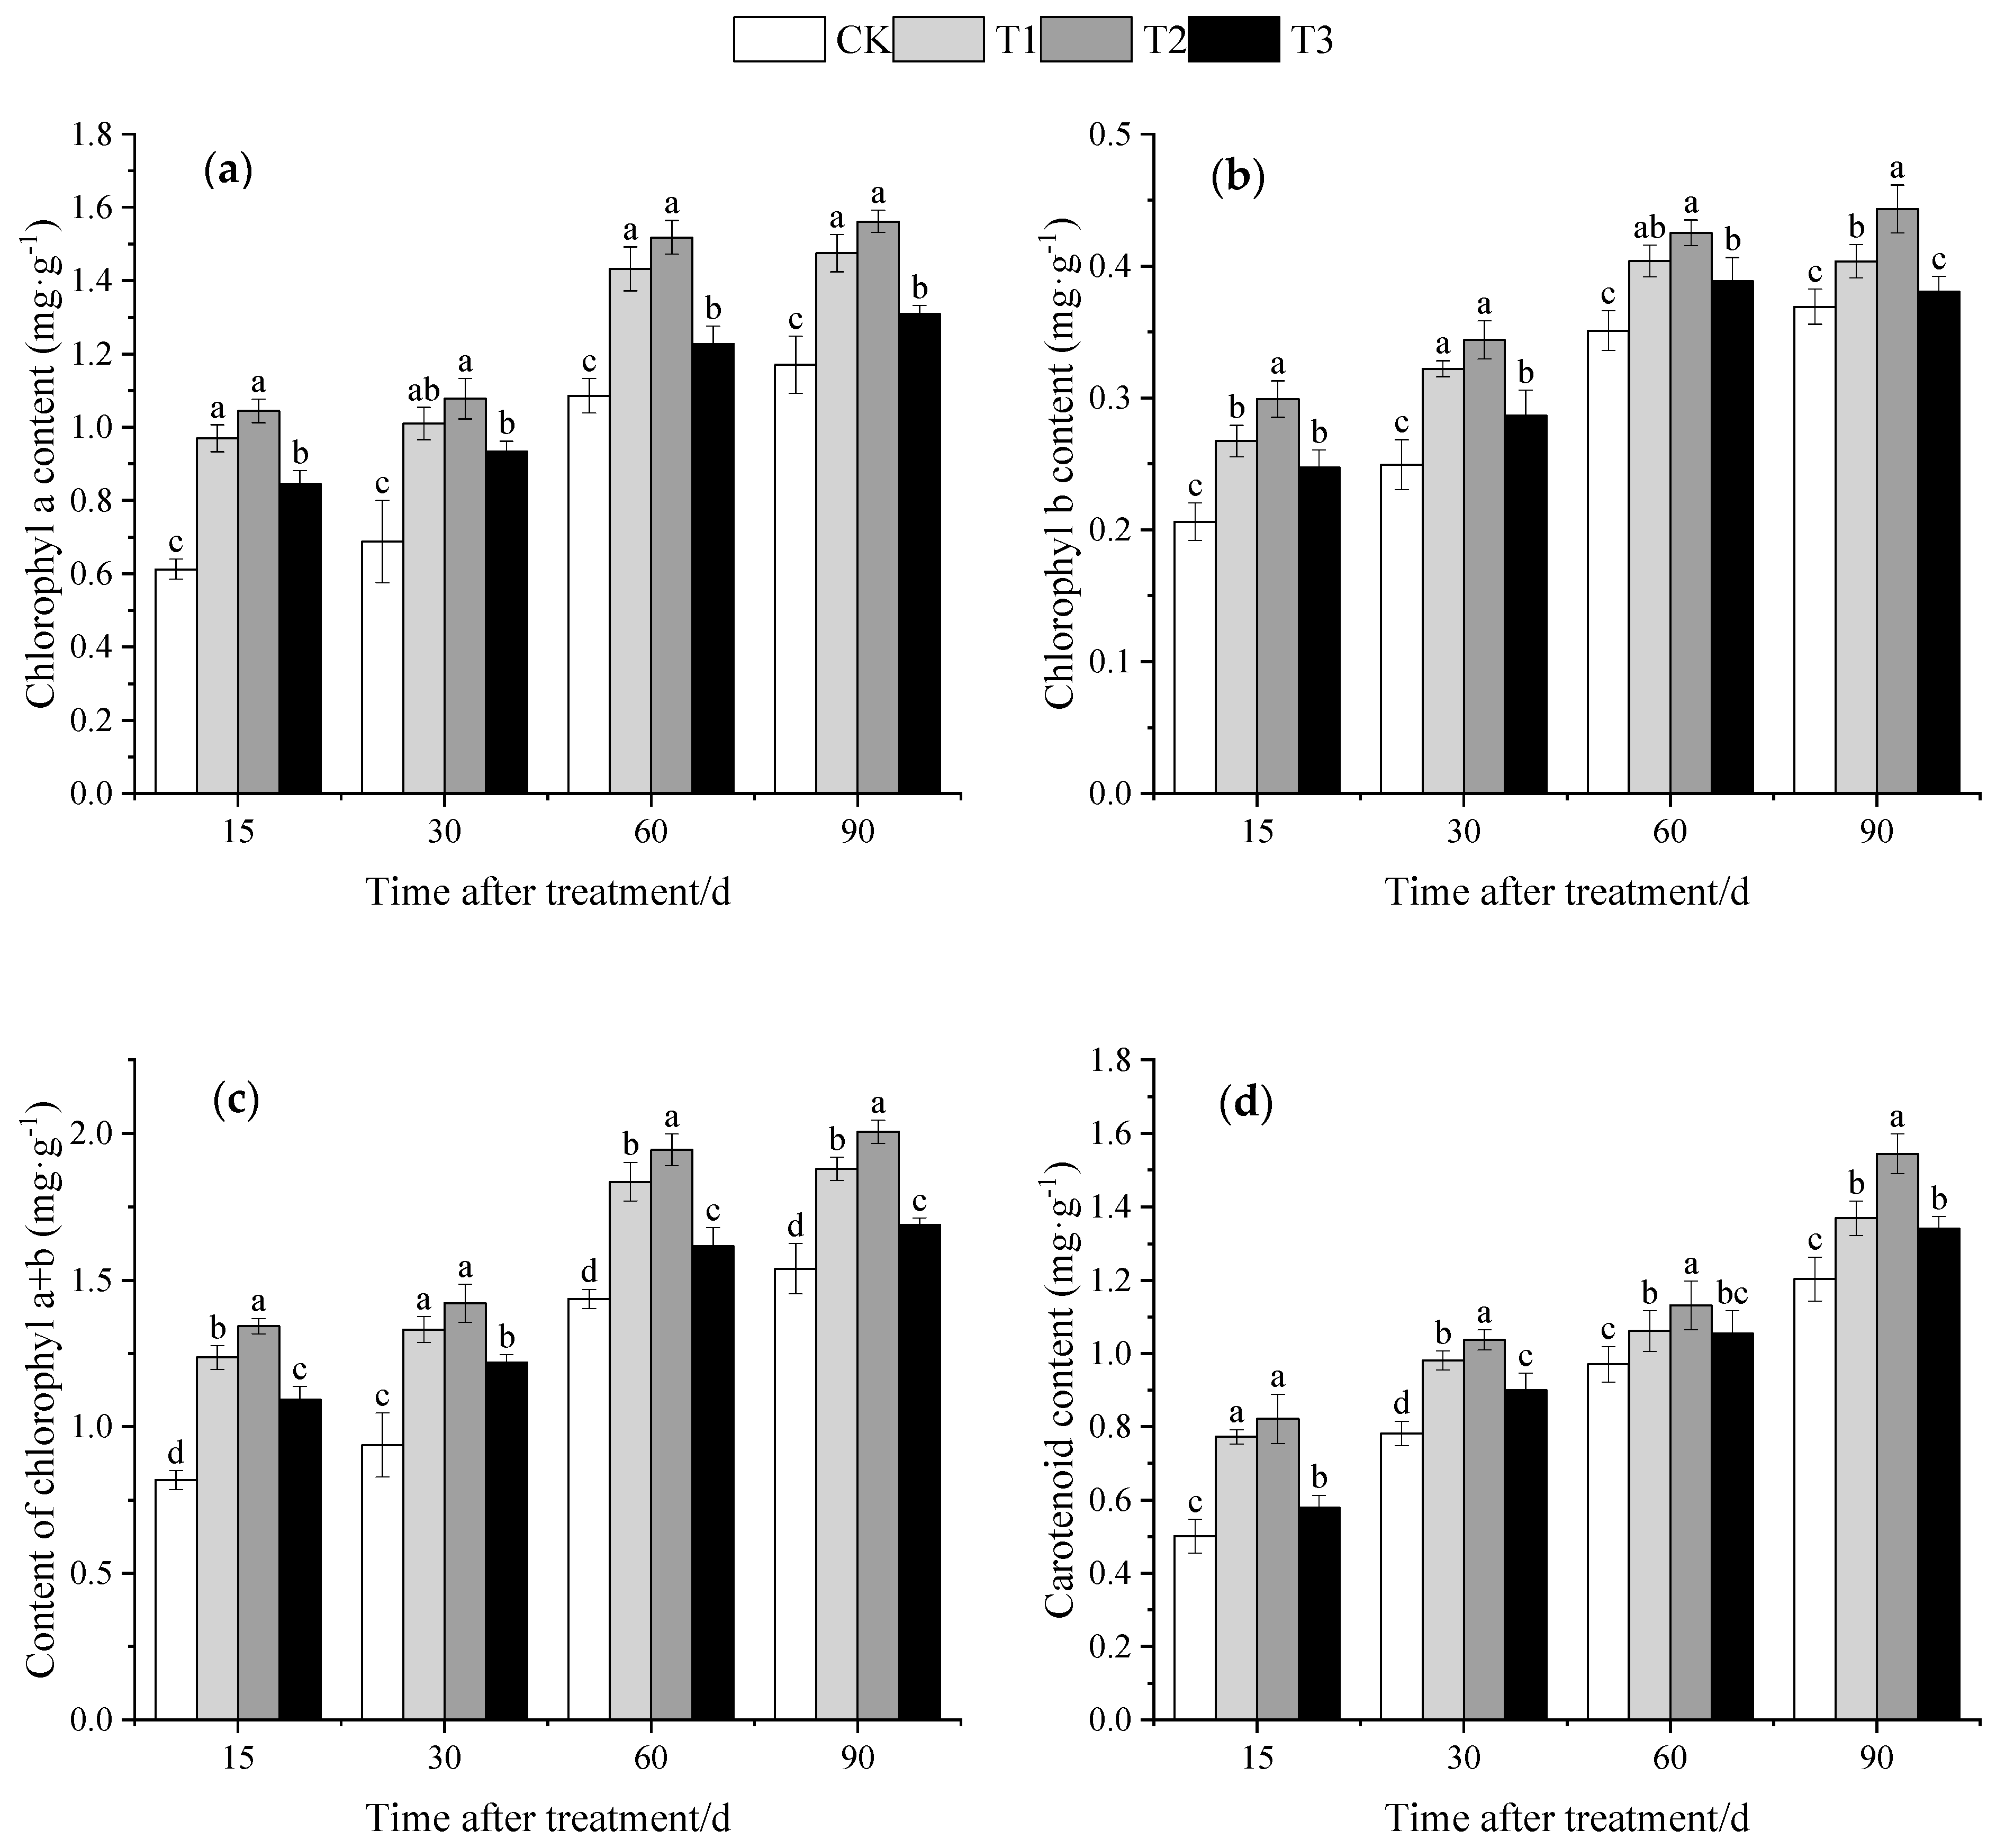
3.3. Effect of DMPP on Photosynthetic Pigment Contents of Grape Leaves

Changes in the photosynthetic pigment content of grape leaves are shown in Figure 1. With the development of grape seedlings, leaves’ chlorophyll a (Figure 1a), chlorophyll b (Figure 1b), chlorophyll a + b (Figure 1c), and carotenoids (Figure 1d) contents increased and followed the same trend. When compared to CK, DMPP application can significantly increase leaves’ photosynthetic pigment contents. This indicated that DMPP can improve the accumulation of photosynthetic pigments. The T2 treatment significantly accelerated the accumulation of photosynthetic pigments in grape leaves compared to T1 and T3.

3.4. Effect of DMPP on Photosynthetic Parameters of Grape Leaves

With the development of grape seedlings, the leaves’ transpiration rate (Tr) (Figure 2a), net photosynthetic rate (Pn) (Figure 2b), Intercellular CO2 concentration (Ci) (Figure 2c), and stomatal conductance (Gs) (Figure 2d) increased continuously. When compared to CK, DMPP application can significantly improve leaves’ photosynthetic parameters. Tr and Pn in the T2 treatment were significantly higher than in T1 and T3. Ci and Gs of grape leaves were significantly higher than CK after DMPP application, but there was little difference between DMPP treatments. This study found that applying DMPP to grape leaves increased Ci, Gs, and Pn.

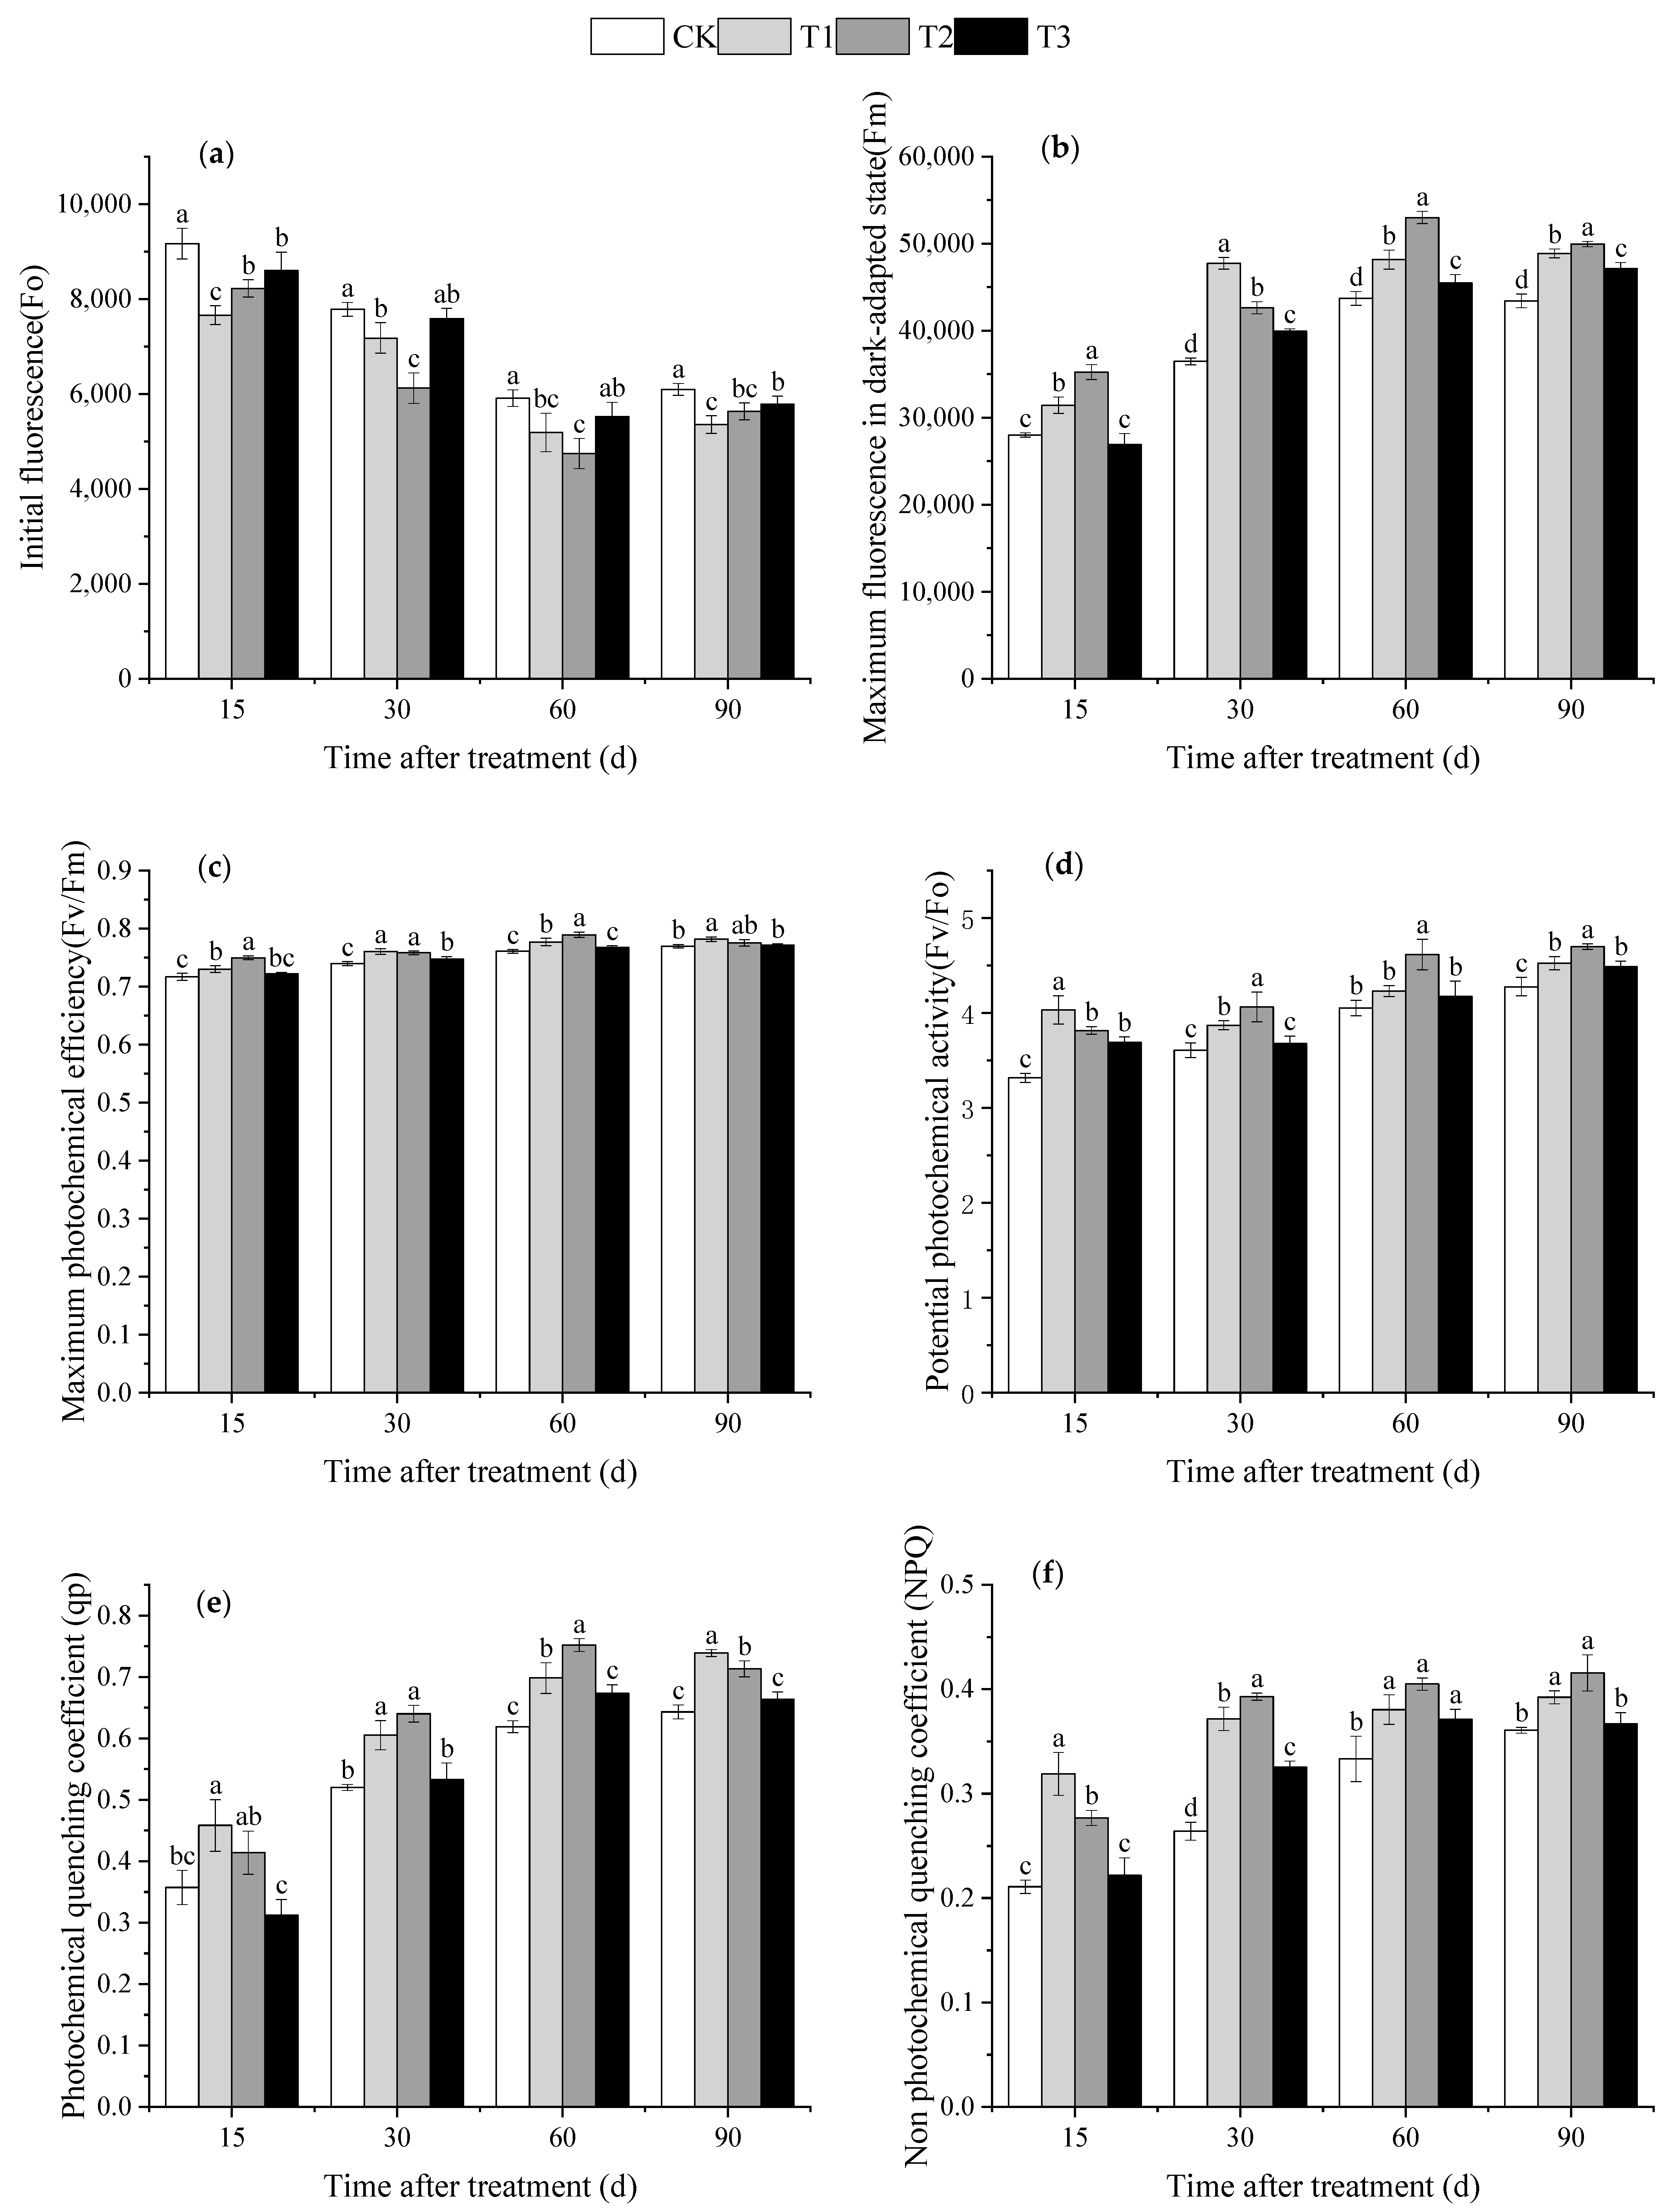
3.5. Effect of DMPP on Chlorophyll Fluorescence Parameters in Grape Leaves

With the development of grape seedlings, the leaves’ initial fluorescence value (F0) (Figure 3a) decreased gradually, and the maximum fluorescence in a dark-adapted state value (Fm) (Figure 3b) increased gradually. The maximum photochemical efficiency (Fv/Fm) (Figure 3c), potential photochemical activity (Fv/F0) (Figure 3d), photochemical quenching coefficient (qP) (Figure 3e), and non-photochemical quenching coefficient (NPQ) (Figure 3f) showed an increasing trend. Compared with CK, DMPP application can significantly decrease F0 and increase Fm. As a result, Fv/Fm, Fv/F0, qP, and NPQ all increased. The T2 treatment outperformed T1 and T3 in terms of improving grape leaf chlorophyll fluorescence efficiency.

3.6. Effect of DMPP on the Expression of Photosynthesis and Nitrogen Metabolism-Related Genes in Grape Seedlings

Based on the effects of DMPP on grape seedling biomass and photosynthesis parameters, the T2 treatment had the best results. As a result, 60 days after DMPP treatment, T2 samples were selected for transcriptome analysis to investigate the mechanism through which DMPP could regulate photosynthesis and nitrogen metabolism in grape seedlings.

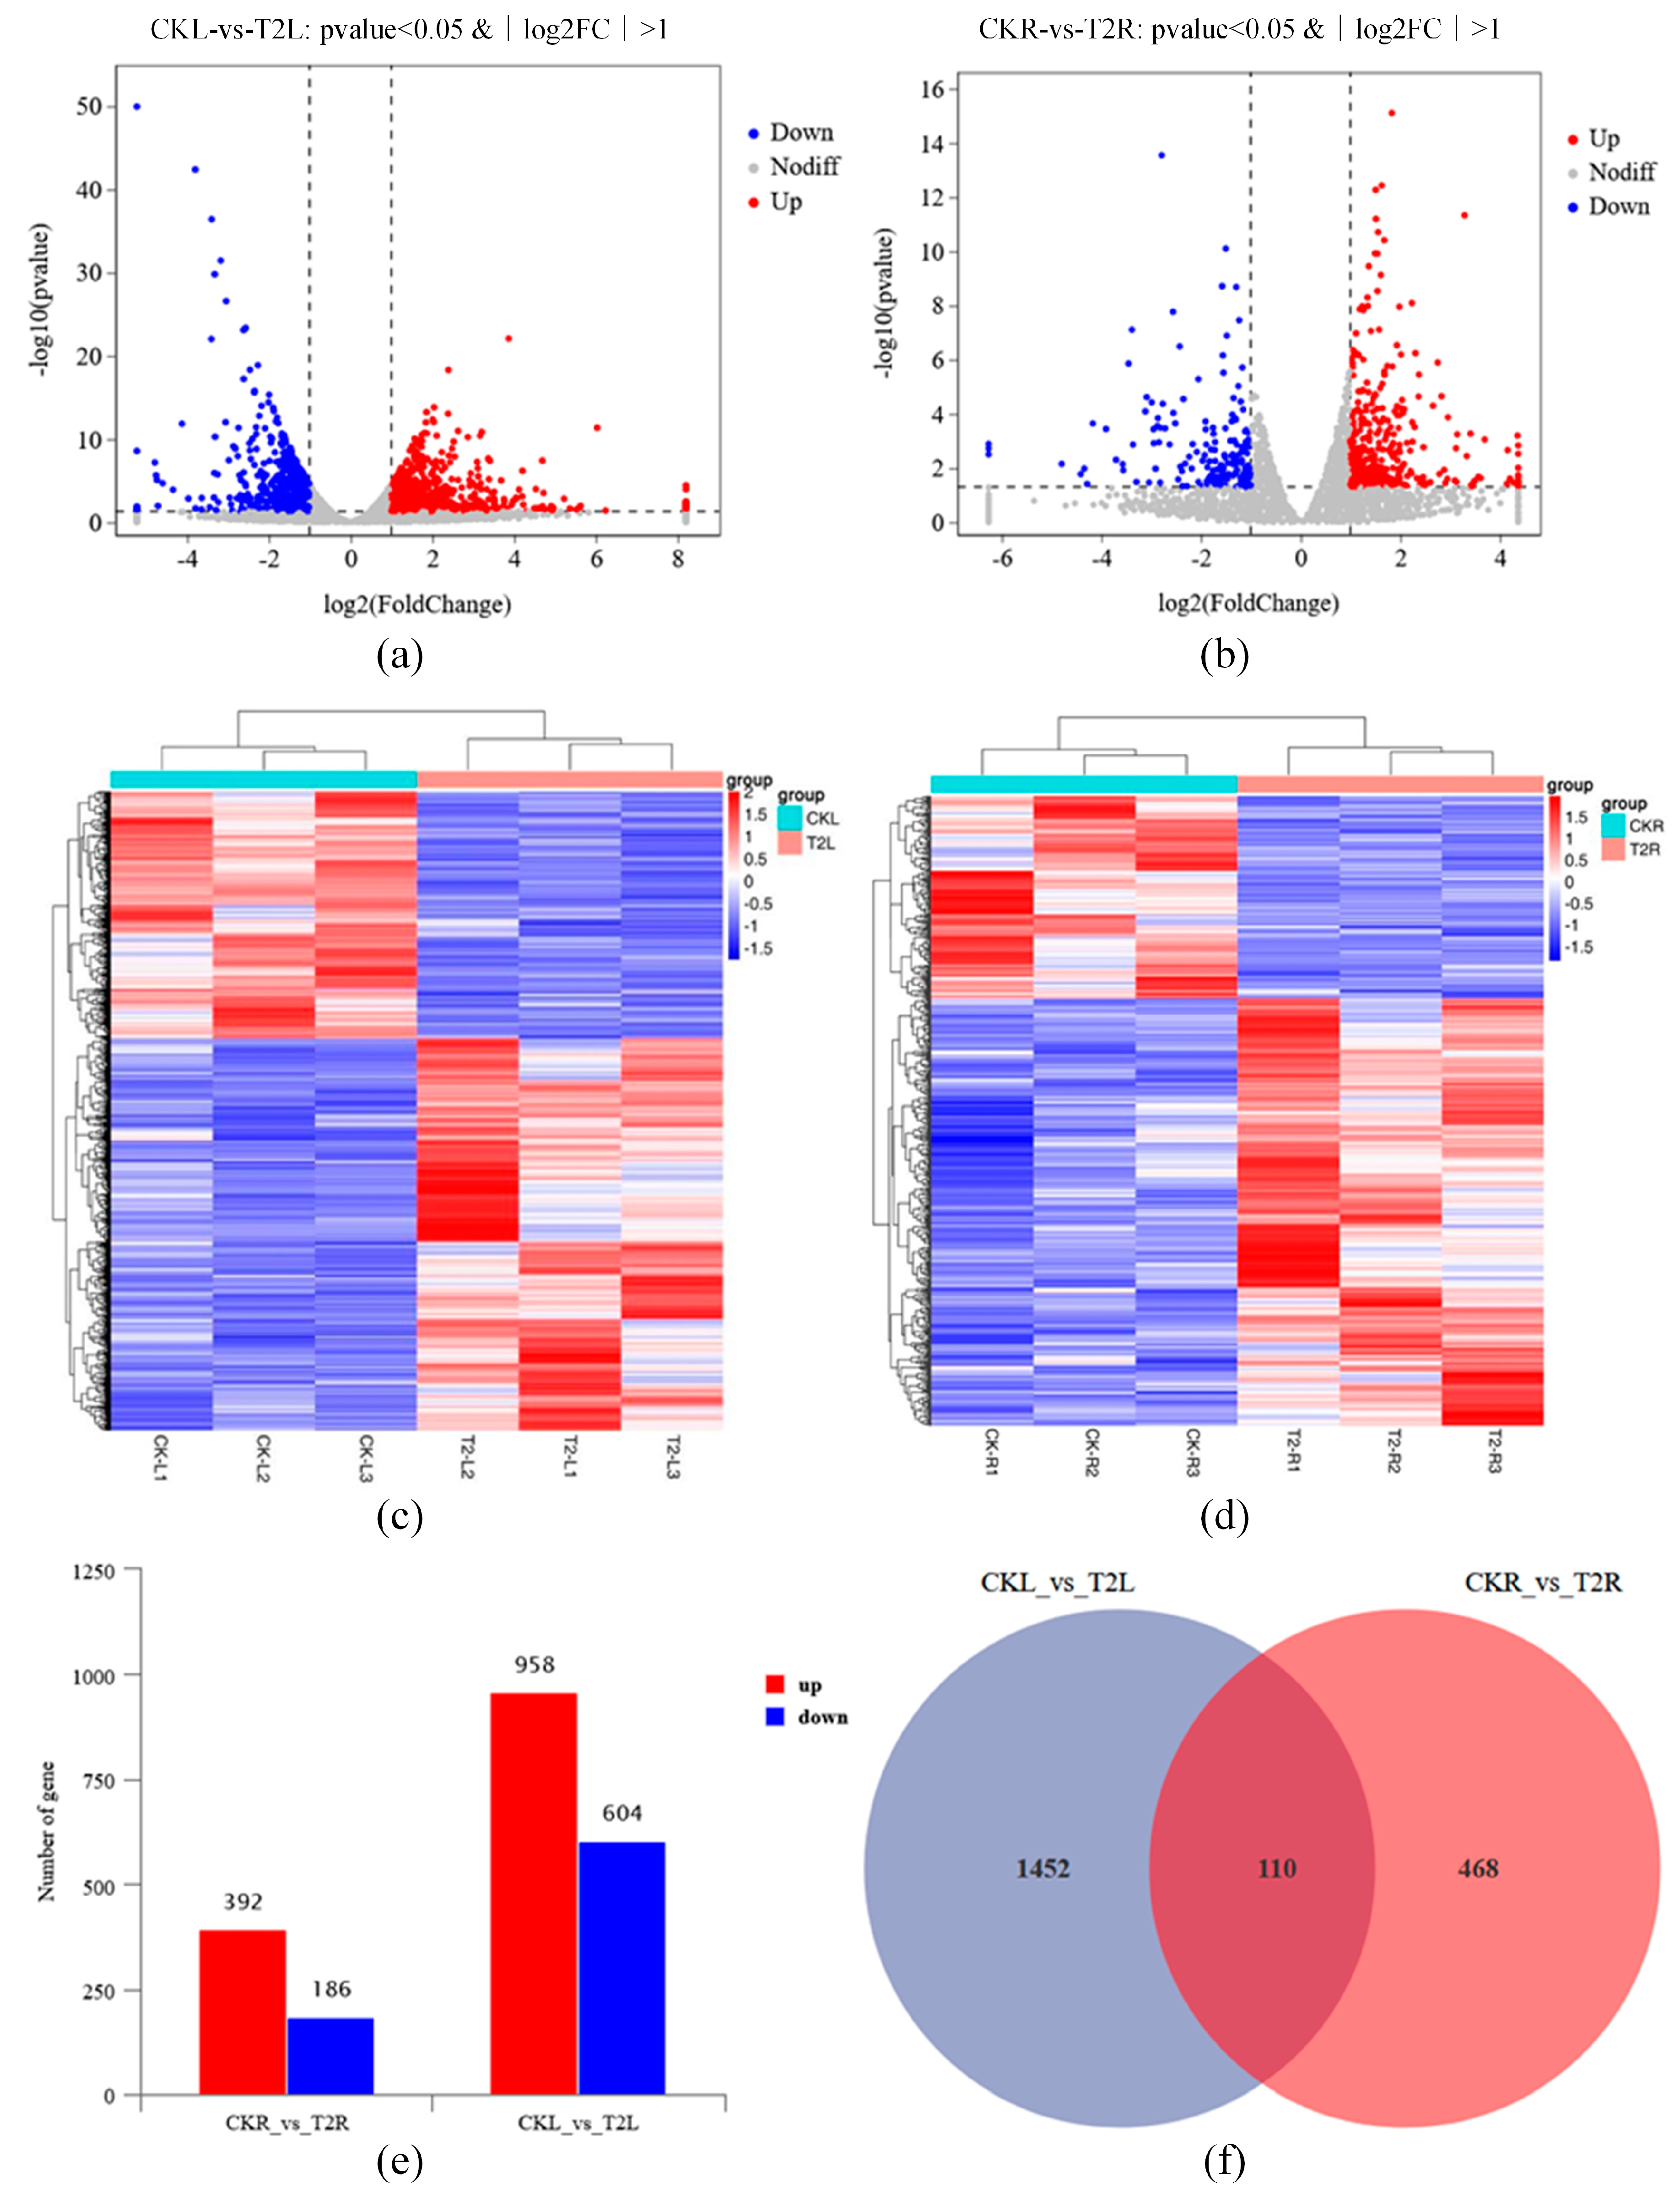
3.6.1. Global Analysis of Grapevine RNA-Seq Data with Application of Urea Nitrogen Content 1% of DMPP

The number of genes expressed in different parts of the grape seedlings in the T2 treatment was calculated, and a total of 22037–22466 genes were identified in the leaves of grapes, of which 17973–18091 genes had FPKM (fragment per kilobase million fragments of transcript) values >1. In addition, 22163–22555 genes were identified in the roots and 18039–18277 genes had FPKM values >1. The number of genes expressed in different parts of the grape seedlings in CK treatment was calculated, and a total of 21602–22171 genes were identified in the leaves of grapes, of which 16913–17606 genes had FPKM values >1. Furthermore, 22034–22260 genes were identified in the roots and 17469–18237 genes had FPKM values >1.
To obtain an overview of metabolic changes in photosynthetic and nitrogen reactions, principal component analysis (PCA) was performed on leaves and roots samples of CK and T2 and QC samples (prepared by homogeneous mixing of all experimental sample extracts) (Figure 4). PCA was used to explore relationships between samples by positioning them in different dimensions, with smaller clustering distances indicating more identical samples. The dispersion between QC samples indicates that the metabolic analyzer has stable and reliable data detection ability, which can be used for subsequent analysis.
p-values and log2FC-derived volcano maps (Figure 5a,b) and cluster maps (Figure 5c,d) were used to select the differentially expressed genes (DEGs) of T2 grape seedlings compared with CK. We identified a total of 1562 DEGs in the leaves of grape seedlings grown after DMPP addition, of which 958 were up-regulated and 604 were down-regulated. A total of 578 DEGs were identified in the roots of grape seedlings grown after DMPP addition, of which 392 were up-regulated and 186 were down-regulated (Figure 5e). The Venn diagram (Figure 5f) shows that 110 shared DEGs were identified in roots and leaves.

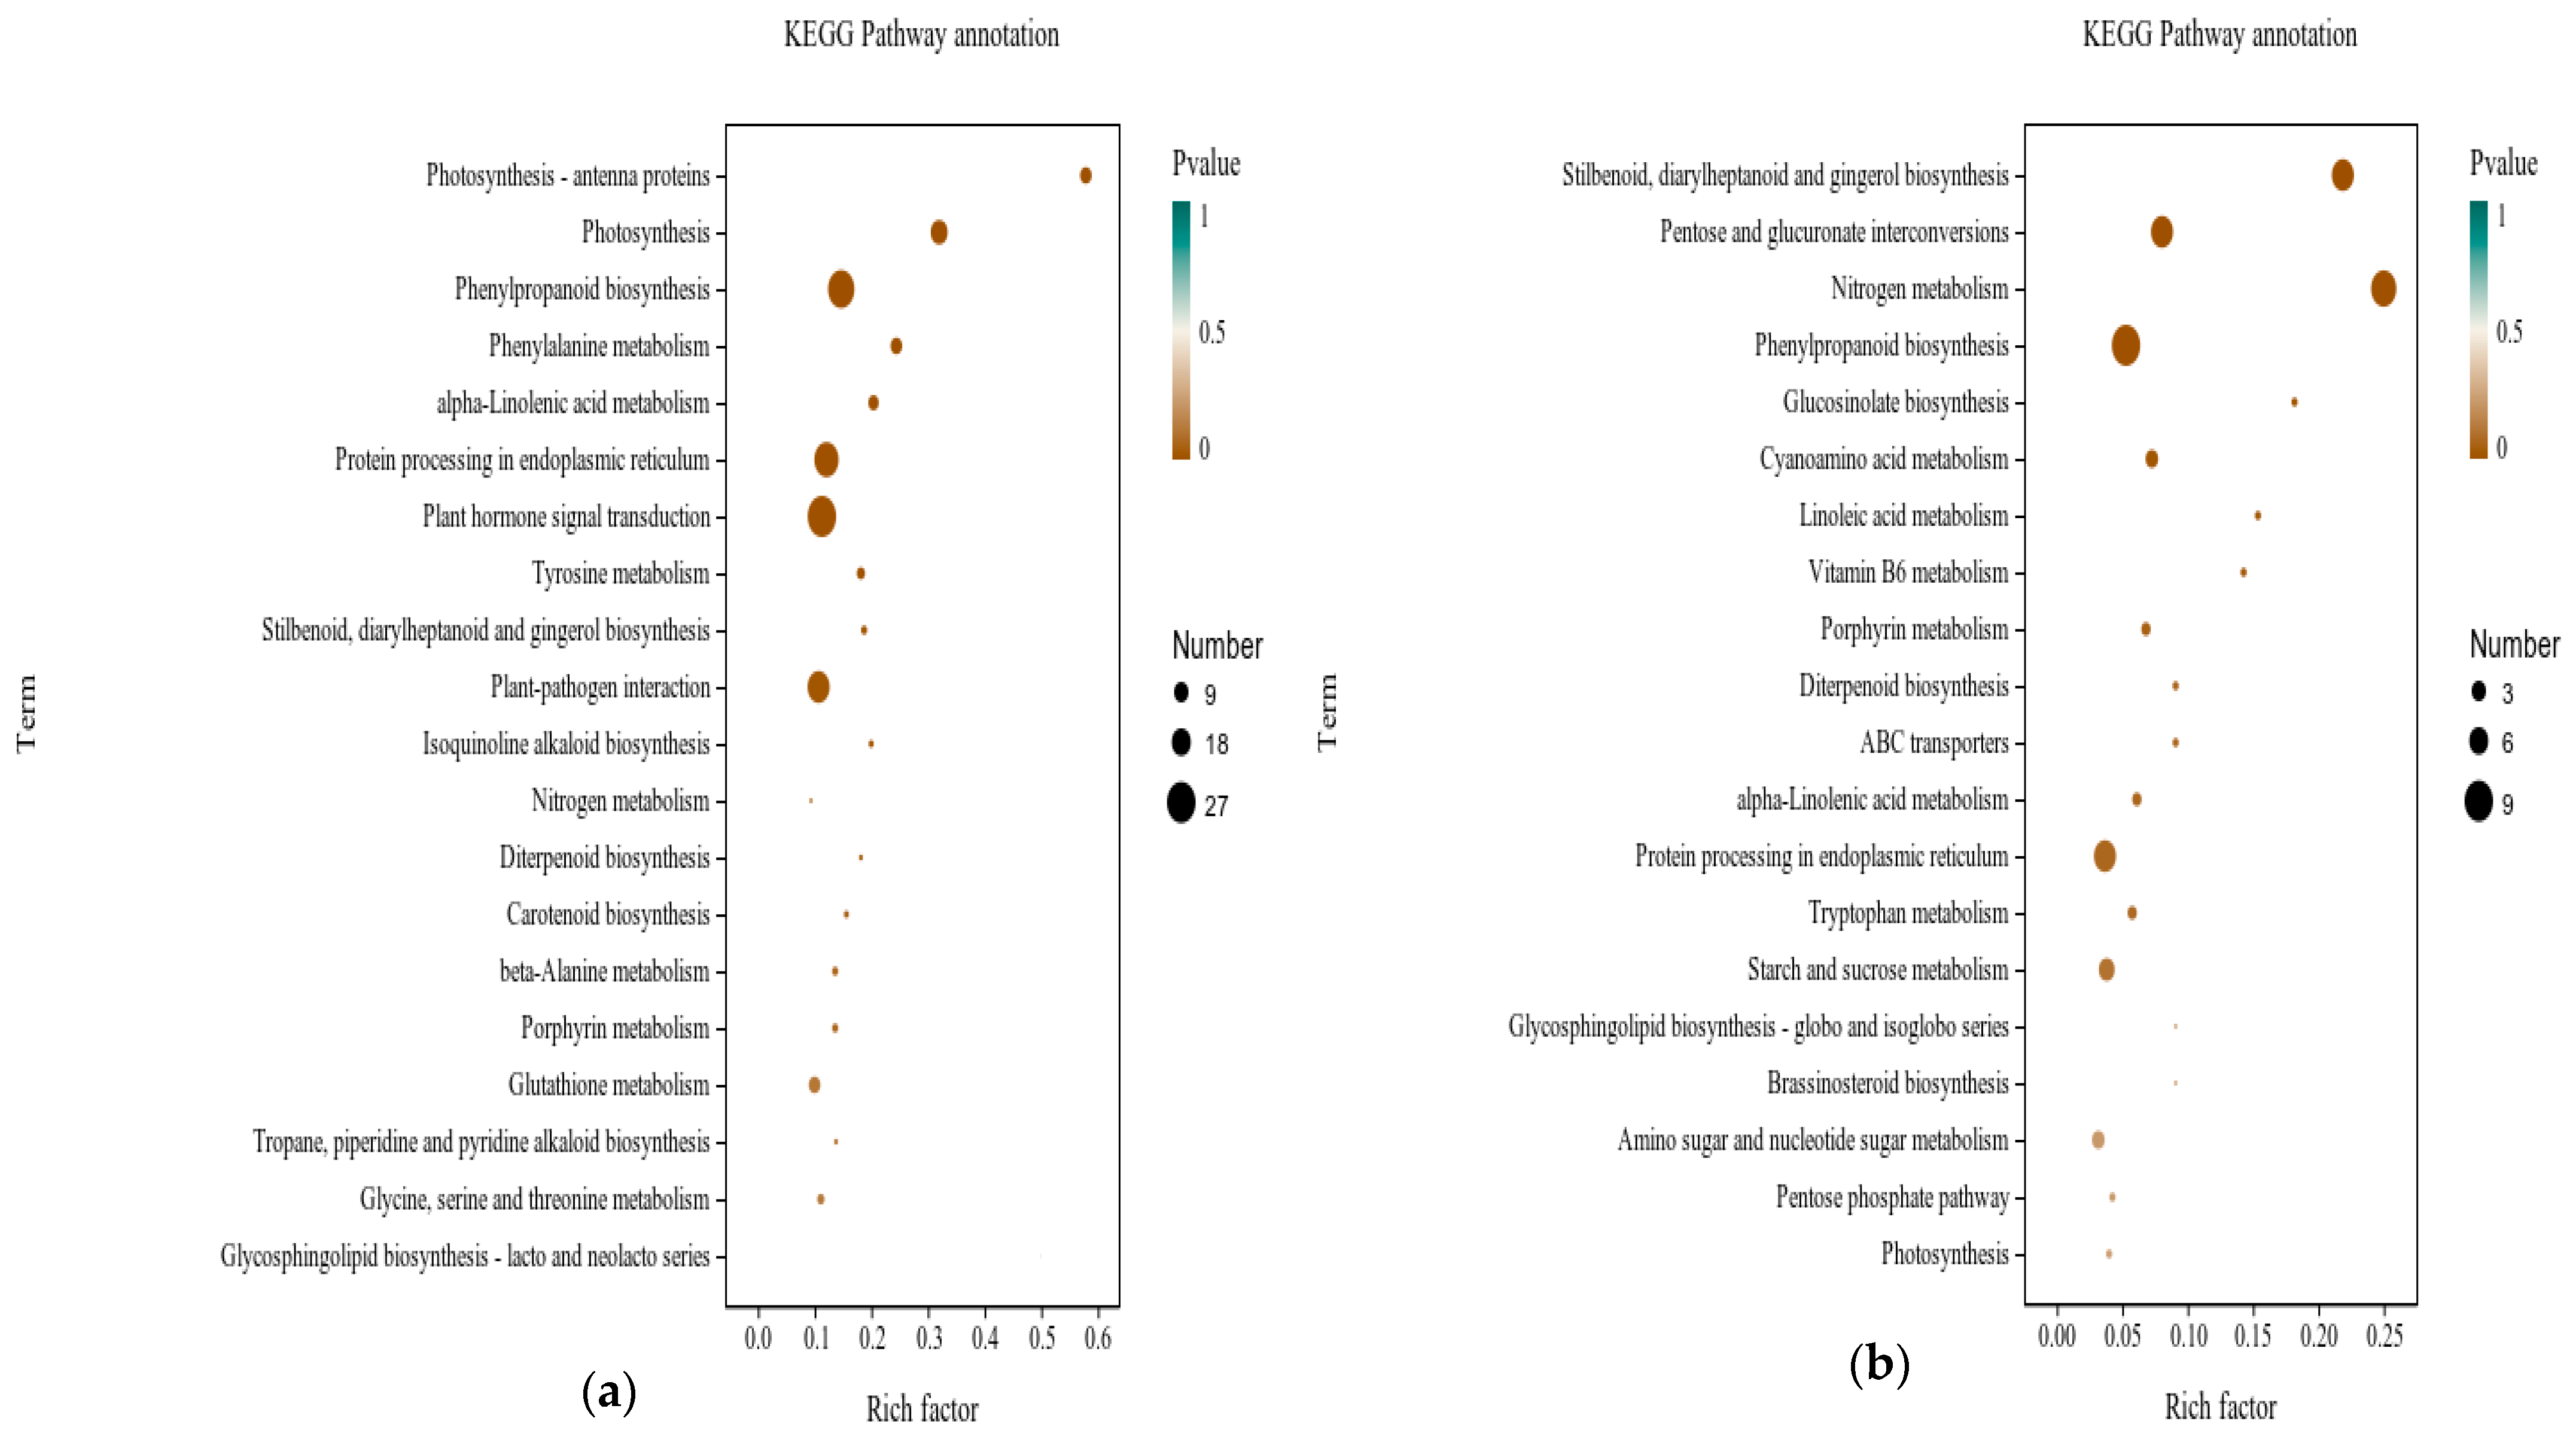
3.6.2. Functional Analysis of DEGs in Grape with Application of Urea Nitrogen Content 1% of DMPP

Gene ontology (GO) enrichment analysis of grape seedling leaves and roots showed that 8185 up-regulated genes and 5341 down-regulated genes were enriched in grapevine leaves (Supplementary Materials S2), while 2538 up-regulated genes and 913 down-regulated genes were enriched in grapevine roots (Supplementary Materials S4). The enriched genes were divided into three main broad categories, biological process (BP), cellular component (CC), and molecular function (MF). Some genes belonged to two or more categories. Molecular functions, biological processes, cellular components, and cellular anatomical entities were the most enriched categories (Table 3).
KEGG pathway enrichment analyses were performed to investigate the pathways of DEG enrichment in the leaves and roots of grape seedlings grown after the addition of 1% DMPP (Figure 6a,b). The analysis revealed that the majority of genes in the leaves and roots were enriched in the metabolic pathway. KEGG analysis of DEG in leaves was primarily enriched in energy metabolism and amino acid metabolism pathways (Supplementary Materials S3), such as the photosynthesis-antenna protein, photosynthesis, nitrogen metabolism, phenyl propane metabolism, tyrosine metabolism, β-alanine metabolism, glutathione metabolism, and glycine, serine, and threonine metabolism. In grape roots, KEGG analysis was primarily enriched in secondary metabolite biosynthesis and carbohydrate metabolism, chiefly the biosynthesis of stilbenes, diarylheptanes, and gingerols, the biosynthesis of phenylpropanoids, the biosynthesis of mustard oil glycosides, the conversion of pentose and glucuronic acid, the metabolism of starch and sucrose, the metabolism of amino saccharides and nucleotides, and the pentose phosphate pathway (Supplementary Materials S6). The results showed that the addition of 1% DMPP resulted in the activation of photosynthetic, nitrogen, and amino acid metabolic pathways in grape leaves. The metabolism of carbohydrates and the biosynthetic pathways of secondary metabolites were activated in the roots.

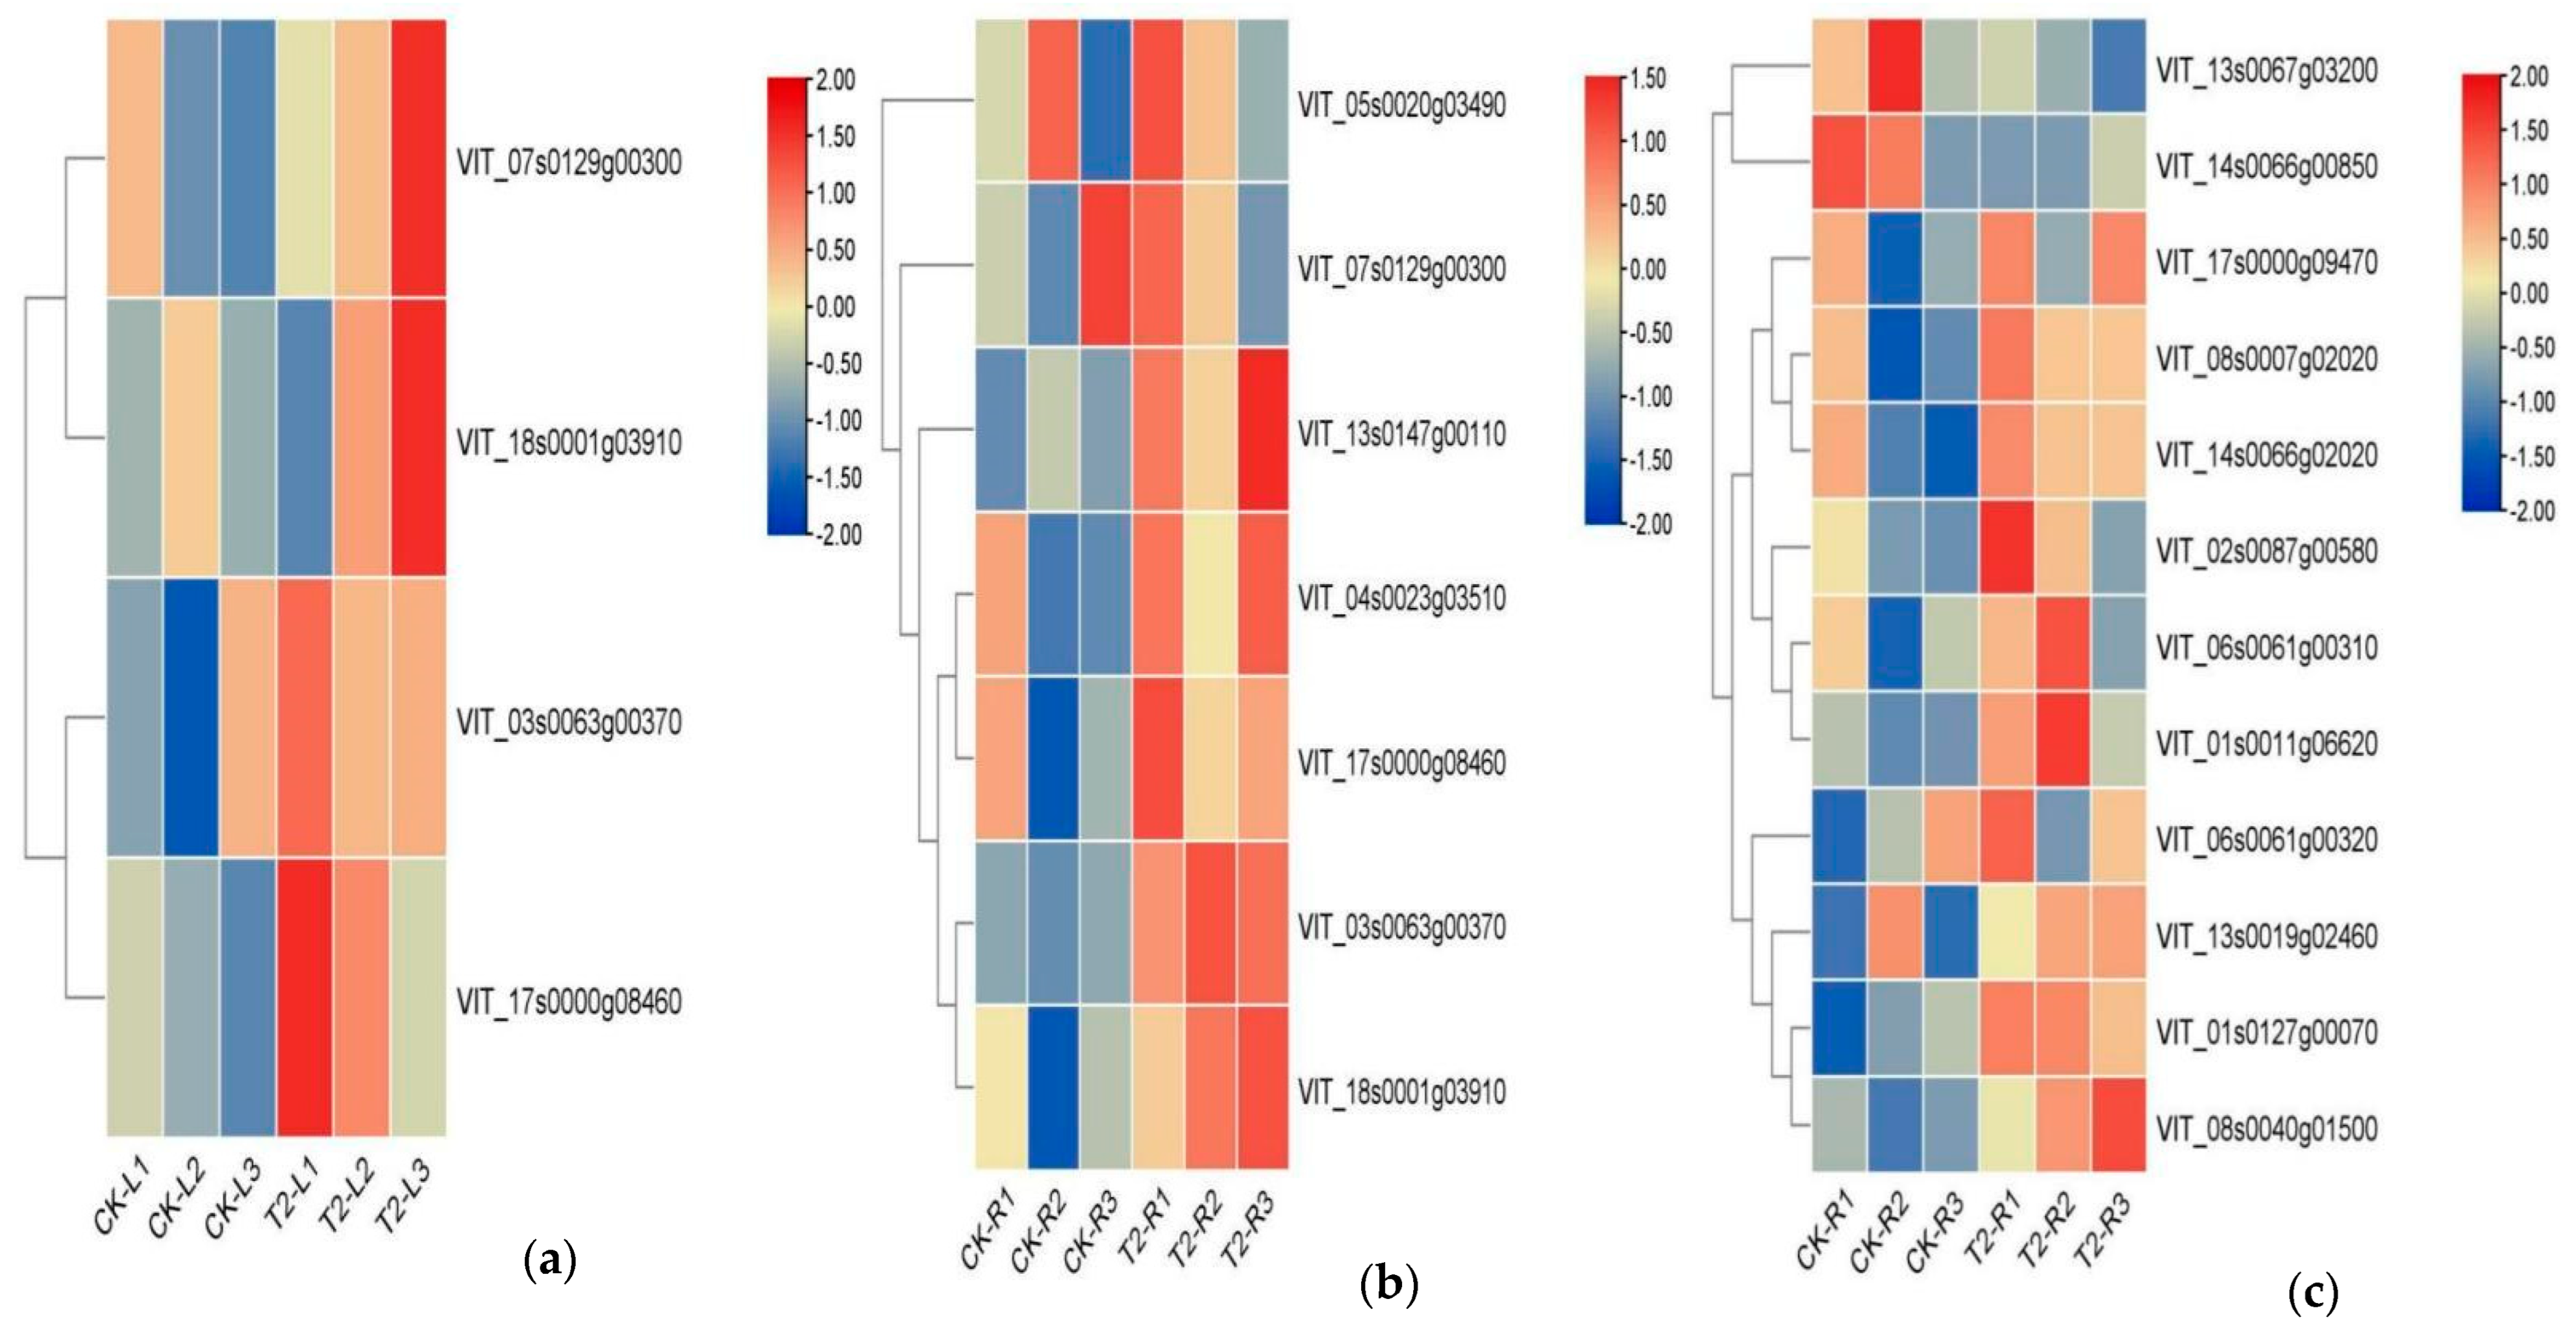
3.6.3. Analysis of Gene Families Associated with Metabolic Process

The 27 differentially expressed genes associated with photosynthetic regulation were normalized using TBtools to create a heat map. LHC, Psa, and Psb family members are key photosystem members in grape leaves and metabolic processes in GO enrichment analysis. Eleven up-regulated DEGs (Figure 7) in grape seedlings treatment with 1% DMPP belonged to the LHCA family (VIT_12s0055g01110 et al.). Seven up-regulated DEGs belonged to the Psa family (VIT_00s0125g00280 et al.). Five up-regulated DEGs belonged to the Psb family (VIT_01s0137g00210 et al.). Three up-regulated genes (VIT_18s0001g00760 et al.) and one down-regulated gene (VIT_ 02s0012g00980) belonged to the Pet family. One up-regulated gene (VIT_10s0116g01740) and one down-regulated gene (VIT_19s0090g00480) belonged to the ATP synthase.
Members of the Nar and Nrt families are involved in nitrogen metabolism, which is a metabolic process in GO enrichment analysis. Four Nar family genes (VIT 07s0129g00300 et al.) were up-regulated in leaves of grape seedlings treated with 1% DMPP. Seven up-regulated genes belonged to the Nar family in roots (VIT_05s0020g03490 et al.). Ten up-regulated (VIT_08s0007g02020 et al.) and two down-regulated (VIT_13s0067g03200, VIT_14s0066g00850) genes belonged to the Nrt family (Figure 8).

4. Discussion

Biomass is an important parameter for evaluating crop growth and development, being intrinsically linked to yield. According to the findings of this study, the biomass of grape seedlings increased and then decreased as the DMPP concentration increased. All treatments outperformed CK, indicating that DMPP in combination with urea can promote seedling dry matter mass accumulation. However, when the amount of DMPP added reached 2.0% of the nitrogen content of urea, it inhibited the accumulation of dry matter mass, which is consistent with the results of Liu et al. [25]. It may be due to the fact that the application of DMPP with urea to the soil inhibits nitrification and prevents nitrifying bacteria from converting ammonium nitrogen to nitrate nitrogen. As a result, it has the potential to increase the proportion of ammonium nitrogen in the soil [26,27]. Additionally, a study concluded that NO3-N was a more efficient form of nitrogen for grape seedlings compared with NH4+-N [28].
The root system is an important organ for water and nutrient uptake by plants and plays an important role in crop growth and development. Optimized root morphology and good root vigor can provide sufficient nutrients and water for crop growth, which is the basis for high crop yield and high nutrient utilization [22,29,30]. The application of DMPP treatment in this study improved root the length, surface areas, volume, and root vigor. This result may be due to the fact that the application of DMPP regulated the ratio of NO3-N to NH4+-N. NH4+-N can highly stimulate lateral root formation by inhibiting cell elongation rather than cell division [31], while NO3-N can promote lateral root growth and influence the number of lateral roots through small-molecule RNA and hormone response factors, thus regulating adventitious roots [31,32]. The crop requires less energy to absorb and use NH4+-N than NO3-N [31,33].
Photosynthetic pigments play an important role in the uptake, transfer, and conversion of photosynthesis, and their content is closely related to photosynthetic intensity [34]. Chlorophyll is a major player and carrier of photosynthetic energy conversion [35,36]. The results of this experiment on photosynthetic pigments were similar to those of Liu et al. [37]. Low DMPP application concentrations promoted the synthesis of chlorophyll a, chlorophyll b, chlorophyll a + b, and carotenoids in grape seedling leaves. However, when the DMPP application concentrations reached 2% of the nitrogen content of urea, the synthesis of each photosynthetic pigment was inhibited, which also indicated that the application of urea nitrogen content of 1% of DMPP was able to inhibit nitrogen nitrification to ensure an adequate nitrogen supply and promote the accumulation of chlorophyll content.
Photosynthesis provides essential substances and the energy basis for plant growth and output. The results of this study showed that the trends of photosynthetic parameters were consistent with those of photosynthetic pigments. Low DMPP application concentrations promoted photosynthesis while high DMPP application concentrations inhibited photosynthesis. This result was consistent with Collado et al. [38] in which the application of NO3-N had a positive effect on photosynthetic activity compared to NH4+-N.
The light energy absorbed by the leaves is partially converted into chemical energy by photochemical electron transfer and the rest is dissipated as fluorescence and heat [39]. Thus, chlorophyll fluorescence parameters can reflect the intensity of photosynthetic efficiency in plants, and photosynthetic system II (PSII) is an important structure for light reactions during photosynthesis in plants [40]. F0 and Fm indicate the initial and maximum fluorescence, which are the fluorescence yields when the PSII reaction center is fully open and fully closed. In this study, the trend of F0 decreased and then increased using DMPP, reaching a minimum in T2, while Fm showed the opposite trend, indicating that the application of urea nitrogen content of 1% of DMPP was least affected by photoinhibition. Fv/Fm and Fv/F0 are both important fluorescence parameters for identifying whether plants are photoinhibited [41]. In T1 and T2, the increase in Fv/F0 and Fv/Fm indicated that the application of urea nitrogen content of 0.5% and 1% of DMPP had a positive effect on the PSII of grape leaves. The fluorescence photochemical burst coefficient (qP) of plant leaves is a reflection of the level of photosynthetic activity caused by the quenching of fluorescence by photosynthesis. The fluorescence non-photochemical quenching coefficient (NPQ) is a measure of the plant’s ability to dissipate excess light energy into heat, reflecting the plant’s photoprotective capacity [42]. The current study found that both qP and NPQ were highest in T1 and T2. This result indicated that the relatively high NO3-N content in the application of urea nitrogen content of 0.5% and 1% of DMPP promoted qP and NPQ, thus increasing photosynthetic activity. This was in contrast to the study on roasted tobacco by Guo, H.X. et al. [43], likely because flue-cured tobacco is an ammonium-loving crop and grapes are a nitrate-loving crop.
Illumina HiSeq-based technologies have proven transcriptomics to be an effective approach to aid gene annotation and gene expression studies in eukaryotes [44,45]. Photosystem I (PSI) is a ferric oxidoreductase and it plays a major role in the photosynthetic reactions of higher plants [46]. The action primarily occurs in pigment–protein complexes composed of PSI, PS II, cytochrome b6/f complex, and ATPase, and in light capture complexes. In the present study, DEGs involved in PSI, PSII, photosynthetic electron transport, and LHCA were up-regulated upon application of urea nitrogen content of 1% of DMPP. The supercomplex is composed of a PSI core and all four Lhcs (PSI-LHCI) coordinates ~170 Chls a and b and carotenoids: b-carotene, violaxanthin, and lutein [47]. Lhca proteins are encoded by nuclear genes belonging to the Lhc multigene family, which also encodes for the Lhcb proteins of PSII [48]. Functionally, Photosystem I captures sunlight and transfers the excitation energy through an intricate and precisely organized antenna system, consisting of a pigment network, to the center of the molecule, where it is used in the transmembrane electron transfer reaction [49,50]. The main reason for the up-regulation of these genes’ expression could be the elevated chlorophyll content of the leaves and photosynthetic parameters. The cytochrome b6/f complex, photosynthetic electron transport, and PSII are all mostly composed of proteins encoded by the Pet and Psb gene families [51,52]. Studies have shown that these proteins increase photosynthetic efficiency in plants [53]. In our experiments, we found up-regulated gene expression from Pet and Psb gene families. These up-regulated genes promoted the photosynthetic electron transport and PSII pathway in grape seedlings with 1%DMPP urea nitrogen, thus improving the photosynthetic rate and energy metabolism. In addition, the conversion of nitrate-N to nitrite-N required the action of a DEG from the nitrate reductase (Nar) gene family [54]. The conversion of nitrite-N to ammonia-N is carried out by DEGs from the nitrite reductase (Nir) gene family [55]. DEGs, which belong to the Nrt gene family, are involved in the transport of nitrogen from the outside of the cell to the inner chamber [56]. It has been found that Nrt family genes are involved in the transcriptional regulation of root growth, flowering, various physiological processes, hormones, and nitrate signal transduction [57,58]. Genes from the Nar and Nrt families promote nutrient uptake by crops [59]. After the application of urea nitrogen content of 1% of DMPP, the expression levels of Nar and Nir gene families and nitrogen metabolic pathway components were up-regulated in grape leaves. The root Nrt gene family is up-regulated, which accelerates the movement of extracellular nitrogen into the cell, thus enhancing the nitrogen metabolic pathway in leaves and roots.
The up-regulation of LHC, Psa, Psb, Pet, Nar, and Nrt genes suggested that the application of urea nitrogen content of 1% of DMPP could promote photosynthesis and nitrogen metabolism. In the six gene families identified in our study, genetic engineering can be used to boost the expression of up-regulated genes (LHC, Psa, Pet, Psb, Nar, and Nir). It can also be used to investigate the material accumulation and growth conditions of crops grown after the addition of DMPP by increasing the rate of photosynthesis and nitrogen metabolism.

5. Conclusions

In this study, the application of DMPP with urea significantly increased the accumulation of grape seedlings biomass. The application of 1% DMPP to the urea nitrogen content (T2) showed the most significant effects. The net photosynthetic rate, photosynthetic pigments, and fluorescence intensity of leaves were significantly increased under T1 and T2 compared to CK. Compared with CK, with the application of urea nitrogen content of 1% of DMPP (T2), 1562 differentially expressed genes (DEGs) were identified in leaves (958 down-regulated and 604 up-regulated) and 578 DeGs were identified in roots (392 down-regulated and 186 up-regulated) by transcriptome analysis. These DEGs were analyzed for enrichment in the GO and KEGG pathways. Eleven LHC genes (VIT_12s0055g01110 et al.), seven Psa genes (VIT_00s0125g00280 et al.), four Pet genes (VIT_18s0001g00760 et al.), and five Psb genes (VIT_01s0137g00210 et al.) were associated with the promotion of the photosynthetic pathway. In addition, seven Nar genes (VIT_05s0020g03490 et al.) were associated with the promotion of the nitrogen metabolic pathway in grape seedlings after the application of urea nitrogen content of 1% of DMPP. Twelve Nrt genes (VIT_08s0007g02020 et al.) were associated with increased nitrogen uptake.
In conclusion, the application of DMPP with urea was an effective measure to increase the biomass of grape seedlings and enhance the photosynthetic performance of leaves. The optimum DMPP application was 1% of urea nitrogen content.

Supplementary Materials

The following supporting information can be downloaded at: https://www.mdpi.com/article/10.3390/su15054130/s1, S1: Gene expression in CKL-vs-T2 leaves. S2: Go enrichment analysis in CKL-vs-T2 leaves. S3: KEGG pathway enrichment analyses in CKL-vs-T2 leaves. S4: Gene expression in CKL-vs-T2 roots. S5: Go enrichment analysis in CKL-vs-T2 roots. S6: KEGG pathway enrichment analyses in CKL-vs-T2 roots.

Author Contributions

J.Z.: Methodology, investigation, data curation, formal analysis, writing—original draft, visualization, software. F.D.: Writing—review, visualization, investigation, data curation. F.O.P.: Writing—review, data curation, visualization. G.L.: Methodology, investigation, data curation, visualization. H.L.: Project administration, conceptualization, funding acquisition, methodology, writing—review, and supervision. All authors have read and agreed to the published version of the manuscript.

Funding

This program was funded by Xinjiang Production and Construction Corps, Major Scientific and Technological Project Plan (2016AA002).

Data Availability Statement

Data are available from the authors upon request.

Conflicts of Interest

All authors declare that they have no conflict of interest.

References

  1. de Freitas Laiber Pascoal, G.; de Almeida Sousa Cruz, M.A.; Pimentel de Abreu, J.; Santos, M.C.B.; Bernardes Fanaro, G.; Junior, M.R.M.; Freitas Silva, O.; Moreira, R.F.A.; Cameron, L.C.; Simoes Larraz Ferreira, M.; et al. Evaluation of the antioxidant capacity, volatile composition and phenolic content of hybrid Vitis vinifera L. varieties sweet sapphire and sweet surprise. Food Chem. 2022, 366, 130644. [Google Scholar] [CrossRef] [PubMed]
  2. Kumar, R.; Pareek, N.K.; Kumar, U.; Javed, T.; Al-Huqail, A.A.; Rathore, V.S.; Nangia, V.; Choudhary, A.; Nanda, G.; Ali, H.M.; et al. Coupling Effects of Nitrogen and Irrigation Levels on Growth Attributes, Nitrogen Use Efficiency, and Economics of Cotton. Front. Plant Sci. 2022, 13, 890181. [Google Scholar] [CrossRef] [PubMed]
  3. Zhai, J.; Zhang, G.; Zhang, Y.; Xu, W.; Xie, R.; Ming, B.; Hou, P.; Wang, K.; Xue, J.; Li, S. Effect of the Rate of Nitrogen Application on Dry Matter Accumulation and Yield Formation of Densely Planted Maize. Sustainability 2022, 14, 14940. [Google Scholar] [CrossRef]
  4. Fu, H.; Cui, D.; Shen, H. Effects of Nitrogen Forms and Application Rates on Nitrogen Uptake, Photosynthetic Characteristics and Yield of Double-Cropping Rice in South China. Agronomy 2021, 11, 158. [Google Scholar] [CrossRef]
  5. Ren, B.; Ma, Z.; Zhao, B.; Liu, P.; Zhang, J. Influences of split application and nitrification inhibitor on nitrogen losses, grain yield, and net income for summer maize production. Front. Plant Sci. 2022, 13, 982373. [Google Scholar] [CrossRef]
  6. Bakass, M.; Mokhlisse, A.; Lallemant, M. Absorption and desorption of liquid water by a superabsorbent polymer: Effect of polymer in the drying of the soil and the quality of certain plants. J. Appl. Polym. Sci. 2002, 83, 234–243. [Google Scholar] [CrossRef]
  7. Gonzalez, M.E.; Cea, M.; Medina, J.; Gonzalez, A.; Diez, M.C.; Cartes, P.; Monreal, C.; Navia, R. Evaluation of biodegradable polymers as encapsulating agents for the development of a urea controlled-release fertilizer using biochar as support material. Sci. Total Environ. 2015, 505, 446–453. [Google Scholar] [CrossRef]
  8. Schoninger, E.L.; González-Villalba, H.A.; Bendassolli, J.A.; Ocheuze Trivelin, P.C. Fertilizer Nitrogen and Corn Plants: Not all Volatilized Ammonia is Lost. Agron. J. 2018, 110, 1111–1118. [Google Scholar] [CrossRef]
  9. Mahmud, K.; Panday, D.; Mergoum, A.; Missaoui, A. Nitrogen Losses and Potential Mitigation Strategies for a Sustainable Agroecosystem. Sustainability 2021, 13, 2400. [Google Scholar] [CrossRef]
  10. Corrochano-Monsalve, M.; Gonzalez-Murua, C.; Bozal-Leorri, A.; Lezama, L.; Artetxe, B. Mechanism of action of nitrification inhibitors based on dimethylpyrazole: A matter of chelation. Sci. Total Environ. 2021, 752, 141885. [Google Scholar] [CrossRef]
  11. Li, H.; Liang, X.; Chen, Y.; Lian, Y.; Tian, G.; Ni, W. Effect of nitrification inhibitor DMPP on nitrogen leaching, nitrifying organisms, and enzyme activities in a rice-oilseed rape cropping system. J. Environ. Sci. 2008, 20, 149–155. [Google Scholar] [CrossRef] [PubMed]
  12. Huérfano, X.; Fuertes-Mendizábal, T.; Fernández-Diez, K.; Estavillo, J.M.; González-Murua, C.; Menéndez, S. The new nitrification inhibitor 3,4-dimethylpyrazole succinic (DMPSA) as an alternative to DMPP for reducing N2O emissions from wheat crops under humid Mediterranean conditions. Eur. J. Agron. 2016, 80, 78–87. [Google Scholar] [CrossRef]
  13. Shi, X.; Hu, H.W.; Zhu-Barker, X.; Hayden, H.; Wang, J.; Suter, H.; Chen, D.; He, J.Z. Nitrifier-induced denitrification is an important source of soil nitrous oxide and can be inhibited by a nitrification inhibitor 3,4-dimethylpyrazole phosphate. Environ. Microbiol 2017, 19, 4851–4865. [Google Scholar] [CrossRef] [PubMed]
  14. Vilarrasa-Nogue, M.; Teira-Esmatges, M.R.; Pascual, M.; Villar, J.M.; Rufat, J. Effect of N dose, fertilisation duration and application of a nitrification inhibitor on GHG emissions from a peach orchard. Sci. Total Environ. 2020, 699, 134042. [Google Scholar] [CrossRef] [PubMed]
  15. Wu, S.-f.; Wu, L.-h.; Shi, Q.-w.; Wang, Z.-q.; Chen, X.-y.; Li, Y.-s. Effects of a new nitrification inhibitor 3,4-dimethylpyrazole phosphate (DMPP) on nitrate and potassium leaching in two soils. J. Environ. Sci. 2007, 19, 841–847. [Google Scholar] [CrossRef] [PubMed]
  16. Qiao, C.; Liu, L.; Hu, S.; Compton, J.E.; Greaver, T.L.; Li, Q. How inhibiting nitrification affects nitrogen cycle and reduces environmental impacts of anthropogenic nitrogen input. Global. Chang. Biol. 2015, 21, 1249–1257. [Google Scholar] [CrossRef] [PubMed]
  17. Kirschke, T.; Spott, O.; Vetterlein, D. Impact of urease and nitrification inhibitor on NH4+ and NO3 dynamic in soil after urea spring application under field conditions evaluated by soil extraction and soil solution sampling. J. Plant Nutr. Soil Sci. 2019, 182, 441–450. [Google Scholar] [CrossRef]
  18. Thapa, R.; Chatterjee, A. Wheat Production, Nitrogen Transformation, and Nitrogen Losses as Affected by Nitrification and Double Inhibitors. Agron. J. 2017, 109, 1825–1835. [Google Scholar] [CrossRef]
  19. Sha, Z.; Ma, X.; Wang, J.; Lv, T.; Li, Q.; Misselbrook, T.; Liu, X. Effect of N stabilizers on fertilizer-N fate in the soil-crop system: A meta-analysis. Agric. Ecosyst. Environ. 2020, 290. [Google Scholar] [CrossRef]
  20. Dawar, K.; Khan, A.; Sardar, K.; Fahad, S.; Saud, S.; Datta, R.; Danish, S. Effects of the nitrification inhibitor nitrapyrin and mulch on N2O emission and fertilizer use efficiency using 15N tracing techniques. Sci. Total Environ. 2021, 757, 143739. [Google Scholar] [CrossRef]
  21. Li, W.; Wang, Y.; Xu, Q.; Cao, G.; Guo, X.; Zhou, H.; Du, Y. Global analysis of nitrification inhibitors on grasslands nitrous oxide emission rates. Biochem. Syst. Ecol. 2021, 97, 104289. [Google Scholar] [CrossRef]
  22. Alhaj Hamoud, Y.; Shaghaleh, H.; Sheteiwy, M.; Guo, X.; Elshaikh, N.A.; Ullah Khan, N.; Oumarou, A.; Rahim, S.F. Impact of alternative wetting and soil drying and soil clay content on the morphological and physiological traits of rice roots and their relationships to yield and nutrient use-efficiency. Agric. Water Manag. 2019, 223. [Google Scholar] [CrossRef]
  23. Cosgrove, D.J. Plant cell wall extensibility: Connecting plant cell growth with cell wall structure, mechanics, and the action of wall-modifying enzymes. J. Exp. Bot. 2016, 67, 463–476. [Google Scholar] [CrossRef] [PubMed] [Green Version]
  24. Liu, Z.; Li, W.; Xu, Z.; Zhang, H.; Sun, G.; Zhang, H.; Yang, C.; Liu, G. Effects of different nitrogen forms and concentrations on seedling growth traits and physiological characteristics of Populus simonii × P. nigra. J. For. Res. 2022, 33, 1593–1606. [Google Scholar] [CrossRef]
  25. Young, M.D.; Wakefifield, M.J.; Smyth, G.K.; Oshlack, A. Gene ontology analysis for RNA-seq: Accounting for selection bias. Genome Biol. 2010, 11, R14. [Google Scholar] [CrossRef] [Green Version]
  26. Li, C.; Hu, H.-W.; Chen, Q.-L.; Chen, D.; He, J.-Z. Growth of comammox Nitrospira is inhibited by nitrification inhibitors in agricultural soils. J. Soils Sediments 2020, 20, 621–628. [Google Scholar] [CrossRef]
  27. Keerio, H.A.; Bae, W.; Panhwar, S. Nitrite Accumulation at Low Ammonia Concentrations in Wastewater Treatment Plants. Sustainability 2022, 14, 16449. [Google Scholar] [CrossRef]
  28. Rufty, T.W.; Volk, R.J. Alteration in enrichment of NO3and reduced-N in xylem exudate during and after extended plant exposure to 15NO3. Plant Soil 1986, 91, 329–332. [Google Scholar] [CrossRef]
  29. Wang, Z.; Zhang, W.; Beebout, S.S.; Zhang, H.; Liu, L.; Yang, J.; Zhang, J. Grain yield, water and nitrogen use efficiencies of rice as influenced by irrigation regimes and their interaction with nitrogen rates. Field Crop. Res. 2016, 193, 54–69. [Google Scholar] [CrossRef]
  30. Xu, G.-w.; Lu, D.-K.; Wang, H.-Z.; Li, Y. Morphological and physiological traits of rice roots and their relationships to yield and nitrogen utilization as influenced by irrigation regime and nitrogen rate. Agric. Water Manag. 2018, 203, 385–394. [Google Scholar] [CrossRef]
  31. Andrews, M.; Raven, J.A.; Lea, P.J. Do plants need nitrate? The mechanisms by which nitrogen form affects plants. Ann. Appl. Biol. 2013, 163, 174–199. [Google Scholar] [CrossRef]
  32. Gao, Y.; Li, Y.; Yang, X.; Li, H.; Shen, Q.; Guo, S. Ammonium nutrition increases water absorption in rice seedlings (Oryza sativa L.) under water stress. Plant Soil 2009, 331, 193–201. [Google Scholar] [CrossRef]
  33. Wang, P.; Wang, Z.-k.; Sun, X.-c.; Mu, X.-h.; Chen, H.; Chen, F.-j.; Lixing, Y.; Mi, G.-h. Interaction effect of nitrogen form and planting density on plant growth and nutrient uptake in maize seedlings. J. Integr. Agric. 2019, 18, 1120–1129. [Google Scholar] [CrossRef]
  34. Simkin, A.J.; Kapoor, L.; Doss, C.G.P.; Hofmann, T.A.; Lawson, T.; Ramamoorthy, S. The role of photosynthesis related pigments in light harvesting, photoprotection and enhancement of photosynthetic yield in planta. Photosynth. Res. 2022, 152, 23–42. [Google Scholar] [CrossRef]
  35. Lin, Z.H.; Chen, L.S.; Chen, R.B.; Zhang, F.Z.; Jiang, H.X.; Tang, N. CO2 assimilation, ribulose-1,5-bisphosphate carboxylase/oxygenase, carbohydrates and photosynthetic electron transport probed by the JIP-test, of tea leaves in response to phosphorus supply. BMC Plant Biol. 2009, 9, 43. [Google Scholar] [CrossRef] [Green Version]
  36. Yang, X.; Chen, X.; Ge, Q.; Li, B.; Tong, Y.; Zhang, A.; Li, Z.; Kuang, T.; Lu, C. Tolerance of photosynthesis to photoinhibition, high temperature and drought stress in flag leaves of wheat: A comparison between a hybridization line and its parents grown under field conditions. Plant Sci. 2006, 171, 389–397. [Google Scholar] [CrossRef]
  37. Liu, G.; Du, Q.; Li, J. Interactive effects of nitrate-ammonium ratios and temperatures on growth, photosynthesis, and nitrogen metabolism of tomato seedlings. Sci. Hortic. 2017, 214, 41–50. [Google Scholar] [CrossRef] [Green Version]
  38. Collado-Gonzalez, J.; Pinero, M.C.; Otalora, G.; Lopez-Marin, J.; Del Amor, F.M. Effects of Different Nitrogen Forms and Exogenous Application of Putrescine on Heat Stress of Cauliflower: Photosynthetic Gas Exchange, Mineral Concentration and Lipid Peroxidation. Plants 2021, 10, 152. [Google Scholar] [CrossRef]
  39. Ogawa, T.; Sonoike, K. Screening of mutants using chlorophyll fluorescence. J. Plant Res. 2021, 134, 653–664. [Google Scholar] [CrossRef]
  40. Ahammed, G.J.; Xu, W.; Liu, A.; Chen, S. COMT1 Silencing Aggravates Heat Stress-Induced Reduction in Photosynthesis by Decreasing Chlorophyll Content, Photosystem II Activity, and Electron Transport Efficiency in Tomato. Front. Plant Sci. 2018, 9, 998. [Google Scholar] [CrossRef]
  41. Chen, Y.; Xu, H.; He, T.; Gao, R.; Guo, G.; Lu, R.; Chen, Z.; Liu, C. Comparative Analysis of Morphology, Photosynthetic Physiology, and Transcriptome Between Diploid and Tetraploid Barley Derived From Microspore Culture. Front. Plant Sci. 2021, 12, 626916. [Google Scholar] [CrossRef] [PubMed]
  42. Tietz, S.; Hall, C.C.; Cruz, J.A.; Kramer, D.M. NPQ(T): A chlorophyll fluorescence parameter for rapid estimation and imaging of non-photochemical quenching of excitons in photosystem-II-associated antenna complexes. Plant Cell Environ. 2017, 40, 1243–1255. [Google Scholar] [CrossRef] [PubMed]
  43. GUO, H.X.; LIU, W.Q.; SHI, Y.C. Effects of different nitrogen forms on photosynthetic rate and the chlorophyll fluorescence induction kinetics of flue-cured tobacco. Photosynthetica 2006, 44, 140–142. [Google Scholar] [CrossRef]
  44. Croucher, N.J.; Fookes, M.C.; Perkins, T.T.; Turner, D.J.; Marguerat, S.B.; Keane, T.; Quail, M.A.; He, M.; Assefa, S.; Bahler, J.; et al. A simple method for directional transcriptome sequencing using Illumina technology. Nucleic Acids Res. 2009, 37, e148. [Google Scholar] [CrossRef] [PubMed] [Green Version]
  45. Senevirathna, J.D.M.; Yonezawa, R.; Saka, T.; Igarashi, Y.; Funasaka, N.; Yoshitake, K.; Kinoshita, S.; Asakawa, S. Transcriptomic Insight into the Melon Morphology of Toothed Whales for Aquatic Molecular Developments. Sustainability 2021, 13, 13997. [Google Scholar] [CrossRef]
  46. Wen, B.; Gong, X.; Chen, X.; Tan, Q.; Li, L.; Wu, H. Transcriptome analysis reveals candidate genes involved in nitrogen deficiency stress in apples. J. Plant Physiol. 2022, 279, 153822. [Google Scholar] [CrossRef]
  47. Morosinotto, T.; Breton, J.; Bassi, R.; Croce, R. The nature of a chlorophyll ligand in Lhca proteins determines the far red fluorescence emission typical of photosystem I. J. Biol. Chem. 2003, 278, 49223–49229. [Google Scholar] [CrossRef] [Green Version]
  48. Wientjes, E.; van Stokkum, I.H.; van Amerongen, H.; Croce, R. The role of the individual Lhcas in photosystem I excitation energy trapping. Biophys. J. 2011, 101, 745–754. [Google Scholar] [CrossRef] [Green Version]
  49. Wientjes, E.; Oostergetel, G.T.; Jansson, S.; Boekema, E.J.; Croce, R. The role of Lhca complexes in the supramolecular organization of higher plant photosystem I. J. Biol. Chem. 2009, 284, 7803–7810. [Google Scholar] [CrossRef] [Green Version]
  50. Amunts, A.; Toporik, H.; Borovikova, A.; Nelson, N. Structure determination and improved model of plant photosystem I. J. Biol. Chem. 2010, 285, 3478–3486. [Google Scholar] [CrossRef] [Green Version]
  51. Fristedt, R.; Trotta, A.; Suorsa, M.; Nilsson, A.K.; Croce, R.; Aro, E.M.; Lundin, B. PSB33 sustains photosystem II D1 protein under fluctuating light conditions. J. Exp. Bot. 2017, 68, 4281–4293. [Google Scholar] [CrossRef] [PubMed]
  52. Kato, Y.; Yokono, M.; Akimoto, S.; Takabayashi, A.; Tanaka, A.; Tanaka, R. Deficiency of the Stroma-Lamellar Protein LIL8/PSB33 Affects Energy Transfer Around PSI in Arabidopsis. Plant Cell Physiol. 2017, 58, 2026–2039. [Google Scholar] [CrossRef] [PubMed] [Green Version]
  53. Vargas-Suarez, M.; Castro-Sanchez, A.; Toledo-Ortiz, G.; Gonzalez de la Vara, L.E.; Garcia, E.; Loza-Tavera, H. Protein phosphorylation regulates in vitro spinach chloroplast petD mRNA 3′-untranslated region stability, processing, and degradation. Biochimie 2013, 95, 400–409. [Google Scholar] [CrossRef] [PubMed]
  54. Huarancca Reyes, T.; Scartazza, A.; Pompeiano, A.; Ciurli, A.; Lu, Y.; Guglielminetti, L.; Yamaguchi, J. Nitrate Reductase Modulation in Response to Changes in C/N Balance and Nitrogen Source in Arabidopsis. Plant Cell Physiol. 2018, 59, 1248–1254. [Google Scholar] [CrossRef] [Green Version]
  55. Huang, L.; Zhang, H.; Zhang, H.; Deng, X.W.; Wei, N. HY5 regulates nitrite reductase 1 (NIR1) and ammonium transporter1;2 (AMT1;2) in Arabidopsis seedlings. Plant Sci. 2015, 238, 330–339. [Google Scholar] [CrossRef] [Green Version]
  56. Zhao, L.; Zhang, W.; Yang, Y.; Li, Z.; Li, N.; Qi, S.; Crawford, N.M.; Wang, Y. The Arabidopsis NLP7 gene regulates nitrate signaling via NRT1.1-dependent pathway in the presence of ammonium. Sci. Rep. 2018, 8, 1487. [Google Scholar] [CrossRef] [Green Version]
  57. Teng, Y.; Liang, Y.; Wang, M.; Mai, H.; Ke, L. Nitrate Transporter 1.1 is involved in regulating flowering time via transcriptional regulation of FLOWERING LOCUS C in Arabidopsis thaliana. Plant Sci. 2019, 284, 30–36. [Google Scholar] [CrossRef]
  58. Zhang, X.; Cui, Y.; Yu, M.; Su, B.; Gong, W.; Baluska, F.; Komis, G.; Samaj, J.; Shan, X.; Lin, J. Phosphorylation-Mediated Dynamics of Nitrate Transceptor NRT1.1 Regulate Auxin Flux and Nitrate Signaling in Lateral Root Growth. Plant Physiol. 2019, 181, 480–498. [Google Scholar] [CrossRef] [Green Version]
  59. Medici, A.; Szponarski, W.; Dangeville, P.; Safi, A.; Dissanayake, I.M.; Saenchai, C.; Emanuel, A.; Rubio, V.; Lacombe, B.; Ruffel, S.; et al. Identification of Molecular Integrators Shows that Nitrogen Actively Controls the Phosphate Starvation Response in Plants. Plant Cell 2019, 31, 1171–1184. [Google Scholar] [CrossRef]
Figure 1. Effects of DMPP on photosynthetic pigment content in leaves. Chlorophyl a content (a); chlorophyl b content (b); content of chlorophyl a + b (c); carotenoid content (d). All the values are means ± SE of three replicates. Different letters represent significant differences at p < 0.05 level (LSD test).
Sustainability 15 04130 g001
Figure 2. Effects of DMPP concentration on photosynthetic parameters of leaves. Transpiration rate (a); net photosynthetic rate (b); intercellular CO2 concentration (c); stomatal conductance (d). All the values were expressed as means ± SE of three replicates. Different letters represent significant differences at p < 0.05 level (LSD test).
Sustainability 15 04130 g002
Figure 3. Effects of DMPP on chlorophyll fluorescence parameters of grape leaves. Initial fluorescence (a); maximum fluorescence in dark-adapted state (b); maximum photochemical efficiency (c); potential photochemical activity (d); photochemical quenching coefficient (e); non-photochemical quenching coefficient (f). All the values were means ± SE of three replicates. Different letters represent significant differences at p < 0.05 level (LSD test).
Sustainability 15 04130 g003
Figure 4. Principal component analysis (PCA) of transcriptome samples from roots and leaves treated with conventional fertilization (CK) versus 1% DMPP (T2).
Sustainability 15 04130 g004
Figure 5. Volcanogram (leaves (a), roots (b)), cluster map (leaves (c), roots (d)), number of differentially expressed genes in grape seedlings (e), and Venn map under application of urea nitrogen content 1% of DMPP (f). CKL and CKR represent the leaves and roots of CK seedlings, respectively; T2L and T2R represent the leaves and roots of T2 treatment seedlings, respectively. In the volcano map (a,b), gray dots are genes with insignificant differences, while red and blue dots are genes with significant differences. The x-axis displays log2 fold change (FC) and the y-axis displays p-values. In the cluster diagram (c,d), red represents up-regulated genes and blue down-regulated protein-coding genes.
Sustainability 15 04130 g005
Figure 6. The top 20 KEGG pathways in leaves (a) and roots (b) with the application of urea nitrogen content 1% of DMPP. CKL and CKR represent the leaves and roots of CK seedlings, respectively; T2L and T2R represent the leaves and roots of T2 treatment seedlings, respectively.
Sustainability 15 04130 g006
Figure 7. Heat map of differentially expressed genes (DEGs) associated with photosynthesis in grape leaves supplemented with DMPP. The screening range of DEGs is p-value < 0.05 and −1 < log2FC < 1. CKL represents the leaves of CK seedlings; T2L represents the leaves of T2 treatment seedlings.
Sustainability 15 04130 g007
Figure 8. Heatmaps of DEGs in Nar in the leaves (a), Nar in the roots (b), and Nrt in the roots (c) of grape seedlings with the application of 1% DMPP. The screening range of DEGs is p-value < 0.05 and −1 < log2FC < 1. CKL and CKR represent the leaves and roots of CK seedlings, respectively; T2L and T2R represent the leaves and roots of T2 treatment seedlings, respectively.
Sustainability 15 04130 g008
Table 1. Effects of DMPP on total biomass, above-ground, and roots biomass of grape seedlings.
TreatmentsTotal Biomass (g)Above-Ground Biomass (g)Roots Biomass (g)
CK130.77 ± 1.57 d96.62 ± 1.02 d34.15 ± 0.63 d
T1154.86 ± 1.62 b114.31 ± 1.06 b40.55 ± 0.80 b
T2199.07 ± 2.07 a138.38 ± 1.49 a60.69 ± 1.25 a
T3140.95 ± 1.23 c103.55 ± 0.97 c37.40 ± 1.47 c
Note: Different letters after values in same column mean significantly different (at p < 0.05 level). All the values were means ± SE of three replicates.
Table 2. Effects of DMPP on root characteristics of grape seedlings.
TreatmentTotal Root Length (cm)Total Surface Area (cm2)Total Root Volume
(cm3)
Root Vigour
(mg/g.h)
CK4942.67 ± 109.64 d2413.73 ± 121.62 b69.33 ± 0.63 c4869.60 ± 70.41 b
T16051.69 ± 93.30 b2755.79 ± 167.24 ab74.09 ± 1.65 ab5471.67 ± 391.29 ab
T26648.38 ± 79.38 a2880.42 ± 104.43 a75.32 ± 0.74 a5785.72 ± 230.64 a
T35581.79 ± 211.85 c2573.53 ± 161.97 ab71.36 ± 1.54 bc4825.60 ± 347.30 b
Note: Different letters after values in same column mean significantly different (at p < 0.05 level). All the values were means ± SE of three replicates.
Table 3. The number of DEGs in the four pathways with the most number of genes under application of urea nitrogen content of 1% of DMPP.
GO CategoryTermDEGs-UpDEGs-Down
LeafMolecular functionMolecular function696433
Biological processBiological process648430
Cellular processesCellular component578372
Cellular processesCellular anatomical entity561366
RootMolecular functionMolecular function295108
Biological processBiological process285100
Cellular processesCellular component24595
Cellular processesCellular anatomical entity24395
Disclaimer/Publisher’s Note: The statements, opinions and data contained in all publications are solely those of the individual author(s) and contributor(s) and not of MDPI and/or the editor(s). MDPI and/or the editor(s) disclaim responsibility for any injury to people or property resulting from any ideas, methods, instructions or products referred to in the content.

