Abstract
As sustainability becomes fundamental to companies, voluntary and mandatory disclosures or corporate sustainability practices have become a key source of information for various stakeholders, including regulatory bodies, environmental watchdogs, nonprofits and NGOs, investors, shareholders, and the public at large. Understanding sustainability practices by analyzing a large volume of disclosures poses major challenges, given that the information is mostly in the form of text. Applying machine learning and text analytic methods, we analyzed approximately 25,428 disclosure reports for the period of 2011 to 2020, extracted from the Securities and Exchange Commission (SEC) filings and made available at the Ceres website via application programming interfaces (APIs). Our study identified six industry clusters from the K-means and six main topics from the latent Dirichlet allocation (LDA) method that related to the disclosure of climate-change-related environmental concerns. Both methods produced overlapping results that further reinforce and enhance our understanding of climate-change-related disclosure at various levels, such as sector, industry, and topic. Our analysis shows that companies are concerned primarily with the topics of gas emission, carbon risk, climate change, loss and damage, renewable energy, and financial impact when disclosing climate-change-related issues to the government. The study has implications for corporate sustainability practices, the communication and dissemination of such practices to stakeholders at large and furthering our understanding of sustainability in general.
1. Introduction
Sustainability is a universal concern [1,2]. Environment pollution inequity, injustice, and poverty continue to be faced by millions of people across the world [3]. While sustainability is gaining attention at the macro level (e.g., at the United Nations SDG, regional, and country levels), large companies are still focused on maximizing wealth based on shareholder theory, rather than taking the negative impacts of climate change into consideration [4]. Heavy industrial development is still a threat to sustainable development in many developing countries [5]. However, on the brighter side, corporate sustainability is gaining increased attention due to pressure from various stakeholders [6]. While corporate sustainability has been variously defined, the idea generally includes the pledge of a business to contribute to sustainable execution of business operations, working with multiple stakeholders, such as customers, suppliers, employees and their families, the government, nonprofits, NGOs, watchdogs, the community in which it does business, and the greater society, to enhance the quality of living [6]. An outgrowth of corporate engagement is sustainability is that companies are facing increasing tension on two issues—the demand for more disclosure and transparency and the need to adopt good corporate governance practices [7]. This stakeholder- and activist-fueled ultimatum for business answerability and clarity [8,9] has arisen out of the growing concern for rapid environmental degradation and the adverse effects of climate change. The negative tide and across-the-board apprehension regarding the future state of mankind due to the potential adverse effects of business endeavors have caught the attention of global citizenry. In the glare of such tension, businesses have elevated environment, social, and governance (ESG) to the front of the business mission [10,11]. The executive suite is starting to recognize the need for greater clarity regarding business ESG initiatives and their implications for the planet [12]. To enlighten the concerned parties, corporate social responsibility (CSR) and ESG data are being incorporated into business revelations (e.g., annual reports, 10-K and other filings), and corporate road-map strategies are being redrawn to have superior CSR and ESG outcomes [11]. CSR encompasses a gamut of perspectives, such as promoting economic expansion, shareholder benefit, image and standing, customer and supplier linkages, and the caliber of its products and services [13]; substantiating the proactive and routine incorporation of ESG aspects in corporate practices [14]; addressing stakeholders’ current needs without yielding the capability to manage the future requirements [15]; and generating everlasting stakeholder benefit by embracing opportunities while overcoming challenges in ESG [16]. Despite a surplus of definitions, the unifying theme is the expected business allegiance to CSR and ESG initiatives [17,18]. Businesses have shown their dedication to sustainability by embracing various initiatives and communicating these typically via disclosures and reporting [19]. Most companies, especially publicly traded ones, must practice mandatory financial compliance and reporting. However, sustainability-related disclosures are typically voluntary [20,21]. The triple-bottom-line view of Elkington (1998) with respect to ESG [22] pays attention to three components, namely economic, environmental, and social [23]. This perspective argues that businesses owe it to stakeholders to not only generate profits and earnings but also reckon with CSR and ESG issues [24]. Thereupon, the number of corporations that disseminate particulars on their CSR/ESG is increasing exponentially [25]. To reiterate, a key method by which these corporations disseminate the CSR/ESG information is via the CSR/ESG (sustainability) report, typically appended to the financial filings and reports [26,27]. In this research, we adopt a data-driven approach to eliciting corporate climate change and environmental concerns by applying machine learning text analytic methods to the SEC filings by corporations in the United States.
For the past many years, researchers have attempted to glean insight into CSR/ESG or various companies from these filings and reports [28]. While some researchers have focused on the timing and other meta-level data from the disclosures (filings/reports), others have paid attention to interpreting the narrative and extracting the key elements of the CSR/ESG practices [25,29]; yet others have applied traditional qualitative methods, such as content analysis, to delve into the disclosures [24]. More recently, studies have started to examine the content using formal computing methods, such as machine learning and text analytics. The goal is to elicit keywords and topics that describe CSR/ESG. For example, a simple word count may indicate the popular themes [24,26,27,30,31,32]. In general, most of these studies have analyzed fewer disclosures and applied basic analytic techniques, thereby limiting their findings. More recently, Szekely and vom Brocke (2017) used advanced text analytic methods, such as topic modeling, on approximately 9514 sustainability disclosure reports that were submitted between 1999 and 2015 [26]. They used latent Dirichlet allocation (LDA) to identify the primary themes that emerged from their large sample of disclosures [33]. Simultaneously, a new phenomenon has emerged in which large companies are including more sustainability-related information in their mandatory and voluntary disclosures, such as in SEC filings [28,34,35]. This is in response to a demand by the numerous stakeholders, particularly activist shareholders, and institutional investors for more formal information [36,37]. Activists are relentless in their criticism of major companies, such as BP, Chevron, Exxon, and Shell, typically in the oil and gas industry for perceived negative impact on the environment [38]. Given the tension to ameliorate the environment [39] and the high cost of environmental wrongdoing, e.g., via litigation [40], it is no wonder current disclosures emphasize the environment [28,41,42,43]. Climate change, for example, escalates health threats and creates public health concerns, such as respiratory and cardiovascular diseases, temperature-related death and illness, and threats to mental health [44,45,46]. In this era of heightened awareness of climate change, a new epoch of sustainability is spreading across the globe as citizens are becoming environmentally conscious and asserting their determination through their lives. Businesses are also becoming mindful of their CSS/ESG practices on the larger communities in which they do business [14,15,47].
Our impetus for this study comes from several perspectives: First, sustainability has permeated business practices, while, at the same time, society wants to be engaged and informed; second, what follows is businesses are enthusiastically responding to CSR/ESG; third, companies are more actively communicating their engagement via several media, including social media, such as Twitter and Facebook, and through voluntary and mandatory disclosures especially filed with the Securities and Exchange Commission (SEC), a US government regulatory agency; and fourth, research in sustainability disclosure (in general) and sustainability reports (in particular) is still scarce and far from mature [27]. Surfacing out corporate sustainability issues and practices from this perceived authentic source (SEC) would shed light on the disclosures.
Our empirical study builds on prior studies that have applied advanced machine learning and text analytics (e.g., [26,27]) to elicit and scrutinize the more significant environment and climate change aspects disclosed in the corporate SEC filings. While past studies have, in general, explored sustainability reports, we examine climate change and environmental disclosures contained in the various filings (10-K, 20-F, and 40-F) with the SEC. It is important to note that while disclosure in sustainability reports is primarily subjective and voluntary on the part of the company, disclosure in the filings with the SEC is typically mandated and subject to audit. Pulling corporate sustainability issues and practices from this highly regarded source would shed light on the disclosures. In analyzing sustainability disclosures, we focused primarily on climate change, environmental issues, and the variances in sustainability issues among the sectors/industries [26,27].
We add to current research on the environment and climate change in several ways. First, our research examines the disclosures submitted to a government regulatory agency, namely the SEC. Therefore, the disclosures and our findings are more credible. Second, we examine more recent data in disclosures, the most recent year being 2020, and include an entire decade, resulting in a substantial volume of data. By extending the period studied as well as the quantity of disclosures, we expand the scope of the study to run analyses at the industry and sector levels. Further, this empowered us to focus the spotlight on the progression of topics over time, as well as investigate inter-industry and inter-sector comparisons. Third, we contribute to the advancement of the ever-increasing application of machine learning and text analytics to understanding large corpuses of unstructured text data (tens of thousands of disclosures) absent predetermined keywords. Fourth, this study examines the environment and climate change issues through the lens of the company. When companies use the findings of this study themselves, and by watchdogs, nonprofits and NGOs, regulatory bodies, and others, it will lead to improved environmental and climate change practices as the entities make informed decisions [26,27]. Thus, we analyze corporate disclosures in their SEC filings to elicit sustainability concerns and issues, particularly in terms of climate change and the environment.
The rest of this study is arranged as follows: Section 2 provides an overview of the research background with discussions of sustainability, sustainability disclosures and reporting, and machine learning and text analytics. Methods, results, and analysis are presented in Section 3; Section 4 provides a discussion, while Section 5 highlights the scope and limitations; and lastly, Section 6 offers conclusions and future possibilities for research.
2. Research Background
2.1. Sustainability
The Brundtland Commission’s 1987 report labeled “Our Common Future” defined sustainability as “development that meets the needs of the present without compromising the ability of future generations to meet their own needs [48]” (World Commission on Environment and Development, 1987). Though this definition emphasizes the environment, the report is also aware that “development cannot be said to be sustainable if it is not equitable, or if it does not meet the pressing needs of the majority of the inhabitants of the globe.” Not only must sustainability engage the current generation, but it must also be mindful of the needs of future generations. This view of sustainability has been accepted universally [26,49]. Though the Brundtland report provides a working definition, the expression “corporate sustainability” generally refers to companies [49]. While some researchers have focused on the environmental components of sustainability, others have highlighted the social dimensions. Yet others have adopted a more holistic approach integrating environmental, social, and economic issues, without any one issue dominating [49,50]. Corporate sustainability is generally perceived to be the epitome of economic function, environmental performance, and social responsibility [15,51]. Focusing on environmental performance, the related practices address the consequences of the expending of natural resources and the production of gaseous emissions. Generally, it would be expected that the two be at the minimum levels possible to safeguard the overall ecosystem [15]. It follows then that positive environmental practices are associated with diminishing environmental destruction by preserving natural resources, including energy [52], and efficient waste disposal, for example, via recycling [53]. The typical metrics of measuring the environment are air emissions, biodiversity, energy usage, natural resource loss, solid waste, transportation, and water use and discharge [51,54]. The social practice has the goal of improving the quality of life of local communities [15,52]. Economic sustainability practices support long-term liquidity and healthy returns on investments to the stakeholders [15]. However, the latter two are not the targets of this study. Companies are also motivated to immerse themselves in sustainability due to regulation [51]. In addition, they are susceptible to encouragement from customers, employees, and suppliers [55], as well as stress from management, since long-term investments in sustainability may indeed promote financial performance [56]. All in all, it is settled that companies the world over are engaged in CSR/ESG as indicators of sustainability. The key challenge then is, how do these companies’ practices become more visible? The answer lies in the timely and effective disclosure of their sustainability practices, namely filings and reports [49].
2.2. Sustainability Disclosures and Reporting
Sustainability and its disclosure go together. To wit, companies share their sustainability-related information to enable transparency and thereby create a positive image about themselves. Numerous theories attempt to explain the dynamics of sustainability disclosures. Applying legitimacy and stakeholder theories, the disclosure of financial, environmental, and social information (i.e., corporate sustainability disclosure—CSD) is inclusive in the ongoing conversation between a company and its stakeholders. A disclosure facilitates relevant information flow regarding a company’s sustainability-related initiative that assists in the company’s activities that help validate its attitude, educate the public, and transform expectations [57,58]. The prospect of the enabling the possibility of environmental reporting is fueling increased awareness of the promise of sustainability [59]. Researchers have therefore emphasized the imperative to inquire further into the various dimensions and nuances that can leverage disclosure practices [59,60]. As indicated before, the literature has confirmed the companies’ use of sustainability disclosure to manage their reputation risk [59,61]. Corporate sustainability disclosure has also been used as a channel to connect with the various stakeholders. It implies the company may communicate with different stakeholders, including regulatory agencies, nonprofits and NGOs, activist shareholders, institutional investors, and others [62,63,64,65,66]. Researchers, realizing the value of these disclosures, have quested to extract the nuggets of insight from the companies’ dissemination via various publication outlets. While the disclosures may provide biased views, namely those of management, nevertheless, one gets at least an inkling of the company’s practices [26,67]. Numerous researchers have studied various aspects of corporate sustainability reports (disclosures) by adopting different methods [3,68]. Sobhani et al. (2011), for example, identified the performance indicators disclosed in corporate sustainability reports [3,65]. Managers can use sustainability reports to obtain accurate knowledge of a company’s sustainability efforts, rather than relying on third parties. Similarly, researchers can analyze sustainability reports to test hypotheses entailing sustainability reporting and performance. Studies that have conducted content analysis of sustainability reports have investigated the evolution of report content quality [25,65] or trends in sustainability reporting in industries [69,70] or countries. Tate et al. (2010) analyzed sustainability reports using content analysis with automated software to uncover supply chain sustainability themes, which are compared against companies’ geographic location and revenues [71]. Montabon et al. (2007) also conducted content analysis of corporate sustainability reports based on environmental management practices identified in the literature [72]. However, there were limitations as to how the analysis was carried out [61]. Several previous studies have measured companies’ level of disclosure through simply the number of relevant words, sentences, or pages in sustainability reports on different themes [69,70]. The drawback of counting space allocations for certain words or themes is that such an approach fails to capture the information in the reports [65]. In a similar vein, some researchers have used computer-aided text analysis to uncover supply chain sustainability (e.g., [71]). However, many sustainability reports present information graphically, which limits the use of computer-aided text analysis [65]. In addition, sustainability reporting in Australia, for example, is largely voluntary and most reports/disclosures are not subject to the process of assurance. Overall, as researchers continue to use several qualitative techniques, due to a paucity of quantitative data that would be more amenable to analysis, machine learning and text analytics have emerged as the leading methods with immense potential in this domain [18,26,27,28,29,30,31,32,33,34,35,36,37,38,39,40,41,42,43,44,45,46,47,48,49,50,51,52,53,54,55,56,57,58,59,60,61,62,63,64,65,66,67,68,69,70,71,72,73,74].
2.3. Machine-Learning-Based Text Analytics
The increasing number of sustainability reports and growing interest among the diverse stakeholder groups have created new challenges for policymakers and researchers in measuring the effectiveness and exploring the information of these reports, given the diversity of the reports’ content and structures [30]. Machine-learning-based text analytics has emerged as a viable technique to analyze large corpuses of unstructured data, such as textual data. Multiple tasks, such as text categorization, text clustering, entity extraction, document summarization, and entity relation modeling, can be implemented via text mining [75]. Recently, machine-learning-based text analytics has garnered enthusiasm in its application to the analysis of sustainability and CSR/ESG-related textual disclosures and reports [18,26,27]. Considering the wide prevalence of unstructured data, extracting knowledge from these corporate disclosures is discerning for application and research. For instance, Bayesian-combined text mining has been applied to the study of economic, environmental, and social factors in a large sample of sustainability reports, revealing that the content of the reports is fragmented even under the Global Reporting Initiative [30]. Text mining using multivariate discriminant analysis has been used to investigate sustainability reports, indicating that firms’ disclosures differ across industrial sectors. Text mining has also been implemented in the comparative analysis of sustainability reports before and after an industrial crisis, demonstrating a decline in the quantity of disclosed information during the year of the crisis [41]. Computer-based content analysis has been used to explore sustainable supply chain management trends based on news articles and sustainability reports [76]. Green IT practices across industries have also been researched using dictionary-based text mining [77]. The trend and pattern of firms’ sustainability reports in the Indonesian construction industry have been studied via text mining, enabling stakeholders to interpret the firms’ sustainability strategies [78]. Moreover, semi-supervised text mining using association rules has been adopted to study the maritime industry’s sustainability reports, providing managerial implications for the maritime industry to satisfy SDGs [79]. Hence, applying a text-mining method to explore sustainability disclosure information is acknowledged as appropriate. Due to the prevalence of unstructured data, extraction of knowledge from these corporate disclosures is highly significant for research as well as for application.
The power of natural language processing (NLP), machine learning (ML), and text analytics together in spontaneously discovering patterns and trends in textual documents cannot be underestimated. By using these multiple methods simultaneously, the researcher can prepare and can convert large volumes of unstructured data (“big data”) into a ordered format that is appropriate for the application of ML techniques, and further conduct analysis [80]. Using text analytics, researchers can wrest various facets and the relationships among them. In the current research context, SEC filings about sustainability proffer a justified arena of study. It provides a substantial canon of ill-structured textual data. It is also indicative of significant reflections of top management and therefore presents a requisite depository to investigate. Since businesses disseminate their allegiance to various societal missions, it is only natural that the disclosures be probed in detail.
The methodology of machine-learning-based text analytics has been applied in numerous streams of research to analyze unstructured textual data, such as tweets on vaccination [81], shareholder resolutions about sustainability [18], sustainability disclosure on the web [17,26,27], or legal analysis [82]. To reiterate, machine learning and text analytics together offer powerful analytical tools to interpret big text data [26,27,32,83]. The understanding gained from the study would guide top executives, shareholders, institutional and individual investors, and watchdogs to make informed decisions.
Compared with other text-mining methods, LDA is the most straightforward probabilistic approach to model topics from textual documents [26,27]. LDA generates a list of topics that have weights for each document, making it suitable to handle large datasets and produces insightful results. The methods of TF-IDF, cluster analysis, and LDA are three of the more appropriate and widely used ML-based text analytic methods and, therefore, used in this study [26,27].
3. Methods, Results, and Analysis
This text-analytics-based research study delves into the sustainability disclosures of companies to understand the expansive sustainability issues, practices, and trends. The origin of the disclosures’ data is the website of Ceres, a sustainability-focused, non-profit concern that has made available several searchable databases (https://tools.ceres.org/resources/tools/sec-sustainability-disclosure/ (accessed on 1 September 2021)) that offer a rich source for analysis. According to Ceres, its SEC Sustainability Disclosure Search tool can assist in gaining insight into how companies handle the perils as well as the benefits that may arise from issues such as climate change, carbon asset risk, water availability and quality, and hydraulic fracturing (ceres.com). Their tool searches the text of SEC annual filings (10-K, 20-F, and 40-F) and readily identifies pertinent disclosures. According to Ceres, it then distinguishes the information, identifies the location of the disclosure in the filing, and makes it all available in the searchable database (ceres.com) [84,85]. To this end, our data are from a legitimate source, namely the Securities and Exchange Commission, a government entity. The database makes it easy for researchers to access the disclosures via an API and be able to analyze the large amount of text data to gain insight into corporate sustainability practices (https://www.ceres.org/resources/tools/sec-sustainability-disclosure-search-tool (accessed on 1 September 2021)). Such a tool is also useful to investors and other stakeholders interested in knowing more about the opportunities and risks presented by climate change and other ESG issues in companies. According to Ceres, these disclosures in the SEC filings can be compared with the voluntary disclosures that are made via other channels, such as those made to non-profits. To reiterate, machine learning and text analytics together offer powerful analytical tools to interpretand study a large corpus of textual data in a productive way [26,32,83]. The understanding accrued from the study would guide top executives, shareholders, institutional and individual investors, and watchdogs to make informed decisions. The text data were retrieved using the Ceres API, and they were cleaned using advanced data-cleansing methods. Preprocessing steps were then applied. However, we focused only on the disclosures relating to climate change risks filed between 2011 and 2020. The API-enabled disclosure information, such as the company name, division, industry, year, and ticker, and the disclosure content were all in JSON format. Therefore, Python was used to extract all file name numbers and climate change risk disclosure content, where available. Data were retrieved as of 30 September 2020. There were a total of 53,418 files (disclosures) provided by 5347 companies. However, only 48% of the files mentioned climate change risks. So, machine-learning-based text analysis techniques were applied only to those 25,428 files. First, we conducted descriptive data analysis to obtain a panoramic view of the disclosures. Next, we conducted topic modeling and other text analytic methods. For example, we constructed the term frequency–inverse document frequency (TF-IDF) model and K-means to group industries with similar foci. Figure 1 outlines our overall research methodology.
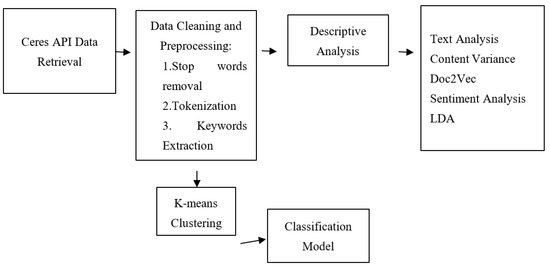
Figure 1.
Overall methodology workflow.
Table 1 summarizes the disclosure rate for the period 2011–2020 that we extracted and synthesized from the files. It shows the percentage of companies that disclosed climate-change-related information in their filings for each of the years. As seen, the number of companies providing disclosures related to climate change was relatively stable during the 10 years of this study and most of the disclosures were typically provided by publicly traded companies.

Table 1.
Filings’ summary in the Ceres database.
Likewise, it was observed that all disclosures follow the same structure in the Ceres API. For example, Figure 2 shows the disclosure information for the company 1ST SOURCE CORP in 2017, which is under the “Banks and Financial Service” industry group and the “Finance, Insurance, and Real Estate” division. It also shows all disclosure contents related to climate change for the company in the 2017 annual filing.
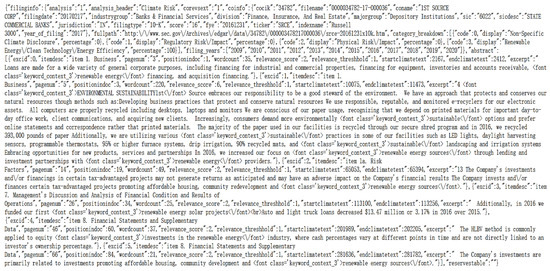
Figure 2.
Ceres API structure.
As mentioned previously, Python was used to retrieve all the data from Ceres, which were then transformed into a structured DataFrame. Table 2 shows the variables extracted from each company’s disclosure collectively. Besides the basic information about a company, such as the name, industry, and ticker, Ceres also provided four risk ratios. These ratios were extracted as well. They were calculated by dividing the frequency of relevant keywords/phrases in each risk category by the frequency of total keywords/phrases appearing in the excerpt. The four ratios would add up to 1 (100%).
Table 2.
Disclosure structure in the CERES dataset.
The four risk ratios were pre-defined by Ceres. They highlighted the relevant keywords/phrases in the excerpt and classified them into four risk categories. Ceres then calculated the distribution for terms in each risk category. This was to provide the values for the four risk ratios for each report (disclosure). The sample terms and phrases for each risk category are shown in Table 3. Appendix A provides a snapshot view of the industry (division) of companies with disclosures in the year 2020.
Table 3.
Sample terms and phrases for risk categories (source: ceres.org (accessed on 1 September 2021)).
3.1. Text Analytics
Next, machine-learning-based text analytics was applied to examine the disclosures. To apply ML and text analytics, considerable data engineering preparation and data-preprocessing methods were adopted. The retrieved data for each disclosure were saved as a text file prior to vectorization. A smatter of disclosures was deleted due to a paucity of relevancy/materiality and broken links. A caveat with text data is that predictive analytic models developed with text data muddy the analytical methods. First, textual data cannot be used as input in many precise numerical or quantitative models. Therefore, an NLP program was run to transfigure the textual content into distinct components elements for additional scrutiny. Second, text-based datasets are bigger in terms of volume vis-à-vis quantitative datasets. Therefore, a robust archetype warrants data extraction by recognizing the most appropriate chunks of data. In the data engineering step, the granular information in the summary section was converted into simple text output (files) through the removal of typical punctuation marks, spaces, numbers, and standard stop words using the Natural Language Toolkit (NLTK). Next, the text was changed to lowercase using the NLTK and TextBlob (https://textblob.readthedocs.io/en/dev/ (accessed on 1 September 2021)) for uniformity. Tokenization was applied to this engineered data to break up the sequence of strings into word groups [18,81]. Next, the lemmatization approach was carried out to reduce the words into their bare root shell (e.g., “bought” and “buying” were substituted with “buy”). Lemmatization draws on aggregating in unison the various manifestations of each word. This facilitates the examination of a collection of words as composite words [18,81]. The benefit lies in finding meaning within and between the composite words. The pandas package (https://pandas.pydata.org/) (accessed on 1 September 2021) was used to screen and arrange the text files into data frames for ready analysis. The sklearn package (https://scikit-learn.org/stable/index.html (accessed on 1 September 2021)) was then used to iterate the output. When planning to conduct text analytics, the researcher’s first thought would be to use NLP, typically one of the most rudimentary of models, namely the Bag of Words. However, such models fail to capture the syntactic relationship between words. For example, suppose TF-IDF (term frequency–inverse document frequency) was calculated based on only the Bag of Words. This model will not be able to capture the difference between “I live in the United States,” where “states” is a noun, and “He states his intention,” where “states” is a verb. Part-of-speech (POS) tagging is the method by which words in a corpus can be marked up to the analogous part of the speech tag based on its definition and context. For example, in the sentence “Give me your answer,” answer is a noun, but in the sentence “Answer the question,” answer is a verb. POS tagging can differentiate words based on their functions in sentences. There are 36 different types of POS tags, and the common tags are adjective, verb, noun, proper noun, adverbs, and others. In this study, POS tagging techniques were applied to preprocessed tokens and only tokens in noun and proper noun tags were retained. The rationale is that the nouns and proper nouns carry more meaningful information than other tags. Figure 3 shows the top 55 noun and proper nouns and frequencies in the overall disclosure reports during 2011 to 2020. For a detailed count of each term, please refer to Appendix B.
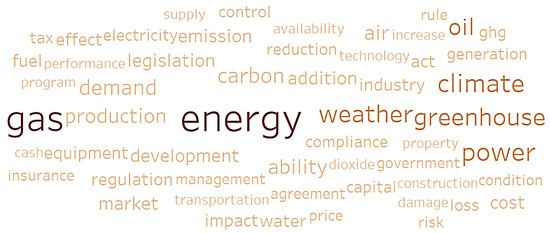
Figure 3.
Word cloud of top 55 nouns and proper nouns.
As shown in Figure 3, the darker the color and the larger the size, the more frequently the word appears in the overall disclosure report. It is obvious that energy-related words, such as gas, emission, power, and oil, formed a substantial portion of the content. Climate-change-related words, such as greenhouse, ghg, water, air, and carbon dioxide, were also quite significant. Furthermore, regulation-related terms, such as legislation, compliance, regulation, and agreement, were prominent as well.
The term frequency–inverse document frequency (TF-IDF) technique mentioned before was next applied to calculate the weight of each term to denote its relative importance in a document. This is a data retrieval approach that allocates a weight to a term’s frequency (TF) and its inverse document frequency (IDF). Each term is given these two scores. The weight of the term is then computed as a product of these scores. TF-IDF is a statistical modeling tool used to assess the worth of a word to a document that belongs in a corpus. The value of a word increases vis-à-vis the frequency of its appearance in a document [29,44]. Simultaneously, it decreases in reverse symmetry to the frequency of its presence in the corpus. The primary thrust of TF-IDF is that when a word or phrase appears in a document with a greater frequency of TF, and seldom shows up in other documents, the word or phrase has reasonable classification prowess and is competent for classification problems. In this study, the companies’ disclosures were divided into 31 industry groups to calculate the TF-IDF value for the 55 extracted keywords. The resulting matrix is a data frame with a size of 31 × 55. Figure 4 displays partial examples of the final matrix.
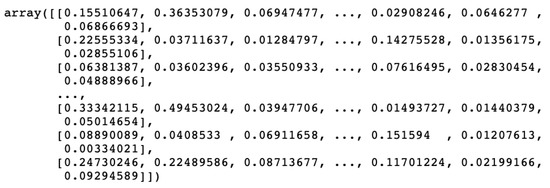
Figure 4.
Example of a TF-IDF matrix.
There were a total of 31 rows representing 31 different industry group. Each row contained 55 values, and a high value for a keyword implied that the high term frequency was weighted by the oddity of the keyword’s occurrence. Subsequently, the K-means clustering model was developed to surface-out the key sustainability concepts. K-means, a widely used ML algorithm for clustering, is typically set to classify cases based on similarity measures (i.e., the distance between the cases). It is generally applied to solve classification and pattern recognition problems. For this study, six high-level clusters were identified with a word cloud utility. Classification with the KNN classifier (a supervised machine learning algorithmic method) next ensued. In this application, the data were partitioned into two sets (training and testing datasets) to assess the success of the classifying algorithm. The rationale is to recognize the varied subclasses (i.e., the clusters) in the data such that the observations (cases) in the same subclass are akin, while the observations in the different clusters are distinct from each other. The TF-IDF features of the top 55 keywords for each industry were extracted as our model input variables. K-means clustering was implemented to obtain the clusters, which were then labeled numerically. Since the goal was to find the patterns of keywords that describe different industries, the K-means algorithm was used to build the segmentation of six clusters formed from among the 31 industry groups that contained 4461 companies. The model was evaluated using the silhouette score. The silhouette score is an average measure of how close each point in one cluster is to points in the neighboring clusters, and a positive value indicates the point has been classified to a correct cluster. The six-cluster model had an acceptable average silhouette score of 0.4, as shown in Figure 5.
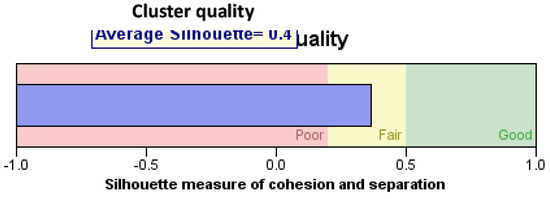
Figure 5.
Silhouette score of the K-means clustering model.
In Figure 6, the taxonomy of clusters and keywords is displayed. The six different clusters are shown in different colors and shapes, and for each cluster, the most important keywords are identified. One can describe each cluster based on its keywords. The silhouette score is used to appraise the caliber of a cluster identified with the use of standard clustering algorithms, such as K-means. The issue addressed is to what degree are the observations clustered with other observations that are like one another. The value of the silhouette score varies from −1 to 1. When the score is 1, the clusters are distinct and sharply delineated. A value close to 0 indicates congruent clusters with the observations in proximity to the decision boundary of the nearby clusters. In this study, the derived silhouette score of 0.4 indicated the clusters were quite distinct.
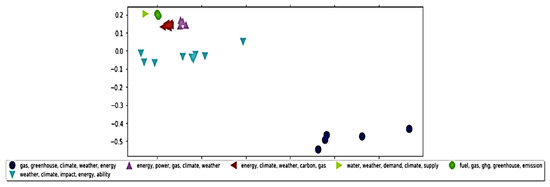
Figure 6.
K-means clustering visualization.
There were in total 6 clusters that were marked with different colors and shapes. The number of shapes in each cluster represents the number of industries that have been grouped into that cluster.
As observed in Figure 6, the blue circle represents the top five key features in cluster 1. These are different from the other five clusters. Table 4 gives detailed information about each cluster, the key features, the number of industries, and the specific industries.
Table 4.
Cluster taxonomy.
Besides common key features, such as gas, ghg, and climate, industries in different clusters have their own specific focus. For example, oil/gas manufacturing and consumption industries, such as oil and gas, transportation, and aerospace and defense are in cluster 1 with the unique key feature “oil.” An eclectic group of industries, representing “climate” change, are in cluster 2. One could extrapolate that all industries are concerned about climate change. Indeed, several industries fall into this cluster. Cluster 3 is labeled as “energy,” and the main industries in this cluster are electric power and gas utilities. Cluster 4 has the greatest number of industries and is associated with “impact,” which has a couple of interpretations. One, companies are concerned about the impact of climate change and environmental degradation on their business and on the planet. Two, companies have been concerned in recent years with the effect of climate change and the environment on financial performance and shareholder value. In cluster 5, we see some association with “cost,” likely related to the loss and damage incurred due to climate change and an adverse environment (e.g., the negative effect of extreme weather).
Heavy emission industries, such as automobile and coal mining, are in cluster 6 with the unique key feature “ghg.” When compared to the “issues” available at ceres.com, climate change, carbon, and water are common topics, while this study surfaced “impact” (of sustainability) as a key topic.
As discussed previously, a text-based dataset contains rich, yet complicated information compared to numerical datasets, so a data-preprocessing step was needed to tease the relevant information out of the lengthy text. Second, besides TF-IDF, several other textual analysis methods, such as sentiment analysis, POS tagging, and doc2vec, were also applied.
To gain insight into the regulatory aspects mentioned by companies in their sustainability disclosures, the statutes typically mentioned in terms of compliance by extracting law-related phrases using spaCy (https://spacy.io/ (accessed on 1 September 2021)), a natural language processing API, were identified. This allows one to extract chunks of text by using POS tagging annotation or a phrase pattern. For example, if one wants to extract all the adjectives followed by a noun, one can specify {POS:ADJ},{POS:NOUN} and the API will return all the matched results. Specifically, we used the matcher engine called Rule Based Matcher to perform token-based matching to find descriptive words for “laws,” “Act,” and “regulations.” We chose to extract words connected with “Act” because they were domain specific to law. For example, this gives “Clean Water Act” or “Federal Power Act” instead of vague law phrases, such as “related requirements” or “state law.” A caveat is we did not know which state. At first, POS tags were used to set the matching patterns, such as below:

However, we noticed some specific statutes or act names were abbreviated or contained values such as “10-K SEC Act,” which could not be captured by the POS tagging patterns. Given the fact that the descriptive words before “Act” always modify it in this case, another approach was taken by setting the wildcard token (token with wildcard logic) as the matching pattern, which tells the matcher to search for and extract any two or three tokens that the word “Act” follows. As a result of this method, one can locate all the sentences that contain “Act” and find out which “Act” is the most concerning and frequently mentioned during the past 10 years. In Figure 7, a bar chart shows the most cited statutes (acts) in the disclosure reports during the past 10 years.
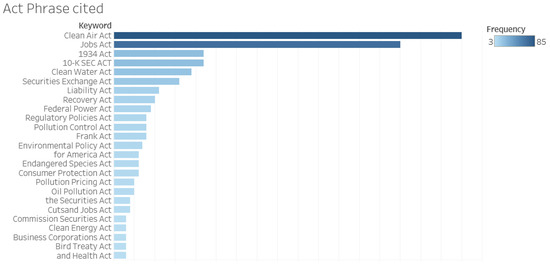
Figure 7.
Acts (statutes) cited.
The top 30 federal and state statutes by frequency cited in the disclosures are displayed. The implication is the higher the frequency of mention, the more relevant the statute to sustainability-related activities. The extraction of the statutes is a novel contribution of this study. Further, we were also interested in the types of greenhouse gases mentioned most frequently in the companies’ disclosure reports during the past 10 years. The following donut chart was developed by counting the number of occurrences of various types of greenhouse gases mentioned in the companies’ disclosures and the proportional relationship between them and the total number of counts. This is shown in Figure 8.
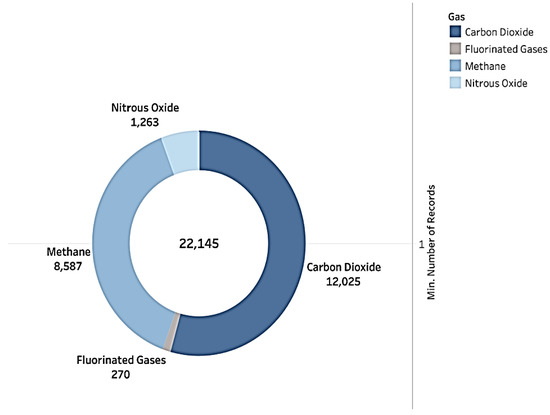
Figure 8.
Proportional distribution of various greenhouse gases.
The chart shows that carbon dioxide is the main source of greenhouse gases, followed by methane. Companies appear to pay close attention to the emission of carbon dioxide and methane, followed by other gases. The fact that greenhouse gases are even mentioned in the disclosures indicate companies are getting interested in addressing greenhouse-gas-caused climate change. To get a sense of how much a company’s disclosure changes over time, the content variance for each company was calculated. First, the NLTK POS tagging package was used to extract top 20 most frequent noun keywords from the companies’ most recent and oldest disclosure reports, and then, cosine similarity was applied between the two vectorized lists. For example, the company Advance Auto Parts Inc. (ticker: AAP) has been providing climate-change-related disclosures consistently from 2011 to 2020. For the 10 years of disclosure content, the top 20 most frequent noun keywords of its disclosure report for 2011 and those in its report for 2020 were compared. A content variance of 1 means the two disclosures’ top 20 keywords are the same, whereas a content variance of 0 means the two disclosures’ top 20 keywords share nothing in common. The content variance for each company was calculated and the results visualized using a box-and-whisker plot for all sectors. Figure 9, a box-and-whisker graph, exhibits the content variance distribution across the different sectors of all companies that provided climate-change-related disclosures.
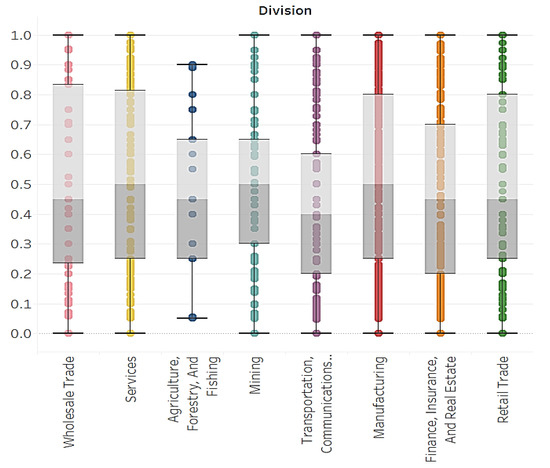
Figure 9.
Box-and-whisker plot for content variance of different sectors.
Figure 9 shows that the median content variance scores for eight sectors were all around 0.45. Since its box is more skewed downward, the transportation and communications division tends to have a similarity score closer to 0 compared to other sectors. We concluded that the disclosure contents for companies in the transportation and communications sector vary more over time when compared to other sectors. Doc2Vec similarity captures how similar a company’s disclosure compares with other companies’ disclosure reports within the same industry. The methodology for Doc2Vec (https://medium.com/wisio/a-gentle-introduction-to-doc2vec-db3e8c0cce5e (accessed on 1 September 2021)) is based on Word2Vec (https://en.wikipedia.org/wiki/Word2vec (accessed on 1 September 2021)), a tool for unsupervised learning of uninterrupted depictions of large chunks of text, such as sentences, paragraphs, or even whole documents. This text analysis technique was applied to create a numeric representation of a document regardless of its length. The most recent disclosure report for each company was used as the input content. The Doc2Vec model was trained with all the disclosure reports and additional data, such as id and industry type, as additional vectors. The Doc2Vec score was calculated for each disclosure. If two disclosure reports within the same industry carried similar Doc2Vec scores, one can deduce that the content of these two reports is similar in terms of the expressions and words/phrases used. Examining the Doc2Vec score itself does not provide any insight. However, if the variance of these scores is calculated, one can gain a sense of how different or how variant the content is within a certain sector. Figure 10 is a heat map showing the variance of Doc2Vec similarity scores of different sectors.
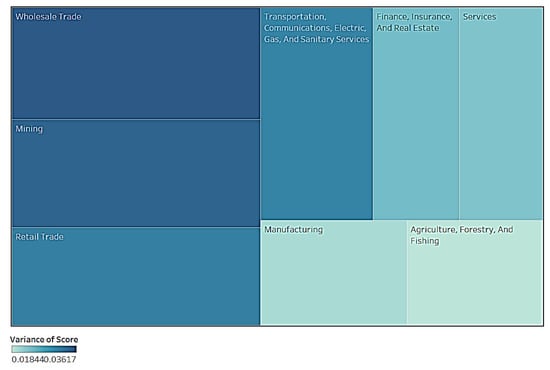
Figure 10.
Heat map for variance of the Doc2Vec similarity score of different sectors.
The darker and larger the box, the larger the variance, and the more variant the content within that specific sector. As shown in Figure 10, the variance of Doc2Vec similarity scores was the highest in the wholesale trade sector, meaning the disclosure content of companies in the wholesale trade sector varies more from each other than from companies in other sectors.
3.2. Disclosure Sentiment
The well-known and commonly used technique of sentiment analysis computationally distinguishes and compartmentalizes beliefs expressed in the text. This helps especially to determine what the opinionator’s stance is toward a particular topic, etc. (https://en.wikipedia.org/wiki/Sentiment_analysis (accessed on 1 September 2021)). Given that one of the goals of this study was to explore the relationship between a company’s risk propensity and climate change, it is useful to obtain insight into a company’s position on regulatory, climate change, and renewable energy policies. VADER (Valence Aware Dictionary and Sentiment Reasoner) is a commonly used lexicon and rule-based sentiment analysis tool that is particularly geared toward the extraction of sentiment expressed in social media platforms and functions well on texts in other spheres (https://pypi.org/ (accessed on 1 September 2021)). The advantage of VADER is it can be used to analyze large amounts of text data, with a relatively high accuracy, sometimes even outperforming the human raters (http://comp.social.gatech.edu/papers/icwsm14.vader.hutto.pdf (accessed on 1 September 2021)). It is sensitive to both the polarity (positive negative) and intensity of emotions. Besides this, VADER also has a basic understanding of the context of the text it reads. For example, “love” is a word that conveys positive meaning. VADER can recognize “did not love” as a negative statement because of its context awareness. It generates three polarity scores for a given text: positive, negative, and compound. The negative sentiment scores were used in this study since they better reflect the challenge of climate-change-related risk to a company’s business. The challenge faced in this analysis was to extract pieces of clean text containing the topics that we desired to evaluate, while discarding irrelevant data. An approach that used NLTK sentence segmentation—a sentence tokenizer to split a large disclosure corpus into sentences—was adopted. An attempt was made to search for topics in each sentence, followed by sentiment analysis. The overarching goal was to obtain the sentiment scores of environmental regulatory, climate change, and renewable technology to gain insight into the companies’ views on these three risk categories (excluding physical risk). Three sets of risk-category-related keywords were created (shown in Table 5), including regulation, climate issue, and technology sentiments. The keywords related to regulation were scoped to include words such as “EPA” and “GHG.”
Table 5.
Selected keywords for each topic.
Three sets of sentiment analysis were conducted to capture companies’ perspectives on the three risk categories. The keywords were selected from the top 30 frequent keywords that were mentioned in the 25,428 disclosures.
Figure 11 is a line chart showing the compound sentiment score for the aspects of regulatory-related company disclosures. As shown in the chart, the increasing trend in the wholesale trade industry implies companies in this sector have complied with laws and regulation more effectively during the recent year. The compound sentiment in the mining sector decreased from 2019 to 2020.
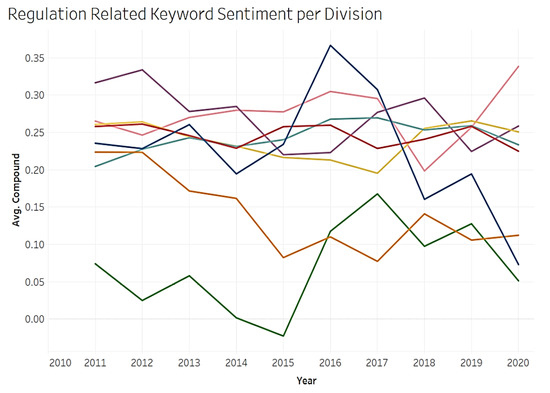
Figure 11.
Disclosure sentiment score for regulatory policies, 2011–2020.
Figure 12 shows the compound sentiment score for the aspects of climate-change-related company disclosures. As shown in the chart, the compound sentiment score for agriculture disclosures dramatically decreased during recent years. This implies that the agricultural business has been severely affected by the recent escalation in climate change and that companies perceive climate change as a risk factor to their business.
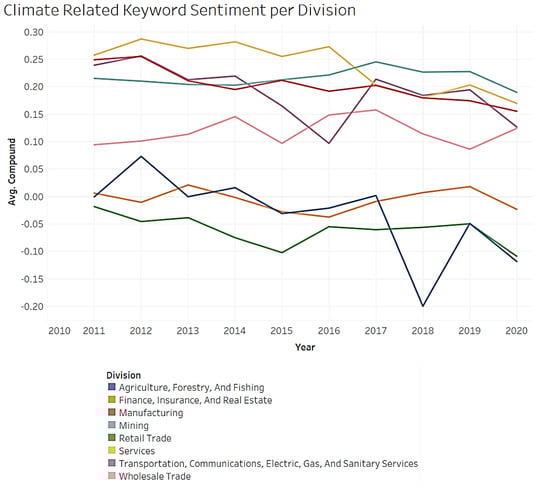
Figure 12.
Disclosure sentiment score for climate change (emission and greenhouse gas), 2011–2020.
Figure 13 shows the compound sentiment score for the aspects of renewable-energy-related company disclosures. As shown in the chart, the compound sentiment score in agriculture disclosures dropped during the year 2020. This is because the number of disclosures in the agricultural sector is low, so the base number of the average is high, thereby resulting in extreme values. We next turn our attention to topic modeling.
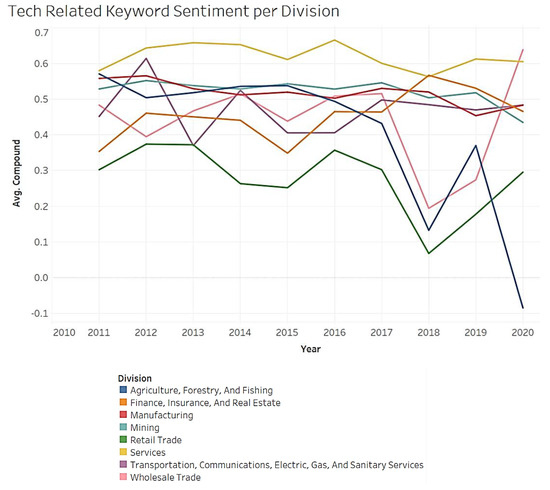
Figure 13.
Disclosure sentiment score for renewable energy, 2011–2020.
3.3. Topic Modeling (LDA)
The aim of latent Dirichlet allocation (LDA) is to assist in the classification of the content of disclosures reports and find a mix of topics that companies focused on. LDA was applied to the disclosure content to elicit the key topics addressed by the disclosures [26,27]. By assigning each disclosure to a cluster, the model can glean the hidden characteristics in the text and generate labels for the supervised learning model. Since unsupervised learning models have a high degree of uncertainty, Gensim’s LDA implementation was used (https://radimrehurek.com/gensim_3.8.3/models/ldamodel.html (accessed on 1 September 2021)). This uses the variational Bayes sampling method as model 1 and mallet LDA (http://mallet.cs.umass.edu/ (accessed on 1 September 2021)), which is typically more precise than Gensim, as model 2 to conduct the cross-validation. Perplexity and coherence scores were used as evaluation standards to compare the topic models. Each disclosure content was assigned to a dominant topic as the content label. This way, one would know which aspect the specific company’s disclosure report focuses on. Based on this method, six key topics were identified and are described below. Additionally, Appendix A contains an overview of all 70 topics. It includes the most conspicuous terms in each as well as the probability of occurrence (how high is the likelihood that the specific term appears in the topic) of these terms in a topic. To tweak the models, the text was lemmatized and bigrammed/trigrammed to group related phrases into one token for the model. Moreover, to extract the most sustainability-related topics, English stop words and certain common word lists were removed from the disclosure texts. In tokenization, the sentences were split into words, all words were lowercased, and all punctuations were removed. A stop-word list was developed, and those words were removed as well. Further, lemmatization and stemming were applied again to transform the words into their granular form (e.g., “bought” and “buying” would be replaced with “buy”) so they could be analyzed as single objects. Figure 14 provides a general understanding of the focus of topics before constructing the topic model. It shows the term frequencies of the most used words in all disclosure reports. One can observe that “emission,” “gas,” and “energy” or possibly “climate change” and other environment-related words are frequently mentioned in the disclosures.
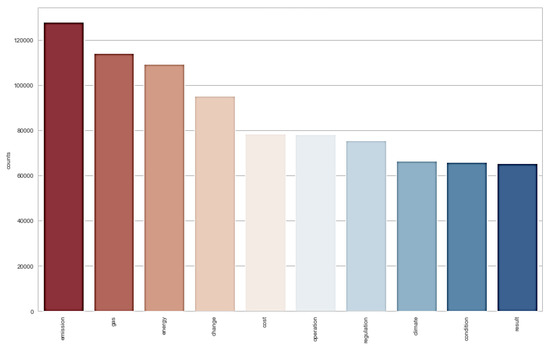
Figure 14.
Top 10 most common words.
To build the initial LDA model, the parameter for the number of topics was set to 20, alpha to 0.01, and beta to 0.1 to develop the initial model as a baseline model for performance comparison. The perplexity level and coherence scores were calculated for this purpose. The perplexity level measures the probability of unexpected results in the classification. The coherence score is a value of the semantic similarity between high-frequency words. It assesses the quality of the learned topics; therefore, the higher the score, the better the quality of the topics extracted. The perplexity score measures how credibly the model represents or reproduces the statistics of the hold-out data. From a performance perspective, one would want to build a model with a low perplexity level and a high coherence score by tweaking the topics and other coefficients.
The overall performance of the initial model is shown below:
Perplexity: −6.39885911951267
Coherence score: 0.4222068061701333
The initial model demonstrated reasonable performance, as indicated by the perplexity level, while the coherence score indicated the model needs additional refinement. Tuning is a way to maximize the performance of a model without overfitting or producing a large variance. A series of sensitivity tests were conducted to determine the number of topics (K), Dirichlet hyperparameter alpha (Document-Topic Density), and Dirichlet hyperparameter beta (Word-Topic Density). The tests were performed sequentially. One parameter was examined at a time by holding others constant. Figure 15 shows the coherence score for the number of topics across one epoch of the validation set with a fixed alpha = 0.01 and beta = 0.1. It plotted the number of topics by coherence score and studied the trend as the number of topics ranged from 2 to 15. We observed that while the coherence score was volatile as the number of topics changed, it had the best value when the number of topics was 6. As the coherence score appeared to decrease after 6 topics, K = 6 was chosen.
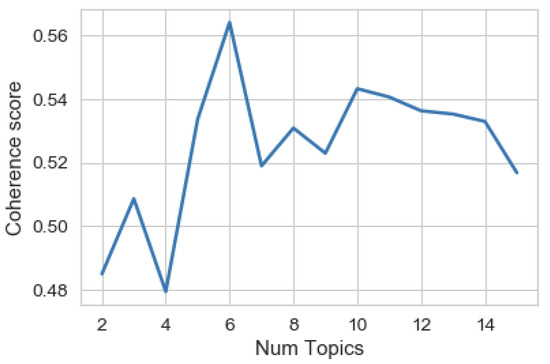
Figure 15.
Number of topics vs. LDA model coherence score.
The evaluation metrics of the optimal model are shown below.
Perplexity: −7.196056573358106
Coherence score: 0.5500174631782340
In further comparing model 1 (Gensim’s LDA) to model 2 (mallet LDA), the perplexity level and coherence scores showed nearly identical performance with similar keywords in each topic. Therefore, to scope the analysis, only the results from model 1 (Gensim) were examined further. The results in Table 6 were generated with this LDA model. Six topics were extracted along with their corresponding terms. On examination of the terms, each topic was assigned a label that most reflected the terms within. These topics and terms are indicative of the sustainability issues that companies are typically concerned with. Label categories to some extent reflect the companies’ emphasis on a certain topic. The six key topics are gas emission, carbon risk, climate change, loss and damage, renewable energy, and financial impact. When compared to the “issues” at ceres.com, the relatively common topics were climate change and carbon risk. The other topics identified in this study included gas emission, loss and damage, renewable energy, and financial impact. Financial impact was a major topic identified in this study. This is consistent with the extant literature that has emerged on the association between sustainability and company/financial performance [86,87].
Table 6.
LDA-generated topics and terms.
Figure 16 displays the topic distance map; the area within the circle characterizes the importance of each topic over the entire corpus, and the distance between the centers of the circles describes the similarity between the topics. The topic distance map was drawn using the built-in function of the pyLDAvis package to visualize the volume of topics and the keywords contained in the topic [86,87]. To the left, the different-size bubbles represent the topics; the larger the bubble, the more companies’ disclosures in that topic. The distance between the topics approximates the extent of the semantic relationship between the topics, and if the topics share common keywords, the bubbles will overlap (in proximity). The right part of Figure 16 is a bar chart showing the relative importance of each term in topic 1. The red-shaded area describes the frequency of each term in each topic, while the blue bar shows the frequency distribution of the terms in all disclosures. Topic 1 is the largest topic in all the disclosures put together; the top 30 keywords in the right bar chart represent the most frequent keywords in this topic group. Studying the keywords in Table 6 and Figure 16, topic 1 seems to have disclosures related to greenhouse gas emissions and corresponding legislative action. Topic 1 also overlaps with topic 4 by having a few keywords. Topic 6 has a large distance from the other topics. This makes sense as topic 6 describes the financial impact aspect of sustainability. As mentioned previously, the related keywords describe issues different than the keywords of the other traditional sustainability-related topics. Topics 1, 2, 3, and 4 are in proximity and collectively describe environment-related topics, since they share the related keywords. Among the environmental topics, topic 1 focuses more on greenhouse gas emissions, and topic 2 pays more attention to carbon-related emissions affecting sustainability. Topic 3, however, shows a specific focus on climate change correlated with weather and risks. Topic 4 contains more natural-disaster-related keywords, while topic 5 deals with renewable energy technologies. Topic 6, of course, highlights the financial impact [88,89]. This topic is an interesting finding of this study. Figure 17 is a highlight table showing the count of companies within different sectors that focus predominantly on specific topics. As seen, each sector has its own focus.
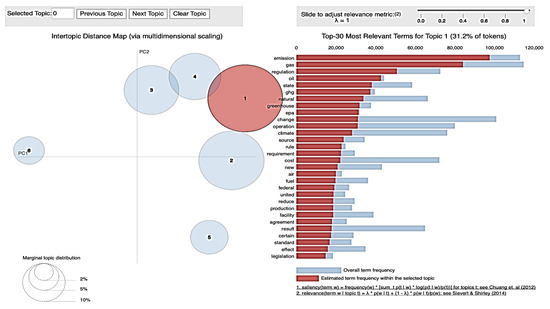
Figure 16.
LDA model visualization [86,87].
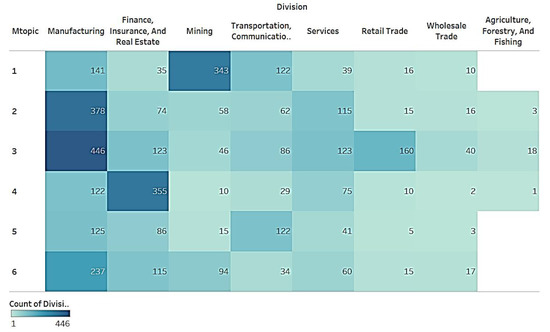
Figure 17.
Highlight table for sector and topic counts.
For example, manufacturing emphasized topic 2 (carbon risk) and topic 3 (climate change), while finance, insurance, and real estate focused on topic 4 (loss and damage). However, these are not mutually exclusive. Every sector is associated with each of the six topics. Caution must be paid attention to the total number of companies in each sector, as frequency counts are not being compared.
4. Discussion
Our research applied topic modeling and other text analytic methods to approximately 25,428 disclosure reports filed with the SEC in the years 2011–2020 to identify key climate change and environmental issues companies are concerned with. We identify the six key topics as gas emission, carbon risk, climate change, loss and damage, renewable energy, and financial impact. These topics and terms are indicative of the sustainability issues that companies are typically concerned with. Financial impact is a major topic identified in this study. This is consistent with the recent literature that has emerged on the association between ESG/sustainability and company financial performance. Specifically, the analysis indicates carbon dioxide is the main source of greenhouse gases, followed by methane. Companies appear to pay close attention to the emission of carbon dioxide and methane, followed by other gases. The fact that greenhouse gases are even mentioned in the disclosures indicate companies are getting interested in addressing greenhouse-gas-caused climate change. The study also finds that besides common key features, such as “gas,” “ghg,” and “climate,” industries in different clusters have their own specific focus. For example, oil/gas manufacturing and consumption industries, such as oil and gas, transportation, and aerospace and defense, are described by a unique key feature “oil.” An eclectic group of industries is characterized by “climate change.” One could extrapolate that all industries are concerned about climate change. Energy describes the primary industries of electric power and gas utilities. Interestingly, a large number of industries is associated with “impact.” Overall, companies are concerned about the impact of climate change and environmental degradation on their business and on the planet. In addition, companies have been concerned in recent years with the effect of climate change and the environment on financial performance and shareholder value. Some industries are associated with “cost,” likely related to the loss and damage incurred due to climate change and an adverse environment (e.g., the negative effect of extreme weather). Heavy emission industries, such as automobile and coal mining, are characterized by “ghg.” Generally, our study indicates that the number of companies providing disclosures related to climate change has been relatively stable during the 10 years of this study and that most of the disclosures were typically provided by publicly traded companies.
5. Scope and Limitations
From a research method perspective, the reproducibility and replication of results are some of the major challenges related to applying machine learning and text analytics to unstructured data. Additionally, despite algorithmic modeling, the intuitive naming of clusters (topics) limits our conclusions somewhat. Still, based on comparisons with other studies, we are confident the findings here are consistent with those from prior research. Thus, the methods developed and applied here lend themselves to future studies in this area. Additional limitations extend to the reliability of disclosure data and/or the validity of data engineering methods. In addition, this is a data-driven study wherein extracted disclosures were subject to machine-learning-based text analytics. Therefore, our research background that summarizes contemporary studies in sustainability-related topics is not subject to a formal method to identify the literature. Rather, several searches were conducted, including in Scopus, to ensure recency of cited studies.
There are limits to the generalizability of the clusters (topics), particularly when examining purely voluntary disclosures and not those of all registered companies. The disclosures may not sufficiently reflect overall corporate initiatives or efforts relating to sustainability. Further, ML algorithm models can only extract limited insight, being constrained by their assumptions. Additionally, this study used the disclosure tool at ceres.org to extract the information based on the assumption that ceres.org accurately gleans sustainability information from various corporate filings with the SEC.
6. Conclusions and Future Research
This exploratory study attempted to shed light on climate-change- and environment-related sustainability issues of companies by studying the sustainability-related disclosures submitted to the SEC in various filings. Our study provided a comprehensive overview of the key climate change and environment topics and issues that companies are concerned with in terms of sustainability. In addition to the dimension-level analysis, the study provided an overview of corporate sustainability disclosure at the sector and industry levels. The research objective was met by the identification of six key clusters using the K-means method and six main topics using the LDA method that related to the disclosure of climate-change-related environmental concerns. As discussed before, both methods produced results that are generally overlapping. The overlapping results further reinforce and enhance our understanding of climate-change-related disclosure at various levels, such as sector, industry, and topic. Our analysis shows that companies are concerned primarily with the topics of gas emission, carbon risk, climate change, loss and damage, renewable energy, and financial impact. While a wider range of topics, such as CSR and ESG, may be included in sustainability, the sustainability disclosures examined in this study predominantly focused on climate-change- and environmental-related issues only. However, many other issues necessitate further research. For example, this study found hardly any information about social, governance, ethics, or human rights topics [90,91,92]. However, recent research is developing new models of sustainability applications and practices and alternative cost–benefit and performance models. For example, Novoselov et al. (2022) discuss social investment approaches versus traditional compensation models in the sustainable development of the Arctic [93,94]. They argue for a “social orientation” that considers the aspirations of the native population. In the case of the Artic, this implies the development of contemporary social infrastructure indigenous to the polar, energy-conscious, and environmentally appropriate dwellings; the promotion of the local business; the nurturing of local tourism; and the protection of cultural traditions and the conservancy of ethnic groups of the Arctic [93,94]. Rather than focusing on firm-level financial performance, the authors [93,94] suggest that the industrialization of the Arctic should dwell on the quality of life by enabling the creation of jobs such that the people do not have to migrate and can live in their own communities and reduce poverty and disease [91,92]. Future research should investigate the linkages between corporate CSR, ESG, and sustainability in the context of the SDGs.
One may also investigate how textual documents such as SEC filings can be used to conduct predictive analytics to get a handle on direction and action. Sentiment analysis can be deployed to explore stakeholders’ attitudes and shifts in the long run. The effect of disclosures on the community in general and stakeholders (e.g., climate change activists) can be analyzed from the perspective of social media (public sentiment analysis). Further, as recently emerging studies indicate, the effect of good sustainability practices on corporate performance (e.g., financial, reputation) is another area of potential study. Notwithstanding the limitations, our study contributes to sustainability policy and research in several ways. First, we used data on disclosures published as recently as 2020 and looked at a time frame that includes multiple years. Second, we analyzed a significantly large number of disclosures. By extending the time frame and number of disclosures, we extended the coverage to many divisions, industries, and sectors. This also enabled us to explore inter-industry/inter-sector comparisons. Third, we contributed to the advancement of the ever-increasing application of machine learning and text analytics to understand large corpuses of text data, namely the disclosures. Text analysis offers the novel ability to deep-dive into text data without assuming a pre-defined list of terms. Fourth, our study analyzed corporate sustainability from the company’s perspective (i.e., management).
Companies themselves, as well as watchdogs, nonprofits and NGOs, regulatory bodies, and others, will be able to use the findings of this study to make informed decisions, leading to improved sustainability practices. Future studies can continue to analyze disclosure data using alternative ML techniques, such as deep learning, to obtain more robust and richer analysis. For example, prescriptive and discovery analytics can be explored for not just predicting likely outcomes of practices but also developing creative solutions to climate change and other problems.
Other future research directions encompass exploring the phenomenon of sustainability disclosure across industries or across the globe and analyzing the association between sustainability and company performance. Research into sustainability is still at a nascent stage, but rapid advances in analytical platforms and tools can accelerate the maturing process.
Author Contributions
All the authors (W.R., S.J.W. and V.R.) contributed equally to conceptualization, methodology, software, validation, formal analysis, investigation, resources, data curation, writing, visualization, supervision, and project administration. All authors have read and agreed to the published version of the manuscript.
Funding
This research received no external funding.
Institutional Review Board Statement
Not applicable.
Informed Consent Statement
Not applicable.
Data Availability Statement
The data will be made available upon request to the corresponding author.
Conflicts of Interest
The authors declare no conflict of interest.
Appendix A
Table A1.
Industry distribution of companies with disclosures in 2020.
Table A1.
Industry distribution of companies with disclosures in 2020.
| Industry-Division | Count of Industry | # of Companies |
| Agriculture, Forestry, and Fishing | 1 | 7 |
| Agriculture | 1 | 7 |
| Finance, Insurance, and Real Estate | 3 | 580 |
| Banks and Financial Services | 1 | 239 |
| Insurance Services | 1 | 93 |
| Real Estate Finance/Property Development/Construction | 1 | 248 |
| Manufacturing | 9 | 715 |
| Aerospace and Defense | 1 | 19 |
| Automotive | 1 | 10 |
| Chemicals | 1 | 72 |
| Consumer Goods | 1 | 53 |
| Electronics | 1 | 81 |
| Food and Beverages | 1 | 75 |
| Manufacturing and Industrial Materials | 1 | 189 |
| Medical Equipment Manufacturing | 1 | 43 |
| Pharmaceuticals/Health Care | 1 | 173 |
| Mining | 3 | 282 |
| Coal Mining | 1 | 13 |
| Mining | 1 | 59 |
| Oil and Gas | 1 | 210 |
| Retail Trade | 2 | 96 |
| Apparel and Textiles | 1 | 28 |
| Retail | 1 | 68 |
| Services | 6 | 200 |
| Entertainment and Recreation | 1 | 12 |
| Hospitality and Tourism | 1 | 41 |
| Information Technology | 1 | 59 |
| Services—Business Related | 1 | 43 |
| Services—Educational | 1 | 4 |
| Services—Other | 1 | 41 |
| Transportation, Communications, Electric, Gas, and Sanitary Services | 6 | 259 |
| Electric Power and Gas Utilities | 1 | 121 |
| Media | 1 | 14 |
| Telecommunications | 1 | 27 |
| Transportation | 1 | 75 |
| Waste Management | 1 | 11 |
| Water Utility/Services | 1 | 11 |
| Wholesale Trade | 1 | 40 |
| Wholesale | 1 | 40 |
| Grand Total | 31 | 2179 |
Appendix B
Table A2.
Top 55 nouns and proper nouns and counts in all disclosure reports.
Table A2.
Top 55 nouns and proper nouns and counts in all disclosure reports.
| Word | Count | |
| 0 | energy | 105,739 |
| 1 | gas | 91,349 |
| 2 | power | 44,252 |
| 3 | climate | 43,274 |
| 4 | weather | 41,135 |
| 5 | greenhouse | 40,045 |
| 6 | oil | 38,019 |
| 7 | carbon | 31,092 |
| 8 | demand | 29,841 |
| 9 | production | 27,434 |
| 10 | ability | 26,641 |
| 11 | air | 26,634 |
| 12 | legislation | 22,534 |
| 13 | development | 21,302 |
| 14 | emission | 20,759 |
| 15 | market | 20,617 |
| 16 | cost | 19,995 |
| 17 | addition | 19,994 |
| 18 | effect | 19,862 |
| 19 | equipment | 19,625 |
| 20 | water | 19,617 |
| 21 | regulation | 19,423 |
| 22 | fuel | 18,468 |
| 23 | impact | 18,142 |
| 24 | industry | 17,918 |
| 25 | act | 17,545 |
| 26 | generation | 17,193 |
| 27 | control | 17,112 |
| 28 | capital | 16,989 |
| 29 | ghg | 16,801 |
| 30 | tax | 16,161 |
| 31 | loss | 15,672 |
| 32 | compliance | 15,649 |
| 33 | electricity | 15,169 |
| 34 | reduction | 15,071 |
| 35 | insurance | 14,884 |
| 36 | management | 14,367 |
| 37 | government | 13,955 |
| 38 | price | 13,801 |
| 39 | agreement | 13,163 |
| 40 | condition | 13,091 |
| 41 | rule | 12,885 |
| 42 | risk | 12,824 |
| 43 | construction | 12,594 |
| 44 | availability | 12,415 |
| 45 | program | 12,039 |
| 46 | damage | 12,020 |
| 47 | cash | 11,892 |
| 48 | technology | 11,757 |
| 49 | performance | 11,706 |
| 50 | increase | 11,705 |
| 51 | dioxide | 11,517 |
| 52 | supply | 11,503 |
| 53 | property | 11,429 |
| 54 | transportation | 11,211 |
References
- Allen, C.; Metternicht, G.; Wiedmann, T. Initial progress in implementing the Sustainable Development Goals (SDGs): A review of evidence from countries. Sustain. Sci. 2018, 13, 1453–1467. [Google Scholar] [CrossRef]
- Rosati, F.; Faria, L.G. Addressing the SDGs in sustainability reports: The relationship with institutional factors. J. Clean. Prod. 2019, 215, 1312–1326. [Google Scholar] [CrossRef]
- Gómez-Bezares, F.; Przychodzen, W.; Przychodzen, J. Bridging the gap: How sustainable development can help companies create shareholder value and improve financial performance. Bus. Ethics A Eur. Rev. 2017, 26, 1–17. [Google Scholar] [CrossRef]
- Przychodzen, J.; Przychodzen, W. Corporate sustainability and shareholder wealth. J. Environ. Plan. Manag. 2013, 56, 474–493. [Google Scholar] [CrossRef]
- Sobhani, F.A.; Amran, A.; Zainuddin, Y. Revisiting the corporate social and environmental practices in Bangladesh. Corp. Soc. Res. Environ. Manag. 2009, 16, 167–183. [Google Scholar] [CrossRef]
- Herbohn, K.; Walker, J.; Loo, H.Y.M. Corporate social responsibility: The link between sustainability disclosure and sustainability performance. Abacus 2014, 50, 422–459. [Google Scholar] [CrossRef]
- Kaymak, T.; Bektas, E. Corporate social responsibility and governance: Information disclosure in multinational corporations. Corp. Soc. Responsib. Environ. Manag. 2017, 24, 555–569. [Google Scholar] [CrossRef]
- Clarkson, P.M.; Li, Y.; Richardson, G.D.; Vasvari, F.P. Revisiting the relation between environmental performance and environmental disclosure: An empirical analysis. Account. Organ. Soc. 2008, 33, 303–327. [Google Scholar] [CrossRef]
- Galbreath, J. ESG in focus: The Australian evidence. J. Bus. Ethics 2013, 118, 529–541. [Google Scholar] [CrossRef]
- Klettner, A.; Clarke, T.; Boersma, M. The governance of corporate sustainability: Empirical insights into the development, leadership and implementation of responsible business strategy. J. Bus. Ethics 2014, 122, 145–165. [Google Scholar] [CrossRef]
- Velte, P. Does ESG performance have an impact on financial performance? Evidence from Germany. J. Glob. Responsib. 2017, 80, 169–178. [Google Scholar] [CrossRef]
- Henri, J.; Journeault, M. Eco-control: The influence of management control systems on environmental and economic performance. Account. Organ. Soc. 2010, 35, 6380. [Google Scholar] [CrossRef]
- Szekely, F.; Knirsch, M. Responsible leadership and corporate social responsibility metrics for sustainable performance. Eur. Manag. J. 2005, 23, 628–647. [Google Scholar] [CrossRef]
- Van Marrewijk, M. Concepts and definitions of CSR and corporate sustainability: Between agency and communion. J. Bus. Ethics 2003, 44, 95–105. [Google Scholar] [CrossRef]
- Dyllick, T.; Hockerts, K. Beyond the business case for corporate sustainability. Bus. Strategy Environ. 2002, 11, 130–141. [Google Scholar] [CrossRef]
- Lo, S.F.; Sheu, H.J. Is Corporate Sustainability a Value-Increasing Strategy for Business? Corp. Gov. Int. Rev. 2007, 15, 345–358. [Google Scholar] [CrossRef]
- Raghupathi, V.; Raghupathi, W. Corporate Sustainability Reporting and Disclosure on the Web: An Exploratory Study. Inf. Resour. Manag. J. 2019, 32, 1–27. [Google Scholar] [CrossRef]
- Raghupathi, V.; Ren, J.; Raghupathi, W. Identifying Corporate Sustainability Issues by Analyzing Shareholder Resolutions: A Machine-Learning Text Analytics Approach. Sustainability 2020, 12, 4753. [Google Scholar] [CrossRef]
- Braam, G.; Peters, R. Corporate Sustainability Performance and Assurance on Sustainability Reports: Diffusion of Accounting Practices in the Realm of Sustainable Development. Corp. Soc. Responsib. Environ. Manag. 2018, 25, 164–181. [Google Scholar] [CrossRef]
- Sandberg, M.; Holmlund, M. Impression management tactics in sustainability reporting. Soc. Responsib. J. 2015, 11, 677–689. [Google Scholar] [CrossRef]
- De Silva Lokuwaduge, C.S.; Heenetigala, K. Integrating environmental, social and governance (ESG) disclosure for a sustainable development. Bus. Strategy Environ. 2017, 26, 438–450. [Google Scholar] [CrossRef]
- Elkington, J. Cannibals with Forks: The Triple Bottom Line of the 21st Century; New Society Publishers: Stoney Creek, CT, USA, 1998. [Google Scholar]
- Belz, F.; Binder, J. Sustainable Entrepreneurship: A Convergent Process Model. Bus. Strategy Environ. 2015, 26, 1–17. [Google Scholar] [CrossRef]
- Freundlieb, M.; Teuteberg, F. Corporate social responsibility reporting-a transnational analysis of online corporate social responsibility reports by market–listed companies: Contents and their evolution. Int. J. Innov. Sustain. Dev. 2013, 7, 1–26. [Google Scholar] [CrossRef]
- Kolk, A. A decade of sustainability reporting: Developments and significance. Int. J. Environ. Sustain. Dev. 2004, 3, 51–64. [Google Scholar] [CrossRef]
- Székely, N.; vom Brocke, J. What can we learn from corporate sustainability reporting? Deriving propositions for research and practice from over 9500 corporate sustainability reports published between 1999 and 2015 using topic modelling technique. PLoS ONE 2017, 12, e0174807. [Google Scholar] [CrossRef]
- Zhou, Y.; Wang, X.; Yuen, K.F. Sustainability disclosure for container shipping: A text-mining approach. Transp. Policy 2021, 110, 465–477. [Google Scholar] [CrossRef]
- Brammer, S.; Pavelin, S. Factors influencing the quality of corporate environmental disclosure. Bus. Strategy Environ. 2008, 17, 120–136. [Google Scholar] [CrossRef]
- Bjørn, A.; Bey, N.; Georg, S.; Røpke, I.; Hauschild, M.Z. Is Earth recognized as a finite system in corporate responsibility reporting? J. Clean. Production 2016, 163, 106–117. [Google Scholar] [CrossRef]
- Modapothala, J.R.; Issac, B. Evaluation of Corporate Environmental Reports Using Data Mining Approach; IEEE: New York, NY, USA, 2009; pp. 543–547. [Google Scholar]
- Modapothala, J.R.; Issac, B.; Jayamani, E. Appraising the corporate sustainability reports–text mining and multi-discriminatory analysis. In Innovations in Computing Sciences and Software Engineering; Springer: Berlin/Heidelberg, Germany, 2010; pp. 489–494. [Google Scholar]
- Shahi, A.M.; Issac, B.; Modapothala, J.R. Analysis of supervised text classification algorithms on corporate sustainability reports. In Proceedings of the 2011 International Conference on Computer Science and Network Technology, Harbin, China, 24–26 December 2011; IEEE: New York, NY, USA, 2011; Volume 1, pp. 96–100. [Google Scholar]
- Blei, D.M. Probabilistic topic models. Commun. ACM 2012, 55, 77–84. [Google Scholar] [CrossRef]
- Higgins, K.; White, J.; Beller, A.; Schapiro, M. The SEC and improving sustainability reporting. J. Appl. Corp. Financ. 2017, 29, 22–31. [Google Scholar] [CrossRef]
- Rodriguez, A.; Cotran, H.; Stewart, L.S. Evaluating the effectiveness of sustainability disclosure: Findings from a recent SASB study. J. Appl. Corp. Financ. 2017, 29, 100–108. [Google Scholar] [CrossRef]
- Carberry, E.J.; Bharati, P.; Levy, D.L.; Chaudhury, A. Social movements as catalysts for corporate social innovation: Environmental activism and the adoption of green information systems. Bus. Soc. 2019, 58, 1083–1127. [Google Scholar] [CrossRef]
- Tian, H.; Tian, J. The mediating role of responsible innovation in the relationship between stakeholder pressure and corporate sustainability performance in times of crisis: Evidence from selected regions in China. Int. J. Environ. Res. 71. Public Health 2021, 18, 7277. [Google Scholar] [CrossRef] [PubMed]
- Domenec, F. The “greening” of the annual letters published by Exxon, Chevron and BP between 2003 and 2009. J. Commun. Manag. 2012, 16, 296–311. [Google Scholar] [CrossRef]
- Galbreath, J. How does corporate social responsibility benefit firms? Evidence from Australia. Eur. Bus. Rev. 2010, 22, 411–431. [Google Scholar] [CrossRef]
- Cormier, D.; Magnan, M. The economic relevance of environmental disclosure and its impact on corporate legitimacy: An empirical investigation. Bus. Strategy Environ. 2015, 24, 431–450. [Google Scholar] [CrossRef]
- Aureli, S.; Del Baldo, M.; Lombardi, R.; Nappo, F. Nonfinancial reporting regulation and challenges in sustainability disclosure and corporate governance practices. Bus. Strategy Environ. 2020, 29, 2392–2403. [Google Scholar] [CrossRef]
- Helfaya, A.; Whittington, M. Does designing environmental sustainability disclosure quality measures make a difference? Bus. Strategy Environ. 2019, 28, 525–541. [Google Scholar] [CrossRef]
- Järvinen, J.T.; Laine, M.; Hyvönen, T.; Kantola, H. Just look at the numbers: A case study on quantification in corporate environmental disclosures. J. Bus. Ethics 2020, 1–22. [Google Scholar] [CrossRef]
- Berry, H.L.; Bowen, K.; Kjellstrom, T. Climate change and mental health: A causal pathways framework. Int. J. Public Health 2010, 55, 123–132. [Google Scholar] [CrossRef]
- Bosello, F.; Roson, R.; Tol, R.S. Economy-wide estimates of the implications of climate change: Human health. Ecol. Econ. 2006, 58, 579–591. [Google Scholar] [CrossRef]
- Hill, J.; Polasky, S.; Nelson, E.; Tilman, D.; Huo, H.; Ludwig, L.; Bonta, D. Climate change and health costs of air emissions from biofuels and gasoline. Proc. Natl. Acad. Sci. USA 2009, 106, 2077–2082. [Google Scholar] [CrossRef] [PubMed]
- Benn, S.; Edwards, M.; Williams, T. Organizational Change for Corporate Sustainability; Routledge: Abingdon, UK, 2014. [Google Scholar]
- World Commission on Environment and Development. Report of the World Commission on Environment and Development: Our common Future; United Nations: New York, NY, USA, 1987. [Google Scholar]
- Linnenluecke, M.K.; Griffiths, A. Corporate sustainability and organizational culture. J. World Bus. 2010, 45, 357–366. [Google Scholar] [CrossRef]
- Hahn, R.; Lülfs, R. Legitimizing negative aspects in GRI-oriented sustainability reporting: A qualitative analysis of corporate disclosure strategies. J. Bus. Ethics 2014, 123, 401–420. [Google Scholar] [CrossRef]
- Azapagic, A.; Perdan, S. Managing corporate social responsibility: Translating theory into business practice. Int. J. Corp. Sustain. 2003, 10, 97–108. [Google Scholar]
- Krug, B.A.; Burnett, S.E.; Dennis, J.H.; Lopez, R.G. Growers look at operating a sustainable greenhouse. GMPro 2008, 28, 43–45. [Google Scholar]
- Belu, C. Ranking corporations based on sustainable and socially responsible practices. A data envelopment analysis (DEA) approach. Sustain. Dev. 2009, 17, 257–268. [Google Scholar] [CrossRef]
- Hahn, T.; Scheermesser, M. Approaches to corporate sustainability among German companies. Corp. Soc. Responsib. Environ. Manag. 2006, 13, 150–165. [Google Scholar] [CrossRef]
- Wilkinson, A.; Hill, M.; Gollan, P. The sustainability debate. Int. J. Oper. Prod. Manag. 2001, 21, 1492–1502. [Google Scholar] [CrossRef]
- Ameer, R.; Othman, R. Sustainability practices and corporate financial performance: A study based on the top global corporations. J. Bus. Ethics 2012, 108, 61–79. [Google Scholar] [CrossRef]
- Adams, C.A.; McNicholas, P. Making a difference: Sustainability reporting, accountability and organizational change. Account. Audit. Account. J. 2007, 20, 382–402. [Google Scholar] [CrossRef]
- Gnanaweera, K.A.K.; Kunori, N. Corporate sustainability reporting: Linkage of corporate disclosure information and performance indicators. Cogent Bus. Manag. 2018, 5, 1423872. [Google Scholar] [CrossRef]
- Michelon, G. Sustainability disclosure and reputation: A comparative study. Corp. Reput. Rev. 2011, 14, 79–96. [Google Scholar] [CrossRef]
- Adams, C.A. Internal Organizational Factors Influencing Corporate Social and Ethical Reporting: Beyond Current Theorizing. Account. Audit. Account. J. 2002, 15, 223–250. [Google Scholar] [CrossRef]
- Bebbington, J.; Larrinaga-González, C.; Moneva, J.M. Corporate Social Responsibility and Reputation Risk Management. Account. Audit. Account. J. 2008, 21, 337–362. [Google Scholar] [CrossRef]
- Bae, S.M.; Masud, M.; Kaium, A.; Kim, J.D. A cross-country investigation of corporate governance and corporate sustainability disclosure: A signaling theory perspective. Sustainability 2018, 10, 2611. [Google Scholar] [CrossRef]
- Fernández-Gago, R.; Cabeza-García, L.; Nieto, M. Independent directors’ background and CSR disclosure. Corp. Soc. Responsib. Environ. Manag. 2018, 25, 991–1001. [Google Scholar] [CrossRef]
- Masud, M.; Kaium, A.; Hossain, M.S.; Kim, J.D. Is green regulation effective or a failure: Comparative analysis between Bangladesh Bank (BB) green guidelines and global reporting initiative guidelines. Sustainability 2018, 10, 1267. [Google Scholar] [CrossRef]
- Papoutsi, A.; Sodhi, M.S. Does disclosure in sustainability reports indicate actual sustainability performance? J. Clean. Prod. 2020, 260, 121049. [Google Scholar] [CrossRef]
- Perrault, E.; Clark, C. Environmental shareholder activism: Considering status and reputation in firm responsiveness. Organ. Environ. 2016, 29, 194–211. [Google Scholar] [CrossRef]
- Ali, W.; Frynas, J.G.; Mahmood, Z. Determinants of corporate social responsibility (CSR) disclosure in developed and developing countries: A literature review. Corp. Soc. Responsib. Environ. Manag. 2017, 24, 273–294. [Google Scholar] [CrossRef]
- Raucci, D.; Tarquinio, L. A study of the economic and non-financial performance indicators in corporate sustainability reports. J. Sustain. Dev. 2015, 8, 216–230. [Google Scholar] [CrossRef]
- Roca, L.C.; Searcy, C. An analysis of indicators disclosed in corporate sustainability reports. J. Clean. Prod. 2012, 20, 103–118. [Google Scholar] [CrossRef]
- Patten, D.M.; Zhao, N. Standalone CSR reporting by US retail companies. In Accounting Forum; Taylor and Francis Ltd.: Oxford, UK, 2014; Volume 38, pp. 132–144. [Google Scholar]
- Tate, W.L.; Ellram, L.M.; Kirchoff, J.F. Corporate social responsibility reports: A thematic analysis related to supply chain management. J. Supply Chain Manag. 2010, 46, 19–44. [Google Scholar] [CrossRef]
- Montabon, F.; Sroufe, R.; Narasimhan, R. An examination of corporate reporting, environmental management practices and firm performance. J. Oper. Manag. 2007, 25, 998–1014. [Google Scholar] [CrossRef]
- Azhar, N.A.; Pan, G.; Seow, P.S.; Koh, A.; Tay, W.Y. Text analytics approach to examining corporate social responsibility. Asian J. Account. Gov. 2019, 11, 85–96. [Google Scholar]
- Nilashi, M.; Rupani, P.F.; Rupani, M.M.; Kamyab, H.; Shao, W.; Ahmadi, H.; Rashid, T.A.; Aljojo, N. Measuring sustainability through ecological sustainability and human sustainability: A machine learning approach. J. Clean. Prod. 2019, 240, 118162. [Google Scholar] [CrossRef]
- Aggarwal, C.C.; Zhai, C. A survey of text classification algorithms. In Mining Text Data; Springer: Boston, MA, USA, 2012; pp. 163–222. [Google Scholar]
- Kim, D.; Kim, S. Sustainable supply chain based on news articles and sustainability reports: Text mining with Leximancer and DICTION. Sustainability 2017, 9, 1008. [Google Scholar] [CrossRef]
- Deng, Q.; Ji, S.; Wang, Y. Green IT practice disclosure: An examination of corporate sustainability reporting in IT sector. J. Inf. Commun. Ethics Soc. 2017, 15, 145–164. [Google Scholar] [CrossRef]
- Harymawan, I.; Nasih, M.; Salsabilla, A.; Putra, F.K.G. External assurance on sustainability report disclosure and firm value: Evidence from Indonesia and Malaysia. Entrep. Sustain. Issues 2020, 7, 1500–1512. [Google Scholar] [CrossRef]
- Wang, X.; Yuen, K.F.; Wong, Y.D.; Li, K.X. How can the maritime industry meet Sustainable Development Goals? An analysis of sustainability reports from the social entrepreneurship perspective. Transp. Res. Part D Transp. Environ. 2020, 78, 102173. [Google Scholar] [CrossRef]
- Shelley, M.; Krippendorff, K. Content analysis: An introduction to its methodology. J. Am. Stat. Assoc. 1984, 79, 240. [Google Scholar] [CrossRef]
- Raghupathi, V.; Ren, J.; Raghupathi, W. Studying public perception about vaccination: A sentiment analysis of tweets. Int. J. Environ. Res. Public Health 2020, 17, 3464. [Google Scholar] [CrossRef] [PubMed]
- Raghupathi, V.; Zhou, Y.; Raghupathi, W. Legal decision support: Exploring big data analytics approach to modeling pharma patent validity cases. IEEE Access 2018, 6, 41518–41528. [Google Scholar] [CrossRef]
- Dietterich, T.G. Machine learning in ecosystem informatics and sustainability. In Proceedings of the Twenty-First International Joint Conference on Artificial Intelligence, Pasadena, CA, USA, 11–17 July 2009. [Google Scholar]
- Parris, T.M. Corporate sustainability reporting. Environment 2006, 48, 3. [Google Scholar] [CrossRef]
- Smith, J.A., III. The CERES principles: A voluntary code for corporate environmental responsibility. Yale J. Int’l L. 1993, 18, 307. [Google Scholar]
- Chuang, J.; Manning, C.D.; Heer, J. Termite: Visualization techniques for assessing textual topic models. In Proceedings of the International Working Conference on Advanced Visual Interfaces, Capri, Italy, 21–25 May 2012; pp. 74–77. [Google Scholar]
- Sievert, C.; Shirley, K. LDAvis: A method for visualizing and interpreting topics. In Proceedings of the Workshop on Interactive Language Learning, Visualization, and Interfaces, Baltimore, MD, USA, 27 June 2014; pp. 63–70. [Google Scholar]
- De Lucia, C.; Pazienza, P.; Bartlett, M. Does good ESG lead to better financial performances by firms? Machine learning and logistic regression models of public enterprises in Europe. Sustainability 2020, 12, 5317. [Google Scholar] [CrossRef]
- Sardana, D.; Gupta, N.; Kumar, V.; Terziovski, M. CSR ‘sustainability’ practices and firm performance in an emerging economy. J. Clean. Prod. 2020, 258, 120766. [Google Scholar] [CrossRef]
- Armstrong, A. Ethics and ESG. Australas. Account. Bus. Financ. J. 2020, 14, 6–17. [Google Scholar] [CrossRef]
- Chouaibi, S.; Affes, H. The effect of social and ethical practices on environmental disclosure: Evidence from an international ESG data. Corp. Gov. Int. J. Bus. Soc. 2021, 21, 1293–1317. [Google Scholar] [CrossRef]
- Chouaibi, S.; Rossi, M.; Siggia, D.; Chouaibi, J. Exploring the moderating role of social and ethical practices in the relationship between environmental disclosure and financial performance: Evidence from ESG companies. Sustainability 2022, 14, 209. [Google Scholar] [CrossRef]
- Novoselov, A.; Potravny, I.; Novoselova, I.; Gassiy, V. Social investing modeling for sustainable development of the Russian Arctic. Sustainability 2022, 14, 933. [Google Scholar] [CrossRef]
- Novoselov, A.; Potravny, I.; Novoselova, I.; Gassiy, V.; Sharkova, A. Harmonization of interests during Arctic industrial development: The case of mining corporation and indigenous peoples in Russia. Polar Sci. 2022, 100915. [Google Scholar] [CrossRef]
Disclaimer/Publisher’s Note: The statements, opinions and data contained in all publications are solely those of the individual author(s) and contributor(s) and not of MDPI and/or the editor(s). MDPI and/or the editor(s) disclaim responsibility for any injury to people or property resulting from any ideas, methods, instructions or products referred to in the content. |
© 2023 by the authors. Licensee MDPI, Basel, Switzerland. This article is an open access article distributed under the terms and conditions of the Creative Commons Attribution (CC BY) license (https://creativecommons.org/licenses/by/4.0/).