Abstract
Low carbon sustainability has been addressed in China’s sustainable urbanism strategies as a response the impact of climate change. This study empirically examines the relationship between household factors and carbon emissions in the context of community regeneration through the use of correlational and regression analysis. The participants were drawn from the Dadong community in Guangzhou, China, who has been participating in low-carbon community regeneration. In total, 102 valid questionnaires were obtained from homeowners and the data were analyzed with SPSS and STATA software with an OLS estimate method, checking for BLUE to identify and decide upon the degree of correlation among the variables. The results reveal that family carbon emissions were primarily impacted by house area and income. This study found that larger houses tended to have higher carbon emissions, emphasizing the importance of using low-carbon materials and facilities in community regeneration. Additionally, households with higher incomes tended to have more household appliances, which can contribute to higher carbon emissions and potentially lead to conflicts between different actors involved in low-carbon community regeneration. To reduce household carbon emissions, low-carbon community regeneration develops through interactions and transformations among different actors. However, there has been a lack of research examining the mechanisms underlying the process of low-carbon community regeneration involving the various stakeholders. Using the reference of the actor–network theory (ANT), this research innovatively reveals the mechanisms related to key actors (community government) and multivocal obligatory passage points (OPP) with a synchronous process (problematization, interessement, enrollment, mobilization) through interactions and transformations made by different actors. Finally, the study highlights the need for further research on the low-carbon community or urban regeneration with innovative technological and self-regulation strategies.
1. Introduction
Controlling carbon emissions is an increasingly serious challenge for China [1,2]. In response to the challenges, low carbon sustainability has been addressed in China’s sustainable urbanism strategies which can be seen in two major national policies [3,4]. First is the “Twelfth Five-Year Plan” released in March 2011, which was the country’s first official policy. Second is China’s second national policy plan created in 2007 and was the country’s first attempt to address climate change. The policy aimed to confront China’s energy and climate concerns. The “National Climate Change Program”, as this policy plan was known, took two years to create and involved 17 government ministries. After the policy making, the annual growth rate of CO2 emissions has slowed down in recent years with the improvement of technological levels and the enhancement of residents’ awareness of energy conservation [5,6]. Nevertheless, with GDP growth, overall carbon emissions have continued to increase [6]. As China proposed a carbon emission “cap” by 2030 in the Kyoto Agreement, the pressure on carbon emission reduction is still massive [7]. To better achieve the carbon emission goal, taking action on low-carbon communities is important because the community is the basic element of a city [8].
Researchers have reached a consensus that low-carbon community regeneration consists of three dimensions: urban design, policy, and individual behavioral changes. Thereafter, the technological, political, and social aspects have been the focus in the existing literature [9,10,11,12,13,14]. However, there has been a lack of research examining the mechanisms underlying the process of low-carbon community regeneration involving various stakeholders that play a more integral role in the regeneration process. In this sense, it is necessary to explore the process involving different actors and the acts of negotiation, persuasion, and action performed by the network. This study aims to fill this gap by exploring the following questions: (1) What are the empirical relationships between carbon emissions and other household factors? (2) How does low-carbon community regeneration unfold through transformation by the various stakeholders? Following Garud et al. (2017), the ANT provides a theory to address this research question [15] in the Dadong case, which is seldom used in the urban regeneration field. The benefits of using ANT is that it presents findings on four distinct points in the low carbon precincts for the community regeneration process where the translation took place.
This paper is organized into six sections. A literature review is presented in the next section, followed by the methodology of the study in Section 3. The results of the study are presented in Section 4, while the application of ANT in the Dadong Community is discussed in Section 5. Finally, the paper concludes in Section 6.
2. Literature Review
A community is a group of interconnected individuals who share a common environment, values, or resources. A low-carbon community, based on the definition of community, refers to the community’s ability to ensure economic development without sacrificing residents’ comfort [16]. To meet the goals of energy conservation, emission reduction, and community carbon reduction, advanced technologies are employed to construct low-carbon and energy-efficient buildings, implement green transportation, utilize renewable energy sources such as solar and geothermal energy, conserve water, and promote a low-carbon culture among residents [17]. However, low-carbon community regeneration is not only related to new technologies used in spaces but also includes other non-material dimensions [18], such as individual behavioral changes or policy making [19,20]. Nevertheless, the evidence has shown that the lack of progress in low-carbon regeneration is due to simply focusing on the material or non-material dimensions, while the mechanism behind all the dimensions plays a more integral role in the regeneration process [21,22,23,24]. In this sense, it is necessary to explore the process involving different actors and the acts of negotiation, persuasion, and action performed by the network. Indeed, urban or community regeneration does not just consider finishing the project, instead, it requires processes of multiple translations [25]. From this perspective, ANT is presented as one of the approaches that are based on these process views that can be used for analyzing low-carbon community regeneration.
ANT was developed by sociologists Weber and Kalinowski and Bruno Latour in the mid-1980s. It is a theoretical approach grounded in the ontology of relational practices, which originated in science and technology studies in the early 1980s, but has since been applied to various fields in the social sciences [26]. ANT offers a framework for understanding how social impacts are interconnected among various individuals in a network. The key concepts of ANT include networks, conflicts, and translation. Thus, partnerships can include not only public, corporate, third-sector, and community actors, but also human and non-human elements [27]. This material relationism encompasses all human and non-human actors, as well as a variety of diverse materials that make up ‘the social,’ such as technologies, activities, structures, symbols, and places, and accords them with equal citizenship [28]. The mobilization of these actors is an ongoing process called translation which revolves around a common objective, called an obligatory passage point (OPP), establishing the link between the network of actors [29].
In sum, the previous studies reveal how different dimensions (i.e., policy, urban design, innovative technology, etc.) are provided for low-carbon community regeneration. However, there are no studies that focus on the mechanism behind low-carbon community regeneration process involving different actors [30]. Therefore, this paper seeks to provide an additional study on the mechanism of low-carbon community regeneration using ANT to address this research question in the Dadong case, which is the first attempt to completely apply ANT tools to the analysis of the urban or community regeneration in a low-carbon context.
3. Methodology
This section presents the empirical methodology for assessing household carbon emissions based on a questionnaire survey, as outlined in Section 3.1 below. The analyses of the findings are provided in Section 3.2. An ANT theoretical framework is used to analyze the mechanisms of low-carbon regeneration in Section 3.3 and the Dadong community was selected as the case study in Section 3.
3.1. Survey
Survey statistics are the results of systematic data gathering for a sample taken from a larger population [31]. As a questionnaire is an effective way to collect data [32], a survey was used to collect household data, estimating the carbon emissions from every family. The survey was focused on the residents who were over 18 years old and the homeowner in the community.
- Pre-testing
Prior to distribution, the questionnaire was subjected to a pilot test to identify any defects and potential sources of confusion, such as ambiguous questions that might yield incorrect responses. During the first round of pretesting, 15 questionnaires were distributed to friends and other contacts as part of the pilot test to ensure its feasibility and alignment with the overall study objectives. The focus of the first round of pretesting was on the content of the questionnaire, with the aim of identifying elements that might negatively impact the research, such as poorly worded questions that might confuse respondents. The second round of pre-testing focused on the instructions to help assess the accuracy of the instructions in advance, to see if participants could understand them. Some of the questions were changed in response to their suggestions and input.
- Pilot testing
Feedback on surveys in two rounds of pre-testing was used to assist in creating the final form.
- Pre-analysis
Frequency tables for the responses to each question were created to provide a quick idea of the outcomes. This trial analysis was to ensure that the survey would achieve its objectives and produce information that would be conducive to the overall study.
- Online survey
The survey data were collected in accordance with strict ethical standards. Confidentiality was ensured and clearly communicated to the respondents, along with the objectives of the study. There were 43 questions in the questionnaire, including 11 questions about the basic situation of the respondents, 4 questions about their understanding of low carbon, 5 questions about family energy consumption, and 23 questions about their daily living habits. The survey was conducted online via WeChat for a month due to the COVID-19 epidemic from May 2022 to June 2022.
Additionally, according to differing factors (i.e., confidence level, population size, and margin of error) [33], the sample size of 120 participants (since there are 89,000 people living in the Dadong community, at least 96 surveys are required to establish a 95% confidence level that the real value is within 10% of the surveyed value) was adequate for an exploratory survey [34,35,36]. The sample size was 120 in total, and 102 valid questionnaires—an 85% recovery rate—were used.
3.2. Analysis of Findings
Correlational analysis and multiple regression techniques were employed for the quantitative data collected. The correlation between the strength and direction (positive or negative) of a link between two variables was tested using Sparkman’s Rank. Based on the survey data of Dadong in Guangzhou, this paper first tests household carbon emissions with different household factors. After that, a multiple regression analysis was performed using the significant factors. The multiple linear regression method was used to establish the model. For the analysis, the Pearson correlation analysis was used to estimate the correlation between each pair of variables.Then, Best, Linear, and unbiased Estimator (BLUE) were performed on the quantitative data collected by SPSS and STATA software. In order to further illustrate the reliability of parameter estimation, the Bootstrap method was used for repeated sampling prediction estimation. The Durbin-Watson test was carried out.Finally, adjusted R2 was used to comment on the goodness of fit of the final regression model used in this study.
3.3. Theoretical Framework
In this section, the process views of low-carbon precincts for community regeneration are explained. The ANT describes carbon community regeneration as a network with usual links between actors including human and non-human actors. In addition, the network is formed by “translation”, but the meaning of translation is different from the linguistic explanation. The translation in ANT refers to changing something over time, from one space to another space. In this sense, durational actions influence the process of translation.
Based on the meaning of translation, it can be divided into four key moments: (1) problematization, (2) interessement, (3) enrollment, and (4) mobilization. The dissidence illustrated in the ANT is transversal to the four moments because controversies can appear at any moment [37] (Figure 1).
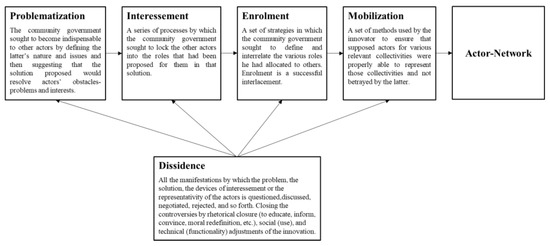
Figure 1.
Theoretical framework [26,27,37].
3.4. Case Selection
A single case study method requires a unique case with a particular or instrumental value with special characteristics either at a specific time or space [38]. The research uses the Dadong community in Guangzhou (Figure 2) as an example and its unique characteristics are as follows: (1) this case is based on the ongoing project ”Building a low-carbon community based on the old community in Guangzhou, China” and will likely become the first successful project in Guangzhou. (2) The residents have been previously educated with new knowledge about energy consumption and carbon emissions by community planners before the process of regeneration. (3) Guangzhou is the priority city that promotes urban regeneration projects in China since the 2000s and Dadong is the first attempt to integrate low-carbon sustainability.

Figure 2.
Location of Dadong community (drawn by the authors).
4. Carbon Emission Analysis Results
4.1. Carbon Emission Estimation
Currently, carbon emission accounting mainly includes the input–output (I-O) Experimental Method Approach (EA) and Emission Factor (EF). EF is widely used in the carbon emission accounting of community residents. Kennedy et al. implemented the emission factor method into the urban metabolic model. Additionally, Shen et al. used the emission factor method to calculate the carbon emissions of residential energy [35], which can be used to calculate the indirect household carbon footprint (including food, accommodations, entertainment, education, and other seven emission sources). According to EF, the annual carbon emissions of urban families are calculated by using the water, electricity, natural gas, and car fuel bills of the families from the questionnaire. CO2 emissions were calculated using the following equation:
where C is the CO2 emissions (kg), Etc is the energy use (i.e., family energy bill/total city energy charge), and f and is the emission factor of energy (kgCO2e/kWh).
Ctc = Etc × f
From the formula and the data collected in the questionnaire, the average carbon emissions would be 810 kg/year for each family. According to the community government, there are 26,863 families in the community. Therefore, the total carbon emissions produced is 22 billion kg/year (Table 1).

Table 1.
The carbon Emission Factor of energy consumption and unit price in Guangzhou, China.
4.2. Respondents’ Characteristics
The questionnaire divided the ages of the head of the family into six categories: (1) under 18 years; (2) 19–25 years; (3) 26–35 years; (4) 36–45 years; (5) 46–60 years; and (6) over 60 years. Approximately one-third (32.23%) of families had heads who are older than 60. Families with heads between the ages of 46 and 60 made up 29% of all households. Of all the families, 14.95% and 22.91% were headed by 26–35- and 36–45-year-olds, respectively. According to the data, there was no correlation between age and carbon emissions (Figure 3). However, it is a fact that individuals tend to be more frugal and have lower living expenses in retirement, which may result in a reduction of carbon emissions for the household.
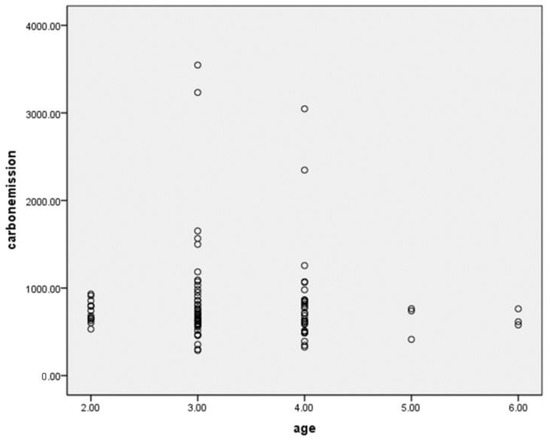
Figure 3.
Scatter diagram between age and carbon emissions.
Second, the profession of the head of the family was divided into nine categories: (a) government worker, (b) company worker, (c) teacher, (d) individual business, (e) retired person, and (f) others. The highest family carbon emissions were from individuals who owned businesses, accounting for 31%. The next highest family carbon emissions were from company employees and teachers, comprising 22% and 23%, respectively. The main reason for the high carbon emissions from families of individual businesses and government employees was the relatively high utilization rate of private cars. Retirees seldom went out, and most choose public transportation such as buses when they need to go out. The retirees also turned on air conditioning and watched TV less, and saved electricity and water, so their family’s carbon emissions were low. The total carbon emissions had little correlation with increasing family size.
Third, we investigated education level and gender. There were 47% female and 53% male homeowners. Most of the owners had at least a junior college level education accounting for 40%, followed by bachelor’s degrees, accounting for 35%. Regarding household carbon emissions, it was found that there was no significant relationship between family education level and gender. The reason is that although family educational attainment can affect people’s awareness of energy conservation, people with higher levels of education mostly have higher incomes, and income has a greater impact on household carbon emissions. Gender also had little effect on household carbon emissions. It seems that women’s cultural background was similar to men’s, and their behaviors are alike when it comes to carbon emissions.
4.3. Factors Analysis
4.3.1. Annual Family Income
Family income has a greater impact on family carbon emissions, and the number and frequency of family appliances used by residents with a high family income will inevitably increase compared with those with a low income. On the other hand, residents with higher incomes may be more inclined to buy cars. Unsealed cars have become more common in recent years, and the increase in car use is also contributing to family carbon emissions.
The annual income level of urban families ranged between from CNY 300,000–400,000 (USD 46,000–61,000), accounting for 48% of the total, close to 50%. The difference between the number of families with a lower income and those with a higher income was relatively small, basically demonstrating a normal distribution trend and indicating that this questionnaire was reasonable in dividing the income level of Guangzhou. In addition, it can be seen that the annual income level of most urban families in Guangzhou is about CNY 400,000 (Figure 4).
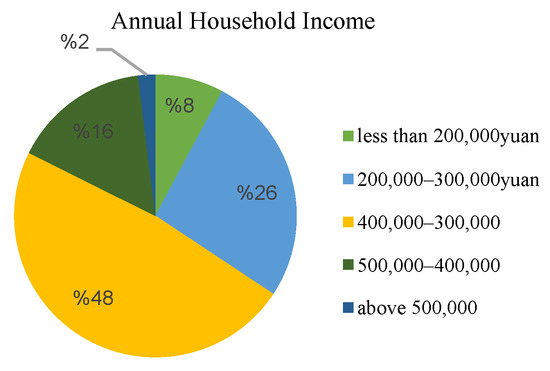
Figure 4.
Annual family income as percentage of Dadong community.
The Spearman’s rank correlation coefficient was 0.852 meaning that urban family income was the main determinant of urban family carbon emissions. The scatter diagram between annual family income and carbon emissions shows that carbon emissions grow when household income increases (Figure 5). The analysis concluded that progressive income redistribution could increase household carbon dioxide emissions.
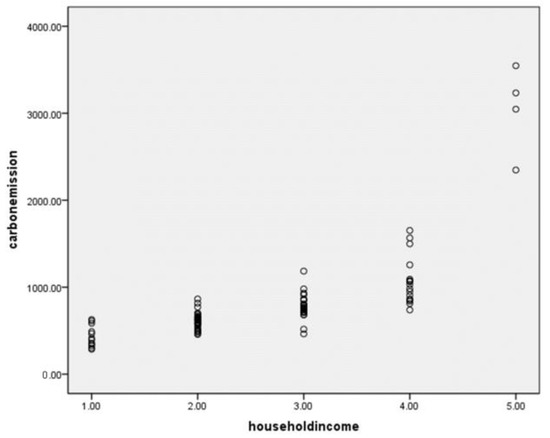
Figure 5.
Scatter diagram between annual family income and carbon emissions. For household income, “1” refers to less than CNY 200,000, “2” refers to CNY 200,000–300,000, “3” refers to CNY 300,000–400,000, “4” refers to CNY 400,000–500,000, and “5” refers to above CNY 500,000.
4.3.2. Family Size
The size of the family had a great influence on urban family carbon emissions. The average family size was 3.79 people and families with three and four members were the most common, accounting for 57% and 27% of the total sample size. The proportion of families with these two types of populations was relatively close, accounting for more than half of the total, which was the main type of family size. There were families with two members, accounting for 10% of the total number of families surveyed. There were families with five members, accounting for 6% of the total sample (Figure 6).

Figure 6.
Family size as percentage of the Dadong community.
The Spearman’s rank correlation coefficient was 0.2, showing that the total carbon emissions had little relationship with family size. Therefore, families should be encouraged to live among multiple-member families to avoid the high carbon emissions associated with single living (Figure 7).
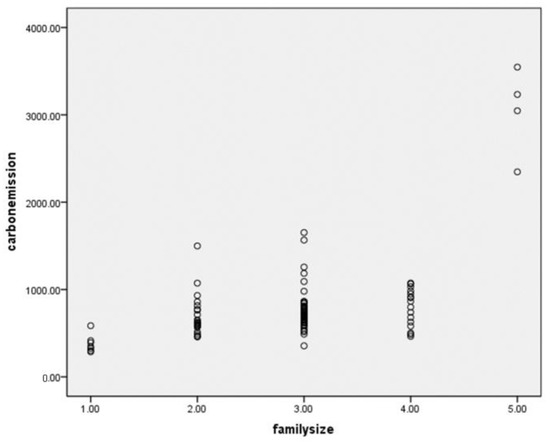
Figure 7.
Scatter diagram between family size and carbon emissions. For family size, “1” refers to one person, “2” refers to two people, “3” refers to three people, “4” refers to four people, and “5” refers to five people.
4.3.3. Housing Area
As shown in Figure 8, only 9.8 percent of the respondents’ houses were smaller than 80 square meters. Housing areas between 121 and 140 m2 were the most common, accounting for 46%. There were 22% and 21% with housing areas between 141 and 160 m2 and 81 and 120 m2 (Figure 9). From the data, we see that the housing area of urban families was mainly 81–140 square meters, accounting for more than 90% of the total, which is the type chosen by most families. The Spearman’s rank correlation coefficient was 0.668, showing that there is a relationship between housing area and carbon emissions (Figure 8). It has been determined that large houses emit more carbon dioxide. Due to its lack of energy efficiency, the larger the size of the house, the more energy is required to maintain a comfortable temperature. To conserve heat, old houses must be relatively airtight. Additionally, a ventilation system that brings in fresh air is necessary.
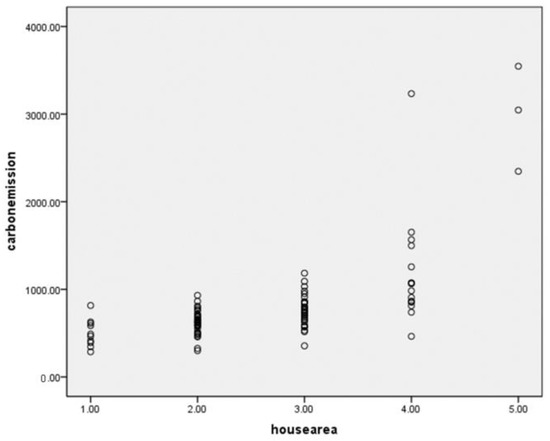
Figure 8.
Scatter diagram between house area and carbon emission. For house area, “1” refers to under 80 m2, “2” refers to 80–120 m2, “3” refers to 121–140 m2, “4” refers to 141–160 m2, and “5” refers to above 160 m2.
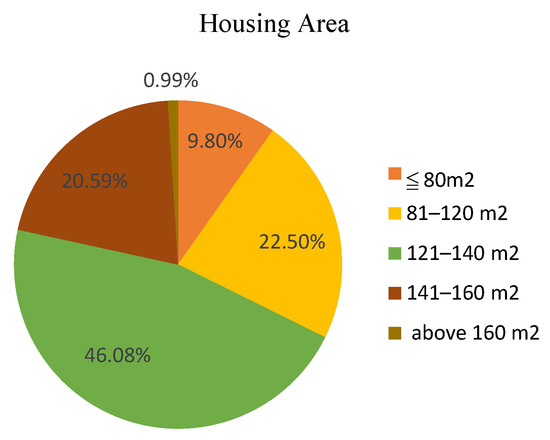
Figure 9.
Housing area as percentage of Dadong community.
4.3.4. Travel Means
The ownership of private cars was positively correlated with carbon emissions, as the more private cars the home owned, the more the household’s travel carbon emissions. A total of 86% of people owned private cars for the convenience of travel.
4.3.5. Awareness of Low-Carbon Community
The residents have been educated about low-carbon concepts before the ongoing low-carbon community regeneration. However, one major limitation to low-carbon community regeneration is that less people have an awareness of low-carbon communities. As was borne out in the results, only 62.7% of the respondents had heard of low-carbon communities, the concept and practice, as well as the future development. Most people learned about the concept of a low-carbon community through the Internet, accounting for 23%, followed by advertisements and government documents, accounting for 15% and 18%, respectively (Table 2). Additionally, another problem is that 65% of the respondents did not know about environmental labels for sustainable products, which means they need to be educated more to encourage environmentally friendly products in the market. In addition, only 58% of respondents buy products with an environmental label.
Table 2.
Survey for assessing the awareness of climate change in Dadong.
4.3.6. Energy Saving Behavior
Although nearly 80% of respondents make use of air conditioners in the summer and 45% use air conditioners in the winter, which is considered a waste of energy, they generally performed well in terms of energy conservation. For instance, 65% of respondents use household water more than once a day. Half of the respondents have installed water-saving appliances, and 65% of them make sure to turn the faucet on to medium volume and turn it off promptly to conserve water. When it comes to energy conservation, 82% of people make a habit of turning off the light when leaving a room, and 71% have used energy-efficient lighting. Additionally, 72% of respondents separate their garbage. However, 80% of them continue to use throwaway tableware.
4.4. Multivariate Linear Correlation Analysis for Multivariate Data
Based on the above data analysis, the multiple linear regression method was used to establish a model. If the test meets the requirements, it can be considered that the model can simulate the relationship between various factors and the comprehensive index of household carbon emissions. After analyzing variables like family size, family income, housing area, and travel means, the most significant factors associated with carbon emission are family Income and housing area. The basic principle the model calculations is Y = K + a𝑋1 + 𝑏𝑋2 (a, b, and K are constants), where 𝑋1 is family income and 𝑋2 is family residential area.
First, the Pearson correlation analysis was used to estimate the correlation between each pair of variables. The correlation matrix showed the direct correlation coefficient between the independent and the dependent variable is positive, and the significance of the correlation significance level was over 1%, indicating that they are positively correlated (Table 3). Then, the model passed the error test according to the value and significance level (Table 4). Based on the Gauss–Markov theorem, the OLS estimate of the parameters was equal to the BLUE (Best, Linear, Unbiased Estimator) in the classical assumption of the linear model, which can identify and finally decide on the degree of co-relation among the variables. The OLS regression model is summarized in Table 5. In order to further illustrate the reliability of the parameter estimation, the Bootstrap method was used for repeated sampling prediction estimation. The Durbin–Watson test was carried out and the value was 1.862, indicating the effect of the coefficient estimation was good. Finally, adjusted R2 was used to comment on the goodness of fit of the final regression model used in this study (Table 6).
Table 3.
Correlation matrix.
Table 4.
Levene’s test of equality of error variances. Dependent viable: carbon emissions.
Table 5.
OLS regression results.
Table 6.
Model summary.
- Test the null hypothesis that the error variances of the dependent variables are equal across groups.
- Design: Intercept + household income + house area.
- Predictors: household income, house area.
Taken together, the significant result demonstrates the following conclusions:
- (1)
- Carbon emissions are related to the housing area and family income in a positive way.
- (2)
- Larger households will produce more carbon emissions so low-carbon facilities or materials (e.g., energy-saving bulbs or water-saving pipes) are important.
- (3)
- Households with a higher income tend to possess a greater number of appliances and often utilize their own vehicles for transportation. This behavior, which is indicative of a focus on the quality of the living environment rather than cost, can sometimes lead to controversies within low-carbon communities that are working towards regeneration.
5. ANT Building Discussions in Low Carbon Community Regeneration Implementation in Dadong Community
5.1. Composition of Actors
Based on the principle of generalized symmetry, actor–network theory places human actors and non-human actors in an equal position, including them together in the actor network. The main actors of low-carbon community transformation include the community government, residents, private sectors (water Investment Management Co., Ltd., Guangzhou, China power Engineering Co., Ltd., Guangzhou, China), financial institutions, and other humanitarian actors, as well as non-human actors such as housing, land, and local culture.
5.2. The Translation Process
5.2.1. Problematization
Before translation, identifying the OPP which enables actors to solve the problem around a common objective is paramount. The community government hope to improve the living environment and gain the title of the first low-carbon community regeneration in Guangzhou which was required by the authorities. The community planners have organized workshops in an effort to gain the support and cooperation of local residents in implementing their plans for low-carbon community regeneration. In these workshops, the residents were presented a summary of the issues facing the community that they hope to address, including traffic problems, insufficient parking, inadequate public facilities, a lack of green space, and buildings with poor ecological performance. These issues, which are both human and non-human in nature, are seen as key priorities for improvement. Moreover, they hope everyone’s low-carbon lifestyle can become a good habit to adhere to long term, such as using a bicycle for short-distance travel, using environmental bags to buy food, etc.
Companies such as Water Investment Management Co., Ltd., Guangzhou, China and Power Engineering Co., Ltd., Guangzhou, China hope to exploit the market of low-carbon communities and gain benefits through government–enterprise cooperation. The bank expects to participate in the low-carbon community regeneration with the aim of reducing financial risks and increasing the availability of financial resources. The community government is a key actor, putting forth the issue of low-carbon community regeneration projects as common OPP, so as to objectify the issues concerned by heterogeneous actors.
5.2.2. Interessment
Interessment aids in engaging key actors and translates their interests into visions, objectives, plans, and roles, making other actors locked into the low-carbon community regeneration process. Throughout the regeneration process, some controversies arose. Residents maintained a custom of putting their bikes in the streets, leaving less room for sporting activities and the residents did not want to set up a garbage sorting facility in the community, resulting in the inconvenience of waste classification. To address the controversies, the community government engaged the planner to make adjustments like building fitness facilities for the residents but asked the residents to support setting up a garbage sorting facility in return. The community government found financial support from the bank to implement the regeneration projects and rented vacant buildings to them at a very low price in return, by which the community government could earn loans. The low-carbon community regeneration required new technology support. The community government contacted the Water Investment Management Co., Ltd., Guangzhou, China and Power Engineering Co., Ltd., Guangzhou, China. They helped to construct low-carbon facilities to save water, including changing the water pipes, building a PV facility, and installing more energy-saving light bulbs for the elderly. In return for their involvement, the community government must agree to temporarily share profits. By locking the actors into the process, the community government has to construct OPP, which closes controversies.
5.2.3. Enrollment
The enrollment process begins during the period of interest, when the regeneration assignment becomes the “OPP” and ends at the moment of mobilization. The community government implicitly performed an enrollment of their allies [30]. Moreover, the roles within the network are interconnected, resulting in a stable structure. For instance, obtaining government funding can be challenging. However, once a cooperative relationship has been established between the government and companies, the process of applying for funding becomes easier for the companies. All these roles implicitly played by the actors provide the community government a kind of “license to operate” (e.g., as it is the successful first low-carbon community project, the company have priority in joining another community regeneration project in Guangzhou).
5.2.4. Mobilization
All these actors serve as representatives of the network spokesman driving the transformation. Their mobilization effectively resolves the issue of low-carbon community regeneration, as the community government, a key actor, holds administrative power. Moreover, once the low-carbon community regeneration in Dadong is finalized, the mobilization allows the extension of the network to other types of representative spokesmen: “actor-influencers”. Indeed, all these actors try their best to promote the low-carbon community regeneration project. As an example, banks may promote the availability of low-carbon vacant spaces in the market in an effort to attract additional investment from businesses, in order to offset the financial support they have provided. Meanwhile, residents may take initiative in maintaining a clean and orderly appearance, including sorting their garbage, as they seek to preserve the reputation of the community as the first successful low-carbon community regeneration. Water Investment Management Co., Ltd., Guangzhou, China, and Power Engineering Co., Ltd., Guangzhou, China may work to improve the low-carbon facilities in the space.
5.3. Actor Network Construction
In the Dadong community, key community government actors, relying on administrative and market forces, from top to bottom, and from people, companies, banks, and other actors like houses, land, and culture. To enlist, mobilize, and eliminate dissent among the various heterogeneous actors, these actors must be embedded within the network and interact with each other, forming a relatively stable and complex network of connections.
6. Conclusions
To ensure that the low-carbon community regeneration is conducted in a sustainable urban regeneration setting, it is important to identify household factors that closely reduce community carbon emissions. A questionnaire survey was conducted with residents in the Dadong community in Guangzhou to estimate carbon emissions and gather data on potential factors that may have affected household carbon emissions. Although the findings may not be applicable to all low-carbon community regeneration projects in the world, this study can serve as a valuable point of reference to inform and guide future efforts. Regression analysis was used to infer causal relationships between different variables and carbon emissions, which is evidence that can be used in low-carbon community regeneration policy making. The results reveal that family carbon emissions are mainly impacted by the area of housing and household income. More precisely, a larger house produces more carbon emissions so low-carbon facilities or materials are important and households with a high income have more household appliances, causing some controversies between different actors which need to be solved in the low-carbon community regeneration.
After analyzing the factors that influenced carbon emissions, the mechanisms underlying the process of low-carbon community regeneration involving various stakeholders were explored to fill in research gaps in existing studies. ANT tools were utilized to determine how the implementation is formed as a result of interactions among different individuals or companies in a network. The results showed that low-carbon community regeneration is a synchronous process through interactions and transformations made by different actors. A comprehensive low-carbon management system has been proposed for addressing not only the aspects of effectively encouraging behavioral changes at the individual level but also derives from sound policies, good infrastructure, reasonable systems, and mechanisms at the community level. This management system could be used to achieve the overall objective of building a low-carbon community in Dadong.
The main contributions of this study are as follows: (1) the identification of salient household factors related to carbon emissions and (2) the identification of low-carbon community regeneration practices and mechanisms related to the four translation moments that contribute to the success of the urban regeneration field.
Apart from these contributions, there are some limitations inherent in this study. First, while the narrative of a single community case study in one city can provide valuable insight into low-carbon community regeneration projects, it is necessary to consider how these findings can be generalized to other contexts. To improve the accuracy of the household factors regression analysis, it would be beneficial to include more communities and a larger number of samples in future studies. Additionally, future research should aim to summarize strategies for low-carbon community regeneration based on the household factors that influence carbon emissions in various contexts.
However, these contribution and limitations open a new research view in the future. Scholars have called for future research to focus on the low-carbon community or urban regeneration with innovative strategies [41,42]. For instance, self-regulation for the family is important (e.g., encouraging behavioral changes and raising awareness of low-carbon concepts) [42]. The social method makes it possible to regenerate the low-carbon community effectively. Moreover, some innovative technology can also be considered as the way to succeed in low-carbon community regeneration.
Author Contributions
Conceptualization, K.F. and S.A.A.; methodology, K.F.; software, Y.W.; validation, S.A.A.; formal analysis, K.F.; investigation, K.F. and Y.W.; resources, K.F.; data curation, Y.W.; writing—original draft preparation, K.F.; writing—review and editing, S.A.A.; visualization, Y.W.; supervision, S.A.A.; project administration, Y.W.; funding acquisition, Y.W. All authors have read and agreed to the published version of the manuscript.
Funding
The authors gratefully acknowledge financial support from Research Foundation Program of Shenzhen Polytechnic (Grant No. 6022312006S).
Institutional Review Board Statement
Not applicable.
Informed Consent Statement
Not applicable.
Data Availability Statement
Not applicable.
Conflicts of Interest
The authors declare no conflict of interest.
References
- Fan, J.; Ran, A.; Li, X. A study on the factors affecting China’s direct household carbon emission and comparison of regional differences. Sustainability 2019, 11, 4919. [Google Scholar] [CrossRef]
- Zhang, Y.-J.; Liu, Z.; Zhang, H.; Tan, T.-D. The impact of economic growth, industrial structure and urbanization on carbon emission intensity in China. Nat. Hazards 2014, 73, 579–595. [Google Scholar] [CrossRef]
- Li, L.; Dong, J.; Song, Y. Impact and acting path of carbon emission trading on carbon emission intensity of construction land: Evidence from pilot areas in China. Sustainability 2020, 12, 7843. [Google Scholar] [CrossRef]
- Wang, G.; Liao, M.; Jiang, J. Research on agricultural carbon emissions and regional carbon emissions reduction strategies in China. Sustainability 2020, 12, 2627. [Google Scholar] [CrossRef]
- Liu, C.; Kuang, Y.; Huang, N.; Liu, X. An empirical research on evaluation of low-carbon economy in Guangdong province, China: Based on “Production, Life and Environment”. Low Carbon Econ. 2014, 5, 139–152. [Google Scholar] [CrossRef]
- Heinen, J.T.; Guzman, A.; Sah, J.P. Evaluating the conservation attitudes, awareness and knowledge of residents towards vieques national wildlife refuge, puertorico. Conserv. Soc. 2020, 18, 13. [Google Scholar] [CrossRef]
- Chen, J. An empirical study on China’s energy supply-and-demand model considering carbon emission peak constraints in 2030. Engineering 2017, 3, 512–517. [Google Scholar] [CrossRef]
- Markantoni, M.; Woolvin, M. The role of rural communities in the transition to a low-carbon Scotland: A review. Local Environ. 2013, 20, 202–219. [Google Scholar] [CrossRef]
- Benites, H.S.; Osmond, P.; Rossi, A.M.G. Developing low-carbon communities with LEED-ND and climate tools and policies in São Paulo, Brazil. J. Urban Plan. Dev. 2020, 146, 04019025. [Google Scholar] [CrossRef]
- Schäfer, M.; Hielscher, S.; Haas, W.; Hausknost, D.; Leitner, M.; Kunze, I.; Mandl, S. Facilitating low-carbon living? A comparison of intervention measures in different community-based initiatives. Sustainability 2018, 10, 1047. [Google Scholar] [CrossRef]
- He, Y.; Song, W. Analysis of the impact of carbon trading policies on carbon emission and carbon emission efficiency. Sustainability 2022, 14, 10216. [Google Scholar] [CrossRef]
- Bansal, P.; Knox-Hayes, J. The time and space of materiality in organizations and the natural environment. Organ. Environ. 2013, 26, 61–82. [Google Scholar] [CrossRef]
- Moloney, S.; Horne, R.E.; Fien, J. Transitioning to low carbon communities—From behaviour change to systemic change: Lessons from Australia. Energy Policy 2010, 38, 7614–7623. [Google Scholar] [CrossRef]
- Bagheri, M.; Delbari, S.H.; Pakzadmanesh, M.; Kennedy, C.A. City-integrated renewable energy design for low-carbon and climate-resilient communities. Appl. Energy 2019, 239, 1212–1225. [Google Scholar] [CrossRef]
- Garud, R.; Gehman, J.; Kumaraswamy, A.; Tuertscher, P. From the process. In The SAGE Handbook of Process Organization Studies; Sage: London, UK, 2017; pp. 451–465. [Google Scholar]
- Bahrami, A.; Olsson, M.; Svensson, K. Carbon dioxide emissions from various structural frame materials of single-family houses in nordic countries. Int. J. Innov. Res. Sci. Stud. 2022, 5, 112–120. [Google Scholar] [CrossRef]
- Chan, M.; Masrom, A.N.; Yasin, S.S. Selection of low-carbon building materials in construction projects: Construction professionals’ perspectives. Buildings 2022, 12, 486. [Google Scholar] [CrossRef]
- Middlemiss, L.; Parrish, B.D. Building capacity for low-carbon communities: The role of grassroots initiatives. Energy Policy 2010, 38, 7559–7566. [Google Scholar] [CrossRef]
- Banks, S. The heart and soul of transition—creating a low carbon future with psychological and spiritual awareness. Self Soc. 2007, 35, 5–14. [Google Scholar] [CrossRef]
- Camagni, R. Uncertainty, social capital and community governance: The city as a milieu. Urban Dyn. Growth Adv. Urban Econ. 2004, 266, 121–149. [Google Scholar]
- Bryden, J.; Gezelius, S.S. Innovation as if people mattered: The ethics of innovation for sustainable development. Innov. Dev. 2017, 7, 101–118. [Google Scholar] [CrossRef]
- Burch, S. In pursuit of resilient, low carbon communities: An examination of barriers to action in three Canadian cities. Energy Policy 2010, 38, 7575–7585. [Google Scholar] [CrossRef]
- Chatterton, T. An Introduction to Thinking about ‘Energy Behaviour’: A Multi-Model Approach. Department of Energy and Climate Change, London. 2011. Available online: http://eprints.uwe.ac.uk/17873 (accessed on 1 November 2022).
- Cresswell, K.M.; Worth, A.; Sheikh, A. Actor-network theory and its role in understanding the implementation of information technology developments in healthcare. BMC Med. Inform. Decis. Mak. 2010, 10, 67. [Google Scholar] [CrossRef] [PubMed]
- Dobson, S. Urban translations: Regeneration through the lens of actor-networking. Local Econ. J. Local Econ. Policy Unit 2015, 30, 944–960. [Google Scholar] [CrossRef]
- Allen, C.D. On actor-network theory and landscape. Area 2011, 43, 274–280. [Google Scholar] [CrossRef]
- Spann, G.; Fiske, S.T.; Gilbert, D.T.; Lindzey, G. The Handbook of Social Psychology, 4th ed.; Clark University Press: New Worcester, MA, USA, 1998; pp. 1–100. [Google Scholar]
- Callon, M. Some elements of a sociology of translation: Domestication of the scallops and the fisherman of St Brieuc Bay. In Power Action and Belief a New Sociology of Knowledge; Law, J., Ed.; Routledge: London, UK, 1986; pp. 196–222. [Google Scholar]
- Morgan, J.N.; Sonquist, J.A. Problems in the analysis of survey data, and a proposal. J. Am. Stat. Assoc. 1963, 58, 415–434. [Google Scholar] [CrossRef]
- Aka, K.G. Actor-network theory to understand, track and succeed in a sustainable innovation development process. J. Clean. Prod. 2019, 225, 524–540. [Google Scholar] [CrossRef]
- Edmunds, S.; Haines, L.; Blair, M. Development of a questionnaire to collect public health data for school entrants in London: Child Health Assessment at School Entry (CHASE) project. Child Care Health Dev. 2005, 31, 89–97. [Google Scholar] [CrossRef]
- Krishnamoorthy, K.; Peng, J. Some properties of the exact and score methods for binomial proportion and sample size cal-culation. Commun. Stat.—Simul. Comput. 2007, 36, 1171–1186. [Google Scholar] [CrossRef]
- MacCallum, R.C.; Widaman, K.F.; Zhang, S.; Hong, S. Sample size in factor analysis. Psychol. Methods 1999, 4, 84–99. [Google Scholar] [CrossRef]
- Kennedy, C.; Steinberger, J.; Gasson, B.; Hansen, Y.; Hillman, T.; Havránek, M.; Pataki, D.; Phdungsilp, A.; Ramaswami, A.; Mendez, G.V. Methodology for inventorying greenhouse gas emissions from global cities. Energy Policy 2010, 38, 4828–4837. [Google Scholar] [CrossRef]
- Shen, T.; Yao, X.; Wen, F. The urban regeneration engine model: An analytical framework and case study of the renewal of old communities. Land Use Policy 2021, 108, 105571. [Google Scholar] [CrossRef]
- Anderson, J.C.; Gerbing, D.W. The effect of sampling error on convergence, improper solutions, and goodness-of-fit indices for maximum likelihood confirmatory factor analysis. Psychometrika 1984, 49, 155–173. [Google Scholar] [CrossRef]
- Muralidharan, K. On sample size determination. Math. J. Interdiscip. Sci. 2014, 3, 55–64. [Google Scholar] [CrossRef]
- Ninci, J. Single-case data analysis: A practitioner guide for accurate and reliable decisions. Behav. Modif. 2019, 1–27, Epub ahead of print. [Google Scholar] [CrossRef]
- Peng, W. Study on Evaluation of Low-carbon Construction of Rural Community. Master’s Thesis, Huazhong University of Science & Technology, Wuhan, China, 2011. (In Chinese). [Google Scholar]
- Chen, F.; Zhu, D.; Xu, K. Research on Urban Low-carbon Traffic Model, Current Situation and Strategy: An Empirical Analysis of Shanghai. Urban Plan. Forum 2009, 6, 39–46. (In Chinese) [Google Scholar]
- Dong, L.; Gu, F.; Fujita, T.; Hayashi, Y.; Gao, J. Uncovering opportunity of low-carbon city promotion with industrial system innovation: Case study on industrial symbiosis projects in China. Energy Policy 2014, 65, 388–397. [Google Scholar] [CrossRef]
- Jiang, P.; Chen, Y.; Xu, B.; Dong, W.; Kennedy, E. Building low carbon communities in China: The role of individual’s behaviour change and engagement. Energy Policy 2013, 60, 611–620. [Google Scholar] [CrossRef]
Disclaimer/Publisher’s Note: The statements, opinions and data contained in all publications are solely those of the individual author(s) and contributor(s) and not of MDPI and/or the editor(s). MDPI and/or the editor(s) disclaim responsibility for any injury to people or property resulting from any ideas, methods, instructions or products referred to in the content. |
© 2023 by the authors. Licensee MDPI, Basel, Switzerland. This article is an open access article distributed under the terms and conditions of the Creative Commons Attribution (CC BY) license (https://creativecommons.org/licenses/by/4.0/).