Article

Study on Seismic Response and Vibration Reduction of Shield Tunnel Lining in Coastal Areas

School of Traffic and Transportation Engineering, Dalian Jiaotong University, Dalian 116028, China
*
Author to whom correspondence should be addressed.
Sustainability 2023, 15(5), 4185; https://doi.org/10.3390/su15054185
Submission received: 24 December 2022 / Revised: 12 February 2023 / Accepted: 22 February 2023 / Published: 25 February 2023

Abstract

:
The construction of subway tunnels in the coastal section is affected by special soil quality, with complex construction conditions of unstable soil and vulnerability to groundwater corrosion. The design difficulty of subway tunnels is greatly increased, and the safety performance in the event of an earthquake is greatly reduced. To study the changes in shield tunnel lining structure under earthquake and propose damping measures, ANSYS software is used to conduct tunnel soil numerical simulation. Firstly, static analysis and modal analysis are carried out, and it is found that the maximum displacement deformation occurs at 3.8 cm of the arch crown, and the maximum stress occurs at 2.6 × 10⁷ Pa of the left and right wall corners, 8 easily deformed points are obtained at the same time. Input EI_Centro EW forward 19 s seismic wave is used to analyze the displacement, acceleration and stress vibration characteristics of tunnel lining. The upper part of the lining is more vulnerable to earthquake, and the right arch waist is subject to the maximum stress, reaching 1.37 × 10⁻⁴ Pa, the maximum displacement deformation point is 3.65 × 10⁻¹⁰ m at the right wall. To reduce the impact of earthquakes on tunnel lining, the damping scheme of adding an isolation layer is adopted. Using foam concrete isolation material can reduce the stress of the arch waist by 74.6%, and rubber isolation material can reduce the stress by 80%. In consideration of groundwater corrosion and subsequent engineering construction, it is recommended to use foam concrete as the material for the isolation layer. This study can provide a theoretical basis for the design of metro tunnels in offshore areas.

1. Introduction

As an important traffic structure to improve the technical state of the highway, shorten the running distance, improve the transportation capacity and reduce the occurrence of accidents, the tunnel can not only reduce the driving distance, improve the driving efficiency and safety, but also protect the natural environment and increase the utilization rate of underground engineering space, which is an important means of sustainable urban development in the future. Underground structures have long been considered more stable than ground structures. However, the earthquake in San Francisco caused the abandonment of the Wright Tunnel crossing the San Andreas Fault [1]. At least 14 tunnels were severely damaged by the massive earthquake in Tokyo, Japan [2]. After that, the massive earthquake in southern Japan destroyed more than 30 tunnel structures [3]. The Sichuan Wenchuan earthquake in 2008 caused more than 110 tunnels to suffer from varying degrees of earthquake damage [4], and more than 30 tunnel linings cracked [5]. These examples of earthquake disasters prove to us that the impact of earthquakes on tunnel structures is huge, and the seismic performance of tunnel structures must be widely valued at home and abroad.
In the final analysis, the destruction of the tunnel caused by the earthquake is due to the movement of the soil, so the soil materials will inevitably have an impact on the propagation of seismic waves. Dalian is a typical offshore area. According to the survey report, the Dalian subway tunnel site was originally a floodplain, which was formed by manual backfilling. In the process of manual backfilling, the muddy silty clay layer of the original marine strata was squeezed and disturbed, and was partially missing. This layer has poor physical and mechanical properties in its natural state, and is easy to deform in the saturated state with low strength. At the same time, the strongly weathered layer is widely distributed on the site, which is easy to collapse when immersed in water. After being disturbed in a saturated state, it is easy to soften and deform, and its strength and bearing capacity will decrease sharply. Moreover, groundwater has strong corrosivity to the steel bars in reinforced concrete structures. The construction of tunnels in coastal areas is very vulnerable to the impact of this special soil, and the difficulty of tunnel design is greatly increased. Once an earthquake occurs after being put into use, tunnel collapse, fractures and other accidents and disasters will occur more easily than in ordinary areas.
At present, scholars at home and abroad have carried out research on tunnels with different geological conditions. Tang et al. [6] studied the mountain tunnel portal with weathered rock, mainly focusing on the influence of lining elastic modulus, lining thickness, hard rock specific modulus, axial force and other parameters on the seismic response of tunnels passing through soft and hard rock strata. The results show that the bending moment, shear force and transverse displacement peak value of tunnels in different rock strata are also different. Mohamed Ahmed Abdel Motaal et al. [7] discussed the seismic interaction between the tunnel and the surrounding granular dry soil. The results show that the maximum strain effect imposed on the tunnel lining is proportional to the relative stiffness of the tunnel and surrounding rock. Zhao et al. [8] found that during the earthquake, tunnels passing through inactive faults may experience large differential deformation along their length direction, leading to damage. Yu et al. [9] analyzed the seismic response of Wuhan Sanyang Road subway shield tunnel passing through several different soil layers and found that the longitudinal distribution of the opening width of the lining section and the bending moment response of the lining are mainly affected by the site conditions. Cheng et al. [10] studied the fluid structure coupling problem of a submarine tunnel in fracture zone under earthquakes and found that the vault area of the lining structure is most affected. Zhang et al. [11] proposed a transient seismic structure water sediment rock interaction model to evaluate the seismic response of ocean space structures, focusing on the effects of sediment thickness, porosity, permeability and seismic wave incidence angle on the structural dynamic response. Yao et al. [12] studied the seismic response characteristics of the subway shield tunnel under the rocky mountain and found that the overburdened mountain can inhibit the acceleration response of the underground tunnel. Quan et al. [13] discussed the failure mechanism of soft rock tunnels in the strong earthquake areas. The results show that with the concentration of bending moment and shear stress, the axial pressure of the lining structure at the cavity will be reduced due to local collapse. Shen et al. [14] analyzed the typical seismic damage characteristics and mechanism of mountain tunnels, and the results showed that soil material parameters would have a huge impact on the vibration characteristics. Pai et al. [15] and Liu et al. [16] studied the sliding soil mass and found that the sensitivity of multiple attribute data of acceleration, dynamic earth pressure and dynamic strain under seismic action is quite different. Jalayer, F et al. [17] found that cloud analysis based on careful selection of records can obtain reasonable and effective vulnerability estimates. When selecting records, the dispersion of recorded seismic intensity should be quite large. Therefore, the input seismic wave should be carefully screened for more reasonable and effective analysis.
For many years, scholars have conducted a lot of research on the impact of earthquakes on tunnel structures under different geological conditions. Most of them are mountain rock and soil, and some of them are subsea tunnels. The results show that the damage degree of tunnel structures varies greatly with different soil materials under earthquakes. The soil quality of Dalian subway tunnel is different from that of mountain rock and soil, as well as from a pure submarine environment. Both the existence of strongly weathered rocks in mountain rocks and the high water content in the seabed environment make the water corrosive. Therefore, tunnel structures in offshore areas are prone to risks in mountain tunnels and submarine tunnels. Therefore, the influence of soil conditions should be fully considered when designing earthquake resistance. Therefore, it is very important to study the impact of earthquakes on tunnel structures in offshore areas. At the same time, there is less research on the impact of earthquakes on tunnel structures in such soil conditions.
In view of this, this paper intends to carry out a numerical simulation analysis of metro tunnels in offshore areas. The influence of earthquakes on the deformation of tunnel structure under the condition of soil with a strong weathered layer, silty clay and groundwater corrosion is studied. At the same time, based on the numerical results, corresponding damping measures are analyzed to reduce the lining failure probability and provide a theoretical basis for the design and maintenance of metro tunnels in offshore areas.

2. Theoretical Overview

2.1. Calculation of Damping Coefficient Applied to Seismic Wave

The damping in this paper mainly refers to the external damping theory in engineering applications. It is believed that damping comes from the sliding friction between two solid surfaces and the energy loss caused by the interaction between the research system and the external liquid and gas, without considering the energy dissipation caused by the internal friction of materials [18].
Viscous damping is the most representative of external damping, and it is also widely used because of its simple mathematical treatment. In the viscous damping theory, if the damping force is assumed to be in direct proportion to the particle velocity, the element damping matrix C e is in direct proportion to the element mass matrix M e , that is:
C e = α V N T ρ N d V = α M e
where α is the scale factor; if the damping force is assumed to be proportional to the strain rate, it can be deduced that the element damping matrix C e is proportional to the element stiffness matrix K e , namely:
C e = β V N T ρ N d V = β M e
where β is the scale factor.
Rayleigh damping is widely used in dynamic analysis and practical engineering applications. When the seismic wave is added to the support as a boundary condition, the structural damping can only use Rayleigh damping. Before inputting the seismic wave, the damping coefficient is obtained through this calculation formula, which is convenient for later seismic time history calculations. Based on the basic assumption of viscous damping, it is expressed by the linear combination of the overall damping matrix [C], the overall mass matrix [M] and the overall stiffness matrix [K], namely:
C = α M + β K
where the proportion coefficient α and β are determined by the following formula:
α = 2 ω i ω j ξ i ω j ξ j ω i ω j 2 ω i 2
β = 2 ξ j ω j ξ i ω i ω j 2 ω i 2
ω = 2 π f
where f is the natural frequency; ξ i and ξ j are the damping ratio of the ith and jth vibration modes.

2.2. Nonlinear Model Foundation of Surrounding Rock and Soil Mass

Soil is a skeleton pore structure composed of particles, water, and air. When subjected to a small dynamic load and deformation, the connection between skeletons will not be damaged, and the deformation can be recovered, that is, elastic deformation occurs. However, when the soil is subjected to adverse load, the connection between skeletons is destroyed, and the resulting deformation cannot be restored, that is, plastic deformation. To simulate the actual working conditions more closely, it is very important to select a suitable nonlinear soil model. Common soil constitutive models include single yield surface models and multiple yield surface models. Compared with single yield surface models, multiple yield surface models are more suitable for dynamic research and can more comprehensively describe the real characteristics of the soil.
In this paper, the soil will be loaded with seismic load, which belongs to dynamic research. Therefore, multiple yield surface models are selected. The common multiple yield surface model is the Drucker-Prager model. The Drucker-Prager model has good applicability and realizability for soil materials in numerical simulation.
The Drucker-Prager yield criterion expression is:
F = α I 1 + J 2 k = 0  
where I 1 is the first invariant of stress; J 2 is the second invariant of stress bias; α and k are the internal friction angle of soil mass φ and cohesion c. I 1 and J 2 are expressed by the principal stress:
I 1 = σ 1 + σ 2 + σ 3  
J 2 = 1 6 σ 1 σ 2 2 + σ 2 σ 3 2 + σ 3 σ 1 2
Among σ 1 and σ 2 and σ 3 are the first, second, and third principal stress. The specific expressions of α and k are:
α = 2 sin φ 3 3 sin φ
k = 6 c cos φ 3 3 sin φ
where c is the cohesion of soil mass, φ is the internal friction angle of soil mass.

3. Numerical Simulation

3.1. Model Establishment

This model is based on the Dalian Metro Tunnel. The tunnel segment lining has an outer diameter of 5.1 m, an inner diameter of 4.5 m and a thickness of 0.3 m. The upper boundary is the ground, and the lower boundary is taken to the slate layer 12.5 m away from the tunnel center. The soil layer is divided into four layers from top to bottom, which is the first layer of plain filled with a thickness of about 3.5 m, the second layer of salt clay with a thickness of about 4 m, the third layer of pebble soil with a thickness of about 4 m, and the fourth layer of slate with a thickness of about 23.5 m. The overall model size is 35 m × 20 m × 35 m, D-P constitutive model is adopted to constrain the normal displacement of four sides, the fixed constraint is adopted at the bottom, and no constraint is adopted at the top [19]. According to the Survey Report of Dalian Hutan New Area Station and the Survey Report of Dalian Donghai Park Station, it is determined that the soil material belongs to the special subway tunnel site in Dalian. As the moisture content of the soil in coastal areas is higher than that in inland or mountainous areas, and when the moisture content increases, the moisture will form a lubricant on the surface of larger soil particles, and the combined water film will become thicker, the electric and molecular forces between soil particles will be weakened, and the cohesion will be reduced. Therefore, during parameter design, cohesion parameters will be appropriately reduced, as shown in Table 1. The material parameters of the applied segment and grouping layer are shown in Table 2, and the ANSYS numerical model is shown in Figure 1.
To observe the change of lining, 8 monitoring points are selected on the lining segment, as shown in the Figure 2.

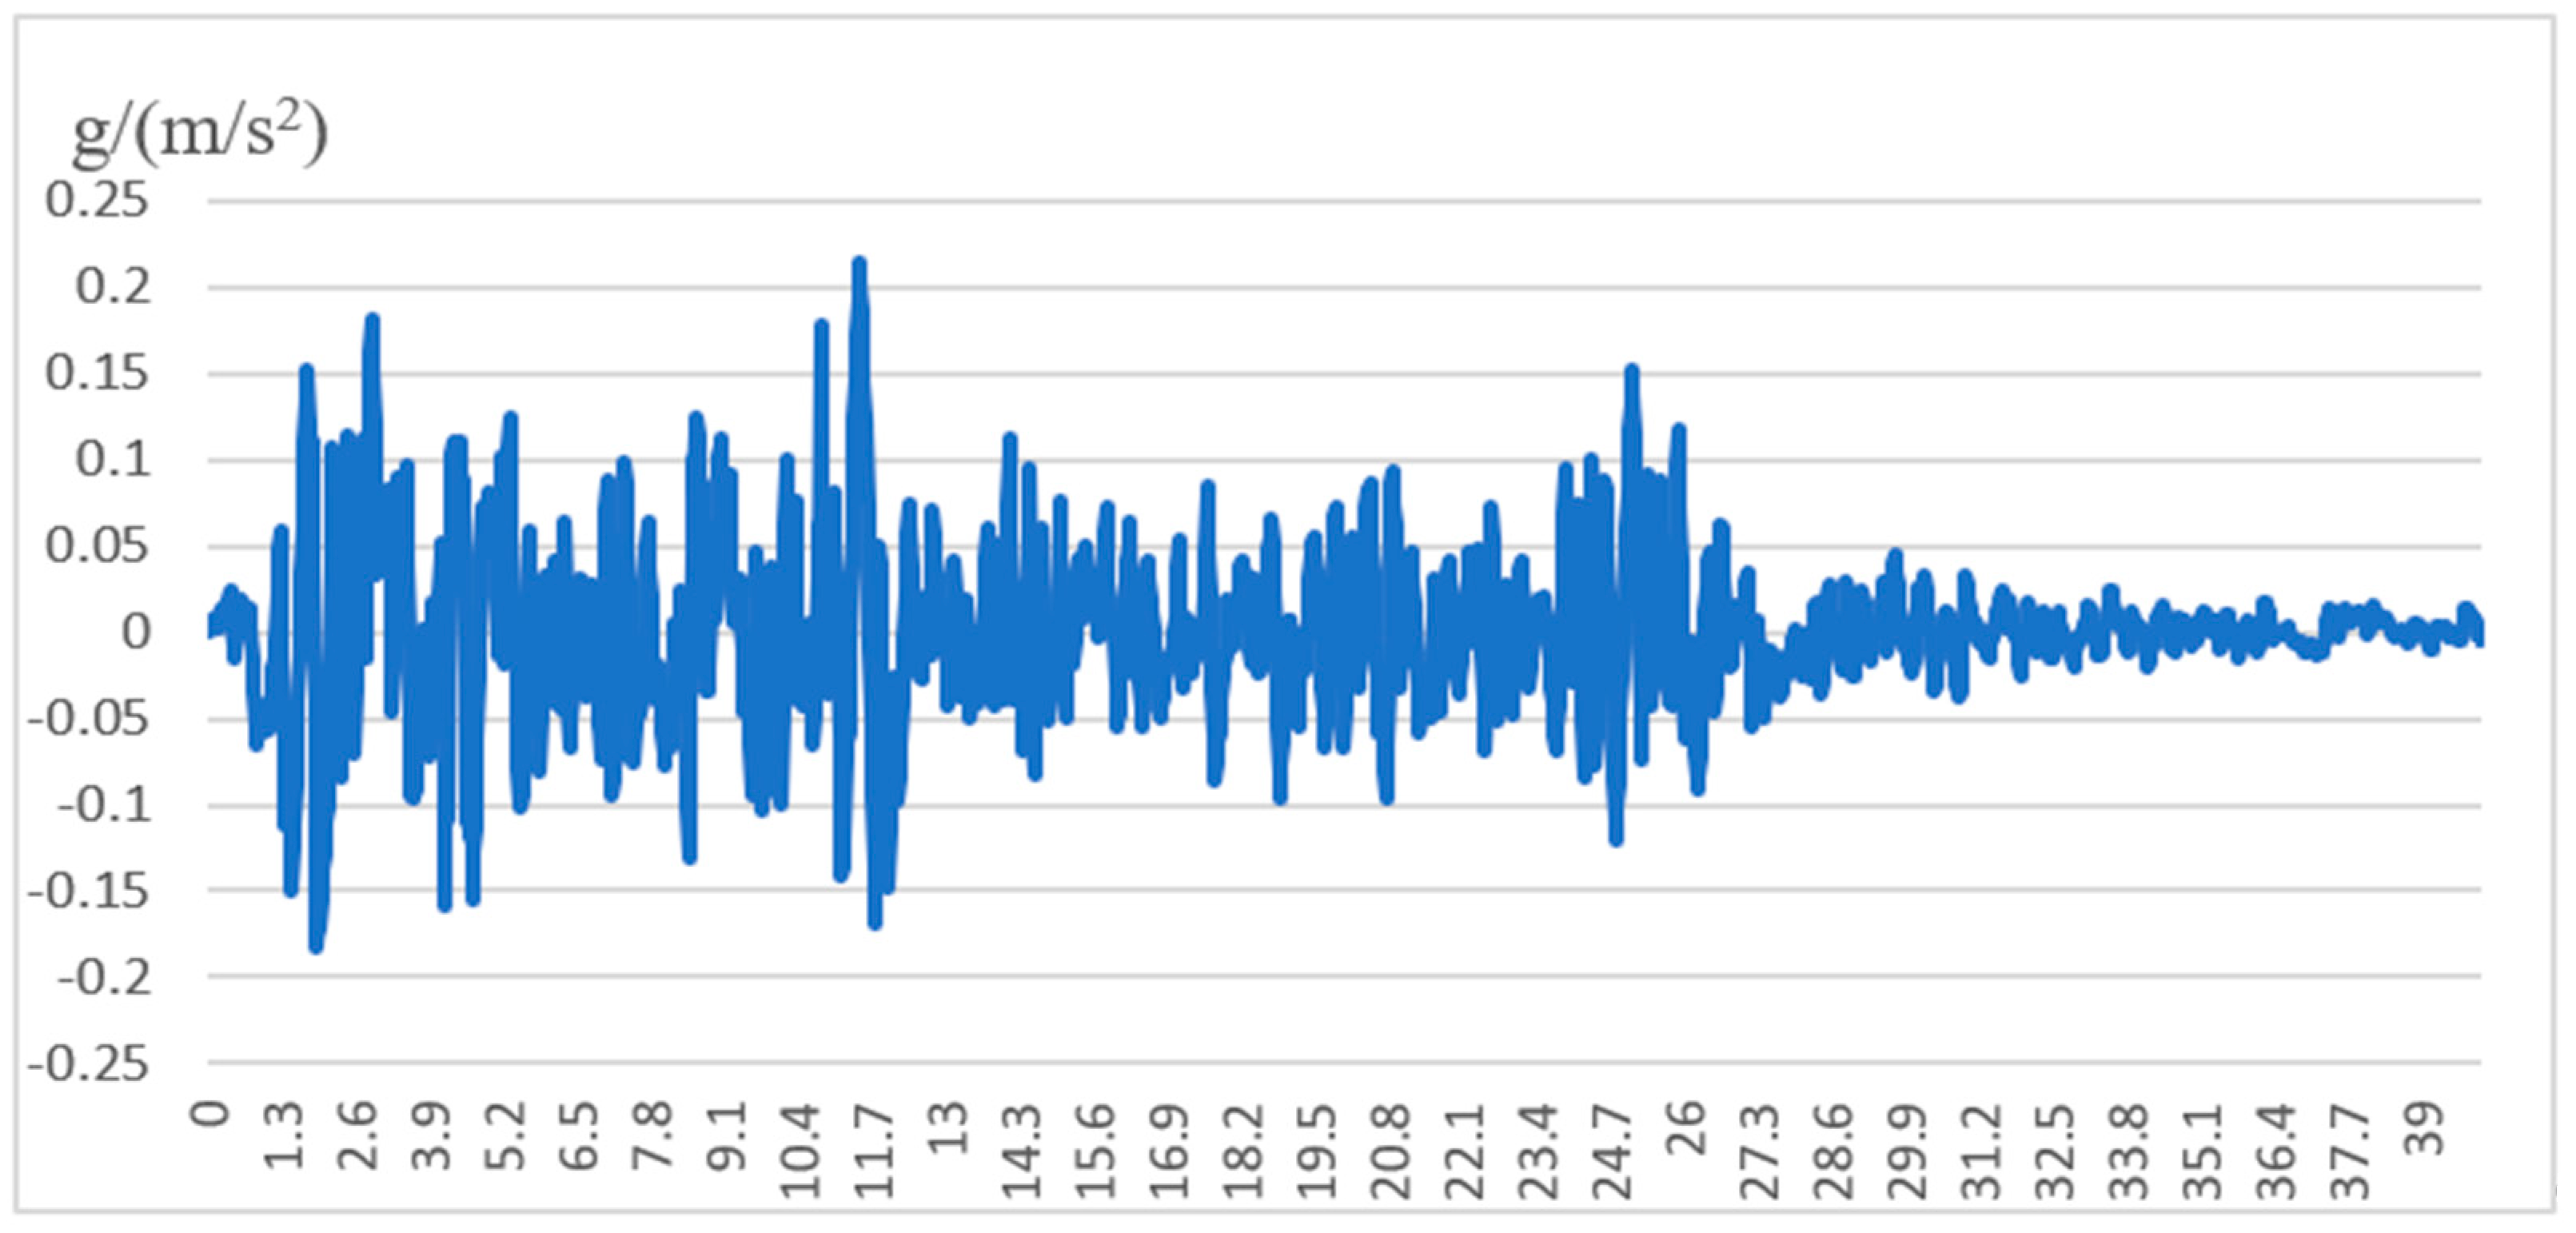
3.2. Selection and Input of Seismic Wave

When conducting seismic response analysis, the final calculated structural response results of different input seismic waves are different. However, due to the lack of seismic wave data, the recorded acceleration time history data can be used for calculation. The existing recorded seismic waves include the EI_Centro seismic wave, the Sichuan Wenchuan seismic wave, the MYG004 wave, etc.
Considering that part of the subway tunnels in the section belonging to the key fortification structure, the seismic fortification shall be increased to one degree according to the seismic intensity of the site during the design. According to Code for Seismic Design of Buildings (GB50011-2001) [20] and Code for Seismic Design of Railway Engineering (GB50111-2006) [21], the site of Dalian Metro Tunnel is classified as Class II. Based on the above requirements, the corresponding design seismic acceleration value under the seismic fortification intensity of 8 degrees is 0.2 g, which is suitable for Class II sites and performance requirements. The specific seismic wave dynamic time history in EW direction of EI_Centro is shown in Figure 3.
The maximum point of EI_Centro wave acceleration appears at 11.46 s. Generally, the time selected for simulation should ensure that the strongest period of seismic record is within the selected duration. Therefore, 951 groups of data in the first 19 s are selected for the next simulation to input the model.

4. Analysis of Numerical Results

4.1. Static Analysis
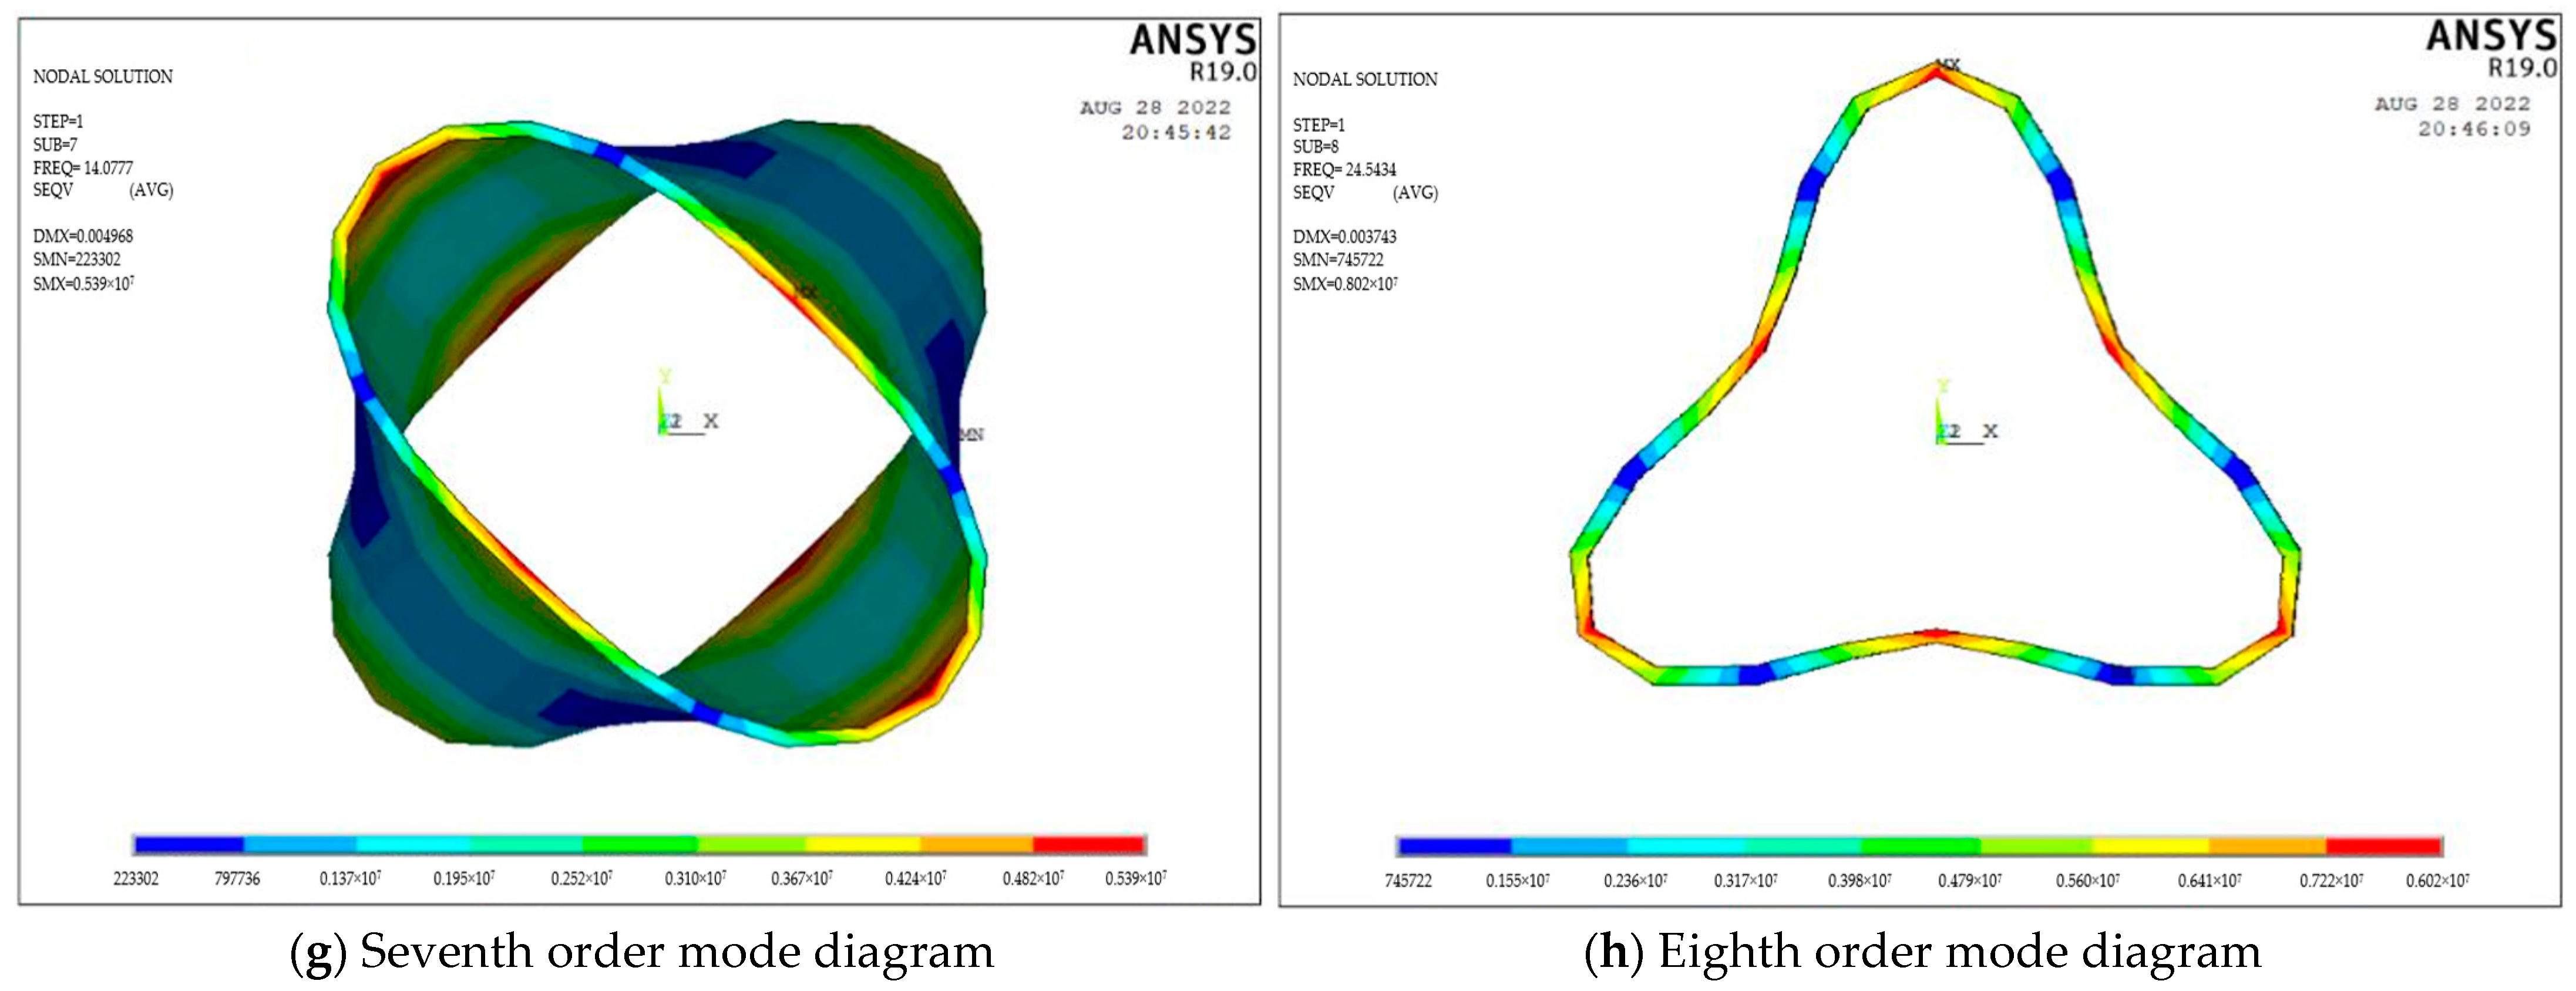
Before the dynamic time history analysis, it is necessary to understand the changes in tunnel lining under the action of gravity to distinguish the deformation of tunnel lining caused by seismic waves. Figure 4 and Figure 5 show the displacement and stress deformation of tunnel segment lining under the action of gravity and surrounding rock.
It can be seen from Figure 4 that the maximum deformation displacement is 3.8 cm, which occurs at the vault. This is because the gravity of the upper soil mass and its gravity exert pressure on the arch crown, resulting in large displacement and deformation at the arch crown. Although other parts of the segment are squeezed by the surrounding rock, they are relatively small, so the displacement and deformation are relatively small. The minimum deformation is 0.8 cm at the center of the inverted arch, which is due to the downward force of gravity on the inverted arch and the upward support force of the underlying surrounding rock, which reduces the deformation caused by gravity.
It can be seen from Figure 5 that the maximum stress is generated at the position where the side walls on both sides are close to the wall corner, and the value is 2.6 × 10⁷ Pa, the minimum value appears at the vault, and the value is 3 × 10⁶ Pa. Such stress and deformation are still caused by the tensile stress of the segment lining as a whole due to gravity. The minimum deformation at the arch crown is because the compression stress of gravity on the segment counteracts the tensile force. The inverted arch is not the place with the maximum deformation, but also because of the supporting force of the lower surrounding rock. The maximum stress deformation at the side wall near the wall corner is because there is no other force to offset the tensile stress of gravity on the segment.

4.2. Modal Analysis

Vibration mode is an inherent and integral characteristic of the elastic structure. [22] Through the modal analysis of the structure, we can understand the characteristics of the main modes of the structure in a certain frequency range that is easily affected, to judge the actual vibration response that may be generated under the action of various external or internal vibration sources in this frequency band. At the same time, modal analysis is also an important method for structural dynamic design and equipment fault diagnosis.
The damping factor has little influence on the natural frequency and mode of the whole system, so the damping effect can be ignored in the modal analysis. Table 3 shows the frequency and damping coefficient corresponding to the first three modes, in which the damping ratio ξ i and ξ j are generally determined by experiment, and it can be generally assumed that the viscous damping ratio is 0.03, 0.05.
Figure 6 is the vibration mode diagram of the structure for the 8th order modal analysis.
It can be seen from Table 3 and Figure 6 that the first three natural frequencies are small, so the deformation is also small. With the increase of natural frequency, the equivalent stress of each point is different. When reaching the fourth order mode figure, the natural frequency increases sharply, resulting in large deformation. The larger stress points are evenly distributed at the invert, vault, left and right side walls, and the maximum equivalent stress is 2.7 × 10⁶ Pa. The fifth to seventh order modes deform again on the basis of the fourth order, and the deformation becomes more and more severe. It can be seen from the eighth order vibration mode diagram that the easily affected points under natural vibration are highly overlapped with the eight previously set points, which indicates that the following research needs to focus on the eight points that are prone to deformation.

4.3. Time History Analysis

The time history analysis method is a dynamic analysis method that directly solves the differential equation of motion of a structural object step by step. From the time history analysis, the dynamic response of each particle with time can be obtained.

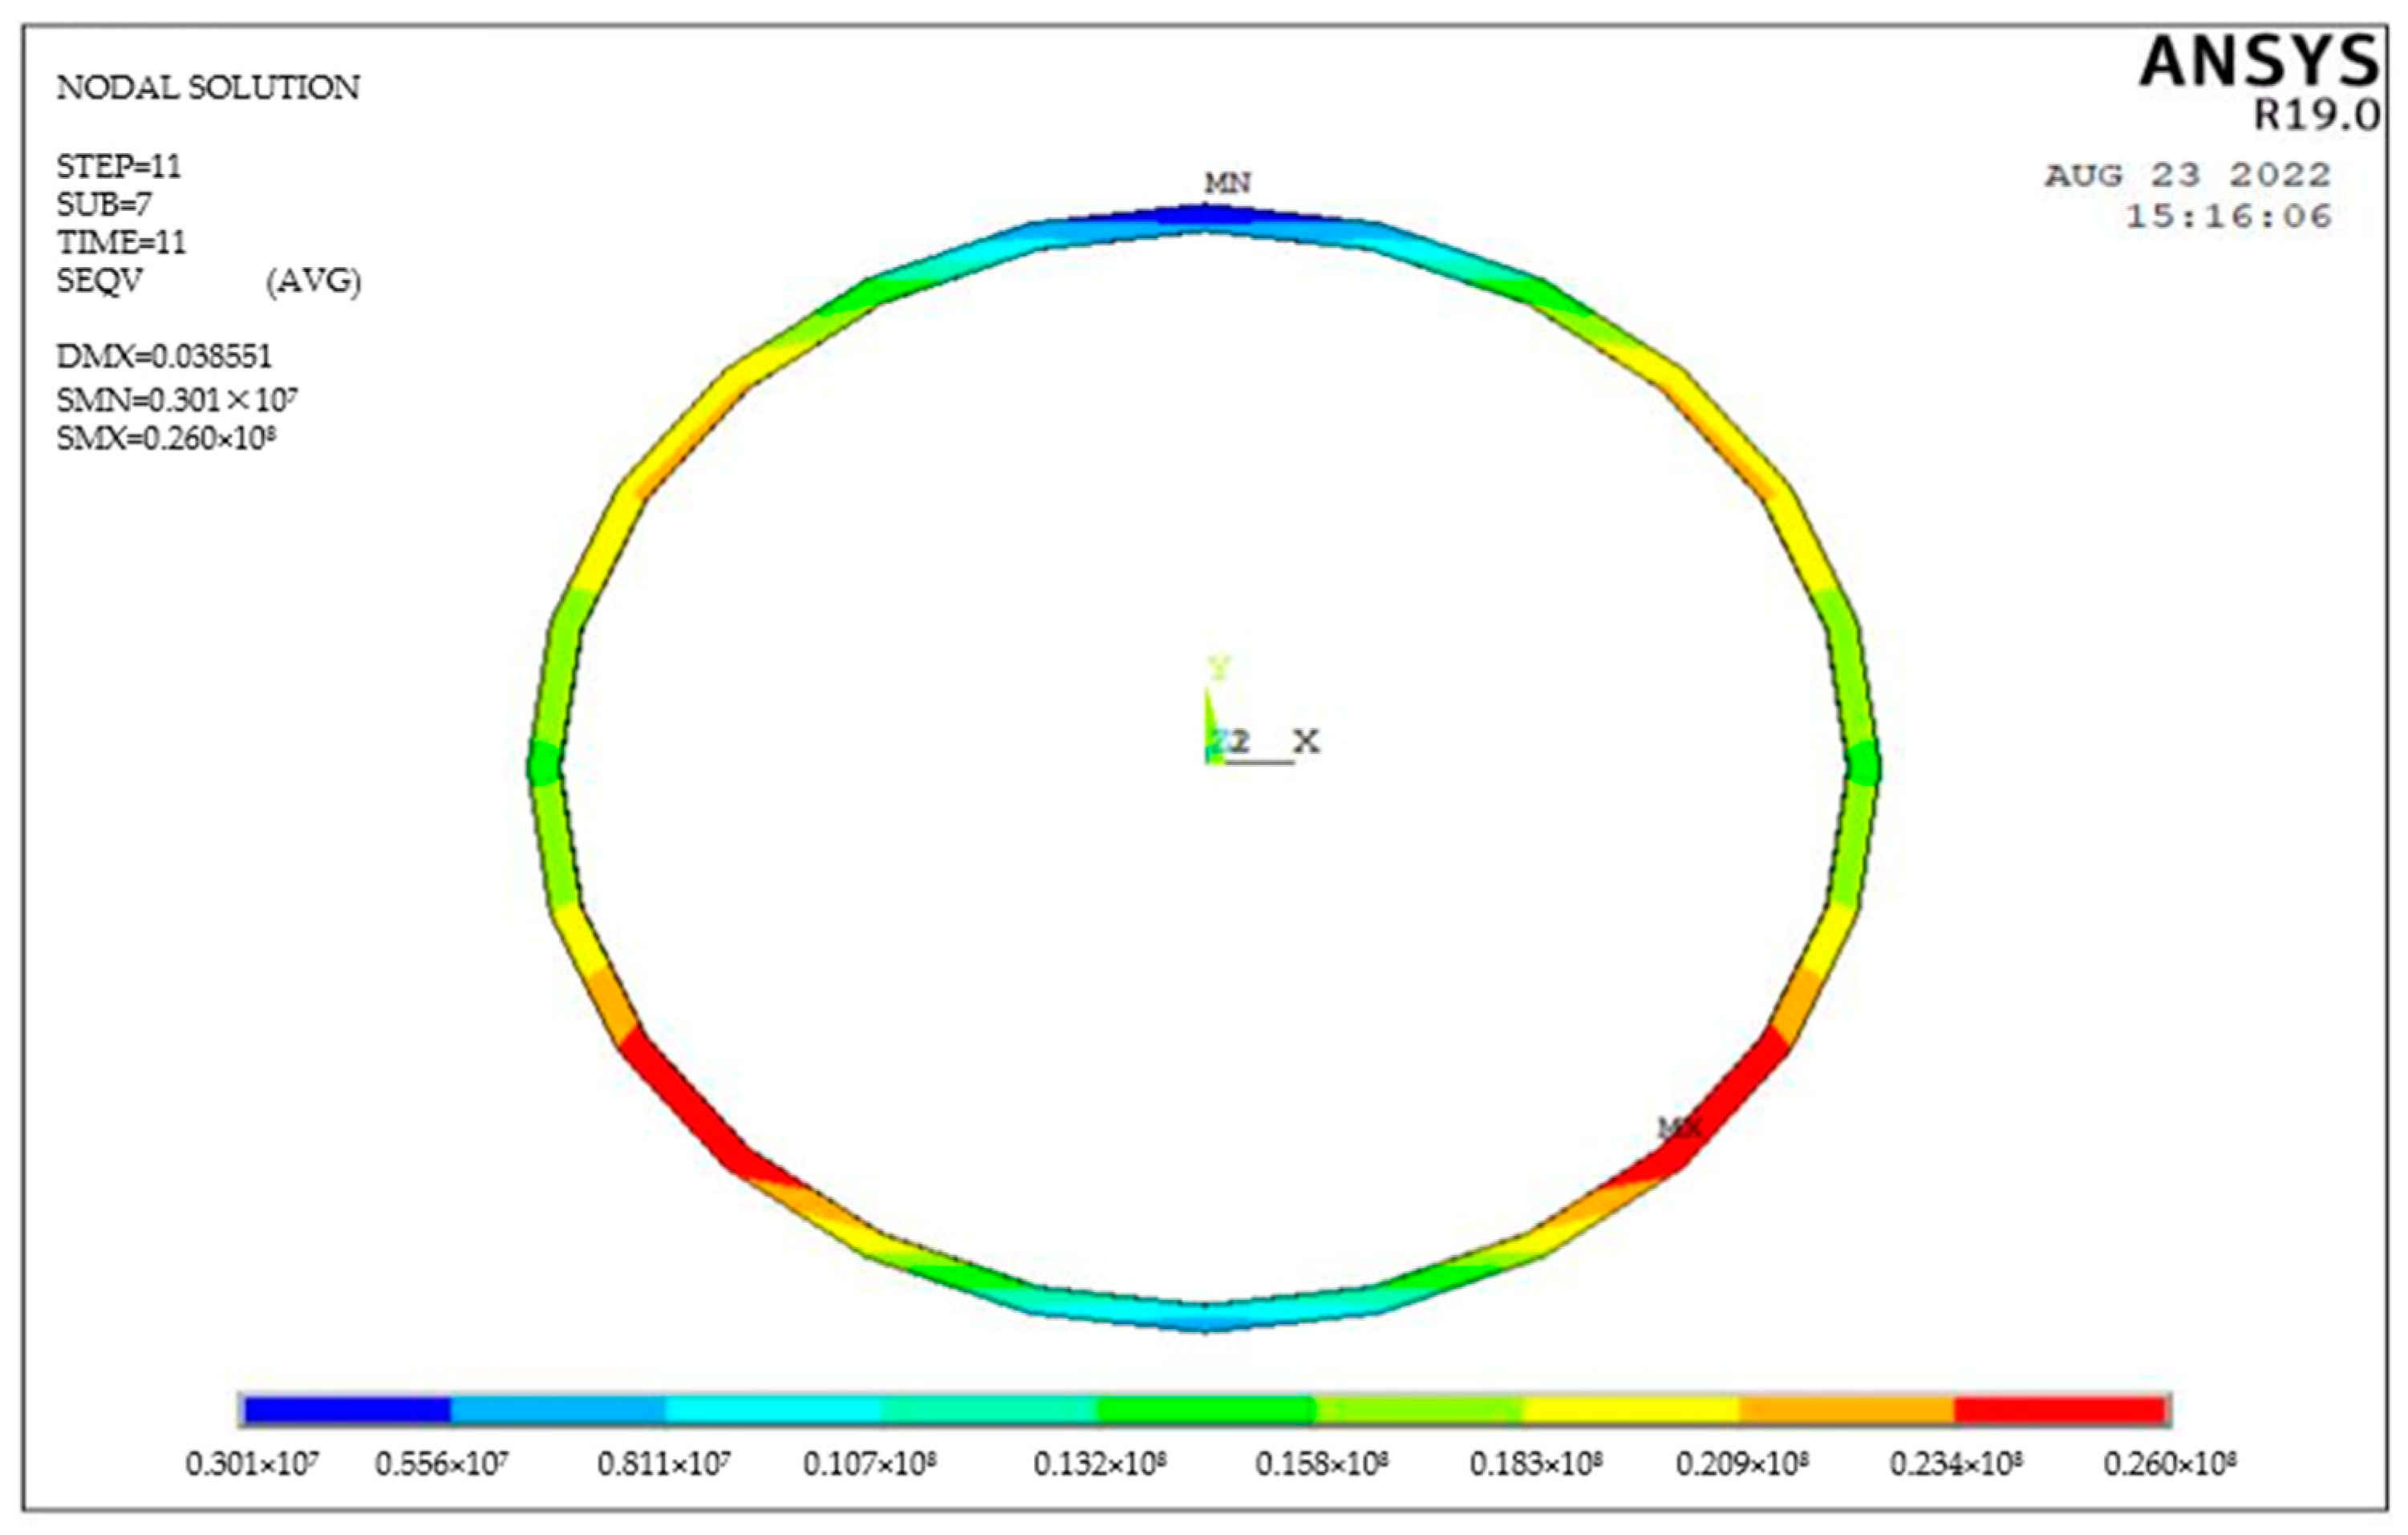
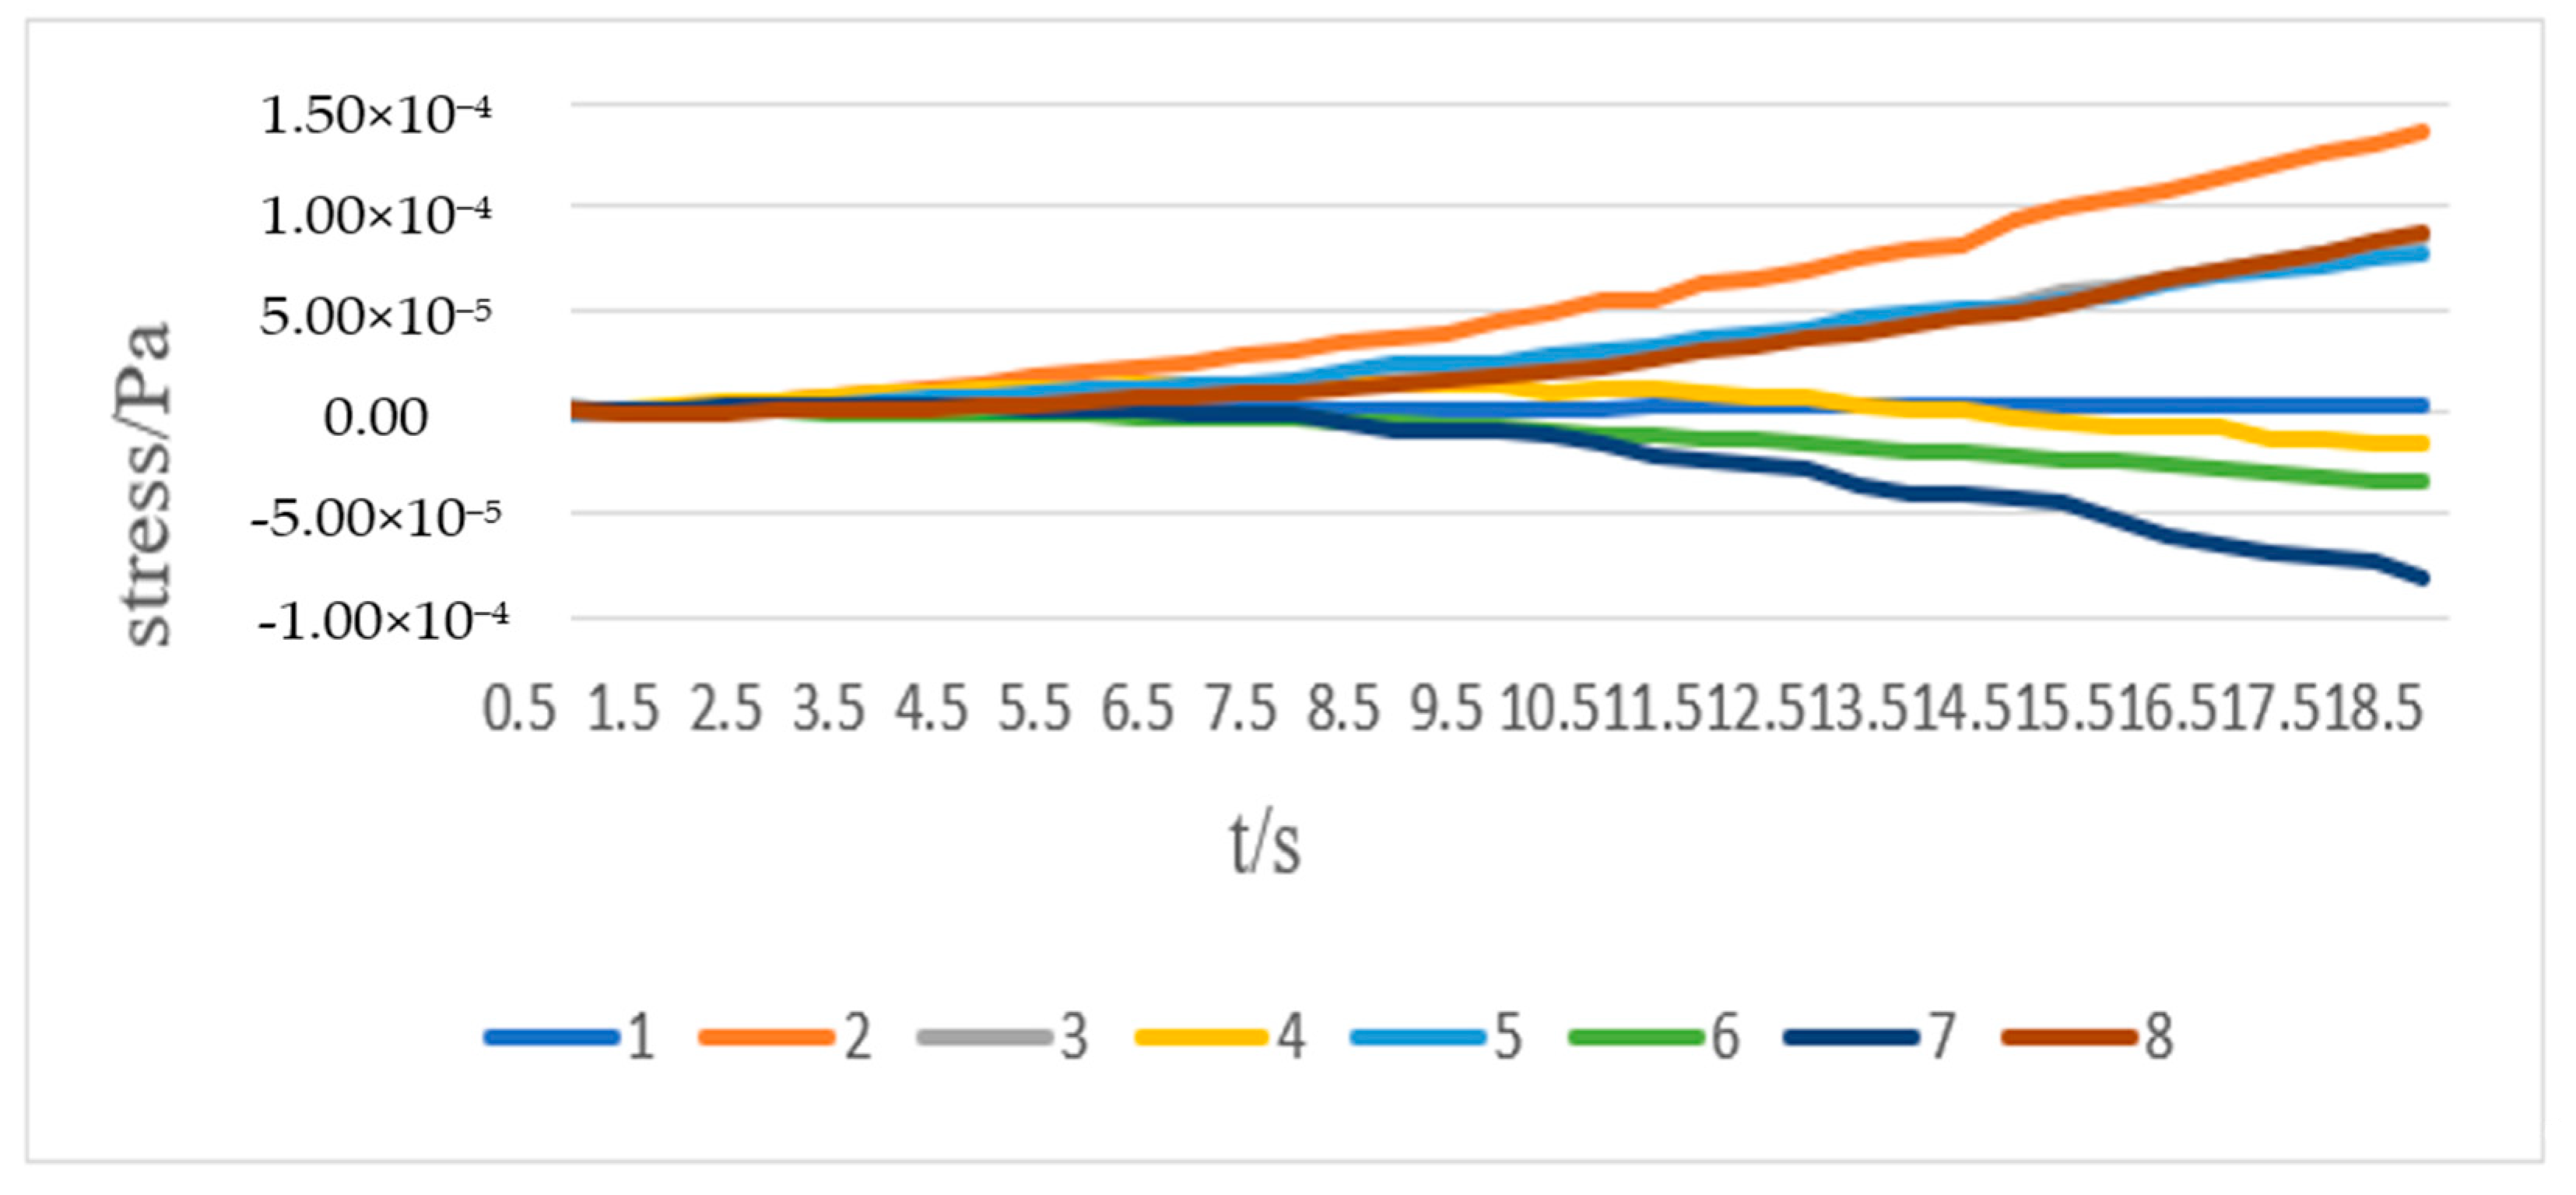
4.3.1. Time History Analysis of the First Principal Stress Response

Figure 7 shows the stress curve analysis of each monitoring point through the ANSYS post-processor. It can be seen from the overall trend that the stress intensity of each point gradually increases with time. However, because the intensity of seismic waves changes with time is different, there will be some waves in the process of increasing the stress.
It can be concluded from Figure 7 that:
(1) The numerical strength of the stress response of No. 5 invert is greater than that of No. 1 vault. The maximum stress of the inverted arch is 7.85 × 10⁻⁵ Pa. The maximum stress value of the vault is 3.46 × 10⁻⁵ Pa. There is an obvious stress difference between the two locations, and the two locations generally show tensile stress. The stress rising rate of invert is greater than that of the arch crown.
(2) Monitoring Point 2 and monitoring Point 4 are roughly symmetrical. Monitoring Point 2 is the location where the maximum stress occurs, reaching 1.37 × 10⁻⁴ Pa. The stress response value of the left and right arch waists at Points 2 and 8 is about two to four times that of the arch crown, so the lining deformation at these two locations should also be paid attention to, and the strength and stiffness of the lining at these two locations should also be paid attention to.
(3) The numerical strength of stress response at Point 3 and Point 7, that is, the left and right side walls, are equivalent, and the value is about 8.5 × 10⁻⁵ Pa. Point 7 mainly turns into compressive stress, and Point 3 mainly turns into tense stress.

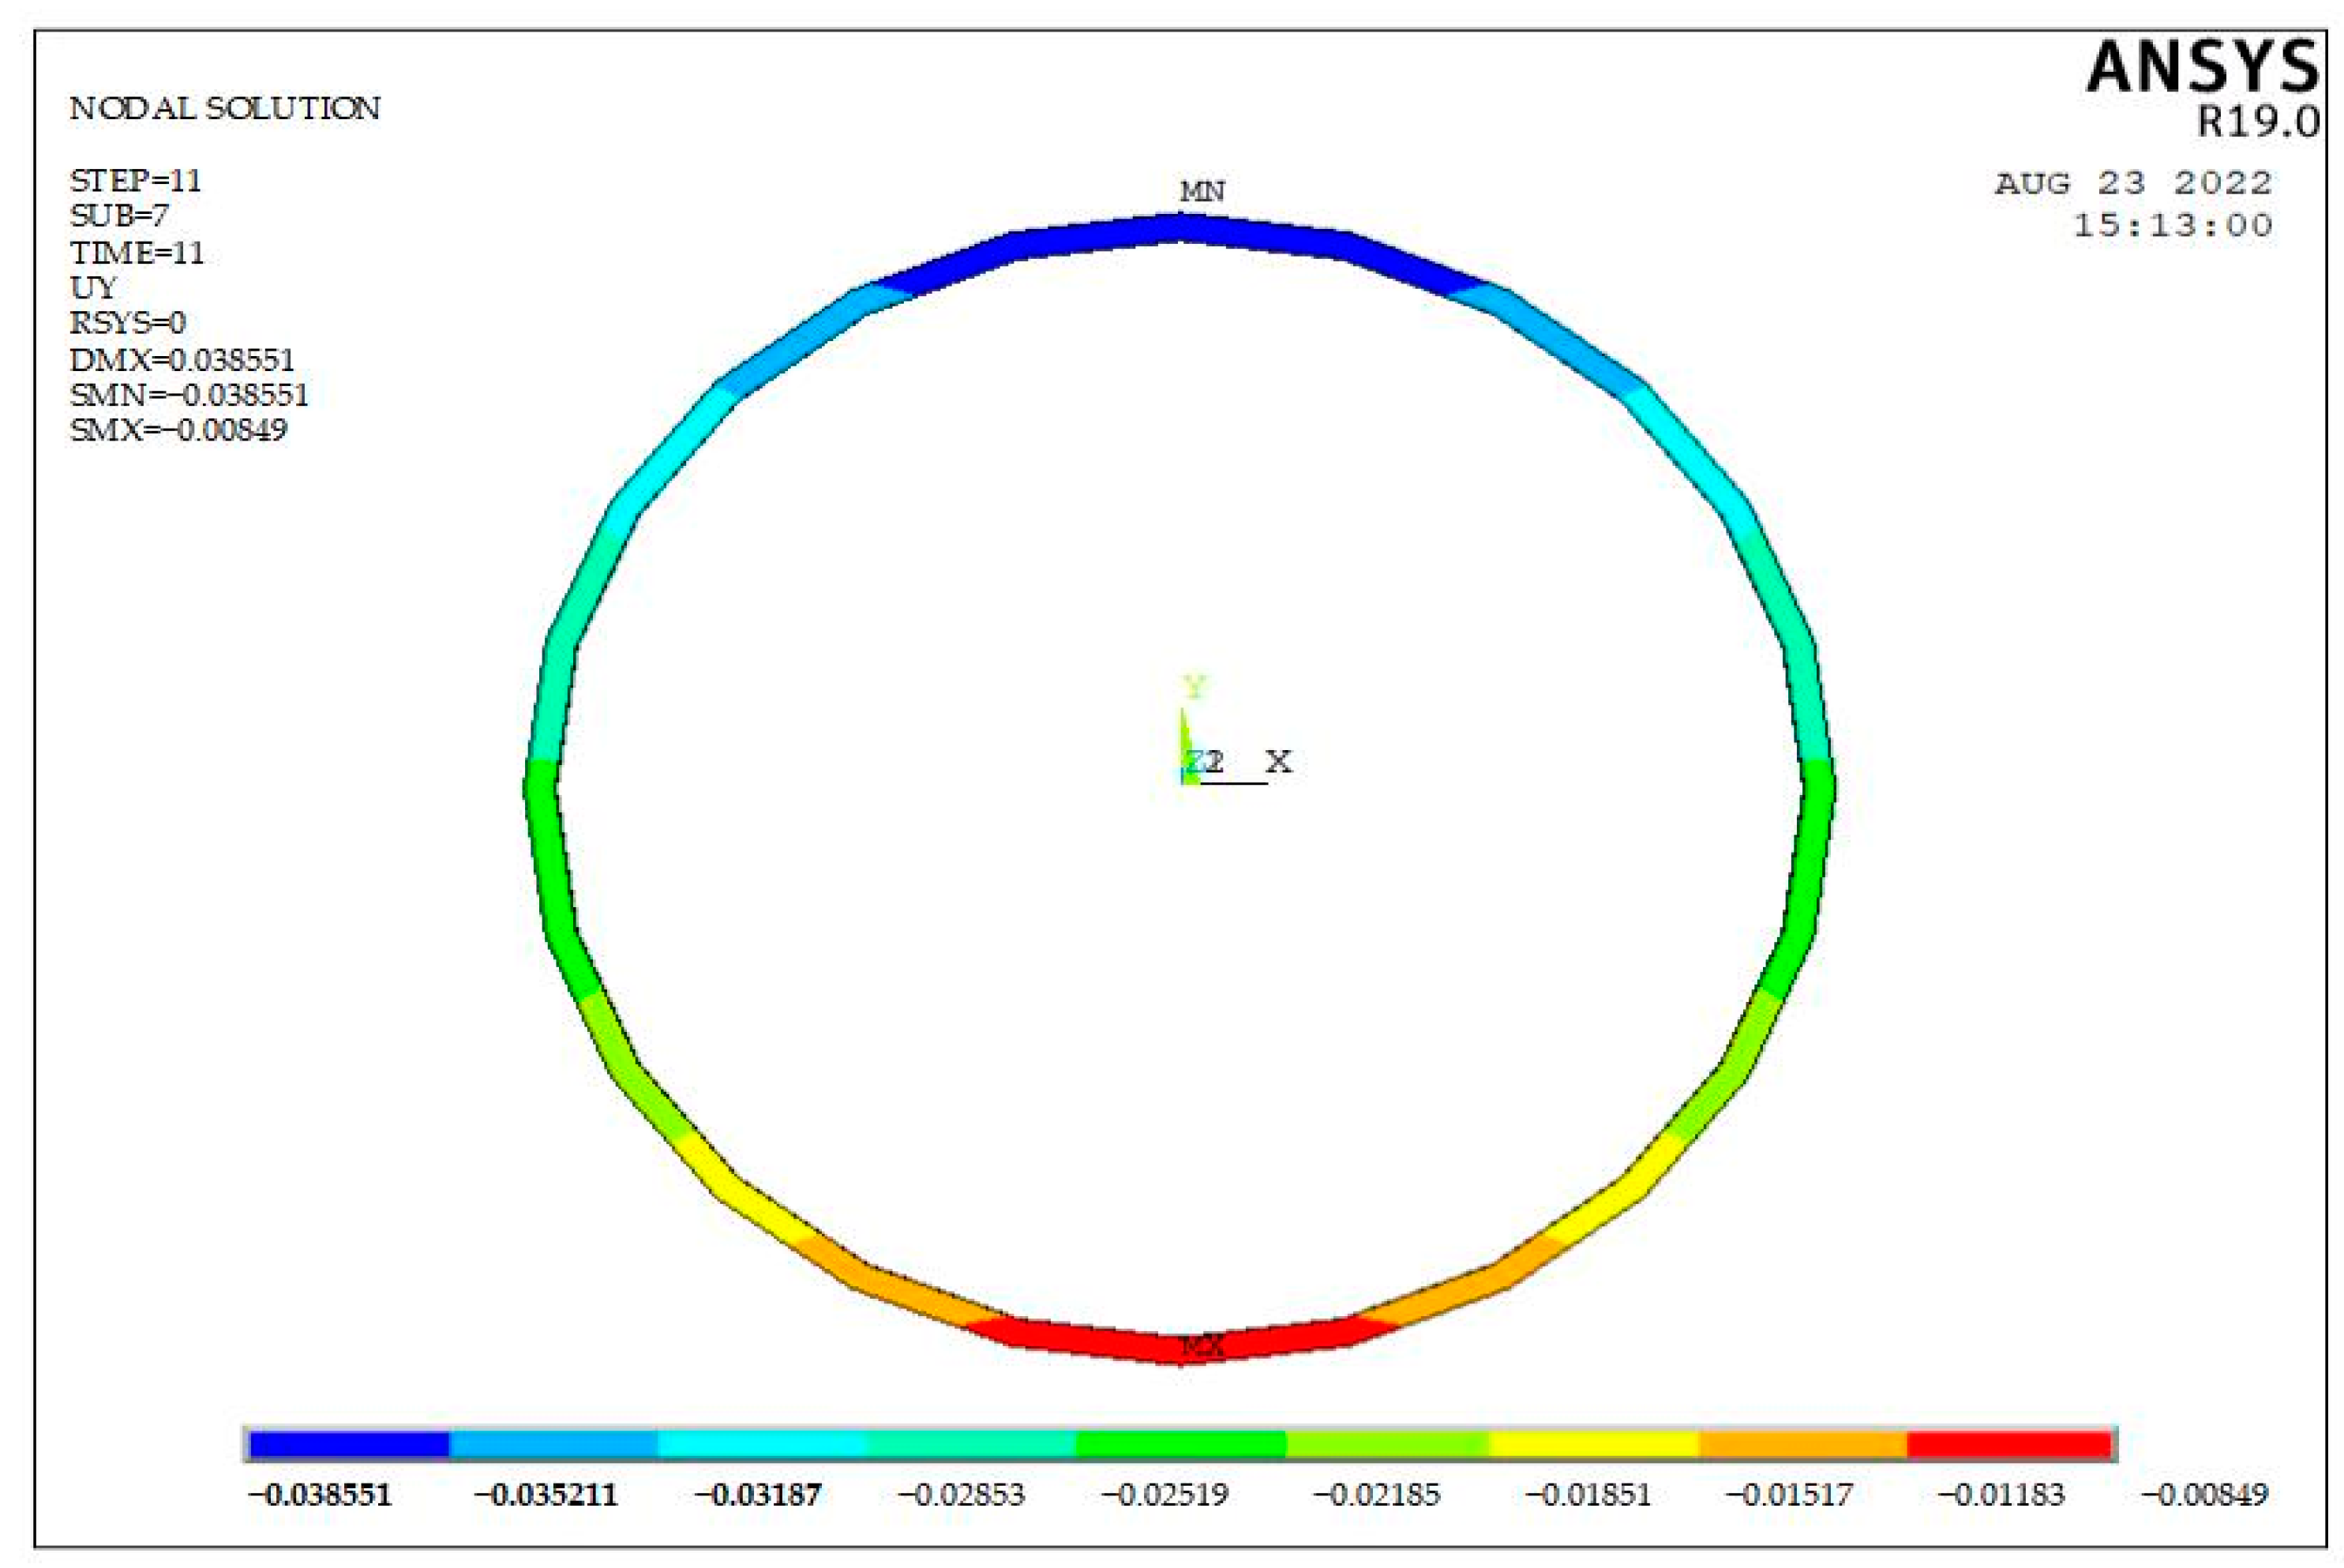
4.3.2. Time History Analysis of Displacement Response

Figure 8 shows the analysis of the vertical displacement time history data obtained from the calculation of the established model. Through the calculation, the lateral displacement changes of each monitoring point are the same, so the subsequent calculation is not considered.
It can be found that the upper and lower parts of the lining in the same horizontal plane have high numerical symmetry, and the displacement from the arch crown to the inverted arch gradually increases and then decreases. It can be seen from the displacement value that the displacement change of Point 3 is the largest, reaching 3.65 × 10⁻¹⁰ m, followed by Point 2, which also reached 3.3 × 10⁻¹⁰ m. It is generally characterized by large deformation at the upper part and small deformation at the lower part, which also indicates that the upper part of the lining is more likely to be damaged.

4.3.3. Time History Analysis of Acceleration Response

The change of acceleration of monitoring points with time can be obtained by secondary derivation of longitudinal displacement. The specific values of peak acceleration of each monitoring point are shown in Table 4.
Under the action of an east–west direction EI_Centro seismic wave, the acceleration of the lining monitoring point changes frequently, and the overall law of the acceleration time history curve is similar to the vibration acceleration time history curve. The maximum acceleration occurs at the No. 1 arch crown, and the acceleration at the monitoring point increases first and then decreases from the arch crown to the inverted arch. The peak acceleration values of the invert and arch crown are similar, and the upper and lower parts of the lining are also roughly symmetrical. The acceleration from the arch crown to the side wall is reduced by about 43%, which also shows that the upper part of the lining is more vulnerable to the impact of seismic waves to produce deformation or fracture.

5. Analysis of Damping Scheme

There are two ways to reduce vibration: one is to reduce the input of seismic energy to control the impact of seismic action on buildings and limit the impact to the bearable limit of buildings; the other is to actively change the performance of buildings to adapt to the additional impact caused by seismic action [23].
In general, the method of thickening lining segments or reinforcing the lining is adopted for seismic mitigation of underground tunnels, focusing on improving the strength and stiffness of the structure itself. The eight monitoring points in the 8th order vibration mode diagram in Figure 6 are the positions with the maximum natural vibration stress and the most prone to deformation, which can provide accurate positions for thickened lining segments.
In recent years, experts and scholars have paid more attention to setting a damping layer between the lining and surrounding rock for seismic mitigation, and using the flexible characteristics of the damping layer to reduce the absorbed seismic wave energy. Therefore, the damping layer material needs to be portable and energy absorbing. The commonly used engineering energy absorbing and damping materials include foam aluminum, damping rubber, foam concrete, and synthetic materials with a damping effect.
Rubber is generally considered as a super elastic material, which can withstand large strain and displacement, but its volume change is very small. Because of its small unit weight, good overall performance and small inertia force during earthquakes, foam concrete is often used as an anti-seismic material. Because the underground water of Dalian metro tunnel is corrosive and has great damage to metal materials, rubber and foam concrete without metal materials are selected as the materials of shock absorption layer in this paper. Different material parameters will reflect different material properties. The elastic modulus and Poisson’s ratio reflect the strain resistance of the material. The cohesion and internal friction angle reflect the sheer strength of the material. The specific parameters of the two materials are shown in Table 5. The acceleration and stress analysis and comparison of segment lining and non-isolation layer model using these two isolation materials are shown in Figure 9 and Table 6.
It can be seen from Figure 9 that the setting of the isolation layer cannot fundamentally change the dynamic response value of the tunnel lining structure, and the acceleration curve of the original lining is close to that of the added isolation layer. The difference between the original lining acceleration at Point 2 and the acceleration using rubber isolation materials is 3.163 × 10⁻¹⁰, which is 2.817 × 10⁻¹⁰ different from the value of foam concrete isolation material. The maximum acceleration of rubber isolation materials appears at Point 5, and the maximum acceleration of foam concrete isolation materials appears at Point 1. There is little difference between the two kinds of isolation materials at each monitoring point. However, because the isolation layer itself has the functions of isolation, buffering and energy dissipation, it can reduce the stress transfer coefficient, thus playing a better role in the isolation of the lining structure.
For the upper part that is relatively easy to affect, the stress on the arch crown is always large. After the isolation layer is added, the stress using rubber isolation materials increases by 26%, and the stress using foam concrete isolation materials increases by 7%. For the original lining, the stress at the right arch waist, which has been paid more attention to all the time, is significantly reduced after adding the isolation layer. The use of rubber isolation materials reduces the stress by 76.4%, while the use of foam concrete materials reduces the stress by about 80%. The position of the right wall and the left arch waist changes from the original tensile stress to the compressive stress that is not easy to damage. The above conclusions show that the setting of the isolation layer can indeed play a role in damping and energy consumption. Both materials have good damping effects on the tunnel, but the stress reduction of foam concrete is about 5% less than that of rubber. Moreover, considering the actual implementation of the project, foam concrete can be added between the segment and the grouping layer during grouping, and can also resist the corrosion of groundwater. Therefore, it is recommended to use foam concrete as the seismic isolation material. At the same time, the price of one cubic meter of foam concrete is about 380 yuan, while the market price of one ton of rubber is about 17,000 yuan. The price of foam concrete is far better than rubber, which is not only environmentally friendly and convenient for construction; it is also excellent in all aspects, suitable for local soil, increasing safety and service life, more to meet the sustainable development.

6. Conclusions

(1) The preliminary statistical analysis of the numerical simulation is carried out. Through the displacement and stress changes, the maximum deformation displacement under the action of gravity and surrounding soil is 3.8 cm, which is generated at the vault. The minimum deformation displacement is 0.8 cm at the invert, and the maximum stress deformation is 2.6 × 10⁷ Pa at the wall corners on both sides.
(2) Before the seismic time history analysis, the modal analysis is carried out to obtain the natural frequency and the 8th order vibration mode diagram of the tunnel segment lining, and eight points prone to deformation are obtained as monitoring points. Calculate the damping coefficient according to the damping theory, and input EI_Centro’s EW seismic wave 19 s forward and the calculated damping coefficient is used for time history analysis. The stress time history response shows that both the arch crown and the inverted arch show tensile stress, and the stress of the left and right arch waists is about two to four times the stress of the arch crown.
(3) The acceleration and stress of rubber and foam concrete as isolation layers are analyzed comprehensively considering the common damping materials and the special properties of soil. The results show that the isolation layer can not fundamentally change the dynamic response value of the tunnel lining structure, but it can reduce the vibration by absorbing energy. Both materials have good damping effects on the tunnel. At the right arch waist, the use of rubber materials can reduce stress by 76.4%, and the use of foam concrete materials can reduce stress by 80%. Considering the actual implementation of the project, it is believed that the seismic isolation effect of foam concrete is better than that of rubber.

Author Contributions

Data curation, X.Z. and K.W.; Formal analysis, S.D., X.Z. and S.L.; Funding acquisition, S.D.; Investigation, S.D. and S.L.; Methodology, S.D. and X.Z.; Software, X.Z. and C.J.; Supervision, C.J.; Validation, C.J.; Writing—original draft, X.Z.; Writing—review and editing, S.L. and K.W. All authors have read and agreed to the published version of the manuscript.

Funding

This research received no external funding.

Institutional Review Board Statement

Not applicable.

Informed Consent Statement

Not applicable.

Data Availability Statement

Not applicable.

Acknowledgments

The authors are grateful to the anonymous reviewers for their constructive comments.

Conflicts of Interest

We declare that we have no financial and personal relationships with other people or organizations that can inappropriately influence our work, there is no professional or other personal interest of any nature or kind in any product, service and/or company that could be construed as influencing the position presented in, or the review of the manuscript entitled.

References

  1. Carol, S.P.; Daniel, J.P. Coseismic deformation of the Wrights tunnel during the 1906 San Francisco earthquake: A key to understanding 1906 fault slip and 1989 surface ruptures in the southern Santa Cruz Mountains, California. J. Geophys. Res. Solid Earth 1997, 102, 635–648. [Google Scholar]
  2. Pan, C.S. Overview of tunnel earthquake disaster. Tunn. Undergr. Eng. 1990, 11, 1–9. [Google Scholar]
  3. Yashiro, K.; Kojima, Y.; Shimizu, M. Historical Earthquake Damage to Tunnels in Japan and Case Studies of Railway Tunnels in the 2004 Niigataken-Chuetsu Earthquake. Q. Rep. RTRI 2007, 48, 136–141. [Google Scholar] [CrossRef] [Green Version]
  4. Gao, B.; Wang, Z.Z.; Yuan, S.; Shen, Y.S. Enlightenment from Wenchuan Earthquake on Road Tunnel Damage. J. Southwest Jiaotong Univ. 2009, 44, 336–341+374. [Google Scholar]
  5. Wang, Z.Z.; Jiang, Y.J.; Zhu, C.A.; Sun, T.C. Shaking table tests of tunnel linings in progressive states of damage. Tunn. Undergr. Space Technol. Inc. Trenchless Technol. Res. 2015, 50, 109–117. [Google Scholar] [CrossRef]
  6. Tang, L.Z.; Yu, L.; Wang, M.N.; Li, Z.X.; Zhang, X.; Lu, M.; Yang, H.H. Green’s functions based on the Timoshenko beam model for the longitudinal seismic dynamic response of tunnels crossing soft and hard rock strata. Tunn. Undergr. Space Technol. Inc. Trenchless Technol. Res. 2022, 128, 104545. [Google Scholar] [CrossRef]
  7. Mohamed, A.A.; Fathalla, M.E.; Ahmed, T.K. Mutual seismic interaction between tunnels and the surrounding granular soil. HBRC J. 2014, 10, 265–278. [Google Scholar]
  8. Zhao, X.; Li, R.H.; Yuan, Y.; Yu, H.T.; Zhao, M.; Huang, J.Q. Shaking table tests on fault-crossing tunnels and aseismic effect of grouting. Tunn. Undergr. Space Technol. Inc. Trenchless Technol. Res. 2022, 125, 104511. [Google Scholar] [CrossRef]
  9. Miao, Y.; Yao, E.; Ruan, B.; Zhuang, H.Y. Seismic response of shield tunnel subjected to spatially varying earthquake ground motions. Tunn. Undergr. Space Technol. Inc. Trenchless Technol. Res. 2018, 77, 216–226. [Google Scholar] [CrossRef]
  10. Cheng, X.S.; Xu, W.W.; Yue, C.Q.; Du, X.L.; Charles, H.D. Seismic response of fluid–structure interaction of undersea tunnel during bidirectional earthquake. Ocean Eng. 2014, 75, 64–70. [Google Scholar] [CrossRef]
  11. Zhang, G.L.; Wang, P.G.; Zhao, M.; Du, X.L.; Zhao, X. Seismic structure-water-sediment- rock interaction model and its application to immersed tunnel analysis under obliquely incident earthquake. Tunn. Undergr. Space Technol. 2021, 109, 103758. [Google Scholar] [CrossRef]
  12. Yao, E.; Sun, Q.N.; Li, W.C.; Yu, M.; Liu, M.S. Numerical study on the characteristics of the seismic response of subway shield tunnels beneath rock mountains: A case study in China. IOP Conf. Ser. Earth Environ. Sci. 2021, 861, 052067. [Google Scholar] [CrossRef]
  13. Quan, X.J.; Gao, J.H.; Wang, B.; Xu, J.H.; Zhang, Q.Z. Damage Mechanisms of Soft Rock Tunnels in the Western China: A Case Study on the Dujiashan Tunnel. Struct. Eng. Int. 2022, 32, 369–377. [Google Scholar] [CrossRef]
  14. Shen, Y.S.; Gao, B.; Yang, X.M.; Tao, S.J. Seismic damage mechanism and dynamic deformation characteristic analysis of mountain tunnel after Wenchuan earthquake. Eng. Geol. 2014, 180, 85–98. [Google Scholar] [CrossRef]
  15. Pai, L.F.; Wu, H.G. Experimental study on dynamic response of tunnel lining structure crossing landslide mass under earthquake. J. Rock Mech. Eng. 2022, 41, 979–994. [Google Scholar] [CrossRef]
  16. Liu, X.Y.; Zhang, C.Q.; Xiao, H.B.; Zhou, H.; Chi, F.D. Deformation and failure characteristics of a deeply buried tunnel subjected to creep slip fault movement: Based on the engineering conditions of Yunnan water intake project. Bull. Eng. Geol. Environ. 2022, 81, 322. [Google Scholar] [CrossRef]
  17. Jalayer, F.; Ebrahimian, H.; Miano, A.; Manfredi, G.; Sezen, H. Analytical fragility assessment using unscaled ground motion records. Earthq. Eng. Struct. Dyn. 2017, 46, 2639–2663. [Google Scholar] [CrossRef]
  18. Pan, J.C. Seismic Response Analysis and Seismic Isolation Research of Subway Shield Tunnel. Master’s Thesis, Anhui University of Technology, Hefei, China, 2019. Available online: https://kns.cnki.net/KCMS/detail/detail.aspx?dbname=CMFD202001&filename=1019093633.nh (accessed on 15 August 2022).
  19. Luo, B.S. Study on Deformation Law of Surrounding Rock in Construction of Shield Tunneling below Existing Line. Master’s Thesis, Dalian Jiaotong University, Dalian, China, 2018. Available online: https://kns.cnki.net/KCMS/detail/detail.aspx?dbname=CMFD201901&filename=1019019909.nh (accessed on 28 August 2022).
  20. GB 50011-2001; Code for Seismic Design of Buildings. 2001. Available online: https://max.book118.com/html/2020/0909/5321343214002342.shtm (accessed on 22 August 2022).
  21. GB 50111-2006; Code for Seismic Design of Railway Engineering. 2006. Available online: https://max.book118.com/html/2021/0219/8116064110003050.shtm (accessed on 24 August 2022).
  22. Wang, K.; Pan, H.; Zhang, T.; Wang, H.T. Experimental study on the radial vibration characteristics of a coal briquette in each stage of its life cycle under the action of CO2 gas explosion. Fuel 2022, 320, 123922. [Google Scholar] [CrossRef]
  23. Yue, C.Q. Seismic Response Analysis and Isolation Technology Research of Subsea Tunnel. Master’ Thesis, Lanzhou University of Technology, Lanzhou, China, 2013. Available online: https://kns.cnki.net/KCMS/detail/detail.aspx?dbname=CMFD201402&filename=1013251680.nh (accessed on 3 September 2022).
Figure 1. Overall numerical model of soil layer tunnel.
Sustainability 15 04185 g001
Figure 2. Schematic Diagram of Monitoring Points.
Sustainability 15 04185 g002
Figure 3. EW direction seismic wave waveform of EI_Centro.
Sustainability 15 04185 g003
Figure 4. Displacement deformation under static action.
Sustainability 15 04185 g004
Figure 5. Stress and Deformation under Static Action.
Sustainability 15 04185 g005
Figure 6. Vibration Mode Diagram of 8th Order Modal Analysis.
Sustainability 15 04185 g006aSustainability 15 04185 g006b
Figure 7. Time History Change of Stress at Monitoring Points.
Sustainability 15 04185 g007
Figure 8. Comparison of Y-direction Displacement Response.
Sustainability 15 04185 g008
Figure 9. Comparison of Peak Acceleration of Isolation Materials.
Sustainability 15 04185 g009
Table 1. Surrounding rock material parameters.
Material ScienceElastic Modulus
E (MPa)
Poisson’s Ratio
μ
Cohesion
C (kPa)
Internal Friction angle ψ (°)
Plain fill100.31028
Silty clay180.44718.8
Pebble soil900.23.838.5
Slate3000.2830030
Table 2. Parameters of lining and grouting materials.
NameElastic Modulus
E (GPa)
Poisson’s Ratio
μ
Thickness
(m)
Density
(Kg/m3)
Lining34.50.30.32450
Grouting layer0.20.250.152300
Table 3. Frequency and damping coefficient of the first three modes.
Mode Shape123
Frequency × 10−40.1770.2140.353
Damping coefficientAlpha = 0.015
Beta = 0.021
Alpha = 0.015
Beta = 0.021
Alpha = 0.015
Beta = 0.021
Table 4. Peak Acceleration at Monitoring Points.
PositionVaultRight Arch WaistRight WallRight CornerInverted ArchLeft Wall CornerLeft WallLeft Arch Waist
Number12345678
Minimum acceleration × 10−11 m/s−8.097−5.397−4.652−6.234−8.091−5.896−3.515−5.230
Maximum acceleration × 10−11 m/s7.4864.0512.7855.2766.5255.3093.1644.548
Table 5. Parameters of Isolation Materials.
Material ScienceElastic Modulus
E (MPa)
Poisson’s Ratio
μ
Density
(Kg/m3)
Cohesion
C (kPa)
Internal Friction Angle
Ψ (°)
Foam concrete270.00.2155750.015
Rubber2.50.4510000.66
Table 6. Stress Comparison of Isolation Materials.
PositionVaultRight Arch WaistRight WallRight CornerInverted ArchLeft Wall CornerLeft WallLeft Arch WaistReduction Rate of Right Arch Waist
Number12345678
Primary lining
×10−5 Pa
3.45513.7338.450−2.0297.848−3.414−8.5288.995——
Foam concrete
×10−5 Pa
3.7002.830−14.88631.38911.75413.56326.177−13.17079.4%
Rubber
×10−5 Pa
4.3733.236−14.02732.22411.36813.73326.506−12.96976.4%
Disclaimer/Publisher’s Note: The statements, opinions and data contained in all publications are solely those of the individual author(s) and contributor(s) and not of MDPI and/or the editor(s). MDPI and/or the editor(s) disclaim responsibility for any injury to people or property resulting from any ideas, methods, instructions or products referred to in the content.

