Abstract
Self-Compacting Concrete (SCC) is a special concrete that can flow easily across congested reinforcements. Also, it is easy to work with and does not segregate. The present investigation aims at the design and development of sustainable SCC with the employment of industrial by-products such as Fly Ash (FA), Ground Granulated Blast Furnace Slag (GGBFS), and Expanded Perlite Aggregate (EPA). Four SCC mixes were developed to attain a target strength of 30 MPa. Workability tests (slump flow, J-ring, and V-funnel tests) were performed following the EFNARC guidelines to ensure fresh SCC properties. Detailed experiments were conducted to evaluate the durability characteristics of the developed SCC, such as water absorption, sorptivity, acid attacks (sulphuric, nitric, sulphate, and chloride), the Rapid Chloride Penetration Test (RCPT), and finally, the elevated temperature test. Weight loss, strength loss, and physical observations of the acid and temperature effects of SCC mixes were evaluated. Also, the study focuses on the cost and sustainable index of SCC mixes and compares them with OPC mixes. From the experimental data analysis, it was observed that the developed SCC showed excellent physical and mechanical properties with a considerable reduction in cement content. SCC specimens with FA and EPA exhibit excellent acid and temperature resistance. Following the sustainable analysis, it was noted that SCC mixes reduce about 15–17.2% of carbon emissions compared to the OPC mix.
1. Introduction
Concrete has been one of the primary construction materials in the past decades. It is the primary building material because it has many unique properties, such as being strong and long-lasting. On the other hand, sustainable concrete materials are up-and-coming and are used a lot in the building industry now [1]. SCC is now regarded as a highly unique and sustainable material in construction technology. It is used to perform high-speed casting with ease and quality. Because of the increased powder content, which results in more paste volume, SCC plays an important role. Developing the mix using unprocessed waste products as Supplementary Cementitious Materials (SCM) can be considered a sustainable building material [2]. The use of industrial by-products in developing sustainable concrete is gaining attention due to its advantages. As a result, a high-quality SCC combination with appropriate strength and durability for civil infrastructure construction can be achieved [3].
SCC has outstanding flowability, passing, and filling properties. These inherent physical characteristics aid in reducing the time and cost involved. SCC can be created by combining SCM or Filler Materials (FM) from industrial waste products possessing cementitious properties [2,4]. Increased fine aggregate content with low clinker content utilising different SCMs such as Fly Ash (FA), Ground Granulated Blast Furnace Slag(GGBFS), Silica Fume (SF), Metakaolin (MK), and Limestone Filler (LSF) are contributing to SCC development [5]. This emphasises the importance of conducting extensive research on the evolution of SCC.
The conventional method for achieving an appropriate flow capacity limits the coarse filler particles and increases the fine filler particles. Low yield stress and viscosity are the key parameters to consider when optimising the workability of SCC to avoid aggregate separation during flow [6,7]. The physical characteristics must be investigated first, followed by the mechanical and durability characteristics. SCC flow and segregation resistance can be enhanced by adding Super Plasticizer (SP) and Viscosity Modifying Agent (VMA) [8]. The segregation can be controlled by adding the required VMA or increasing the powder content to suspend the aggregate within the binder region without disrupting the flow [9].
SCC performance is also affected by the fine aggregate to Coarse Aggregate (CA) ratio. It was found that increasing the fine aggregate content does not affect the mechanical and durability properties of SCC [10]. The SCC was incorporated with high-class FA, and SF as a binder replacement was studied to evaluate physical and mechanical characteristics. Flow test, J-ring, V-funnel viscosity, and hardened properties such as compressive strength and elastic modulus were considered. It was observed that adding mineral admixtures to SCC increases its workability and strength significantly [3,11]. Incorporating SF and ultra-fine GGBFS in SCC improved the compressive strength and decreased the concrete’s water absorption [12]. Moreover, the durability characteristics of SCC using industrial by-products were examined. The results showed that mixes incorporating siliceous fillers showed better water absorption performance and lower chloride penetration values than the reference specimen [13].
In marine environments, the RC structural elements are affected by chloride-induced corrosion, which affects the strength and service life of the structure. Similarly, aggressive exposures on concrete, such as sulphuric, nitric, sulphate, and chloride attacks, cause corrosion, spalling, and other problems. Because of this, chemical-resistant concrete is essential for advanced, high-performance concrete structures [14]. The addition of copper slag and palm oil ash improved SCC’s chloride and sulphate resistance compared to the reference specimen [15,16]. The production of coal-fired fly ash added to the SCC meets commercial siliceous filler standards and has been thoroughly tested for durability. The results showed that the non-conforming FA had lower sulphate ion and carbon depth penetration than commercial siliceous filler specimens [17]. It is found that more research is needed on developing SCC using industrial by-products, agricultural by-products, and hazardous waste [12].
Many investigations have been carried out to determine concrete’s mechanical properties and durability characteristics by utilising supplementary materials such as silica fume, fly ash, metakaolin, etc. However, few studies have been conducted on SCC’s workability and strength properties, which contain FA, GGBFS, and EPA. Detailed studies on the durability characteristics of SCC using SCM are limited. The effect of alkaline and acid attacks on sustainable SCC is limited. Also, a sustainable analysis and cost analysis of SCC specimens are presented in the study, which was not covered earlier in the past studies [18,19,20].
The infrastructure sector is growing by utilising conventional building materials for construction. Due to this, the construction industries are finding alternative sustainable materials to achieve high performance in strength and durability. The authors have attempted to utilise the waste materials to develop the SCC. The developed mix has satisfied the workability and strength criteria following the relevant guidelines. Fire accidents are common in buildings and structures; therefore, the concrete becomes severely damaged under temperature exposure. Conducting experiments with concrete under fire exposure is costly and risky. Authors have attempted to evaluate the performance of developed SCC under the effect of elevated temperature. In addition, some tests are considered to assess the durability performance of SCC.
The present investigation aims to focus on the durability properties of SCC. Many trials have been made to test SCC’s mix proportions and workability properties with mineral admixtures. Water absorption, sorptivity, and acid attack based on acids (nitric and sulphuric acid), salts (chloride and sulphuric), rapid chloride penetration test, and an elevated temperature test are performed. Physical observations, including weight loss, acid attack, and temperature effect on specimens, were also considered in this study.
2. Materials and Mix Proportion
2.1. Materials
2.1.1. Supplementary Cementitious Materials
A 53-grade Ordinary Portland Cement (OPC) meeting the specification of IS 12269 was employed to prepare the concrete samples [18]. Class-F FA and GGBFS are the two SCMs used in the study. FA was procured from Mettur Thermal Power in Tamil Nadu, India. Class-F FA undergoes a pozzolanic reaction with the lime (CaOH)2 formed by the hydration of cement. GGBFS is an industrial by-product obtained from a steel plant.
Expanded Perlite Aggregate (EPA) is a lightweight, porous material produced by siliceous volcanic rock. The appearance of EPA is white, expanding from five to twenty times its original volume. It offers various physical features for commercial applications, such as low bulk density, low thermal conductivity, and excellent heat resistance. For the development of SCC, the EPA can be used as a partial replacement for fine aggregate. Figure 1 shows the mineral admixtures used in the study. The oxide compositions of SCM and EPA are illustrated in Table 1.
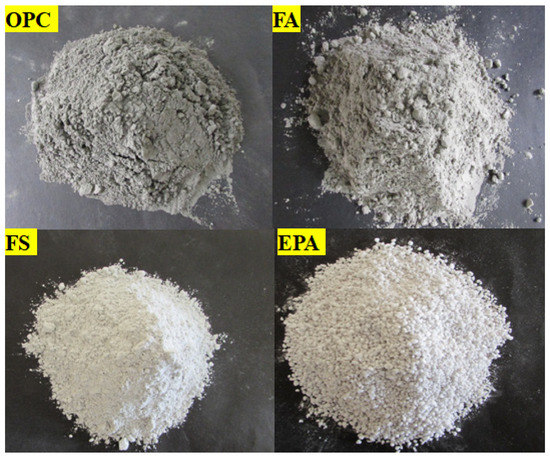
Figure 1.
View of mineral admixtures.

Table 1.
Oxide composition of SCM and EPA.
2.1.2. Filler Materials
Manufactured sand is a fine filler material with a particle size of less than 4.76 mm and lies in Zone II. The physical properties of manufactured sand were carried out as per BIS 383 [19]. Coarse aggregate uses crushed granite with a size of 12 mm and below-sized granite chips. The optimum level of EPA at 2.5% of manufactured sand content was partially used to replace manufactured sand. Table 2 shows the material properties of aggregates. Figure 2. Illustrates the sieve analysis of fine and coarse aggregate.
Table 2.
Physical properties aggregate.
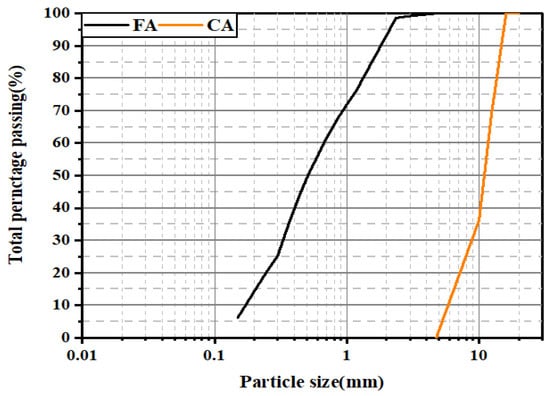
Figure 2.
Graded curve for fine and coarse aggregate.
SP (polycarboxylate ether) was employed to achieve an adequate fresh concrete flow property with low powder content. To resist particle segregation, a VMA was used. The specific gravity of SP was 1.08; potable water was used for developing SCC mixes; and the pH of the water was 6.0, respectively.
2.2. SCC Mix Proportioning
In this experimental study, an SCC with five mix proportions was developed. Permissible limits for the workability properties of trial mixes were carried out following the guidelines prescribed in their grading to adjust the proportions of blends to satisfy the allowable criteria. The control mixes were fixed at 59% OPC, 31% FA or GGBFS, and 0% EPA based on the results of the trial mixes. Following adjustments in mixture proportioning in trial mixes that met the EFNARC directives, the SCMs used in the combinations FA and GGBFS were quantified to the same level in the control mixes. The control mix was designated as FA and GGBFS. In the second phase, it was introduced to the mix to study the effect of EPA. It replaced 2.5% of the fine aggregate in the control mixes, which were designated as FA/EPA and GGBFS/EPA, considering the SCM used in the combination.
Each mix’s powder content (total cementitious material) was 464 kg/m3, and the coarse aggregate content was 804 kg/m3. In all combinations, the water–powder ratio was set at 0.42, with a water content of 218 kg/m3. The details involved in the mix proportion are illustrated in Table 3. During the first minute of mixing, coarse aggregate, fine aggregate, and EPA are thoroughly mixed in the mixer, followed by the binder materials. Initially, the dry materials were mixed for about 2 min to form a homogeneous mixture. Following that, 70% water was added to the SP dosage and sprinkled into the mix, and the entire content was allowed to rotate for 2 min, followed by a 2-minute rest. After which, the remaining portion of the water was added to the mixture, and thereby the whole process of mixing was completed by allowing the mixer drum to rotate for another 3 min. The freshly prepared SCC mixture was transferred to the steel mould to assess its performance under loading. To avoid water evaporation, the mould with the concrete was covered with polythene sheets for 24 h to initiate setting. After 24 h, the specimens were removed from the mould and transferred to the curing tank to begin the hydration reaction of the blend. The samples were cured in the curing tank for 28 days.
Table 3.
Mix proportioning of SCC.
2.3. Test Procedure
2.3.1. SCC Fresh Properties
The ability of SCC to fill and pass through densely packed formwork with reinforcement and resistance against segregation was evaluated through different test methods following EFNARC stipulations. The flowing ability was observed through slump flow and T500 tests. J-ring and V-funnel tests were conducted to assess the passing ability and viscosity of the concrete flow. The workability experiments of SCC are illustrated in Figure 3.
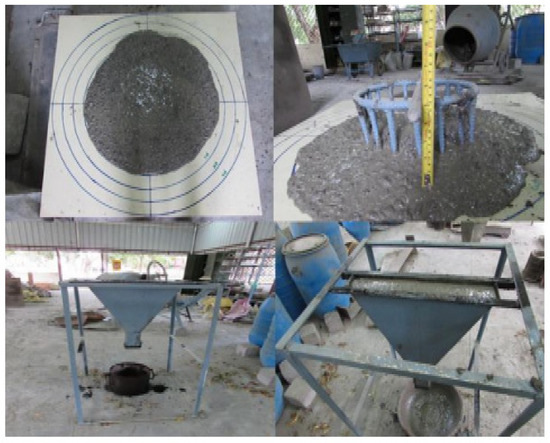
Figure 3.
View of workability tests of fresh SCC.
Slump flow, T500, and J-ring tests were performed using Abram’s or slump cone. In the slump flow test, the slump cone was lifted upward after being filled with freshly made SCC, and the spread of SCC was measured in two perpendicular directions. To achieve the concrete distance at 500 mm diameter, the flow duration of each mix is measured in the T500 slump flow test. The J-ring test, similar to the slump flow test, simulates concrete flowing through reinforcing bars and measures the height difference in concrete distributed at four locations. The flow rate of SCC was tested using the V-funnel test to determine its passing ability and viscosity. The categorisation of viscosity was established using an indirect technique following the EFNARC standards. Table 4 shows the workability test results obtained for several SCC blends. The concrete specimens were cast to the dimensions specified in the code and placed in a water tank for 28 days. After target curing, all concrete specimens were allowed to reach room temperature for 24 h before conducting the experiments.
Table 4.
Workability test results of fresh SCC.
2.3.2. SCC Durability Properties
The durability properties of SCC include compressive strength, water absorption, sorptivity, chemical attack (sulphuric acid, nitric acid, chloride salt, and sulphate salt), Rapid Chloride Penetration Test (RCPT), and elevated temperature tests. Detailed test procedures are described in Section 3.
3. Experimental Investigation
3.1. Compressive Strength
The compressive strength of concrete is essential in designing concrete elements. After curing, the compressive strength test was conducted by using Compression Testing Machine (CTM) at a loading rate of 14 MPa/min as per the specifications of IS 516 [20]. Figure 4 shows the compressive test of concrete.
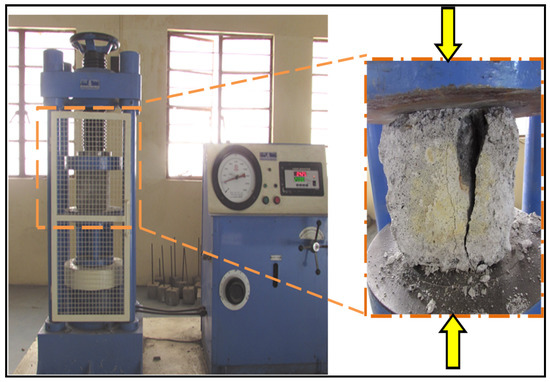
Figure 4.
Compressive test of SCC.
3.2. Water Absorption
The water absorption by the concrete is a preliminary experiment to understand the passage of water in the concrete structure. The water absorption test was carried out on cube specimens 150 mm × 150 mm × 150 mm in size. After the desired curing period, the samples were removed from the curing tank and placed in the oven to dry for 24 h at a temperature of 100 °C to 105 °C following IS 881-122,2011[lit]. The difference in mass before and after placing the samples in the furnace was noted, and the water absorption WA results were obtained by substituting the values in Equation (1).
where W1 = mass of the specimen (kg); W2 = mass of the oven-dried specimen (kg).
3.3. Sorptivity
The sorptivity test determined the rate at which capillary moisture rises across the SCC. The test was performed on cylindrical specimens 100 mm in diameter and 50 mm in height. The test was performed in line with ASTM C1585 (2004) [21]. The concrete specimen was baked for 24 h at 100 ± 10 °C, and the dry weight (W1) was recorded. The test sample was dipped into water at a depth of around 5 mm. The test setup for sorptivity is illustrated in Figure 5. The water-absorbed quantity of concrete was weighed at specific intervals for 120 min and noted down as W2. The weight difference caused by the water capillary rise was measured. Equation (2) was used to calculate the water sorptivity.
where I = ΔW/AD and ΔW = W2 − W1, W is the weight change; W1 is the mass of the saturated surface dry specimen; W2 is the mass of the oven-dried specimen; A is the specimen cross-sectional area; d is the density of water; t is the time (min); and S is the sorptivity (mm).
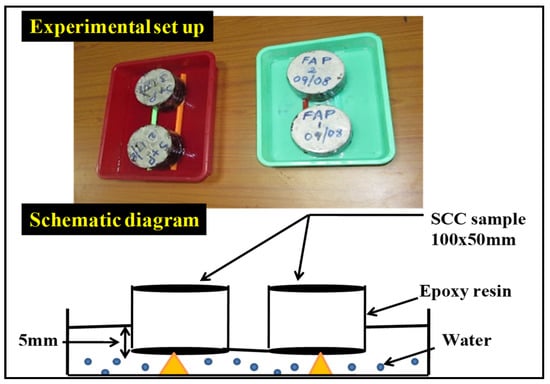
Figure 5.
View of sorptivity test setup of SCC.
3.4. Chemical Attacks (Chloride Attack, Sulphate Attack, Sulphuric Attack, and Nitric Attack)
The investigation aims to evaluate the SCC behaviour in acid and salt environments. And this experiment helps us understand the physical characteristics and strength properties of hazardous and marine environmental conditions. The experiment was carried out to evaluate the acid resistance of SCC specimens made with pozzolanic materials (FA and GGBFS). The acid attack test is executed using 150 mm × 150 mm specimens. One percent of a sulphuric acid (H2SO4) and nitric acid (HNO3) solution was prepared to immerse the specimens completely.
Similarly, the concrete cubes were soaked in a 3.5% sodium sulphate (Na2SO4) and sodium chloride solution (NaCl). The experiment lasted 90 days. The specimens are taken from the solutions at 28 and 56 days and adequately cleaned with a brush, and the appropriate weight values are recorded. Each specimen’s weight loss and residual compressive strength were recorded. Figure 6 shows the experimental view of an acid attack in concrete.
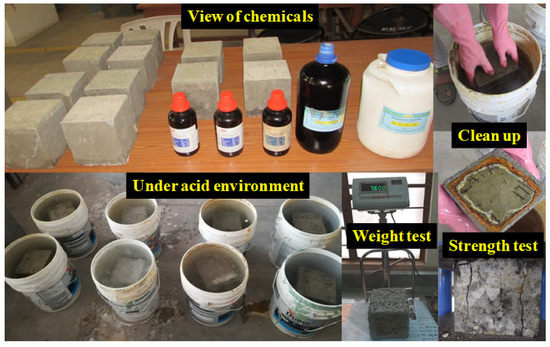
Figure 6.
View of the aggressive environment of SCC specimens.
3.5. RCPT (Rapid Chloride Permeability Test)
To evaluate the concrete’s chloride ion penetration, the RCPT was conducted following the guidelines of ASTM C1202 [22]. Concrete specimens are tested at 28, 56, and 90 days. Specimens are placed in the two plastic chambers and filled with the NaCl and NaOH solutions. One cell was filled with 3% NaCl solution to serve as a cathode, and the other with NaOH solution (0.3 N) to function as an anode, and terminal cables were connected to the data logger. A 60-volt current passes continuously, and the readings are monitored every 30 min to six hours. As a result of the electrical currents of coulombs, cathodic and anodic reactions were generated to pass the chloride ions in the concrete. The test setup for chloride penetration of concrete is shown in Figure 7. For evaluating the chloride ion penetration of concrete, the following formula is shown in Equation (3).
where Ic (Ic = I0 + I30 + … + I360) is the cumulative current readings at specific time intervals in mA.
Im = 900 × 2 × Ic
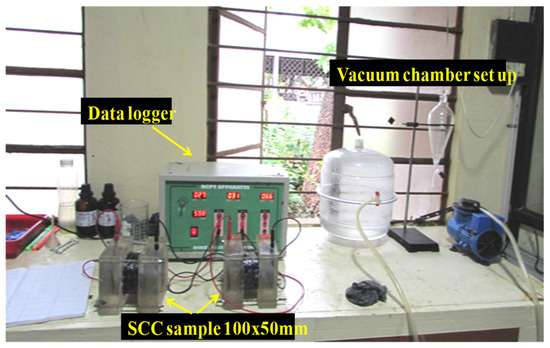
Figure 7.
Typical RCPT test setup view of SCC.
3.6. Elevated Temperature Test on SCC Specimens
The concrete specimens are heated in the research using an electrical furnace. The electric furnace has dimensions of 750 mm × 500 mm × 500 mm. All concrete specimens are placed in the furnace and heated following the ISO 834 guidelines [23]. A temperature of 1200 °C is the highest operating temperature of the furnace. The study considers four heating situations based on the ISO 834 fire curve as demonstrated in the time–temperature curve (Figure 8a. The test specimens were exposed for 30 min (821 °C), 60 min (925 °C), 90 min (986 °C), and 120 min (1029 °C)). After attaining the target temperature, the furnace automatically shuts down and allows the specimens to cool to ambient temperature, as illustrated in Figure 8b. The results include information on surface fractures, mass loss, and concrete residual strength.
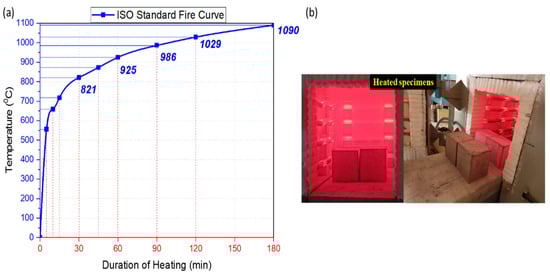
Figure 8.
(a) Time-temperature curve; (b) SCC specimens exposed to elevated temperature.
4. Experimental Results
4.1. Compressive Strength Test on SCC
Figure 9 depicts the compressive strength test results of all developed SCC mixtures tested at 7, 28, 56, and 90 days. The test findings revealed that the reference mix without EPA as a fine aggregate had a greater compressive strength CS than the mix with 2.5% EPA. And the SCC blend made with GGBFS achieves the greatest strength. It was approximately 24.03, 36.49, 37.59, and 38.89 MPa for the specimens tested at 7 and 28, 56, and 90 days, respectively. The SCC mix developed with GGBFS and 2.5% EPA had a minimal drop in the strength of around 11.53% compared to the specimen without EPA. The reference SCC mix with FA demonstrated a comparable strength gain as the SCC mix used by the GGBFS. It was about 17.15, 27.23, 34.55, and 35.36 MPa for the specimens examined at 7 days, 28 days, 56 days, and 90 days, respectively. Because of its size and shape, lightweight EPA concrete’s strength loss can be attributed to a weak adhesion between lightweight mineral aggregate and cement paste, a weak link in the Interfacial Transition Zone (ITZ). It may also affect the consistency of the mixture.
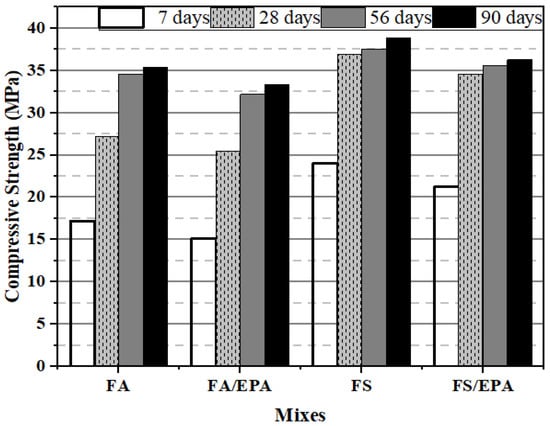
Figure 9.
Compressive strength of concrete by various SCC mixes.
Furthermore, because mineral and chemical admixtures slow the cement hydration process, early strength gain is delayed [24]. Again, the hydraulic cementitious nature of the natural pozzolan may be liable for the rate of strength development and the highest significant strength value achieved for the GGBFS-created mix. On the other hand, the varying SP content reduced the addition of high-water demand, reducing workability and strength metrics. As a result, the early age strength growth in the GGBFS-based SCC mix is more significant than in the FA-based SCC mix [25].
4.2. Water Absorption and Sorptivity
Figure 10a shows the water absorption (%) values of different SCC specimens tested at 28 and 90 days. The percentage of water absorption for SCC (GGBFS) specimens offers better resistance to moisture penetration; it is 1.9% and 1.4% at 28 and 90 days, respectively. In the case of SCC (GGBFS/EPA) specimens, the percentage of water absorption was 2.25% and 2.05%, respectively, at 28 and 90 days. The water absorption rate in GGBFS-SCC specimens is limited due to their dense structure and low porosity [26]. The water penetration was slightly increased due to the inclusion of lightweight EPA content. The FA-SCC and FA/EPA-SCC specimens showed comparatively higher water absorption values of about 2.6% and 2.9% in the observation made over 28 days. The absorption rate improved slightly at 90 days, similar to the trend in the GGBFS specimen, which was 2.3% and 2.6% for FA-SCC and FA/EPA-SCC specimens, respectively. The water absorption percentage in the FA and FA/EPA-SCC specimens was higher than that of the GGBFS specimens [27]. Water absorption decreased as the testing age of SCC increased. This is attributed to the lower rate of pozzolanic reactivity of SCMs at the age of curing. The percentage of water absorption from capillary rise is minimal in all the test specimens. From the findings, it has been confirmed that the capillary rise of water significantly decreased after 28 days of immersion as per IS 1881-Part 5, and the water absorption value of concrete was restricted to less than 3%. In the present study, the percentage of water absorbed by the GGBFS-SCC was lower when compared with the SCC containing FA. This is due to the enhanced pozzolanic reaction and improved microstructural characteristics of SCC, resulting in better durability.
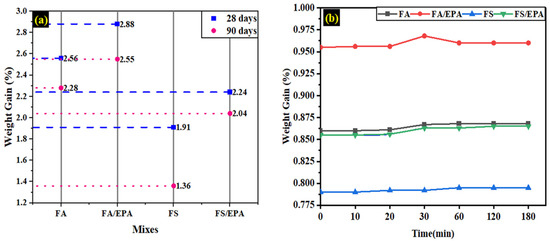
Figure 10.
(a) Water absorption (%) values for SCC specimens for 28 and 90 days; (b) Sorptivity values of SCC specimens.
The sorptivity (surface moisture absorption) of FA and GGBFS-SCC specimens is shown in Figure 10b. The maximum sorptivity for FA, FA/EPA, GGBFS, and GGBFS/EPA specimens are 0.79, 0.87, 0.96, and 0.87, respectively, and it is noted at the time duration of 30 min. The GGBFS-SCC specimens exhibited slightly higher sorptivity than FA-SCC specimens, but the difference was marginal [28]. The result revealed that all the SCC mixes had lower water sorptivity values as time passed. It was due to the denser structure of concrete with fewer pore voids.
4.3. Sulphuric and Nitric Acid Test
The acid (H2SO4 and HNO3) resistance tests revealed that maximum weight loss was observed in SCC tested at 90 days. Weight loss and the residual compressive strength CS corresponding to the H2SO4 and HNO3 acid tests carried out at 28 and 90 days have been plotted in Figure 11a,b. The maximum weight loss was observed for the H2SO4 acid test carried out at 90 days for FA and GGBFS-SCC specimens (FA, FA/EPA, GGBFS, and GGBFS/EPA). The tested weight loss values are 19.0%, 23.7%, 14.9%, and 17.7%, respectively. Similar variation is noted in the residual compressive strength, which are 20.1% (FA), 9.3% (FA/EPA), 27.4% (GGBFS), and 17.14% (GGBFS/EPA). In general, it can be stated that the higher the weight loss, the more significant the loss in strength. In the case of the HNO3 acid test carried out at 90 days, the evaluated weight loss values are 5.8%, 6.8%, 3.3%, and 4.6% for FA, FA/EPA, GGBFS, and GGBFS/EPA, respectively. The corresponding residual strength values are 51.5%, 40.0%, 54.3%, and 49.0%, respectively.
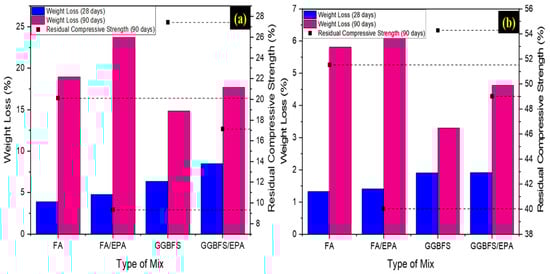
Figure 11.
Weight loss (%) and residual compressive strength of SCC specimens after 28 and 90 days (a) H2SO4 acid test; (b) HNO3 acid test.
The results revealed that the concrete specimens had pores, high voids, and Internal decomposition, which led to high mass loss and strength loss due to the high concentration of acid solutions. The case of FA/EPA shows higher weight loss due to the addition of lightweight, but the variation is considered minimal and was noted as less than 5% in all the cases. However, the strength loss is less when compared with other SCC specimens. The strength resistance is due to the highly dense structure of FA and mineral pozzolan in the concrete, which results in less concrete decomposition. The chemical reaction inside the concrete structure between sulphuric and nitric acids is shown in Equations (4)–(6).
Ca (OH)2 + H2SO4 = CaSO4·2H2O
CaSiO2·2H2O + H2SO4 = CaSO4 + Si(OH)4 + H2O
3CaO·Al2O3·12H2O + 3(CaSO4·2H2O) + 14H2 = 3CaO·Al2O3·3CaSO4·32 H2O
Specimens affected by sulphuric acid exhibited higher mass loss and weight loss when compared to nitric acid specimens. It is mainly due to sulphuric ions’ chemical concentration and dissolution effect, leading to structural deterioration. Similar observations are reported by Mathews et al. [29].
4.4. Sulphate and Chloride Attack Test
The weight and residual compressive strength variations in SCC specimens subjected to sulphate (Na2SO4) and chloride (NaCl) attacks are shown in Figure 12a,b, respectively. In all the cases, the weight gain and the corresponding residual compressive strength recorded after 90 days were marginal and were less than 1.5% and 90.3%, respectively. The absorption value should be less than 3%, according to IS 1881-Part 5, and the developed SCC mixes are less permeable to sulphate and chloride intrusion [14]. The maximal weight loss value was found for the Na2SO4 attack test carried out in 90 days for FA and GGBFS-SCC specimens (FA, FA/EPA, GGBFS, and GGBFS/EPA) at 0.68%, 0.56%, 0.81%, and 0.68%, respectively. A similar variance was noticed in the residual compressive strength, which was 91.4% (FA), 91.7% (FA/EPA), 90.7% (GGBFS), and 90.8% (GGBFS/EPA). In the case of the NaCl attack test carried out in 90 days, the weight loss was 0.87%, 0.71%, 1.14%, and 1.08%, respectively, for FA, FA/EPA, GGBFS, and GGBFS/EPA specimens. The reported residual strength values are 92.1%, 92.4%, 92.3%, and 91.5%, respectively.
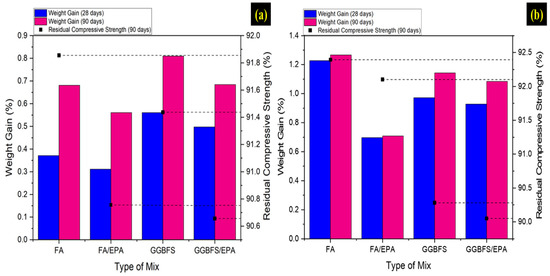
Figure 12.
Weight loss (%) and residual compressive strength of SCC specimens after 28 and 90 days (a) Na2SO4 test; (b) NaCl test.
From the test results, it was necessary to note that the chloride and sulphate attack specimen exhibits minor strength loss and mass loss compared to acid attack specimens. SCC with mineral admixture specimens was found to be reasonable under sulphate and chloride; however, the SCC at sulphuric and nitric acid environments exhibits poor performance [3].
4.5. RCPT (Rapid Chloride Permeability Test)
The non-steady-state chloride migration coefficient can be calculated using the electrical potential between chloride penetration depth and time. The RCPT results for FA and GGBFS-SCC specimens are plotted in Figure 13. It was noticed that the SCC-blend FA had a substantially greater chloride migration ability than combinations with GGBFS. The RCPT value clearly shows a lower chloride penetration into the structure of all the SCC specimens (i.e., Im < 2000 current in coulombs). The inclusion of EPA in the SCC mixture was less effective, as a slight increase in chloride penetration was noticed. The formation of a secondary CSH gel when SCMs (FA and GGBFS) are mixed with the hydration reaction product and its alumina content may explain the significant decrease in chloride ion penetration [29]. The pozzolanic activity supplied by FA and GGBFS considerably improves SCC’s ability to resist chloride ion penetration. Overall, it can be claimed that the SCC matrix has a better pore microstructure.
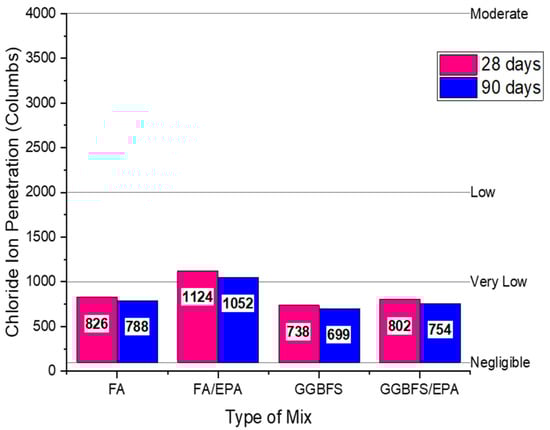
Figure 13.
Chloride ion penetration of FA and GGBFS -SCC specimens at 28 and 90 days.
4.6. Compressive Strength and Mass Loss of SCC Exposed to Elevated Temperatures
4.6.1. Residual Compressive Strength of SCC
Figure 14 depicts the residual cube compressive strength and mass loss of several SCC specimens at various heating periods. The residual compressive strength of SCC specimens treated to extreme temperatures may be categorised into stages based on strength and exposure length change. FA/EPA, FA, GGBFS/EPA, and GGBFS SCC specimens show strength improvements in the first phase (0 to 30 min), ranging between 12% and 26%. The autoclave, which produces secondary hydration among the un-hydrated clinker, may be responsible for the observed strength rise in this phase. The decline in strength becomes more pronounced when the temperature is raised over 30 to 120 min. The highest loss in strength was found for SCC specimens (FA/EPA, FA, GGBFS/EPA, and GGBFS) at 60 min (925 °C) and a more considerable loss of nearly 63% for 120 min (1029 °C).
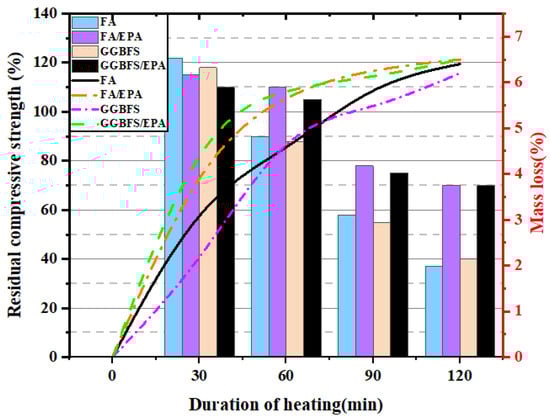
Figure 14.
Interaction graph displaying the residual compressive strength fluctuation and SCC specimens’ mass loss over time.
4.6.2. Mass Loss
The first loss of mass in SCC may be caused by transforming free water and physically bound water into vapour pressure at high temperatures [30]. It can happen during the fast-heating phase, which might last up to 60 min. The mass loss for FA and GGBFS specimens (FA/EPA, FA, GGBFS/EPA, and GGBFS/CPP) was determined to be 5.70%, 4.80%, 5.60%, and 4.60%, respectively. A proportionate rise in mass loss is observed as the temperature level and duration exceed 60 to 120 min. It might be linked to the degradation of gel structure (CSH) and portlandite (CH), resulting in a more significant loss of strength [31].
4.7. Physical Observations (Chemical Attack on Specimens)
Figure 15 shows the surface changes in SCC specimens subjected to a chemical environment. The surface layer specimens were slightly affected by the sulfuric and nitric acids after 28 days of exposure. No surface damage was observed for sulphate and sodium chloride solutions. After 56 days, all acid and salt specimens’ surface texture has turned to degradation, and it looks similar to the discolouration of quartz sandstones. After 90 days of exposure, the sulphuric and nitric acid specimens show that the four sides of the concrete specimens are entirely eroded and visualised as coarse sedimentary stones, leading to higher strength loss and weight loss of concrete [3].
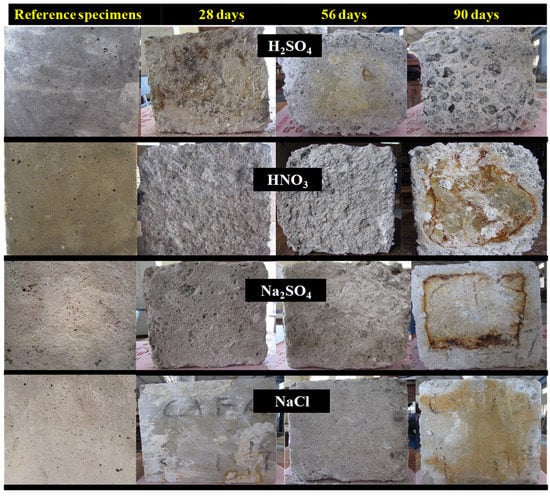
Figure 15.
Images of SCC specimens exposed to chemicals for 28 days, 56 days, and 90 days.
Similarly, when exposed to sulphate or sodium sulphate, the surface colour changes to a light corroded colour, and the cementitious layer shows signs of degradation. The visual analysis found that, while increasing the exposure days (28, 56, and 90), the degradation of the concrete surface, extreme surface damages, and mass loss were observed for all the SCC mixes. The performance of mix-1 and mix-3 in acid and salt environments is better when compared to mix-2 and mix-4.
5. Sustainable Approach
5.1. Cost Analysis
Construction industries have taken the initiative to utilise waste and by-product materials from the industries. And it leads to the global advantage of controlling the limits of land filing, production of CO2, and exhaustion of natural resources. Therefore, using waste materials in concrete not only provides environmental benefits but also leads to cost efficiency [32]. In the present study, FA, GGBFS, and EPA waste and by-product are used and developed in the four SCC mixes, leading to economic benefits. Table 5 shows the cost comparison of materials used in SCC to produce 1 m3. Materials used are obtained from the local market, and the presently available material cost is considered from the suppliers and represented in USD. The total cost efficiency is calculated based on the cost-to-compressive strength ratio [33]. The cost of SCC is compassion made with the Ordinary Portland Cement (OPC). OPC’s material details and strength are evaluated from IS 10262 [34].
Table 5.
Material cost comparison of SCC and OPC mixes per meter cube.
The cost of SCC FA, FA/EPA, GGBFS, GGBFS/EPA, and OPC was estimated at 0.71, 0.67, 0.64, 0.62, and 0.54 MPa/USD/m3. The target compressive strength of SCC mixes shows 30 MPa, which is above, and the cost of all SCC mixes is in the same range. SCC FA mix exhibits 10–12% higher cost efficiency than other SCC mixes. However, the OPC mix shows higher cost efficiency at 0.54 MPa/USD/m3. The OPC mix indicates lower cost efficiency, about 23.9%, than SCC mixes. It is due to the cement of the concrete. Therefore, it is remarkable to note that the higher advantage of developing high-performance concrete by incorporating FA, GGBFS, and EPA leads to higher strength, durability, and cost.
5.2. Energy Efficiency
Concrete production necessitates a significant amount of energy. The energy consumption begins with the concrete ingredients and continues through the concrete development process. The energy required to produce one cubic meter of concrete was high due to the material components, the source of components such as FA (fly ash), SF (silica fume), GGBFS (ground granulated blast furnace slag), OPC (ordinary Portland cement), and metakaolin, aggregates, admixtures, and curing of the concrete. The value of energy is also considered when gathering materials, milling, and grinding. Alsalman et al. [35] investigated material energy consumption. One metric ton of OPC, FA, SF, and EPA requires 0.84, 0.004, 0.052, and 0.1 GJ/t of energy, respectively. Concrete production necessitates a large amount of fine and coarse aggregate. As a result, one metric ton of fine and coarse aggregates requires 0.081 and 0.083 GJ/t of energy, respectively. The total energy efficiency analysis of SCC and OPC is shown in Figure 16. FA-1.59 GJ/m3, FA/EPA-1.60 GJ/m3, GGBFS-1.71 GJ/m3, GGBFS/EPA-1.61 GJ/m3, and OPC-1.88 GJ/m3 are the estimated energy requirements for SCC and OPC mixes. According to the results of the preceding analysis, SCC mixes consumed less energy than OPC.
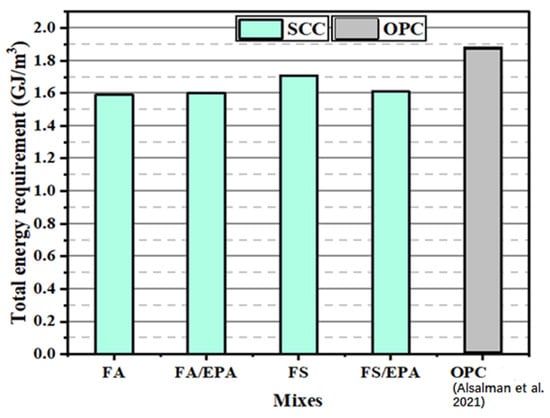
Figure 16.
Energy efficiency of SCC and OPC mixes [35].
5.3. CO2 Emission Efficiency
The production of OPC necessitates a significant amount of energy in the form of coal firing, the use of petroleum products, electricity, and so on [36]. The production of concrete ingredients causes a high volume of CO2 in the environment. According to Hills et al., producing one ton of OPC releases 0.72 to 0.84 t-CO2/t [37]. Meanwhile, fine and coarse aggregates require less energy and emit less CO2 when compared to other concrete ingredients. The CO2 emission of concrete was determined in this study for 1 m3 of concrete. David and Jay’s [36] previous studies are used to evaluate the CO2 efficiency factors. Figure 17 depicts an analysis of CO2 emissions from SCC and OPC. One metric ton of FA, FA/EPA, GGBFS, and GGBFS/EPA emits 1.59 t-CO2/m3, 1.60 t-CO2/m3, 1.71 t-CO2/m3, 1.61 t-CO2/m3, and 1.88 t-CO2/m3. According to the above analysis, all SCC mixes reduce carbon emissions by about 15–17.2% compared to OPC mixes [35].
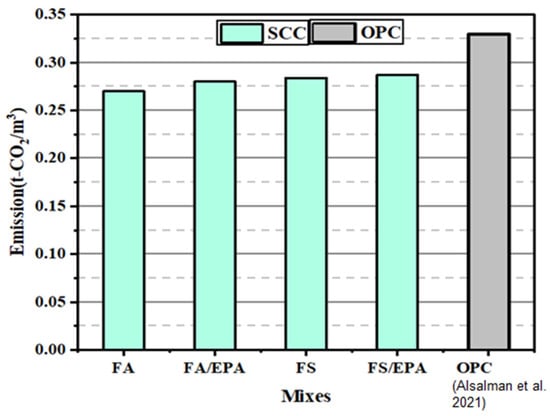
Figure 17.
Carbon emission assessment of SCC and OPC mixes [35].
6. Conclusions
The following findings are obtained from the experimental investigation:
- The Ground Granulated Blast Furnace Slag (GGBFS) specimen exhibits higher compressive strength than the reference, Fly Ash (FA), and Expanded Perlite Aggregate (EPA) specimens. Furthermore, when the curing age increases, Self-Compacting Concrete (SCC) strength property rises dramatically. As a result, the early-age strength increase is higher in the GGBFS-based SCC mix than in the FA-based SCC mix. The water absorption and sorptivity results found that the surface moisture absorption of SCC with GGBFS exhibits slightly higher values than other specimens (FA, FA/EPA, and GGBFS/EPA).
- Both H2SO4 and HNO3 acids highly affect the weight and strength properties of all SCC specimens. From the experimental results, it is found that the residual compressive strength of H2SO4 concrete specimens is 20.1% (FA), 9.3% (FA/EPA), 27.4% (GGBFS), and 17.14% (GGBFS/EPA). Similar variation was noted in the nitric attack specimens, and the residual compressive strength values are 51.5% (FA), 40% (FA/EPA), 54% (GGBFS), and 49% (GGBFS/EPA), respectively.
- All SCC specimens with chloride penetration perform better for up to 90 days. It was due to the chloride ions being significantly enhanced by the pozzolanic activity provided by FA and GGBFS.
- The same SCC specimen exhibits a more significant mass loss reduction in strength at 60 and 120 min of exposure to fire, such as 16–63% for (FA/EPA, FA, GGBFS/EPA, and GGBFS).
- Based on the sustainable analysis, SCC’s cost, CO2, and energy efficiency were significantly less than the Ordinary Portland Cement (OPC) mix. Therefore, the developed SCC is highly recommended for the cast in-site and precast construction without any economic and environmental effects.
Therefore, introducing waste materials to manufacture concrete is essential to substantially reduce the vulnerable effect of waste on the environment and humanity. From this point of view, the current study strongly suggests having long-term goals and making concrete from green materials that last a long time.
Author Contributions
M.E.M., T.K., A.N., M.A.: Methodology, Formal analysis, Writing—original draft. M.E.M., T.K., A.N., M.A., B.K., D.A.: Experimental investigation. M.E.M., T.K., A.N., B.K., D.A.: Review and Editing. All authors have read and agreed to the published version of the manuscript.
Funding
This research received no external funding.
Data Availability Statement
Not applicable.
Conflicts of Interest
The authors declare no conflict of interest.
References
- Kanagaraj, B.; Kiran, T.; Anand, N.; Al Jabri, K.; Justin, S. Development and Strength Assessment of Eco-Friendly Geopolymer Concrete Made with Natural and Recycled Aggregates. Constr. Innov. 2022. [Google Scholar] [CrossRef]
- Ealiyas Mathews, M.; Anand, N.; Prince Arulraj, G.; Kiran, T. Rheological and Mechanical Characterization of Self-Compacting Concrete with Utilization of Supplementary Sustainable Cementitious Materials. In IOP Conference Series: Earth and Environmental Science; IOP Publishing: Bristol, UK, 2020; Volume 491. [Google Scholar]
- Kiran, T.; Mathews, M.E.; Anand, N.; Alengaram, U.J.; Andrushia, A.D. Influence of Mineral Admixtures on the Residual Mechanical Properties and Durability Characteristics of Self-Compacting Concrete Subjected to High Temperature. Aust. J. Civ. Eng. 2021, 20, 244–260. [Google Scholar] [CrossRef]
- Nandhini, K.; Ponmalar, V. Effect of Blending Micro and Nano Silica on the Mechanical and Durability Properties of Self-Compacting Concrete. Silicon 2021, 13, 687–695. [Google Scholar] [CrossRef]
- Anand, N.; Arulraj, G.P. Effect of Grade of Concrete on the Performance of Self-Compacting Concrete Beams Subjected to Elevated Temperatures. Fire Technol. 2014, 50, 1269–1284. [Google Scholar] [CrossRef]
- Antony Godwin, I.; Anand, N.; Prince Arulraj, G.; Aravindhan, C. Influence of Mineral Admixture on Stress Strain Behaviour of Self Compacting Concrete under Elevated Temperature. Indian J. Sci. Technol. 2016, 9, 6. [Google Scholar] [CrossRef]
- Mohammed, A.M.; Asaad, D.S.; Al-Hadithi, A.I. Experimental and Statistical Evaluation of Rheological Properties of Self-Compacting Concrete Containing Fly Ash and Ground Granulated Blast Furnace Slag. J. King Saud Univ. Eng. Sci. 2022, 34, 388–397. [Google Scholar] [CrossRef]
- Ma, B.; Wang, H. Rheological Properties of Self-Compacting Concrete Paste Containing Chemical Admixtures. J. Wuhan Univ. Technol. Mater. Sci. Ed. 2013, 28, 291–297. [Google Scholar] [CrossRef]
- Mathews, M.E.; Anand, N.; Lublóy, É.; Kiran, T. Effect of Elevated Temperature on Interfacial Shear Transfer Capacity of Self-Compacting Concrete. Case Stud. Constr. Mater. 2021, 15, e00753. [Google Scholar] [CrossRef]
- Kwan, A.K.H.; Ling, S.K. Lowering Paste Volume of SCC through Aggregate Proportioning to Reduce Carbon Footprint. Constr. Build. Mater. 2015, 93, 584–594. [Google Scholar] [CrossRef]
- Dinakar, P.; Babu, K.G.; Santhanam, M. Durability Properties of High Volume Fly Ash Self Compacting Concretes. Cem. Concr. Compos. 2008, 30, 880–886. [Google Scholar] [CrossRef]
- Mohan, A.; Mini, K.M. Strength and Durability Studies of SCC Incorporating Silica Fume and Ultra Fine GGBS. Constr. Build. Mater. 2018, 171, 919–928. [Google Scholar] [CrossRef]
- Esquinas, A.R.; Motos-Pérez, D.; Jiménez, M.E.; Ramos, C.; Jiménez, J.R.; Fernández, J.M. Mechanical and Durability Behaviour of Self-Compacting Concretes for Application in the Manufacture of Hazardous Waste Containers. Constr. Build. Mater. 2018, 168, 442–458. [Google Scholar] [CrossRef]
- Kiran, T.; Anand, N.; Nitish Kumar, S.; Andrushia, D.; Singh, S.K.; Arulraj, P. Influence of Nano-Cementitious Materials on Improving the Corrosion Resistance and Microstructure Characteristics of Concrete. J. Adhes. Sci. Technol. 2021, 35, 1995–2022. [Google Scholar] [CrossRef]
- Sharma, R.; Khan, R.A. Durability Assessment of Self Compacting Concrete Incorporating Copper Slag as Fine Aggregates. Constr. Build. Mater. 2017, 155, 617–629. [Google Scholar] [CrossRef]
- Kanadasan, J.; Abdul Razak, H. Engineering and Sustainability Performance of Self-Compacting Palm Oil Mill Incinerated Waste Concrete. J. Clean. Prod. 2015, 89, 78–86. [Google Scholar] [CrossRef]
- Esquinas, A.R.; Álvarez, J.I.; Jiménez, J.R.; Fernández, J.M. Durability of Self-Compacting Concrete Made from Non-Conforming Fly Ash from Coal-Fired Power Plants. Constr. Build. Mater. 2018, 189, 993–1006. [Google Scholar] [CrossRef]
- IS:12269-2013; Ordinary Portland Cement, 53 Grade Specification (First Revision). Bureau of Indian Standards: New Delhi, India, 2013.
- IS 383:1970; Specification for Coarse and Fine Aggregates from Natural Sources for Concrete. Bureau of Indian Standards: New Delhi, India, 1970.
- IS 516:2014; Method of Tests for Strength of Concrete. Bureau of Indian Standards: New Delhi, India, 2004.
- ASTM C1585-04; Standard Test Method for Measurement of Rate of Absorption of Water by Hydraulic-Cement Concretes. American Society for Testing and Materials International: West Conshohocken, PA, USA, 2004; Volume i, pp. 1–6.
- ASTM C1202; Standard Test Method for Electrical Indication of Concrete’s Ability to Resist Chloride Ion Penetration. American society for Testing and Materials International: West Conshohocken, PA, USA, 2012.
- ISO 834-1999; Fire Resistance Tests—Elements of Building Construction. International Organization for Standardization: Geneva, Switzerland, 1999; Volume 1999, p. 53.
- Dinakar, P.; Kartik Reddy, M.; Sharma, M. Behaviour of Self Compacting Concrete Using Portland Pozzolana Cement with Different Levels of Fly Ash. Mater. Des. 2013, 46, 609–616. [Google Scholar] [CrossRef]
- Amin, M.N.; Javed, M.F.; Khan, K.; Shalabi, F.I.; Qadir, M.G. Modeling Compressive Strength of Eco-Friendly Volcanic Ash Mortar Using Artificial Neural Networking. Symmetry 2021, 13, 2009. [Google Scholar] [CrossRef]
- El Mir, A.; Nehme, S.G. Utilization of Industrial Waste Perlite Powder in Self-Compacting Concrete. J. Clean. Prod. 2017, 156, 507–517. [Google Scholar] [CrossRef]
- Nuruzzaman, M.; Kuri, J.C.; Sarker, P.K. Strength, Permeability and Microstructure of Self-Compacting Concrete with the Dual Use of Ferronickel Slag as Fine Aggregate and Supplementary Binder. Constr. Build. Mater. 2022, 318, 125927. [Google Scholar] [CrossRef]
- Islam, G.M.S.; Akter, S.; Reza, T.B. Sustainable High-Performance, Self-Compacting Concrete Using Ladle Slag. Clean. Eng. Technol. 2022, 7, 100439. [Google Scholar] [CrossRef]
- Mathews, M.E.; Kiran, T.; Hasa Naidu, V.C.; Jeyakumar, G.; Anand, N. Effect of High-Temperature on the Mechanical and Durability Behaviour of Concrete. Mater. Today Proc. 2020, 42, 718–725. [Google Scholar] [CrossRef]
- Nazari, A.; Riahi, S. Effects of Al2O3 Nanoparticles on Properties of Self Compacting Concrete with Ground Granulated Blast Furnace Slag (GGBFS) as Binder. Sci. China Technol. Sci. 2011, 54, 2327–2338. [Google Scholar] [CrossRef]
- Sharma, R.; Khan, R.A. Influence of Copper Slag and Metakaolin on the Durability of Self Compacting Concrete. J. Clean. Prod. 2018, 171, 1171–1186. [Google Scholar] [CrossRef]
- Sandhu, R.K.; Siddique, R. Properties of Sustainable Self-Compacting Concrete Made with Rice Husk Ash. Eur. J. Environ. Civ. Eng. 2022, 26, 6670–6694. [Google Scholar] [CrossRef]
- Mathews, M.E.; Anand, N.; Kodur, V.K.R.; Arulraj, G.P. Investigation on Bond Strength of Self-Compacting Concrete Exposed to Elevated Temperature. Proc. Inst. Civ. Eng.—Struct. Build. 2021, 174, 804–821. [Google Scholar] [CrossRef]
- IS 10262; Concrete Mix Proportioning—Guidelines. Bureau of Indian Standards: New Delhi, India, 2009.
- Alsalman, A.; Assi, L.N.; Kareem, R.S.; Carter, K.; Ziehl, P. Energy and CO2 Emission Assessments of Alkali-Activated Concrete and Ordinary Portland Cement Concrete: A Comparative Analysis of Different Grades of Concrete. Clean. Environ. Syst. 2021, 3, 100047. [Google Scholar] [CrossRef]
- Flower, D.J.M.; Sanjayan, J.G. Green House Gas Emissions due to Concrete Manufacture. Int. J. Life Cycle Assess. 2007, 12, 282–288. [Google Scholar] [CrossRef]
- Hills, T.; Florin, N.; Fennell, P.S. Decarbonising the Cement Sector: A Bottom-up Model for Optimising Carbon Capture Application in the UK. J. Clean. Prod. 2016, 139, 1351–1361. [Google Scholar] [CrossRef]


Disclaimer/Publisher’s Note: The statements, opinions and data contained in all publications are solely those of the individual author(s) and contributor(s) and not of MDPI and/or the editor(s). MDPI and/or the editor(s) disclaim responsibility for any injury to people or property resulting from any ideas, methods, instructions or products referred to in the content. |
© 2023 by the authors. Licensee MDPI, Basel, Switzerland. This article is an open access article distributed under the terms and conditions of the Creative Commons Attribution (CC BY) license (https://creativecommons.org/licenses/by/4.0/).