Abstract
The development of the financial industry directly affects the sustainable competitiveness of a city and even an economic region, and the development of urban finance helps to enhance the sustainable competitiveness of a city. This paper firstly reviews the relevant theories of sustainable urban competitiveness and explains the impact mechanism of financial development on sustainable urban competitiveness in developing regions. It then draws on the data of 17 prefecture-level cities in Central China from 2006 to 2020. It uses quantitative research methods, such as principal component analysis and regression analysis, to analyse and study the factors of financial development that influence sustainable urban competitiveness, thus realising the research purpose of enhancing sustainable urban competitiveness. After an in-depth analysis, the paper draws the following conclusions: (1) financial development is conducive to improving the sustainable competitiveness of a city in developing regions; and (2) the local government should focus not only on expanding the scale of financial development, but also on the quality of financial development, adjusting the financial structure, improving financial efficiency, and actively promoting the opening of financial markets and innovation of financial products.
1. Introduction
In modern economies, the relationship between sustainable urban competitiveness and financial activities is growing closer, and the role of finance in urban economic development is becoming increasingly apparent. The historical development and experience of developed countries show that the continuous accumulation of financial resources and related elements in regional cities can promote the constant, iterative evolution of the financial economy; reduce the transaction costs of the financial resource market; improve the efficiency of urban financial resource allocation; and help to achieve a positive cycle of investment and consumption. The development of the financial industry directly affects the sustainable competitiveness of cities and even the competitiveness of the economic zones that radiate from them, which helps to realise the sustainable development of cities by expanding the scale of urban economic activities, enhancing the effects of economies of scale, and reducing transaction costs. Some of the efforts undertaken to improve the competitiveness of cities are to promote financial development, enhance the ability of financial services in the real economy, and promote financial system reform. Therefore, studying the relationship between financial development and sustainable urban competitiveness is of great theoretical and practical significance.
The concept of “urban competitiveness” originated from the study of enterprise management. With the gradual improvement of urban functions, the concept of urban competitiveness emerged. In the 1980s, academic circles began to conduct in-depth research on the connotations and extensions, characteristics, models, and evaluation methods of urban competitiveness. Guo Hong constructed a target system for evaluating the competitiveness of China’s national central cities and applied principal component analysis to assess and rank the competitiveness of central cities [1]. Miao Jing used factor analysis to calculate the factor scores of each city from five perspectives: economic strength, social development, culture and health, environmental conditions, and innovations in science and technology [2]. Zhou Junyu et al. designed an evaluation index system of financial development competitiveness by drawing on relevant research on financial development at home and abroad. Using 11 cities in Hebei Province as research objects, they used factor analysis, cluster analysis, and the entropy method to measure and evaluate the financial development competitiveness of 11 sub-cities in the province [3]. Wu Shaohua et al. constructed a sustainable urban competitiveness evaluation model from the perspective of sustainable development and carried out empirical research on 51 cities in Western China [4]. Based on China’s digital financial development characteristics, Xiuxiu Jiang et al. used an econometric panel model, intermediary effect model, and instrumental variable method to evaluate the annual data of 30 provinces in China from 2011 to 2018. They found that the development of digital finance promotes economic growth through entrepreneurial channels, and the role of digital finance in fostering economic growth is more apparent in the process of accelerated urbanisation [5]. Zaineb Hlioui et al. found that credit constraints significantly impact urban market competitiveness and technological innovation for maintaining sustainable development [6]. Hossein Komasi et al. combined qualitative and quantitative research methods to study the sustainable urban competitiveness of Kermanshah, Iran. They drew on 11 indicators: local planning, urban management, space security, agricultural development, tourism, and sustainable income sources [7,8,9,10,11,12,13,14,15]. Hu Yiqun et al. used China’s urban panel data from 2011 to 2019 to explore the impact mechanism of digital finance and environmental regulation on the ability of cities to innovate green technology. It was found that convenient financing channels and strong digital financial information matching significantly contribute to urban green technology innovation, thus enhancing the local economy and ensuring sustainable urban competitiveness [16,17,18,19].
Most of the existing literature has focused on sustainable urban competitiveness. Only a few studies have researched the relationship between financial development and sustainable urban competitiveness, among which even fewer have selected provincial regions as research subjects [20,21,22,23,24], especially in the case of economically underdeveloped regions of developing countries. In addition, only a few studies have explored the impact mechanism of financial development on sustainable urban competitiveness. This paper represents a tentative effort to fill this research gap.
In the second part of this paper, the impact mechanism of financial development on sustainable urban competitiveness is explained, and the direction of the influence between the two is studied. In the third part, the financial development and sustainable urban competitiveness of prefecture-level cities in Henan Province are discussed and subjected to statistical analysis. The relationship between them is statistically described. The fourth part explains the evaluation method of sustainable urban competitiveness [21,25]. The fifth part evaluates the sustainable urban competitiveness of prefecture-level cities in Henan Province. The sixth part empirically analyses the relationship between financial development and sustainable urban competitiveness. Finally, the study is summarised, and policy recommendations for improving sustainable urban competitiveness are presented.
2. Theoretical Analysis
Financial development consists of expanding the financial scale, improving financial efficiency, and optimising the financial structure, which play different roles in enhancing the competitiveness of cities. Financial structure is a very broad concept. The financial activities of prefecture-level cities involve both direct and indirect financing, but it is difficult to identify indicators of direct financing activities. Thus, most studies of financial structure use the ratio of direct to indirect finance in a region to express its financial structure. This paper measures the level of financial development in terms of both the financial scale and financial efficiency and analyses the impact mechanism of financial development on sustainable urban competitiveness [26,27,28,29,30,31,32,33,34].
2.1. The Impact Mechanism of Financial Scale on the Improvement of Sustainable Urban Competitiveness in Developing Regions
Most scholars use the deposit and loan balances of financial institutions or the broad money supply as variables to measure the financial scale of a region, which refers to the ratio of the total social financial activities to the entire economic activities of a region, reflecting the degree of monetisation of the regional economy. The role of financial scale in enhancing the competitiveness of cities is manifested in the following ways [35,36,37].
Firstly, the expansion of the financial scale improves the role of urban finance in supporting the real economy by absorbing idle monetary assets and enhancing the efficiency of resource allocation in the financial system. After absorbing monetary assets, financial institutions invest funds in industries and enterprises with strong competitiveness and good development prospects in the form of loans, which inevitably enhance the competitiveness and development potential of the real urban economy. This is conducive to promoting urban competitiveness [8,9,10,11,38]. Expanding the financial scale can provide sufficient funds for industrial evolution and enterprise development and effectively solve the problem of a shortage of funds in industrial and enterprise development [39,40].
Secondly, expanding the financial scale can provide more financing paths for enterprises of different levels and types in cities and effectively reduce financing constraints. The expansion of the financial scale in certain cities has increased the number of financial institutions at various levels [12,13,41,42]. Different financial institutions have their own financing methods and paths, risk preferences, significant differences in information advantages, and financing advantages for different types of enterprises. When the level of urban financial development is high, the financing system and approaches of enterprises in cities are relatively complete and flexible, which can effectively meet the capital needs of financing enterprises at different levels, thus reducing the capital constraint risks faced by enterprises in the process of rapid expansion and improving the market competitiveness of urban micro-enterprises.
Thirdly, expanding the financial scale can effectively reduce the cost of obtaining financial resource information in the financial market and improve the financing efficiency of enterprises. Due to the widespread existence of transaction costs in the real economy, the adequate financing of industrial development and enterprise expansion must devote expenses of a certain amount to financial resource information, such as financial status and risk level evaluation [43,44,45]. Expanding the financial scale can promote the differentiation and evolution of the financial system to a certain extent, and industries and enterprises can adapt to it. Through big data financial technology, the low-cost dissemination of financial resource information can be achieved, the market transaction cost of financial resources can be reduced, and the competitiveness of urban financial markets can be improved.
2.2. The Impact Mechanism of Financial Efficiency on the Improvement of Sustainable Urban Competitiveness in Developing Regions
Financial efficiency denotes the relationship between the input of financial resources and the economy’s output. This paper argues that financial efficiency includes the efficiency of financial assets in terms of production inputs and outputs and the optimal rate of allocation and utilisation of financial assets.
Firstly, improvements in financial efficiency are reflected in the optimal allocation of financial assets. When traditional commercial banks allocate funds to loans for businesses, a large sum of funds flows into inefficient enterprises, which enables inefficient enterprises to occupy critical positions in the market. In contrast, efficient enterprises need more funds to support them, resulting in the loss of funds and slow economic growth [46,47,48,49]. The optimal allocation of financial assets can render the operation of financial institutions in cities more flexible and practical, promote high-quality economic development, and improve the efficiency of urban financial resource allocation.
Secondly, improving financial efficiency can enhance the ability of enterprises to respond to risks and promote urban economic growth. Investors must spend a large sum of costs when conducting investment research on highly specialised enterprises, which increases the investment difficulties of enterprises and causes a shortage of funds [41,50,50,51,52]. Improving urban financial efficiency can accelerate the exchange of information regarding financial resources between real-body and financial enterprises, more effectively reduce financing constraints, and promote the development of the real economy.
3. Data and Methodology
This paper focuses on the competitiveness of prefecture-level cities in Henan Province, the central area of China, whose economy is relatively backward. With the established model, the unit root and cointegration tests were conducted on the explanatory and control variables to verify the positive correlation between financial development and sustainable urban competitiveness.
3.1. Evaluation Index System of Sustainable Urban Competitiveness
Based on the current research results [42,44,45,53], in this paper, we construct a system of evaluation indicators focusing on five aspects: the economic level, living standards, science and technology, talents and infrastructure, and the environment, as presented in Table 1.

Table 1.
Sustainable urban competitiveness index.
The economic level reflects the overall scale, industrial structure, and openness of a city’s economy in continuous development, reflecting the city’s use of its production factors and ability to allocate resources and enhance its competitiveness in its future development [41,54,55,56].
The standard of living is a critical component of a city’s competitiveness, which truly reflects the living conditions of its residents [42,53,57,58].
Regarding scientific and technological talents, highly skilled and qualified personnel can drive a city’s development. The core of sustainable urban competitiveness has now shifted towards scientific and technical talents, reflecting a city’s science and technology and its ability to gather talent [59].
Infrastructure is the vehicle for a city’s development, ensuring the city’s normal economic and social activities by providing public service facilities to its residents.
Environmental competitiveness reflects a city’s use of natural resources and its level of environmental governance. A good environment can help improve urban residents’ living standards and contribute to the harmonious development of humans and nature.
3.2. Competitiveness Evaluation Method—Principal Component Analysis
Principal component analysis is a statistical analytical method that divides the original multiple variables into several composite indices. Mathematically, it is a method of dimensionality reduction for images. This paper adopts the competitiveness of a country’s core cities as the object of study, including factors such as politics, the economy, education, and foreign trade. If there are too many variables, this will increase the complexity of the problem. Therefore, we simplify the problem by using the original correlation between the variables while reducing the number of actual variables and employing fewer new variables to maintain the response of the original variables.
We assume that there are n samples, with each have a total of p variables that constitute the following n × p matrix:
Let the indicators of the original variables be , and let their combined indicators after the dimensionality reduction process (i.e., the new variables) be (m ≤ p). Then:
The determination principle of the coefficient lij is as follows:
- (i)
- (i ≠ j; i, j = 1, 2, …, m) are mutually uncorrelated.
- (ii)
- has the largest variance among all linear combinations of , X2, ..., , and Z2 has the largest variance among all linear combinations of , X2, ..., that are uncorrelated with Z1. Zm has the largest variance among all linear combinations of Z1, Z2, ..., Z(m−1) and is not correlated with X1, X2, ..., Xp, although it has the largest variance among all linear combinations of X1, X2, ..., Xp.
The new variable indicators Z1, Z2, ..., Zm are called the 1st, 2nd, ..., mth principal components of the original variable indicators X1, X2, ..., Xp, respectively.
Based on the above analysis, the aim of the principal component analysis is to determine the loading of the original variable Xj (j = 1, 2, ..., p) on the plural principal components Zi (i = 1, 2, ..., m) (i = 1, 2, ..., m; j = 1, 2, ..., p).
It can be mathematically demonstrated that these are the eigenvectors corresponding to the m larger eigenvalues of the correlation matrix.
The principal component analysis employed here is mainly based on SPSS software. The specific steps are as follows:
- (1)
- Calculate the correlation coefficient matrix.
Here,
rij (i, j = 1, 2, …, p) is the correlation coefficient of the original variables xi, xj, and rij =rji, and the calculation formula is as follows:
- (2)
- Calculate the eigenvalues and eigenvectors.
Solve the eigenequation . Commonly, the Jacobi method is used to find the eigenvalue and place it in the order of size: .
The eigenvectors corresponding to the eigenvalues ei (i = 1, 2, … p) are identified separately, requiring = 1, , where represents the j-th component of the vector.
- (3)
- Calculate the principal component contribution rate and the cumulative contribution rate.
Contribution rate: ,(i=1, 2, … p)
Cumulative contribution rate: ,(i=1, 2, … p)
Generally, the eigenvalue , with the contribution rate ranging from 85% to 95%, corresponds to the 1st, 2nd, ..., m-th (m ≤ p) principal component.
- (4)
- Calculate the principal component load: ).
- (5)
- The score of each principal component is as follows:
3.3. Model Setting
According to the relevant indices and theoretical analysis, there may be a certain relationship between financial development and sustainable urban competitiveness. To better explore the impact of financial development on sustainable urban competitiveness, a panel model is established based on the above analysis, as follows:
UCit = β0 + β1FIRit + β2DCit + β3InHumit + β4InInformit + β5Structureit + β6InR &Dit + ε
Here, β0 is a constant term; βi (i = 1, 2, 3....) is the coefficient; i represents the city; t indicates the year; and ε is a random disturbance term. Other variables include the comprehensive principal component value of sustainable urban competitiveness (UC), financial scale (FIR), financial efficiency (DC), cultural resource level (InHum), information level (InInfrom), urban construction level (Structure), and scientific research investment level (lnR&D).
In fact, the sustainable competitiveness of national financial centres such as Shanghai and Beijing in China has a certain degree of correlation with their financial development after reaching a certain scale, that is, the sustainable competitiveness of cities will promote their financial development after reaching a certain level. This means that the above regression analysis may have endogenous problems. [60,61] Based on the Geweke–Hajivassiliou–Keane algorithm estimated by the mixed model proposed by Geweke, Hajivassiliou, Mcfadden, and Keane [38,62,63], this paper constructs a simultaneous equation between urban competitiveness, financial scale, and financial efficiency, and explores the relationship between financial development and urban sustainable competitiveness, as follows:
3.4. Data Source
Sustainable urban competitiveness refers to the competitiveness of a city as compared with other cities. In this paper, we effectively study the sustainable urban competitiveness of 17 cities in Henan Province in terms of the economy, living standards, scientific and technological talents [8,21], infrastructure, and environment.
Based on the indicators identified through the indicator evaluation system, we collected 16 main indicators for the 17 cities in Henan Province from the Henan Provincial Statistical Yearbook 2021. The indicators include the gross regional product (X1), GDP per capita (X2), industrial value added (X3), net income per capita of the rural residents (X4), disposable income per capita of the urban residents (X5), total wages of employees in employment (X6), financial expenditure on education (X7), number of students in colleges and universities (X8), research and experimental development expenditure (X9), research and experimental development personnel (X10), urban road area (X11), number of beds in hospitals and health centres (X12), total collection of public libraries (X13), green coverage area in built-up areas (X14), urban sewage treatment rate (X15), and green areas in parks (X16).
3.5. Variable Selection and Data Description
The variable selection process was as follows below (presented in Table 2).
Table 2.
Variable selection.
- (1)
- Explained variable
Comprehensive principal component value of sustainable UC: In this paper, the indicators of the sustainable urban competitiveness of 17 municipalities in Henan Province from 2006 to 2020 are selected from the Henan Provincial Statistical Yearbook, and the comprehensive principal component value of sustainable urban competitiveness, which is the explained variable, was obtained through principal component analysis.
- (2)
- Explanatory variable
Financial scale (FIR): The most significant external manifestation of a city’s financial development level is the change in the city’s financial scale. The method of calculating the financial scale is FIR = FI/GDP, where FIR represents the financial-related rate, FI represents financial institutions’ total deposits and loans, and GDP represents the gross urban product.
Financial efficiency (DC): Financial efficiency includes the input–output efficiency of financial resources and the allocation and utilisation efficiency of financial resources. The specific calculation formula of financial efficiency DC is as follows: DC = the deposit balance of financial institutions/loan balance of financial institutions. The higher the total loan ratio occupied, the higher the financial efficiency will be.
- (3)
- Control variable
The cultural resource level (InHum) denotes the number of teachers in urban universities.
The information level (InInfrom) is of great significance to the growth of sustainable UC. In this paper, we use the urban postal industry’s total business volume to reflect the city’s informatisation degree.
The urban construction level (Structure) can form an excellent economic scale, thus improving the level of sustainable UC. In this paper, we adopt the metropolitan green coverage area as the control variable of the urban construction level.
Scientific research investment level (lnR&D) can affect sustainable UC. In this paper, we select the number of regional research and experimental development personnel to represent the control variable of the scientific research input level.
A statistical description of the data is presented in Table 3.
Table 3.
Statistical description of the data.
3.6. Unit Root Test
Before the regression estimation of the parameters of the panel model, to avoid the pseudo-regression phenomenon caused by variable unsteadiness, it is necessary to conduct a unit root test of the indicator variables so as to determine the stability of the variables in the model. With the help of Eviews software, the LLC, IPS, and ADF Fisher methods were used to test the unit root of the variables, as presented in Table 4.
Table 4.
Unit root test.
The table reveals that the explained and explanatory variables pass the panel unit root test and are stable. In the case of the control variables, the information level is not significant, there is no unit root test, and the obtained data are not stable.
4. Results and Discussion
4.1. Evaluation Results of the Sustainable Urban Competitiveness of Cities in Henan Province
SPSS software was employed to conduct the principal component analysis of the economic data of each city in Henan Province [23,58,64,65]. The correlation coefficients of the raw data were calculated. As presented in Table 5, there is a strong correlation between the selected indicators. For instance, the correlation coefficients between GDP and factors such as the industrial added value, education expenditure, number of college students, research and experimental development funds, research and experimental development personnel, urban road area, number of beds in hospitals and health centres, green coverage area in built-up areas, and green areas in parks are 0.914, 0.905, 0.932 0.914, 0.991, 0.96, 0.854, 0.948, and 0.96, respectively.
Table 5.
The correlation matrix.
If the value of the significance level in the Bartlett test is less than 0.05, the data are suitable for principal component analysis. As presented in Table 6, the p-value is 0, indicating the suitability of the data for principal component analysis.
Table 6.
KMO and Bartlett tests.
The number of principal components with an eigenvalue greater than 1 is extracted. If the eigenvalue is less than 1, this means that the explanatory power of the principal component is not very strong. Thus, the inclusion criterion is usually an eigenvalue greater than 1.
Three components were extracted, as shown in Table 7 and Table 8. The principal component expression can be derived by multiplying the resulting eigenvectors with the normalised data, as presented below:
F1 = 0.988ZX1 + 0.664ZX2 + 0.855ZX3 + 0.678ZX4 + 0.862ZX5 + 0.872ZX6 + 0.776ZX7 + 0.84ZX8 + 0.97ZX9 + 0.987ZX10 + 0.988ZX11 + 0.844ZX12 + 0.698ZX13 + 0.982ZX14 + 0.257ZX15 + 0.951ZX16
F2 = 0.152ZX1 + 0.572ZX2 + 0.006ZX3 + 0.59ZX4 + 0.312ZX5 + 0.244ZX6 − 0.578ZX7 + 0.01ZX8 + 0.00
3ZX9 − 0.022ZX10 − 0.016ZX11 − 0.637ZX12 − 0.298ZX13 − 0.114ZX14 − 0.233ZX15 − 0.022ZX16
F3 = − 0.133ZX1 + 0.091ZX2 − 0.052ZX3 − 0.078ZX4 + 0.191ZX5 + 0.145ZX6 − 0.194ZX7 − 0.21ZX8 +
0.019ZX9 − 0.128ZX10 − 0.067ZX11 − 0.142ZX12 + 0.386ZX13 − 0.167ZX14 + 0.865ZX15 − 0.096ZX16
Table 7.
Interpretation of the total data scores.
Table 8.
Composition matrix of the data.
The comprehensive principal component values are calculated using the proportion of the eigenvalues corresponding to the three principal components to the sum of the total eigenvalues of the extracted principal components as the weights, as shown in Table 9.
Table 9.
Comprehensive principal component values.
The comprehensive principal component value can be calculated using the principal component comprehensive model, and it can be sorted by using the comprehensive principal component value to conduct a comprehensive evaluation and comparison of the regions.
Similarly, following the above steps, the comprehensive principal component values of the cities in Henan Province from 2006 to 2020 were calculated, as presented in Figure 1 and Table 10.
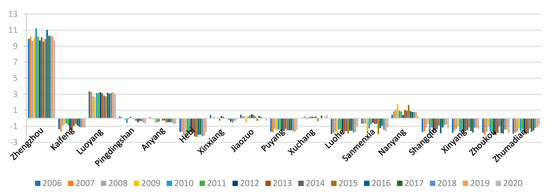
Figure 1.
Comprehensive principal component value of the cities in Henan Province from 2006 to 2020.
Table 10.
Comprehensive principal component ranking of the cities in Henan Province from 2006 to 2020.
Zhengzhou and Luoyang are the two leading cities in terms of competitiveness and are relatively competitive. Nanyang was in the 3rd position but fell to the 4th place in 2020, while Zhoukou fell from 11th in 2015 to 17th place in 2020, which is a significant drop. Luohe city made great progress in 2020, rising from 16th to 10th. Zhengzhou is ahead of other cities in all aspects, with a GDP of CNY 1200.304 billion in 2020, an industrial value added of CNY 314.569 billion, a GDP per capita of CNY 96,134, a net income per rural resident of CNY 24,783, and a disposable income per urban resident of CNY 42,887, which indicates that its economic development level is higher than that of the other prefecture-level cities.
4.2. The Results of the Analysis of the Relationship between Financial Development and Sustainable UC
The data collected were used to test the impact of financial development on sustainable UC in Henan Province from 2006 to 2020. The regression analysis of the model data, as presented in Table 11, was conducted to determine the relevance of the industrial structure indicators to financial development indicators.
Table 11.
Regression analysis.
According to the regression results in Table 11, financial scale and financial efficiency affect the competitiveness level of cities at different significant levels. Among them, the coefficient of financial efficiency is 0.04762. A positive correlation is found at the significance level of 5%, indicating that financial efficiency can improve sustainable UC, but the effect is insignificant. Thus, for each 5% increase in the total index, the sustainable UC level is increased by 0.04762%. Financial efficiency is determined by the city’s deposit and loan balance. Thus, the deposit and loan business can be vigorously developed through the banking industry to improve the financial efficiency of a city and, therefore, promote the development of sustainable UC.
The total financial deposits and loans determine the financial scale. The coefficient of the financial scale is 0.4265, and a positive correlation is found at the significance level of 1%, indicating that financial efficiency can significantly improve the competitiveness of cities. Thus, for every 1% increase in the total index, the sustainable UC level increases by 0.4265%. Therefore, the development of the deposit and loan business and the growth of economic activities play important roles in improving the competitiveness of cities.
The level of cultural resources and urban construction are significant at 1%, and they are positively correlated with the development of sustainable UC. However, because the correlation coefficient is too small, the effect on improving sustainable UC needs to be evident. However, the coefficient of the information level is negative and significant at the level of 1%. Thus, the information level does not promote the development of sustainable UC. However, the scientific research level has a correlation coefficient of 0.000156 in column (1) and 0.000162 in column (2). All are significant at the 1% level, proving that it promotes sustainable UC development.
The closer the R-squared value is to 1, the higher the degree of fitting of the model. In the regression analysis, the R-squared value of financial efficiency is 0.911768 and is infinitely close to 1, indicating that the model’s fitting degree is high. The R-squared value of the financial scale is 0.912593. Thus, the appropriate degree is also high.
As has been said before, there is a problem that still needs attention: a city’s sustainable competitiveness is likely to promote its financial development, thus leading to endogeneity problems. The simultaneous equation regression that reveals the multi-causal relationship between financial development and urban competitiveness is shown in Table 12.
Table 12.
Regression results of simultaneous equation.
Table 12 shows the regression results of the simultaneous equation model that controls the city and the fixed effect of the year. The estimated results in columns (1) and (2) of the table support the conclusion that financial development has a significant positive impact on urban competitiveness. The urban competitiveness evaluation index increases by 0.0299 for each unit of increase in the ratio of total deposits and loans of financial institutions to urban GDP, and 0.6039 for each unit of increase in the ratio of deposits and loans of financial institutions. The level of urban informatisation and urban public infrastructure construction still play a role in promoting urban competitiveness. The estimated results in columns (3) and (4) of the table show that the coefficient between urban competitiveness and financial scale is positive but fails to pass the test. The improvement of urban competitiveness has not played a significant role in the expansion of financial development scale. The estimated results in column (6) of the table show that the coefficient between urban competitiveness and financial efficiency is positive and has passed the test. The improvement of urban competitiveness will improve financial efficiency, which may be due to the fact that urban competitiveness will promote the accumulation of various financial resources, achieve economies of scale, and reduce the transaction costs of financial activities as a whole. In addition, the coefficient of human resource level has also passed the test, indicating that more high-quality labour can improve the efficiency of financial activities.
To determine whether there is a relationship of long-term equilibrium cointegration between the variables, the panel data were also subjected to cointegration tests. The Kao test and Pedroni test, conducted using econometric software, were used to test the residual construction statistics calculated using the panel regression equation. The original hypothesis was that there is no cointegration relationship between the variables. The results of the cointegration test indicate that there is a long-term stable relationship between the variables, as presented in Table 13.
Table 13.
Co-consolidation test.
5. Conclusions
In this paper, we analysed the impact mechanism of financial development on sustainable UC. We used the principal component analysis method to calculate the central component values of the sustainable UC of 17 prefecture-level cities from 2006 to 2020 and obtain their comprehensive ranking in sustainable UC. The empirical analysis revealed a positive correlation between financial development and sustainable UC. A financial product is conducive to improving the competitiveness of cities in developing regions, which is embodied in financial efficiency and financial scale [60,64,65,66,67,68]. The development of cultural resources, urban construction, and scientific and technological advances also enhance the level of sustainable UC to a certain extent.
The financial market development in various prefecture-level cities in Henan needs to be more balanced. The scale of the financial institutions is small, and their transaction costs are high. Therefore, the financial system must be further improved and expanded. The government should provide support through industrial development, financial subsidies, tax incentives, and so on. It is advisable to establish a diversified financial market, provide diversified financing channels for economic growth, and reduce the capital channels’ information communication and circulation costs between finance and the real economy. Moreover, the financial resources of a region should be effectively integrated to give full play to the scale economy effect on the city so that the promotion of sustainable UC and financial development can form a positive circle and promote each other, thus realising the sustainable development of the regional economy in which the city is located.
The local government should reasonably and efficiently promote the improvement of financial development. They should focus not only on expanding the scale of financial growth, but also on the quality of financial development, adjusting the financial structure, improving financial efficiency, and actively promoting the opening of financial markets and innovation of financial products. In light of the actual situation regarding economic development in various regions, the local government should adopt measures and policies according to local conditions, reasonably strengthen the comprehensiveness of financial support, and coordinate the relationship between financial development and high-quality economic development. The provincial government should further improve the investment mechanism of the capital market and guide the rational flow of capital towards regions and industries with higher returns to improve the efficiency of capital allocation and enhance the role of capital in promoting high-quality economic development. The local government should pay greater attention to the coordination and balance of regional economic development, strengthen the allocation of financial resources in economically underdeveloped areas, and eliminate the systemic obstacles of this flow to jointly ensure financial development and capital optimisation, thus improving the level of high-quality economic development.
Nevertheless, this study has some limitations, which suggest future research directions. First, this study focuses on Henan province in China, a typical representative of developing regions in developing countries. In contrast, the situation of developed regions in developing countries is quite different from that of developing regions in developing countries. Therefore, the research conclusions of this study may not apply to developed regions in developing countries. Future studies could explore the relationship between sustainable UC and financial development in the context of developed regions in developing countries. Second, this study is carried out with commonly used econometric methods due to the small sample size and the characteristics of the variables in this study. However, based on a larger sample and more complex variable relationships, such as the impact of the heterogeneity of urban size on the relationship between financial development and urban competitiveness, we hope that future research can use the complete information maximum likelihood and GMM method to fully elaborate the relationship between financial development and sustainable UC.
Author Contributions
H.Z. performed the data curation, writing—original draft preparation, and funding support; Y.S. performed the review and editing; and C.M. developed the conceptualisation and methodology. All authors have read and agreed to the published version of the manuscript.
Funding
The research reported here was supported by the National Social Science Foundation (20BJL134), the Key Project of Beijing Municipal Education Commission (SZ202110011006), and the Beijing Technology and Business University Young Teachers Research Start-Up Fund Project (QNJJ2021-54).
Data Availability Statement
The datasets used and analysed during the current study are available from the corresponding author on reasonable request.
Conflicts of Interest
The authors declare no conflict of interest.
References
- Guo, H. Research on the construction and evaluation of the index system of China’s financial center city’s competitiveness. Hunan Soc. Sci. 2012, 3, 143–147. [Google Scholar]
- Miao, J. Evaluation of the comprehensive competitiveness of “new first-tier cities”—Based on factor analysis. Time Financ. 2019, 7, 63–64. [Google Scholar]
- Zhou, J.Y.; Yang, J. Evaluation of financial development competitiveness of Hebei Province based on a variety of analysis. J. North China Univ. Sci. Technol. 2019, 19, 56–62. [Google Scholar]
- Wu, S.H.; Li, Y.J. Research on the evaluation of urban competitiveness in China’s western region based on principal component analysis. Econ. Issues 2021, 11, 115–120. [Google Scholar]
- Jiang, X.X.; Wang, X.; Ren, J.; Xie, Z. The Nexus between Digital Finance and Economic Development: Evidence from China. Sustainability 2021, 13, 7289. [Google Scholar] [CrossRef]
- Hlioui, Z.; Gabsi, M.; Omri, A. Informal Competition Effect on SMEs’ Innovation: Do Credit Constraints Matter? Evidence from Eastern European Countries. Sustainability 2022, 13, 3874. [Google Scholar] [CrossRef]
- Komasi, H.; Zolfani, S.H.; Prentkovskis, O.; Skačkauskas, P. Urban Competitiveness: Identification and Analysis of Sustainable Key Drivers (A Case Study in Iran). Sustainability 2022, 14, 7844. [Google Scholar] [CrossRef]
- Xie, H.J.; Wen, J.Y.; Wang, X.W. Digital Finance and High-Quality Development of State-Owned Enterprises—A Financing Constraints Perspective. Sustainability 2022, 22, 15333. [Google Scholar] [CrossRef]
- Nabamita, D.; Daniel, M. Financial development and entrepreneurship. Int. Rev. Econ. Financ. 2021, 73, 114–126. [Google Scholar]
- Ilyina, A.; Samaniego, R. Technology and Financial Development. J. Money Credit Bank. 2011, 43, 899–921. [Google Scholar] [CrossRef]
- Moraes, C.; Duarte, G.; Nascimento, R.F. Credit information and financial development. Int. J. Financ. Econ. 2020, 27, 2182–2193. [Google Scholar] [CrossRef]
- Perez-Moreno, S. Financial development and poverty in developing countries: A causal analysis. Empir. Econ. 2011, 41, 57–80. [Google Scholar] [CrossRef]
- Samad, A.; Akhtaruzzaman, M. FDI, financial development and economic growth: Evidence of causality from East and South East Asian countries. Glob. Bus. Econ. Rev. 2014, 16, 202–213. [Google Scholar] [CrossRef]
- Siddikee, M.N.; Rahman, M.M. Foreign Direct Investment, Financial Development, and Economic Growth Nexus in Bangladesh. Am. Econ. 2021, 66, 265–280. [Google Scholar] [CrossRef]
- Ruiz, J.L. Financial development, institutional investors, and economic growth. Int. Rev. Econ. Financ. 2017, 54, 218–224. [Google Scholar] [CrossRef]
- Hu, Y.Q.; Dai, X.; Zhao, L. Digital Finance, Environmental Regulation, and Green Technology Innovation: An Empirical Study of 278 Cities in China. Sustainability 2022, 14, 8652. [Google Scholar] [CrossRef]
- Nyasha, S.; Odhiambo, N.M. Bank-based financial development and economic growth in Ghana: An empirical investigation. Int. J. Sustain. Econ. 2017, 9, 322–340. [Google Scholar] [CrossRef]
- Aggarwal, R.; Demirgü-Kunt, A.; Martínez Pería, M.S. Do remittances promote financial development? J. Dev. Econ. 2006, 96, 255–264. [Google Scholar] [CrossRef]
- Fromentin, V. The long-run and short-run impacts of remittances on financial development in developing countries. Post-Print. 2017, 66, 192–201. [Google Scholar] [CrossRef]
- Zhao, H.Y.; Zheng, W.T.; Loutfoullina, I. Digital Finance and Collaborative Innovation: Case Study of the Yangtze River Delta, China. Sustainability 2022, 17, 10784. [Google Scholar] [CrossRef]
- Cao, Q.F.; Ni, P.F.; Ma, H.F. An international comparative study on the sustainable competitiveness of China’s urban system. Henan Soc. Sci. 2021, 29, 49–56. [Google Scholar]
- Li, M.Y.; Fu, Y.J. Prediction of Supply Chain Financial Credit Risk Based on PCA-GA-SVM Model. Sustainability 2022, 24, 16376. [Google Scholar] [CrossRef]
- Yin, X.B.; Wang, Q. Financial development, urbanization and income gap between urban and rural residents in China. Econ. Geogr. 2020, 40, 84–91. [Google Scholar]
- Liu, X.N.; Ni, P.F. Research on the impact mechanism of technological innovation on financial competitiveness of Chinese cities. Contemp. Econ. Manag. 2021, 43, 90–97. [Google Scholar]
- Hu, R.H.; Gong, Y.C. Evaluation of Urban Competitiveness and Analysis of Spatial and Temporal Evolution in Henan province—Based on Principal Component Analysis and Cluster Analysis. J. Henan Univ. Urban Constr. 2019, 28, 85–92. [Google Scholar]
- Wu, L.C.; Chen, X.L.; Wang, K. Analysis of Taiwan Financial Competitiveness and Economic Performance. Asia-Pac. Econ. Rev. 2013, 1, 32–39. [Google Scholar]
- Li, Z.H.; Yan, J. A Study on the Measurement of the Synergistic Effects of the Financial Stability and the Financial Competitiveness and its International Comparison. Stat. Inf. Forum. 2012, 2, 3–8. [Google Scholar]
- Friedman, B.M.; Gertler, M. The Zero Bound on Interest Rates and Optimal Monetary Policy. Comments Discuss. 2003, 1, 212–233. [Google Scholar]
- Hang, K. Research on the Relationship between Enterprises’ Culture and Core Competence—A Case Study of Financial Institutions. Frontiers 2017, 8, 142–145. [Google Scholar]
- Hwang, J.T.; Wang, C.H.; Chung, C.P. Financial Sector Reform and competitiveness in Taiwan. Taiwan. J. WTO Stud. 2011, 18, 25–70. [Google Scholar]
- Azizi, S. Impacts of Remittances on Financial Development. J. Econ. Stud. 2020, 47, 467–477. [Google Scholar] [CrossRef]
- Bettin, G.; Lucchetti, R.; Zazzaro, A. Financial development and remittances: Micro-econometric evidence. Econ. Lett. 2012, 115, 184–186. [Google Scholar] [CrossRef]
- Brown, R.; Carmignani, F.; Fayad, G. Migrants’ Remittances and Financial Development: Macro- and Micro-Level Evidence of a Perverse Relationship. World Econ. 2013, 36, 636–660. [Google Scholar] [CrossRef]
- Adeniyi, O.; Ajide, K.; Raheem, I.D. Remittances and output growth volatility in developing countries: Does financial development dampen or magnify the effects? Empir. Econ. 2019, 56, 865–882. [Google Scholar] [CrossRef]
- Ikpefan, O.A.; Oligbo, B.C. The Impact of Mergers on Bank Competitiveness in Nigerian Banking Industry. Int. J. Innov. Digital Econ. 2012, 4, 64–80. [Google Scholar] [CrossRef]
- Atasoy, B.S. The Determinants of Export Sophistication: Does Digitalization Matter? Int. J. Financ. Econ. 2021, 4, 5135–5159. [Google Scholar] [CrossRef]
- Cezar, R. The Heterogeneous Effect of Finance on International Trade. Appl. Econ. 2014, 24, 2903–2919. [Google Scholar] [CrossRef]
- Keane, M. A Computationally Practical Simulation Estimator for Panel Data. Econometrica 1994, 62, 95–116. [Google Scholar] [CrossRef]
- Karreman, B.; Knaap, G.A.V.D. The Geography of Equity Listing and Financial Centre Competition in Mainland China and Hong Kong. Erasmus Res. Inst. Manag. 2010, 8, 1–31. [Google Scholar] [CrossRef]
- Assche, A.V.; Gangnes, B. Electronics Production Upgrading: Is China Exceptional? Appl. Econ. Lett. 2010, 5, 477–482. [Google Scholar] [CrossRef]
- Pradhan, R.; Arvin, M.B.; Bahmani, S.; Hall, S.; Hall, J.H.; Bahmanioskooee, M. Attaining economic growth through financial development and foreign direct investment. J. Econ. Stud. 2019, 6, 1201–1223. [Google Scholar] [CrossRef]
- Cherif, M.; Dreger, C. Institutional Determinants of Financial Development in MENA countries. Rev. Dev. Econ. 2016, 3, 670–680. [Google Scholar] [CrossRef]
- Ehigiamusoe, K.; Lean, H.H.; Lee, C.C. Moderating effect of inflation on the finance–growth nexus: Insights from West African countries. Empir. Econ. 2019, 2, 399–422. [Google Scholar] [CrossRef]
- Ehigiamusoe, K.U.; Lean, H.H. Finance–Growth Nexus: New Insights from the West African Region. Emerg. Mark. Financ. Trade 2018, 11, 2596–2613. [Google Scholar] [CrossRef]
- Stolbov, M. Causality between credit depth and economic growth: Evidence from 24 OECD countries. Empir. Econ. 2017, 2, 493–524. [Google Scholar] [CrossRef]
- Aydemir, R.; Ovenc, G. Interest rates, the yield curve and bank profitability in an emerging market economy. Econ. Syst. 2016, 4, 670–682. [Google Scholar] [CrossRef]
- Inoue, T. Financial development, remittances, and poverty reduction: Empirical evidence from a macroeconomic viewpoint. J. Econ. Bus. 2018, 96, 59–68. [Google Scholar] [CrossRef]
- Adenutsi, D.E. Do International Remittances Promote Human Development in Poor Countries? Empirical Evidence from Sub-Saharan Africa. MPRA Paper 2010, 4, 31–45. [Google Scholar]
- Gupta, S.; Pattillo, C.A.; Wagh, S. Effect of Remittances on Poverty and Financial Development in Sub-Saharan Africa. Int. Monet. Fund. 2009, 37, 104–115. [Google Scholar] [CrossRef]
- Ni, P.; Qiong, J.Z. Urban Competitiveness and Innovation; Edward Elgar Publishing Limited: Glos, UK, 2014. [Google Scholar]
- Li, Y.Q. How to Improve Urban Competitiveness. China Econ. Rev. 2005, 4, 6–14. [Google Scholar]
- Kresl, P.; Ietri, D. Urban competitiveness: Theory and practice. Urban Stud. 2017, 54, 1303–1305. [Google Scholar]
- Law, S.H.; Kutan, A.M.; Naseem, N.A.M. The role of institutions in finance curse: Evidence from international data. J. Comp. Econ. 2018, 1, 174–191. [Google Scholar] [CrossRef]
- Lucía, S.; Iñaki, P.; Iñaki, H.-S. Measuring urban competitiveness: Ranking European large urban zones. J. Place Manag. Dev. 2017, 10, 479–496. [Google Scholar]
- Arku, G. Competition and cooperation in economic development: Examining the perceptions of practitioners in ontario, Canada. J. Urban Affairs. 2014, 36, 99–118. [Google Scholar] [CrossRef]
- Lemelin, J.; Hogg, W.E.; Dahrouge, S.; Armstrong, C.D.; Martin, C.M.; Zhang, W.; Dusseault, J.-A.; Parsons-Nikota, J.; Saginur, R.; Viner, G. Patient, informal caregiver and care provider acceptance of a hospital in the home program in Ontario, Canada. BMC Health Serv. Res. 2007, 7, 7417–7418. [Google Scholar] [CrossRef]
- Mazioud, M. How Does Financial Development Affect Economic Growth Volatility? Evidence from a Penalized Panel Quantile Regression. Econ. Financ. Lett. 2022, 9, 49–68. [Google Scholar] [CrossRef]
- Boustanifar, H. Finance and employment: Evidence from U.S. banking reforms. J. Bank. Financ. 2014, 46, 343–354. [Google Scholar] [CrossRef]
- Rapp, M.S.; Udoieva, I. What matters in the finance–growth nexus of advanced economies? Evidence from OECD countries. Appl. Econ. 2018, 6, 676–690. [Google Scholar] [CrossRef]
- Liu, H.; Li, J.; Long, H.; Li, Z.; Le, C. Promoting energy and environmental efficiency within a positive feedback loop: Insights from global value chain. Energy Policy 2018, 121, 175–184. [Google Scholar] [CrossRef]
- Zhang, Y.; Song, Y.; Phillips, F. Tax rebates, technological innovation and sustainable development: Evidence from Chinese micro-level data. Technol. Forecast. Soc. Change 2022, 176, 121481. [Google Scholar] [CrossRef]
- Geweke, J. Bayesian inference in econometric models using Monte Carlo integration. Econometrica 1989, 57, 13171339. [Google Scholar] [CrossRef]
- Hajivassiliou, V.; Mcfadden, D. The method of simulated scores for the estimation of LDV models. Econometric 1998, 66, 863–896. [Google Scholar] [CrossRef]
- Shahbaz, M.; Khraief, N.; Rehman, I.U.; Zaman, K.U. Does Globalization Affect Economic Growth? The Role of Financial Development and Capital Use in Pakistan. Int. J. Econ. Empir. Res. 2016, 4, 307–328. [Google Scholar]
- Wei, S.J.; Tytell, I. Does Financial Globalization Induce Better Macroeconomic Policies? IMF Work. Papers 2004, 4, 41. [Google Scholar] [CrossRef]
- Hauner, D. Public debt and financial development. J. Dev. Economics. 2009, 88, 171–183. [Google Scholar] [CrossRef]
- Altunbas, Y.; Thornton, J. Does financial development reduce corruption? Work. Papers 2012, 114, 221–223. [Google Scholar] [CrossRef]
- Donaldson, O.; Duggan, E.W. Legal Theories of Financial Development. Archaeometry 2004, 46, 47–65. [Google Scholar]

Disclaimer/Publisher’s Note: The statements, opinions and data contained in all publications are solely those of the individual author(s) and contributor(s) and not of MDPI and/or the editor(s). MDPI and/or the editor(s) disclaim responsibility for any injury to people or property resulting from any ideas, methods, instructions or products referred to in the content. |
© 2023 by the authors. Licensee MDPI, Basel, Switzerland. This article is an open access article distributed under the terms and conditions of the Creative Commons Attribution (CC BY) license (https://creativecommons.org/licenses/by/4.0/).