Abstract
This paper analyses the impact of relational capital and relationship networks on business internationalisation, in particular in the technology sector in relation to internationalised Andalusian university spin-offs. First, a literature review based on these theories is carried out, from which a series of hypotheses are established in a pioneering way. These allow us to design a model of relationships that is empirically tested through a quantitative analysis. The study constructs were measured using five-point Likert scales. Once the data had been collected through the survey developed, they were coded for statistical analysis using the SPSS Statistics V28.0 programme. It is shown that the output of the international activity of these companies depends on their capacity to develop and sustain relationships with each of the different actors involved. Along this line, university spin-offs obtain diverse and strategically valuable external information and resources, significantly reducing business failure chances. The elements that influence the internationalisation process of the companies under study are relationships with customers, allies/collaborators, suppliers, and the company’s reputation and image. Similarly, those referring to relations with competitors, public bodies, and organisations have less impact. Nevertheless, it is evident that companies need to commit more time and resources to create, maintain, and develop relationships with different actors. Therefore, a strategic tool focused on international management is provided, based on the relationships of the spin-offs studied, which may constitute a starting point for its applicability to other industrial sectors and geographical areas.
1. Introduction
This research focuses on relational capital, one of the components of intellectual capital. It is directly related to the business internationalisation phenomenon, as companies are becoming increasingly more integrated into a network with other organisations, companies, or entities, as well as with other market agents. As a result, the idea that the performance of their international activities will largely depend on their ability to establish and preserve that relationship networks [1]. In this way, companies are open to a larger success in their internationalisation, which leads to a larger economic gain [2], allowing them to achieve and maintain competitive advantages [3]. In consonance with this, relational capital influences the spin-off’s financial results [4,5].
A review of the literature proves the existence of opportunity areas for the implementation of empirical research analysing the interrelationship of relational capital and technology, and at the same time, the relationship of those with business results and their application to emerging sectors, as high technology companies [6]. As for the networks, few papers analyse the networking process, treating it as a dynamic phenomenon [7]. Further research on how the concept of relational capital is completed through a network of relationships, and its subsequent application to the international sphere, is, therefore, essential [8]. Spin-off companies arise in universities or technology centres and have recently become one of the most efficient mechanisms for transferring research results to the production area. They play an important part in innovation development, increasing qualified jobs, and consequently, in the increase in socio-economic growth [8,9,10].
This work considers, based on the studied literature, that university spin-offs are companies created on the basis of knowledge or technologies carried out under the aegis of a university or public or private research centre and dedicated to the commercial exploitation of such knowledge or technologies [8,9,11,12], and that they consist of research groups or staff who are directly related to those universities or public or private research centres [8,9,12].
Therefore, we can conclude that university spin-offs are companies that adjust very well to the knowledge society we are currently living in, providing significant benefits, such as the support of sustainable employment, the improvement of competitiveness in international markets, and the enhancement of economic growth, all this boosted by the new role acquired by universities as an important source of knowledge and whose transfer to the market is conducted through these spin-offs [13].
It is worth mentioning that the dialectic relationship between knowledge and innovation and nature (natural capital) plays a fundamental role in access to sustainable economic development, and companies must consider this natural capital due to the current global economy being influenced to a large extent by the scarcity of natural resources [14,15].
The overall objective of this research is to examine the influence of relational capital on the internationalisation of university spin-offs, developing a business management model that helps companies to manage their intangible assets and, in this case, their relational capital, and more specifically to explore how each company’s relationship with the elements that integrate this capital (relationships with customers, suppliers, competitors, allies or collaborators, public entities, as well as the company’s reputation and image) is affected in order to observe how it is produced and what influence it has on the internationalisation of these entities.
In order to study these relationships in greater depth and carry out a more exhaustive examination of them, the study of relational capital is complemented by means of relationship networks, which allow for an in-depth analysis of the characteristics of the relationship established between company and agent. In turn, we study the links established, the degree of commitment acquired in the relationship, as well as the time and resources involved and the type of relationship established.
The aim of this paper is highlighting how relational capital and networks of relationships are relevant to the internationalisation of university spin-offs. This includes the relevance of the elements of relational capital and how they interact with the university spin-off internationalisation.
2. Theoretical Framework and Hypotheses Development
2.1. Relational Capital and Networks of University Spin-Offs in an International Context
In the current scenario, an ICT-interconnected world, internationalisation has become not just a survival issue for companies, but something essential to promote their innovation and competitiveness, as companies are tangled within an inter-organisational social networking system that is key for their international development.
The analysis of knowledge management and intellectual capital has been developed in recent decades referring to private firms; however, there is now an increasing interest in this phenomenon in its implementation at both academic and research centres. The relational capital takes into consideration all resources related to external relationships developed by the institution with consumers, suppliers, partners, governments, etc. This capital includes, as a result, all actions and links established among the academic and external partnerships (enterprises, non-profit organisations, government bodies, as well as society in general) [16]. Belonging to a network is one of the foundations that support the creation of relational capital.
Relational capital describes the importance derived from the relationships between the firm and the people and organisations with whom it carries out its activities [17]. This capital includes relationships with external groups of interest, networks of providers, distributors, customers, and other groups of influence, as well as the company’s image and reputation [18,19,20,21,22,23,24,25,26,27,28,29].
For this research, relational capital is defined as the set of knowledge that adds value to the organisation and is added to the company as a result of the company’s relations with different market agents and society in general.
Belonging to these inter-organisational networks is one of the foundations underpinning relational capital development. There are limited works that analyse networking itself and treat it as a dynamic phenomenon. [7]. Due to this, the need to provide a more in-depth analysis reinforcing the joint knowledge of these two concepts in a primarily changing and competitive economic context arises.
Network models describe the relationships of companies with different agents. Thanks to these networks, companies can access the necessary information and resources to perform their activities and to better succeed in their international activities, all this greatly depending on their ability to create and maintain such networks. At the same time, these network models refer to the relevant components of relational capital, such as relations with clients, providers, competition, other companies (partners/collaborators), and public organisations.
What is really important is that these network models allow for a broad overview of relational capital, addressing the variety of ways in which these agents can interplay, taking into account, among others, their level of interaction, their ties, the processes and mechanisms operating in the network, their diversity, their status, and the increasing complexity of changes due to the needs arising from today’s eminently changing global economy.
Several authors have tried to conceptualise, characterise, and classify university spin-offs into taxonomies and to analyse the roles played by the networks of relationships in the development of their activities. However, few authors have studied the relational capital of university spin-offs and even fewer have performed a deep analysis of the influence of relational capital in their internationalisation processes. This research shows a new perspective on the spin-off phenomenon since there is a large study field regarding relational capital and networking in the necessary internationalisation of companies and this large field has not been studied enough.
Despite many papers analysing the networking of these companies, most of them do not tackle an international context, such as the one presented here. They do not study in detail each of these relationships established within the networks enough so as to analyse the extent to which they affect corporate internationalisation, as well as those firms which are internationalised upon the constitution, the so-called Born Global firms.
Based on a review of the literature on business internationalisation, the following definition could be established: a process by which the company carries out economic operations beyond national borders, thanks to the establishment and development of relationships with other agents (national and international) that allow and facilitate access to foreign markets, in which the company will commit a greater or lesser amount of resources, accumulating experiential knowledge that will subsequently constitute a competitive advantage for the organisation.
To achieve the internationalisation of these firms and in general, of any SME, a link and a balance must be found among the internal characteristics of the company (structure and processes), technology, intra-corporate relationships, and those external to the company, such as culture–country, competitive environment, and the different intercorporate social networks. These links and balances are found through the elements that integrate a company’s relational capital.
The internationalisation process of the university spin-offs is based to a certain extent on resources deriving from technological relationships with customers, suppliers, and other organisations. The need to obtain a greater knowledge regarding technology, products, and/or existing manufacturing processes, as well as the different actions deriving from the relationships with customers and suppliers are outstanding elements of the network approach [30].
Over time, the relationship between technological innovation and internationalisation has been analysed, based on the assumption that technological activities have a strong influence on the internationalisation capacity of countries, sectors, and companies. This emphasises the importance of technology-based companies, and consequently of university spin-offs, as an element that favours the international economy [9].
Moreover, it is important to highlight the effect of the components of relational capital and the ties between them on the innovation results of the companies under study. This is because they require the establishment of an effective innovation network with clients, suppliers, competitors, academic institutions, research centres, collaboration programs with governmental entities, etc. [31]. Other authors also analyse the relationships with allies in this sense, empirically proving that strategic alliances with other entities with a high technological ability positively affect the innovation rate of the company as well as its performance, causing an increase in the sales rate [32].
The literature focused on analysing these relationship networks or networking in the specific field of university spin-offs is quite extensive, as a main feature of the university spin-offs is their participation in those networks and the fact of searching for or having external support [8]. These companies favour the creation of collaboration networks between organisations and countries and are increasingly receptive to working together and to the establishment of alliances. They also promote the exploitation of synergies that provide important advantages for the parties in question. As such, the partnerships and the character of the relationships and networks in which researchers are integrated provide individuals as well as the organisation with a competitive edge, which may end up being essential for the generation and spreading of scientific knowledge [33].
Because of all this, it can be said that relational capital and networking prove to be very relevant, i.e., the relevance of both relational capital elements and how they interact stand up as highly important for the internationalisation of spin-off firms, as well as for the development of their activity.
This paper intends to provide a detailed analysis of how each of the relationships held by this type of company with the rest of the agents in their environment affects their internationalisation process and, more specifically, with customers, providers, competitors, other allies, collaborating companies, and governmental organisations, adding to the research another important relational capital element, the company reputation and image, as companies must focus on these when choosing potential partners to build links in a particular network and, as a consequence, obtain a stronger position in such networks.
These relationships and the belonging to those relationship networks will allow companies to be able to reach the knowledge and information they need to perform their activities. In this way, the idea that they need to direct their efforts and resources to establish, maintain, or develop relationships with the different actors in their area stands out as essential. These relationships will be widely analysed in this paper to conclude whether these relationships, organised in networks, affect the success of these companies in their international activities and to find out their degree of influence.
2.2. Hypothesis Development
In accordance with the aforementioned facts, the first hypothesis sustaining this work can be listed. It relates to the positive relationship among relational capital and internationalisation.
Hypothesis 1 (H1).
There is a positive relationship among relational capital and the internationalisation of university spin-offs.
It is relevant, at the same time, to analyse the impact of the individual elements that integrate the relational capital (Table 1) separately, to be able to reach deeper conclusions that may allow us to find those that are stronger, creating a systemic approach regarding the success of the internationalisation of these companies. From this idea, the second hypothesis stems:

Table 1.
Relational Capital Elements.
Hypothesis 2 (H2).
There is a positive relationship among each of the relational capital elements and the internationalisation of university spin-offs.
The relationships with customers are some of the most widely studied ones, highlighting their relevance for companies, as well as the value of knowledge and information added to companies through them. On the other hand, relations with providers, competitors, partners, or collaborators and with government entities and bodies have been examined in lesser detail. The corporate reputation and image deserve a separate reference, as there is a greater disagreement between the authors who consider them to be part of the relational capital and those who reject them, considering that these do not have such a direct and significant effect on good corporate performance. Although some authors [21,23], and also the Intelect [26] and Intellectus [29] Models, include them as part of relational capital, others limit themselves to including them as indicators to measure any element within this capital [18,19]. In this research, it is considered as another element, since companies need to consider their reputation when choosing the right partners with whom to establish links in a given network and, consequently, obtain a better position in the network.
As a result, this research is aimed at paying special consideration to all of these elements, but this does not mean that some are more influential than others in firm internationalisation. Thus, the resulting sub-hypotheses are presented:
Hypothesis 2-1 (H2-1).
Relationships with customers have a positive influence on the internationalisation process of university spin-offs.
Hypothesis 2-2 (H2-2).
Relationships with suppliers have a positive influence on the internationalisation process of university spin-offs.
Hypothesis 2-3 (H2-3).
Relationships with competitors have a positive influence on the internationalisation process of university spin-offs.
Hypothesis 2-4 (H2-4).
Relationships with other companies (allies/collaborators) have a positive influence on the internationalisation process of university spin-offs.
Hypothesis 2-5 (H2-5).
Relationships with public entities and bodies have a positive influence on the internationalisation process of university spin-offs.
Hypothesis 2-6 (H2-6).
Reputation and image creation have a positive influence on the internationalisation process of university spin-offs.
Networks enable us to deepen our knowledge of how pre-existing relationships are established. Several studies have reported that networks attenuate the risks of moving into foreign markets [37], are helpful in detecting potential partners in other economies and aid in helping to identify new business leads [38,39], and decrease investment costs and time [40], thus allowing for a speedier internationalisation [39,41]. This leads to the following hypothesis to be tested in this paper. This hypothesis is assumed to be true, as it can be stated that those companies with extensive networks can internationalise earlier and more successfully [42]:
Hypothesis 3 (H3).
Having strong and reliable relationship networks has a positive influence on the internationalisation process of university spin-offs.
In the same way, it is relevant to analyse the characterisation and composition of the networks. In this way, according to the company’s commitment, it can belong to open networks (with weak links and information exchange between several actors) or closed networks (with strong links, focusing on social interaction and confidence) [43]. In this way, the existence of weak or strong links with each of the agents of the relational capital is examined, together with the level of knowledge of the agent, the intensity of the relationship or the level of trust, and the existence of personal or professional ties. Thus, in order to test the influence of the development of strong ties on the success of internationalisation, the following hypothesis is proposed:
Hypothesis 3-1 (H3-1).
Developing stronger linkages with the different elements of relational capital has a positive influence on the internationalisation process of university spin-offs.
Likewise, the time invested in these relationships established with the agents in the network and the use of resources affect the process of business internationalisation. For this reason, it is also necessary to analyse them, as both concepts (time and resources) have an impact on the strengthening or weakening of the links that the company establishes with the rest of the actors in the network [44]. This allows us to formulate the following hypothesis:
Hypothesis 3-2 (H3-2).
The degree of commitment, time devoted, and resources used by the company to establish, develop, or maintain relationships with the different elements integrating the relational capital have a positive influence on the internationalisation process of university spin-offs.
As for the type of relationship developed between the company and the rest of the agents in the network, different types of networks can be identified: formal or professional networks (with clients, suppliers, competitors, allies/collaborators, and public institutions), very relevant in the process of knowledge creation and technological innovation carried out by spin-offs [45]; and informal or social networks (with friends and family), essential in the success and development of this type of company, allowing access to the necessary information and resources provided by the different agents in the company’s environment [46,47].
In the way in which the firm enters an external market, it can do so directly or dyadically (direct relationship between the seller and the buyer, exercising greater control over its product and obtaining greater access to information, which implies greater risks and costs) or indirectly or triadically (relationship with a third party that acts as an intermediary between the seller and the buyer, which isolates the seller from the external market and, therefore, obtains a lower level of knowledge) [48]. As a consequence, it would be useful to propose the following hypothesis:
Hypothesis 3-3 (H3-3).
Formal and direct relationships with the different elements making up the relational capital have a positive influence on the internationalisation process of university spin-offs.
Thus, through the study of relational capital and the network theory, the way in which each of the relationships established by the company interacts with the different agents in the environment (clients, suppliers, competitors, allies or collaborators, and public organisations) and its reputation and image in relation to its internationalisation process is analysed. Figure 1 shows these relationships with the different elements of relational capital and networks with a graphical illustration of the hypotheses that have been developed.
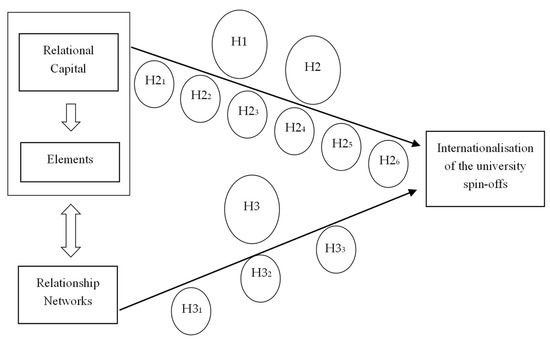
Figure 1.
MODEL CR-R-I.
3. Methods and Data
3.1. Model CR-R-I
Following the conclusions of the review of the available literature, the CR-R-I model was designed (Figure 1). It allows us to analyse the influence of relational capital on university spin-offs’ internationalisation. To draft it, the main emphasis was placed on those elements, variables, and indicators that have been most widely used by the different studies’ authors and which relate, at the same time, to the proposed hypotheses.
The model includes 3 components, 12 elements, and variables and indicators that measure these elements (Table 2, Table 3 and Table 4).
Table 2.
Components and Elements of Model CR-R-I.
Table 3.
Variables and indicators of the model.
Table 4.
Variables and indicators for networks.
To obtain the whole university spin-off population, information was requested through the phone or by email from the Office Network for the technology transference of the Spanish universities (Red OTRI) in the Region of Andalusia, integrated by a total of 8 universities. To verify whether or not these spin-offs are internationalised, the Iberian Balance Sheet Analysis System (SABI, according to its Spanish initials) database was queried and the spin-offs were also contacted directly. As a result, there was a population of thirty-six internationalised spin-offs. A questionnaire with five-point Likert scale questions was distributed to those internationalised spin-offs. The questionnaire was focused on the indicators measuring each of the variables of the proposed models and covers the largest number of items. Fourteen spin-offs completed the survey, resulting in a participation rate of 39%.
The entities under study operate in different areas of activity within the technology sector. Fifty percent of the companies operate in the area of biotechnology and agroindustry; the others are involved in activities related to ICTs, engineering and consultancy, renewable energies and aeronautics, and automation.
In terms of the international activity of the companies under study, 21.43% have been operating abroad for almost 5 years, 28.57% for more than 5 years, and 50% for at least 10 years. A portion of 28.58% carry out their international activity in fewer than 5 countries, 35.71% in 5 or more countries, and the other 35.71% are present in over 10 countries.
3.2. Results
3.2.1. General Data Analysis
Through Cronbach’s alpha, the internal consistency of the scales developed for each of the elements considered in Model CR-R-I was analysed. All values are over 0.7 (Table 5), except for the element Internationalisation, which has a value of 0.676, a value that can be acceptable [49], in particular, during the first stages of research [50] or in scales with fewer than ten items [51]. As a result, it can be stated that the established scales are internally consistent.
Table 5.
Reliability of each of the elements.
Through Bartlett’s test of sphericity, the suitability of the use of a factorial analysis was checked, and the null hypothesis was rejected for each variable (Sig. < 0.05) (Table 6 and Table 7).
Table 6.
Bartlett’s test of sphericity for each element (INT and CR).
Table 7.
Bartlett’s test of sphericity for each element (Networks).
The factor extraction method corresponds to the principal component analysis (PCA), which enables the joint treatment of the observed variables, reducing in this way the amount of data and identifying a group of dummy variables originating from the combination of the aforementioned observed variables.
By means of the explained total variance analysis, we can see how for the internationalisation element, 75.022% of the explained variance is obtained with just one component (Table 8).
Table 8.
Total variance explained for the element Internationalisation.
On the other hand, for the relational capital, the mean percentage of the variance explained by the variables in each moment of the model is 83.96% for the relationships with customers, 79.55% for the relationships with suppliers, 71.56% for the relationships with competitors, 75.23% for the relationships with allies and/or collaborators, 75.21% for the relationships with public bodies, and 66.99% for the reputation and image of the company (Table 9).
Table 9.
Total variance explained for the elements of the relational capital.
From the perspective of networks, for the element “relationship networks with customers”, only one component is obtained, whose eigenvalue is over 1, able to explain 73.17% of the explained variance. The mean percentage of the variance explained by the variables in the rest of the elements is 81.045% for the relationship networks with suppliers, 85.60% for the relationship networks with competitors, 72.97% for the relationship networks with allies and/or collaborators, and 80.24% for the relationship networks with public bodies (Table 10).
Table 10.
Total variance explained for the elements from the relationship network perspective.
The classification of the measurement variables of the elements of the relationship networks of the model prove to be appropriate.
To finish the factor analysis, the considered saturations or factor loadings were studied so as to conclude whether the considered variables coincide with those initially proposed in each of the built scales. For that purpose, an orthogonal varimax rotation with Kaiser normalisation was considered so as to enable a better interpretation. The achieved conclusion is that most of the considered variables clearly coincide with those initially proposed in each of the built scales. However, a reorganisation of the items is implemented within each of the measured variables.
3.2.2. Analysis of Relationships
The relationships among the elements of the model were observed by means of Pearson’s linear correlation coefficient, a linear measurement between two random quantitative variables, independent from the measurement scale of the variables.
Certain highly significant correlations among some of the variables (sig. < 0.01) were found through the obtained results, such as those between CRCL (customer relationships) and CRPR (supplier relationships), CRCL and RCL (networks with customers), CRPR and RCL, CRPR and RPR (networks with suppliers), CRAC (relationships with allies/collaborators) and RCL, CRCP and RCP (networks with competitors), RCL and RPR, and RAC (networks with allies/collaborators) and RPR. In the same way, there are also some clearly significant correlations between other variables (Sig. < 0.05), such as those between CRAC and CRPR, RCL and CRCP, RPR and CRCP, RPR and CRAC, and RAC and REP (networks with public bodies).
The bivariate correlation analysis proves the existence of highly significant correlations between some of them, such as for the relationships with customers and the relationships with allies/collaborators and suppliers. In the first case, an increase in the number of clients due to company internationalisation implies an increase in the volume of purchases, which, in turn, increases the negotiating ability of the company with its suppliers. In the same way, alliances with other companies or collaborations also entail a higher negotiation power with their suppliers, for example by means of the generation of business synergies created when using common sales channels or synergies when deriving a cost saving due to the increase in the volume of purchases.
In the same way, maintaining relationship networks characterised by strong links and a significant degree of engagement with suppliers in the local market could be extrapolated to the foreign market, as the company transfers its relationship with its suppliers in the domestic market abroad, not having to search for new suppliers in other markets, which may negatively affect the performance of its activities (delay in the delivery deadlines, quality of raw materials, quality of the relationship, etc.). As regards the relationships with competitors, belonging to a network entails the possibility of being able to learn from their experience, allowing companies to be more competitive and find different solutions that add value to the organisation, as well as the choice of which market to select.
In the same way, the relationship between allies/collaborators and public entities and bodies is logical, as the possibility of receiving joint subsidies from those public bodies to be able to tackle the internationalisation process increases the possibilities of those companies beginning their international adventure. As reflected by the companies of this case study, “incentives from public entities and bodies are very important, both those regarding funds and those related to received advice and information”.
3.2.3. Relational Capital Index
A Relational Capital Index was established to enable an easier understanding of the results obtained from the measurement of the different variables of the aforementioned relational capital. In this way, companies will have a tool allowing them to manage their relational capital and, in general, their intangible assets, more effectively. The creation of this index derives from the methodological proposal for the calculation of indices proposed by Trillo and Espejo [52], who established a measurement procedure for organisational culture, and the GESINCA index, related to intangibles and the total quality of the company [53].
Firstly, a particular index is defined for each item of the questionnaire. Then, a relational capital subindex from the point of view of such capital (I CR) and a relational capital subindex from the perspective of relationship networks (I CR-R) are created, establishing then the relational capital index for each of the companies under study.
The following Table 11 shows the results deriving from the creation of the Relational Capital Index, both from the perspective of the relational capital itself and for the relationship networks. Trillo and Espejo [52] establish as classification criterion as follows: if the index is over 1, the element is considered to be very strong; if it lies between 0.8 and 1, strong; an index between 0.5 and 0.8 is considered to be acceptable; and if the value is under 0.5, it is considered to be weak.
Table 11.
Relational Capital Index for each company.
In conclusion, we could say that most companies show an acceptable index, between 0.5 and 0.8. In this way, taking into account the first part of the questionnaire consisting of the items regarding the relational capital, 78.57% of the companies show an acceptable relational capital index, as compared to those showing a weak index, which amounts to 21.43%. As regards the second part of the questionnaire, items related to relationship networks, it shows that 7.14% of the companies have a very strong index, 85.72% have an acceptable index, and 7.14% of them have a weak one.
The general relational capital index could be compared with the sector average or with a group of companies. In this case, the average of the studied companies is taken into account (Table 12).
Table 12.
Sectoral relational capital indices.
Those elements showing higher indices correspond to the relationships with customers and with allies or collaborators, followed by the relationships with suppliers, which is in accordance with the relevance of these elements, both in the descriptive analysis that has been implemented and in a review of the literature, the relationships with customers being those that have been considered to be more significant in different studies on relational capital.
In the same vein, a weighted average is additionally presented according to the results obtained for each of the elements of the model. These results derive from the calculation of the average of the mark obtained by each element in the Likert-type questions, representing the average mark received for each element in percentages, allowing us to calculate the weighted average (Table 13). It should be mentioned that companies are responsible for deciding on the relevance of each element according to their strategic objectives. Thus, the average can be weighted depending on the weight allocated to each of the elements of the relational capital.
Table 13.
Calculation of weighted average.
As has been mentioned before, the acceptable index obtained by most of the companies reflects the corporate reality, where despite the increasing importance of relational capital to generate competitive advantages, companies need to invest more time and resources to consolidate the relationships of this capital to be able to achieve said competitive advantages, which can become business profits.
4. Discussion
In light of the obtained results, it can be stated that relational capital affects the business internationalisation of university spin-offs (H1). In particular, we have managed to examine in more detail how the relationship of the company with each of the relational capital elements affects its internationalisation process (H2), delving into the analysis of the characteristics of those relationships from the relationship network perspective (H3) (established links, acquired commitment, used time and resources, and type of relationship), which also have a positive influence on the internationalisation process of this kind of technological companies.
In this way, the positive influence of each and all of the relational capital elements in the internationalisation of the university spin-offs is confirmed. As regards the relationships with customers (H2-1), the relevance given to this element in the literature and in the data analysis is validated.
As regards the relationships with suppliers (H2-2), it would be necessary to make more effort to strengthen such relationships, as ensuring the supply of commodities and the quality of the products are essential within our current economy.
In terms of relations with competitors (H2-3), their positive influence is confirmed, but it is perceived as a limited one. This type of relationship needs to be serious and formal to translate into benefits for the company.
Concerning relations with allies/partners (H2-4), the achieved agreements and their compliance, the trust and flexibility of the existing relationship, the results derived from this kind of relationship, etc. offer to the company a significant competitive advantage and synergies of different types, both commercial or as regards supplies, increasing the negotiating potential of the company with other agents of the market.
As for relations with public entities and bodies (H2-5), the relevance of the information and economic subsidies provided by this type of body to the company during the initial stages of its internationalisation process is highlighted.
Regarding the reputation and image of the company (H2-6), brand recognition and perceived reputation moderately affect the aforementioned internationalisation process.
The results obtained are supported by other work carried out to date. Relational capital and relationship networks positively influence the good business performance of this type of technological and entrepreneurial company. The resources and information that are incorporated into the company through these relationships are very valuable from a strategic point of view, allowing greater success in internationalisation and achieving competitive advantages, which results in greater economic benefits [1,2,3,4,5,54].
Several works analyse relational capital [18,19,20,21,22,23,24,25,26,27,28,29], relational capital and high-tech firms [6,54], relational capital and relationship networks in an international context [1,16], and spin-offs as entrepreneurial and knowledge-transfer firms from the university to the economy and society [8,9,10,13].
Nevertheless, it is noteworthy that this research manages to provide a broad and integrative view of the key concepts on which it is based. This is in contrast to the existing literature, which does not jointly study the importance of relational capital, considering both individually and jointly each of its components, and the networks of relationships in the internationalisation of university spin-offs that are perceived as eminently entrepreneurially oriented.
5. Conclusions
The present research reveals that that relational capital management plays a critical role in achieving competitive advantages in business internationalisation. Relational capital influences the internationalization of university spin-offs in a positive way. In addition, the performance of a firm in its international activities depends on its capabilities to create and keep relationships with the relational capital agents. This way, a strategic analysis tool is developed focused on improving the management of relational capital in order to create value in one of the most influential sectors.
Due to the current globalised world, interconnected by ICTs, internationalisation for companies is not extended to a single question of survival but is vital to boost their innovation and competitiveness, which are immersed in a system of inter-organisational social networks that are key to their international development.
This pairing of the globalised economy and internationalisation highlights the importance of managing relational capital for business development and economic growth.
Internationalisation for companies is no longer just a matter of survival but is essential to further innovation and competitiveness. The complexity of the innovative process, which requires flexible, entrepreneurial, and forward-looking management, is facilitated through an international strategic management tool, which can constitute a starting point for its applicability to other industrial sectors and geographical areas.
It is worth mentioning that this research is just the first stage for a deeper study of the internationalisation phenomenon as regards the behaviour of each of the relational capital agents integrated into the internationalisation networks of the technological sector.
Finally, it should be noted that the main limitation of this research is related to the fact that it has a small sample of companies, given the small size of the population, since the research has been limited to internationalised university spin-offs in the Region of Andalusia, so that in future research the field of study could be extended to the whole of Spain, which would allow a larger population to be obtained and therefore a larger sample, which would lead to a more detailed and extrapolated empirical analysis. Along the same lines, the study could be extended to other countries, such as the United States, which is considered the country of origin of the spin-off, to establish comparative conclusions and thus enrich the facet of management guidelines.
Author Contributions
Conceptualization, M.d.C.P. and M.A.T.; methodology, M.d.C.P. and M.A.T.; software, M.d.C.P. and M.A.T.; validation, M.d.C.P. and M.A.T.; formal analysis, M.d.C.P. and M.A.T.; investigation, M.d.C.P. and M.A.T.; resources, M.d.C.P. and M.A.T.; data curation, M.d.C.P. and M.A.T.; writing—original draft preparation, M.d.C.P. and M.A.T.; writing—review and editing, M.d.C.P. and M.A.T.; visualization, M.d.C.P. and M.A.T.; supervision, M.d.C.P. and M.A.T. All authors have read and agreed to the published version of the manuscript.
Funding
This research received no external funding.
Institutional Review Board Statement
Not applicable.
Informed Consent Statement
Not applicable.
Data Availability Statement
The data presented in this study are available on request from the corresponding author. The data are not publicly available due to they are provided by private companies through the completion of a survey in which the confidentiality of the information provided by each of the companies was guaranteed.
Conflicts of Interest
The authors declare no conflict of interest.
References
- Federico, J.; Kantis, H.; Rialp, A.; Rialp, J. Does entrepreneurs’ human and relational capital affect early internationalization? A cross-regional comparison. Eur. J. Int. Manag. 2009, 3, 199–215. [Google Scholar] [CrossRef]
- Presutti, M.; Boari, C.; Fratocchi, L. The evolution of inter-organizational social capital with foreign customers: Its direct and interactive effects on SME´s foreign performance. J. World Bus. 2016, 51, 760–773. [Google Scholar] [CrossRef]
- Arora, P.; Kweh, Q.L.; Mahajan, D. Performance comparison between domestic and international firms in the high-technology industry. Eurasian Bus. Rev. 2018, 8, 477–490. [Google Scholar] [CrossRef]
- Kanishka, G.; Raman, T.V. Influence of Intellectual Capital on Performance: An Analysis of IT and Pharmaceutical Firms. Int. J. Hum. Cap. Inf. Technol. Prof. 2021, 12, 53–71. [Google Scholar] [CrossRef]
- Jelfs, P.; Smith, H.L. Financial performance studies of university spin-off companies (USOs) in the West Midlands. J. Technol. Transf. 2021, 46, 1949–1972. [Google Scholar] [CrossRef]
- Rodenes, M.; González, D. La influencia del capital relacional, innovación tecnológica y orientación al Mercado sobre los resultados empresariales en empresas de alta tecnología: Un modelo conceptual. Pensam. Gestión 2008, 25, 113–138. [Google Scholar]
- Guercini, S.; Runfola, A. Business networks and retail internationalization: A case analysis in the fashion industry. Ind. Mark. Manag. 2010, 39, 908–916. [Google Scholar] [CrossRef]
- Iglesias, P.; Maldonado, C.; Velasco, A. Caracterización de las spin-off universitarias como mecanismo de transferencia de tecnología a través de un análisis clúster. Rev. Eur. Dir. Econ. Empresa 2012, 21, 240–254. [Google Scholar] [CrossRef]
- Iglesias, P.; Maldonado, C.; Velasco, A. Comparación de la actividad de I+ D+ i de Spin-Off universitarias y otras organizaciones empresariales. Econ. Ind. 2014, 392, 155–168. [Google Scholar]
- Román-Martínez, I.; Gómez-Miranda, M.E.; García-Muñoz, T. Economic Contribution of University Spin-Off: A Regional Study of the Spanish Case. In Examining the Role of Entrepreneurial Universities in Regional Development; IGI Global: Hershey, PA, USA, 2020; pp. 215–240. [Google Scholar] [CrossRef]
- Pirnay, F.; Surlemont, B.; Nlemvo, F. Towards a typology of university spin-offs. Small Bus. Econ. 2003, 21, 355–369. [Google Scholar] [CrossRef]
- Treibich, T.; Konrad, K.; Truffer, B. A dynamic view won interactions between academic spin-offs and their parent organizations. Technovation 2013, 33, 450–462. [Google Scholar] [CrossRef]
- Audretsch, D.B. The entrepreneurial society & the role of the University. Econ. Marche J. Appl. Econ. 2013, 32, 6–16. [Google Scholar]
- Meramveliotakis, G.; Manioudis, M. History, Knowledge, and Sustainable Economic Development: The Contribution of John Stuart Mill’s Grand Stage Theory. Sustainability 2021, 13, 1468. [Google Scholar] [CrossRef]
- Dasgupta, P. The idea of sustainable development. Sustain. Sci. 2007, 2, 5–11. [Google Scholar] [CrossRef]
- Owais, W.O. Intellectual Capital Management and Reporting in Jordanian Universities. Res. J. Financ. Account. 2014, 5, 59–69. [Google Scholar]
- Hormiga, E.; Batista-Canino, R.M.; Sánchez-Medina, A. The role of intellectual capital in the success of new ventures. Int. Entrep. Manag. J. 2011, 7, 71–92. [Google Scholar] [CrossRef]
- Edvinsson, L. Intellectual Capital shapes the future enterprise. Scand. Insur. Q. 1993, 1. [Google Scholar]
- Kaplan, R.; Norton, D. Cuadro de Mando Integral (The Balance Scorecard) 1996; Gestión: Barcelona, Spain, 2000. [Google Scholar]
- Dow Chemical. Financial Report; Corporative Report; Dow Chemical: Midland, MI, USA, 1994. [Google Scholar]
- Brooking, A. Intellectual Capital. Core Asset for the Triad Millenium Enterprise; International Thomson Business Press: London, UK, 1996. [Google Scholar]
- Bontis, N. There is a price on your head: Managing intellectual capital strategically. Bus. Q. Verano 1996, 60, 41–47. [Google Scholar]
- Onge, H. Tacit knowledge the key to the strategic alignment of intellectual capital. Strategy Leadersh. 1996, 24, 10–16. [Google Scholar] [CrossRef]
- Sveiby, K.E. The Intangible Assets Monitor. J. Hum. Resour. Costing Account. 1997, 2, 73–97. [Google Scholar] [CrossRef]
- Roos, G.; Roos, J. Measuring your company´s intellectual performance. Long Range Plan. 1997, 30, 413–426. [Google Scholar] [CrossRef]
- Euroforum. Medición del Capital Intelectual: Modelo Intellectus; I.U. Euroforum Escorial: Madrid, Spain, 1998. [Google Scholar]
- Camisón, C.; Palacios, D.; Devece, C. Un Nuevo Modelo para la Medición del Capital Intelectual: El Modelo Nova X Congreso ACEDE; Universidad Oviedo: Oveido, Spain, 2000. [Google Scholar]
- CIC. Modelo Intellectus: Medición y Gestión del Capital Intelectual. Documento Nº 5; Universidad Autónoma de Madrid (Centro de Investigación sobre la Sociedad del Conocimiento, CIC): Madrid, Spain, 2003. [Google Scholar]
- CIC. Modelo Intellectus: Medición y Gestión del Capital Intelectual. Documento Nº 9/10; Universidad Autónoma de Madrid (Centro de Investigación sobre la Sociedad del Conocimiento, CIC): Madrid, Spain, 2011. [Google Scholar]
- Björkman, I.; Forsgren, M. Nordic International Business Reseach. A review of its development. Int. Stud. Manag. Organ. 2000, 30, 6–25. [Google Scholar] [CrossRef]
- Chang, Y. Benefits of co-operation on innovative performance: Evidence from integrated circuits and biotechnology firms in the UK and Taiwan. RD Manag. 2003, 33, 425–437. [Google Scholar] [CrossRef]
- Stuart, T. Interorganizational alliances and the performance of firms: A study of growth and innovation rates in a high-technology industry. Strateg. Manag. J. 2000, 21, 791–811. [Google Scholar] [CrossRef]
- Villanueva-Felez, Á.; Fernández-Zubieta, A.; Palomares-Montero, D. Propiedades relacionales de las redes de colaboración y generación de conocimiento científico: ¿Una cuestión de tamaño o equilibrio? Rev. Española Doc. Científica 2014, 37, 68. [Google Scholar] [CrossRef]
- Stewart, T.A. Intellectual Capital, The New Wealth of Organizations; Nicholas Brealey: London, UK, 1997. [Google Scholar]
- Roos, J.; Roos, G.; Dragonetti, N.C.; Edvinsson, L. Intellectual Capital, Navigating the New Business Landscape; Macmillan Business: London, UK, 1997. [Google Scholar] [CrossRef]
- Gogan, L.M.; Draghici, A. A model to evaluate the intellectual capital. Procedia Technol. 2013, 9, 867–875. [Google Scholar] [CrossRef]
- Musteen, M.; Francis, J.; Datta, D.K. The influence of international networks on internationalization speed and performance: A Study of Czech SMEs. J. World Bus. 2010, 45, 197–205. [Google Scholar] [CrossRef]
- Sharma, D.; Blomstermo, A. The Internationalization Process of Born Globals: A Network View. Int. Bus. Rev. 2003, 12, 739–753. [Google Scholar] [CrossRef]
- Child, J.; Hsieh, L.H. Decision mode, information and network attachment in the internationalization of SMEs: A configurational and contingency analysis. J. World Bus. 2014, 49, 598–610. [Google Scholar] [CrossRef]
- Lin, K.H.; Chaney, I. The influence of domestic interfirm networks on the internationalization process of Taiwanese SMEs. Asia Pac. Bus. Rev. 2007, 13, 565–583. [Google Scholar] [CrossRef]
- Kontinen, T.; Ojala, A. Network ties in the international opportunity recognition of family SMEs. Int. Bus. Rev. 2011, 20, 440–453. [Google Scholar] [CrossRef]
- Coviello, N. The network dynamics of international new ventures. J. Int. Bus. Stud. 2006, 37, 713–731. [Google Scholar] [CrossRef]
- Hilmersson, M.; Jansson, H. Internationalization of Small and Medium-sized Enterprises from the Baltic States to Mature Markets in the EU. J. Int. Mark. 2012, 20, 96–110. [Google Scholar] [CrossRef]
- Granovetter, M. The strength of weak ties. Am. J. Sociol. 1973, 78, 1360–1380. [Google Scholar] [CrossRef]
- McFadyen, M.A.; Semadeni, M.; Canella, A.A. Value of Strong Ties to Disconnected Others: Examining Knowledge Creation in Biomedicine. Organ. Sci. 2009, 20, 552–564. [Google Scholar] [CrossRef]
- Walter, A.; Auer, M.; Ritter, T. The impact of network capabilities and entrepreneurial orientation on university spin-off performance. J. Bus. Ventur. 2006, 21, 541–657. [Google Scholar] [CrossRef]
- Huang, H.C.; Lai, M.C.; Lo, K.W. Do founders’ own resources matter? The influence of business networks on start-up innovation and performance. Technovation 2012, 32, 316–327. [Google Scholar] [CrossRef]
- Sandberg, S. Experiential knowledge antecedents of the SME network node configuration in emerging market business networks. Int. Bus. Rev. 2014, 23, 20–29. [Google Scholar] [CrossRef]
- Hair, J.F.; Black, W.C.; Babin, B.J.; Anderson, R.E.; Tatham, R.L. Multivariate Data Analysis; Prentice Hall: Upper Saddle River, NJ, USA, 1998; Volume 5, pp. 207–219. [Google Scholar]
- Nunnally, J.C. Psychometric Theory; McGraw Hill: New York, NY, USA, 1967. [Google Scholar]
- Loewenthal, K.M. An Introduction to Psychological Tests and Scales; UCL Press: London, UK, 1996. [Google Scholar]
- Trillo, M.; Espejo, R. Propuesta metodológica para establecer un índice de cultura organizacional a través del capital intelectual. Estud. Econ. Apl. 2008, 26, 105–118. [Google Scholar]
- Hernández, J. Modelo de gestión empresarial según nuevas tendencias: Intangibles y calidad total. Aplicación al sector camaronero de Venezuela. Ph.D. Thesis, Universidad de Córdoba, Córdoba, Spain, 2013. [Google Scholar]
- Irazabal, M.I. Determinantes del Capital Relacional en la Innovación: Una Aplicación al Sector de Automoción Español. Ph.D. Thesis, Universidad del País Vasco-Euskal Herriko Unibertsitatea, Biscay, Spain, 2017. [Google Scholar]

Disclaimer/Publisher’s Note: The statements, opinions and data contained in all publications are solely those of the individual author(s) and contributor(s) and not of MDPI and/or the editor(s). MDPI and/or the editor(s) disclaim responsibility for any injury to people or property resulting from any ideas, methods, instructions or products referred to in the content. |
© 2023 by the authors. Licensee MDPI, Basel, Switzerland. This article is an open access article distributed under the terms and conditions of the Creative Commons Attribution (CC BY) license (https://creativecommons.org/licenses/by/4.0/).