Abstract
China’s socioeconomic transformation and rapid urbanization since the end of the 20th Century have had an important impact on the social spatial structure of large cities. Social differentiation within cities is becoming increasingly prominent. Using detailed data gathered by the Fifth National Population Census of 2000, this study compares the social spatial structure and dynamic mechanisms of the core areas of the cities of Beijing and Chengdu. Factorial ecology analysis is used at the mesoscale to explore the following research questions: ‘How did factors shape the social spaces of two cities with similar topography but at different stages of development during China’s transition from a planned to a market economy?’; and ‘Are the traditional Western theories of socio-spatial interpretation equally applicable to China?’. The results show that Chengdu exhibits a combination of a concentric circle, fan-shaped, and multi-core socio-spatial structure, while Beijing shows a fan-shaped structure. In 2000, influenced by its overall level and stage of socioeconomic development, Beijing was experiencing a faster socio-spatial transformation than Chengdu, and the driving effect of capital on social differentiation and spatial competition was more obvious. The main dynamic mechanisms driving the formation of socio-spatial structures in Beijing and Chengdu include the natural environmental foundation, historical inheritance, urban planning, housing policies, and international influence. The three major variables in the study of traditional Western social spaces, namely economy, family, and ethnic status, were confirmed as applicable to our two case study cities with socioeconomic status as measured by occupation and housing conditions exerting the strongest effect. This perspective of comparing different cities in the same transitional period offers unique insights in identifying the key drivers of socio-spatial differentiation and polarization and their relative magnitude of effect, while enriching the catalog of empirical urban social space research both in China and in the rest of the world.
1. Introduction
It is believed that urban social space is an urban space that social groups use and perceive, which is the product of social relationship and space, the result of continuous interaction of urban residents and urban space [1]. In 1949, scholars such as Shevky, Bell, and others used US population census data to summarize the urban structures of Los Angeles and San Francisco at a block level [2]. They concluded that there were three major influencing elements of social areas, namely socioeconomic status, family conditions, and racial background [3]. Murdie studied the social areas of Toronto in Canada and proposed an urban social space structure model with superimposed characteristics of these three elements [4]. They all played an important role in the residential spatial differentiation of European and American cities over the next 20–30 years [5]. With the influence of factors such as global industrial changes and the reconfiguration of social spaces, Western countries’ research into urban social space structures has continuously expanded [6]. From the 1960s to the 1990s, scholars in this field conducted empirical research into a large number of developed cities through factorial ecology analysis. Schnell and others have noticed that cities with a high degree of globalization may have a highly heterogeneous living space [7]. Knox conducted research in Baltimore in the United States in 1980, proposing that the four factors of the lower class, socio-economic status, race, and African-American families have a significant impact on the distribution of social spaces [8]. After the 1990s, urban social spaces, as they were affected by social transformation, became a research focus, as well as conducting research into post-socialist transformation, racial space isolation, and contradictions within social spaces [9]. The spatial representations of social phenomena based on different perspectives have also continued to be explored. Research content has expanded to include the relationship between urban socio-spatial structures and commuting patterns [10] or urban income compositions [11]. More recent studies have analyzed how urban spatial structures and their organization contribute to an inclusive and equitable socio-spatial evolution that is able to adapt to climate change [12]. Against the background of the COVID-19 pandemic, there has been a resurgence of research that aims to combine the concept of social resilience or vulnerability with urban socio-spatial structures in an effort to curb the spread of the pandemic, or as a tool for mitigation policy decisions [13], or to observe changes in citizen behaviors [14].
Western research into urban social spaces has evolved into a relatively complete system based on a large number of case analyses in developed capitalist countries, rather than in developing or socialist countries. Similar studies started significantly late in China, owing largely to the level of development and the lack of related data. The urban socio-spatial structures of Chinese cities have been largely influenced by the political and socio-economic backgrounds of different historical periods. Since 1978, China has gradually evolved from a planned to a market economy. The changes in the economic development path have triggered changes in social spaces. The complexity and specificity of the transition period have attracted the attention of many scholars. They have used national census data to analyze the social spaces of large eastern cities such as Shanghai [15,16,17,18,19], Guangzhou [20], Beijing [21,22], etc. Nevertheless, most research has focused on the static analysis of a single city or a specific time, while less has been conducted on less developed regions. Some scholars have analyzed the changes in social spatial structures in Xi’an under the influence of different economic and social backgrounds [23]. A number of scholars have analyzed Urumqi [24,25], Wuhan [26,27], Changchun [28], Chongqing [29], Chengdu [30,31], and other cities [32] from different perspectives. Research into the social space structures of large cities in China is constantly expanding and deepening, and its research systems and methodologies are gradually improving. Recent trends in domestic socio-spatial research are also in line with their international counterpart. On the one hand, research is focused on the impact of internet development on both physical and virtual spaces, using large-scale social media or mobility data to analyze social fragmentation and spatial reconfiguration [33,34,35,36]. On the other hand, research has also focused on the changes brought about by the protracted COVID-19 pandemic on urban social spaces [37].
In summary, most of the relevant studies in China have been based on census data, and research methods such as factorial ecology have been widely used. Meantime, the use of emerging big data to collect and analyze the socioeconomic characteristics of the population with selectable spatiotemporal scales and strong data timeliness is increasingly gaining popularity. The majority of the research areas are concentrated on first-tier cities in the eastern part of China, and less so on cities in China’s west. Research is being conducted mainly at the macro-scale, and meso-microscale studies remain relatively sparse. Research scopes have deepened from single-city static time-period analyses to dynamic evolutionary explanations, but there remains a lack of cross-sectional comparisons between different cities over the same periods. This paper therefore focuses upon three research questions: ‘Are the traditional Western theories and urban social space factors equally applicable in China, especially during the transition period from a planned economy to a market economy?’; ‘Under the same socioeconomic system, what are the differences between cities’ socio-spatial formation elements and driving mechanisms at different levels of urbanization and economic development during the same time period?; and ‘What are the implications of these differences for late-developing cities in terms of socio-spatial interventions and policy making aimed at a more balanced and sustainable urban structure?’.
This article proposes a new, three-pronged approach: (a) compared with the usual studies that focus on the socio-spatial structures of a city on a macro-scale, this study looks at the core areas of large cities on a mesoscale. As a result, the identification of the spatial distribution characteristics of different populations is more precise, and social area classification and socio-spatial structural models can be summarized more accurately; (b) instead of focusing on individual cities, this study applies a comparative perspective to cities at different levels of urbanization over the same socioeconomic transition period, thereby enriching the catalog of urban social space case studies and providing new perspectives and points of reference; (c) this study proposes to focus attention on the impact of natural substrates on urban socio-spatial structures, an angle largely ignored by antecedent studies, and also highlights the differences in the impact of globalization on big cities in different locations and developmental stages, thereby improving the theoretical explanation of the mechanisms behind the formation of social spaces. This paper is organized as follows: Section 1 systematically compares the progress of urban social space research at home and abroad, presents the shortcomings of the current research in related fields, and summarizes the research questions raised by, and contributions made by, this study; Section 2 describes the study area and the research data sources, and explains the reasons for their selection; and Section 3 presents an analysis of the research results. The latter part of this section summarizes the spatial characteristics of factors in the core areas of Chengdu and Beijing and classifies social areas into types. Comparisons between the socio-spatial structures and dynamic mechanisms of the two cities, and a discussion thereafter, are presented in Section 4; Section 5 summarizes the key findings and suggestions for future research.
2. Research Area and Data Source
Two typical plain cities in the east and west of China—Beijing and Chengdu, respectively—were selected as the case study areas. The urbanization rates of Beijing and Chengdu in 2000 were 77.5% [38] and 53.48% [39], respectively. The urbanization rates represent two cities at different stages of development and urban socio-spatial transformation, consistent with this study’s stated objectives. Beijing is China’s political, cultural, and international communication center. In demographic terms, a large number of high-end talents have gathered here; population growth within its core area was particularly high during the transition period. As the capital city of Sichuan Province, Chengdu is also the core city for the ‘The Development of the Western Region in China’, the ’Belt and Road’, the ’Yangtze River Economic Belt’, and the ’Chengdu-Chongqing Economic Circle’. Chengdu has therefore attracted a large number of laborers and ethnic minorities from other areas within Sichuan and its surrounding provinces [40]. In addition, the two cities have similar natural and cultural bases: in terms of their natural foundations, Beijing and Chengdu are both located on the slope plains in front of mountains, and their similar topography makes the socio-spatial development of the two cities identical. In terms of their socio-economic and cultural aspects, Beijing and Chengdu are the representative metropolises in the northeast and southwest regions of China with population agglomeration and cultural integration. During the socialist transition period, their social space structures have undergone tremendous changes.
From the perspective of land use, the ‘urban core area’ refers to the area which has continuous space and complete urbanization with no agricultural land [41]. This study selected the core districts of Beijing and Chengdu as research objects, as shown in Figure 1 and Figure 2. The core area of Beijing refers to the original four districts of Dongcheng, Chongwen, Xuanwu, and Xicheng, with a total area of 92.39 km2, covering 32 blocks. It is the core bearing area for national politics, economy, culture, and international exchanges. The core area of Chengdu includes five districts of Wuhou, Chenghua, Jinniu, Jinjiang, and Qingyang, with a total of 58 blocks and an area of 108.23 km2. This area is the main gathering place of historical culture, medical, educational, and commercial resources in Chengdu, and it is also the main concentration area of finance, commerce, science and technology, culture, information, services, and other industries in the southwest region of China. The core areas of the two case cities are similar both in scope and function, and there are also commonalities in their developmental histories. It is of therefore great value to compare the two core areas in terms of their urban social space structures and changes so as to explore the differences between cities in the east and west of China with different urbanization levels, and, further, to facilitate Chengdu’s avoidance of the mistakes and risks that Beijing has already encountered.
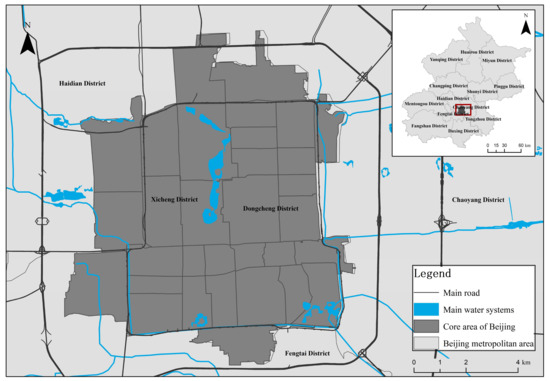
Figure 1.
Location map of core area of Beijing in 2000.
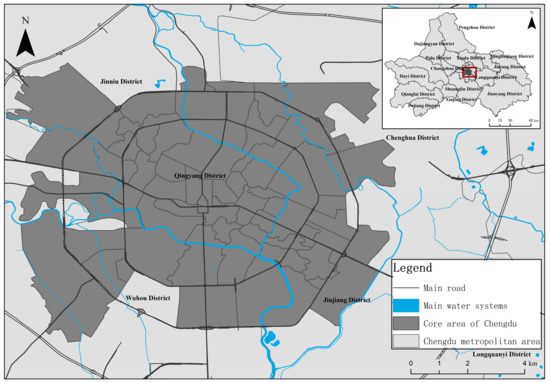
Figure 2.
Location map of core area of Chengdu in 2000.
Since the founding of the People’s Republic of China, seven National Population Censuses have been conducted, in 1953, 1964, 1982, 1990, 2000, 2010, and 2020, respectively. The First and Second National Population Censuses were relatively simple, with only a few basic questions asked. The Third and Fourth ones were improved, and the aggregated data provided a basis for the formulation of national policy and a medium and long-term socioeconomic development plan. Unfortunately, they also had flaws within their definition of urban and migrant populations. This study selected the Fifth National Population Census for the blocks and townships in Chengdu and Beijing as its research data. The reasons for this were: firstly, compared with the previous four population censuses, the Fifth National Population Census is relatively sound in all respects, adding questions regarding housing conditions for the first time, thereby better reflecting demographic characteristics; secondly, the actual starting point of China’s transition from a planned economy to a market economy was in 1992, and the years immediately following were an important period when China vigorously promoted reform and an open-door policy resulting in huge changes in urban social spatial structures. The Fifth National Population Census was conducted in 2000, and the corresponding effects of the economic transformation were most fully and obviously reflected by the data gathered by this census, meaning that this is a justifiable point in time at which to study the differences in socio-spatial changes between the two cities during this transition period; and thirdly, due to the high accuracy of census data for blocks and townships, and the strictness of scrutiny, the sixth and seventh censuses are difficult to access at this moment, especially in undeveloped cities such as Chengdu. According to the requirements of factorial ecology analysis, indicators such as the types of household registration, educational attainment, occupational structure, ethnic minority composition, floating population origin, and the per capita housing area, etc. were extracted for the study areas of the two cities.
Widely recognized socio-spatial drivers such as socioeconomic status, family conditions, and racial background were employed to select the variables needed for factorial ecology analysis, for comparing and summarizing the urban socio-spatial structure models based on a classification of social areas in Beijing’s and Chengdu’s core areas, and for exploring the dynamic mechanisms that shaped the models (Figure 3).
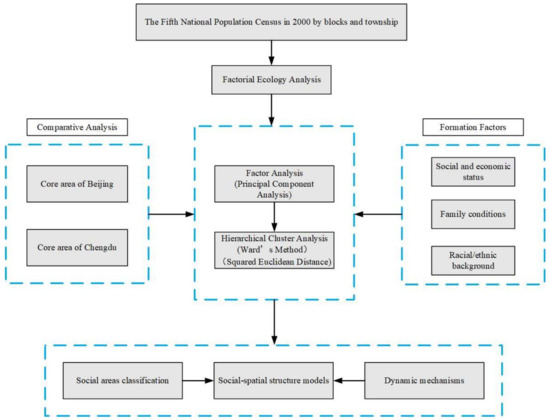
Figure 3.
Comparative research framework between Beijing and Chengdu core areas.
3. Methodology and Results
3.1. Methodology
The main quantitative method used in this study was factorial ecology analysis, a method that was first proposed by psychologist Charles Spearman in 1904. Using social areas analyses, North American geographers Bell and Van Arsdol constructed the concept of factorial ecology analysis. Thanks to the development of computer technology, this multivariate statistical analysis has become more widely used in urban socio-spatial analyses. Factorial ecology analysis is a combination of factor analysis and cluster analysis. It mainly uses factor analysis, principal component analysis, and correspondence analysis in multivariate analysis to quantitatively analyze the socio-spatial data of each statistical community, based on census or other socioeconomic data. The communities with scores of each factor are judged and clustered into different types of social areas, based on different kinds of clustering methods.
Factor analysis is mainly used in variable approximate reduction to extract a few composite factors from a number of intricate variables [42]. The prerequisite for factor analysis is the existence of a strong correlation between the observed variables; and the KMO (Kaiser–Meyer–Olkin Measure of Sampling Adequacy) value is usually used to help determine whether the observed data are suitable for factor analysis. A more rigorous criterion is 0.7, and 0.7 < KMO is considered suitable for factor analysis. The determination of the number of main factors is a key step in factor analysis. The most common method is to determine the importance of the main factors based on the eigenvalues, and thus decide how many main factors to select. Whether the retained factors are meaningful and easy to interpret is the main criterion when determining the number of extracted main factors.
Cluster analysis, also known as group analysis or point group analysis, is a quantitative approach to the problem of multi-factor object classification. The basic principle is to determine the affinity and estrangement among samples quantitatively using mathematical methods, according to certain indicators (such as similarity or difference), and to cluster samples according to the degree of affinity and the intrinsic attributes of the samples themselves [43]. In the study of social areas, cluster analysis is used to classify the results of factor analysis (areas with different main factor scores) to obtain different types of social areas [44]. Cluster analysis can be used to classify samples, often called Q-type clusters, usually using distance as the classification basis, and can also be used to classify variables, called R-type clusters, usually using a similarity coefficient as the classification basis. In general, this method is more applicable to sample classification [45]. There are four basic steps in cluster analysis: ① select suitable cluster variables; ② calculate the similarity between samples; ③ select the cluster method and determine the number of classes; and ④ verify and interpret the clustering results [45].
3.2. Socio-Spatial Structure of the Chengdu Core Area
3.2.1. Main Factors and Their Spatial Features
Here, principal component analysis is used to name and explain each main factor. In the selected factor analysis of the original variable correlation matrix, most of the correlation coefficients are >0.3, the KMO value is >0.7, and the Bartlett spherical test is passed. The model is reasonable and suitable for factor analysis. Six principal factors were extracted and the cumulative variance contribution rate was 92.046%, soundly reflecting the basic characteristics of the socio-spatial differentiation in Chengdu’s core area in 2000. The main factors that form the urban social spaces are named according to the degree of correlation between the main factors and the original variables (this paper takes ± 0.550 as the standard for dividing the degree of correlation), as shown in Table 1.

Table 1.
Main factor loads matrix of social space in Chengdu core area in 2000.
- (1)
- Minority ethnic population
The first principal factor has a strong positive correlation with the population sizes of the Mongolian, Hui, Tibetan, Yi, Manchu, Tujia, and Qiang minorities; the relevant variable load is >0.65, indicative of a minority population. The block with the highest score of this factor is located in the southwest corner of the first ring road, while the block with the lowest score is Tiao Deng River Block, on the periphery of the core area, as shown in Figure 4a.
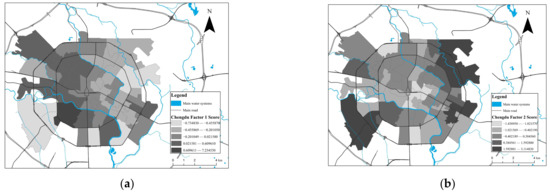
Figure 4.
Factor 1, 2 score map of Chengdu core area in 2000 ((a). Factor 1: minority ethnic population/(b). Factor 2: working-class population).
- (2)
- Working-class population
The second main factor is strongly correlated with the number of production, transportation, and related workers, and with the number of households with a per capita housing area of 12 m2 or below, for which the relevant variable load is >0.8. The number of households with a per capita housing area of 13–29 m2, the number of people with primary school education and below, with junior high school, senior high school, and secondary school education, and the number of commercial and service workers also show a strongly positive correlation. The relevant variable loads here are between 0.55 and 0.8. This category of the population is composed mainly of those with a low level of education, average general economic conditions, where people are mostly physical laborers; it was therefore termed the working-class population and is mainly distributed in the periphery of the first ring road, as shown in Figure 4b.
- (3)
- Middle-class and neighboring provincial migrant populations
The third main factor is closely related to the number of households with a per capita housing area of >30 m2, this relevant variable load is >0.8. The number of persons in charge of state organs, Party and mass organizations, enterprises and institutions, the number of floating population members, the number of clerical and related personnel, and the migrant population from the Chongqing Metropolitan Area, and Yunnan and Guizhou provinces (provincial administrative units surrounding Sichuan province) exhibit a strong positive relationship with the third main factor, with the relevant variable loads lying between 0.6 and 0.8, reflecting a population with a better socio-economic status, as well as a migrant population. These populations are mainly distributed in the western and southern suburban areas of Chengdu, as shown in Figure 5a.
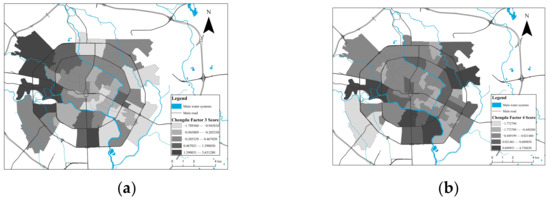
Figure 5.
Factor 3, 4 score map of Chengdu core area in 2000 ((a). Factor 3: middle-class and neighboring provincial migrant populations/(b). Factor 4: intellectual population).
- (4)
- Intellectual population
The fourth main factor exhibits a strongly positive correlation with the number of people with junior college, undergraduate, and postgraduate educational attainment, and is also strongly related to the number of locally registered residents and the number of professional and technical personnel. Of these groups, the loads of the first two variables are >0.8. This population category is usually characterized by a high level of literacy and people who are mostly engaged in intellectually demanding jobs, and is principally distributed on both sides of the first ring road, as shown in Figure 5b.
- (5)
- Sparse agricultural population
The fifth main factor is negatively correlated with the local population density and shows a strongly positive correlation with the number of agricultural residential registrations, and the number of agricultural, forestry, husbandry, fishery, and water conservancy production personnel. The relevant variable loads are >0.6, reflecting an agricultural population. This sparse agricultural population is principally distributed in the suburban rural areas of Chengdu’s core area, as shown in Figure 6a.
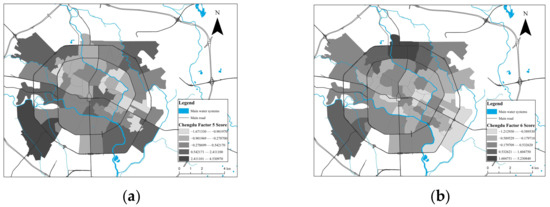
Figure 6.
Factor 5, 6 score map of Chengdu core area in 2000 ((a). Factor 5: sparse agricultural population/(b). Factor 6: migrant business population).
- (6)
- Migrant business population
The sixth main factor evinces a strongly positive correlation with the number of migrants from Zhejiang and Hubei provinces, and the number of business/service personnel. The first variable load of the population of Zhejiang and Hubei populations based in Chengdu is as high as 0.979. This part of the population is mainly composed of migrants engaged in the wholesale and retail trade, and is concentrated in the north and west of Chengdu, as shown in Figure 6b.
3.2.2. Social Areas Classification
By constructing the score matrix of the six main factors in each city block and using the distance measure of the Squared Euclidean Distance and Hierarchical Cluster, the types of urban social space in the Chengdu core area were divided into seven categories using the sum of the squares of deviations, i.e., the local agricultural population social area, the local working-class population social area, the middle-class and neighboring provinces migrant population mixed social area, the immigrant business population social area, the minority ethnic population social area, the intellectual population social area, and the agricultural and working-class population mixed social area (Table 2).
Table 2.
Main factor loads matrix of social space of Chengdu core area in 2000.
- (1)
- Local agricultural population social area
This social area has the most prominent mean square value and mean value for the second and third main factors; the mean value is negative, with only the fifth main factor (sparse agricultural population) exhibiting a positive mean value. A total of 16 blocks are included, 14 of which are located within the first ring road, and two in the southeast of the core area, outside the first ring road. This social area is mainly concentrated in the old city, with a significant focus on retail, catering, and light processing industries, and is the preferred place for suburban peasants who work as migrant laborers. Compared with the second type of social area, its sparse agricultural population factor is more prominent, meaning it can be most accurately termed a local agricultural population social area (see Figure 7).
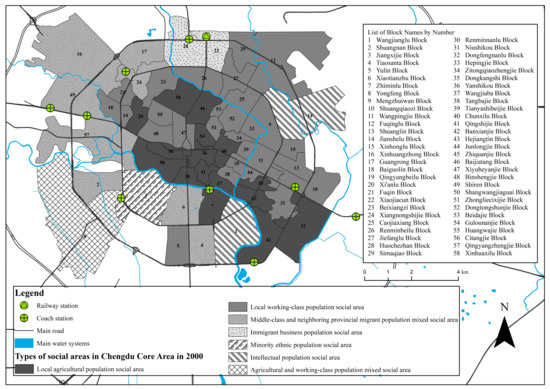
Figure 7.
Social areas classification of Chengdu core area in 2000.
- (2)
- Local working-class population social area
This social area has the most prominent mean square value and mean value for the sparse agricultural population factor, with a negative mean value, while the working-class population factor has a prominent mean square value and mean value. This social area includes a total of 28 blocks, 19 of which are located within the first ring road and are generally located in the northeast of this area and bordered by industrial production-oriented blocks such as Tiaodeng River Block. This social area is also in the old inner city and can be termed a local working-class population social area (see Figure 7).
- (3)
- Middle-class and neighboring provinces population mixed social area
This social area has the most prominent mean square value and mean value scores for the third main factor (middle-class and neighboring provincial migrant populations), with a positive mean value. The area includes a total of 8 blocks, which are mainly located in the rural–urban fringe on the periphery of the core area, close to the coach stations. This social area can be thus named because it is mainly inhabited by middle-class residents and migrants who have come to Chengdu from neighboring provinces (see Figure 7).
- (4)
- Immigrant business population social area
This social area has positive, and the most prominent, mean square value and mean value scores for the immigrant business population factor; the middle-class population and neighboring provincial migrant population factors are also prominent and have a negative mean value, including for the Xiaojiacun Block and the Railway Station Block. These two blocks are human and logistical flow hubs, where immigrant business populations from Jiangsu, Zhejiang, and Hubei Provinces are concentrated, so this district can accurately be termed an immigrant business population social area (see Figure 7).
- (5)
- Minority ethnic population social area
This social area has the most prominent mean square value and mean value for the first main factor (ethnic minority population), with the latter value being positive. The area is confined to the Jiangxi Block and is located in the southwest corner of the study area, within the first ring road. It is characterized by a concentration of members of the ethnic Tibetan population, but also includes members of the ethnic Mongolian, Hui, Manchu, and other minority ethnic populations, so it can be termed an ethnic minority population social area (see Figure 7).
- (6)
- Intellectual population social area
The mean square value and mean value scores for this social area in terms of the intellectual population factor are prominent and positive, while the mean square value and mean value scores for the middle-class population and neighboring provincial migrant population factor are prominently negative; the area includes two blocks, Wangjiang Road Block and Jianshe Road Block, which are located in the south and east of the area within the first ring road. In addition to high educational attainment, the professional and technical personnel population is also prominent in this area, and there are many universities, research institutes, hospitals, and new industries in these two blocks. This social area can thus be termed an intellectual population social area (see Figure 7).
- (7)
- Agricultural and working-class population mixed social area
This type of social area has the most prominent performance in the fifth main factor (sparse agricultural population) and the second main factor (working-class population) with a positive mean value. The mean square value and mean value in the fourth main factor (intellectual population) are prominent, and the latter is negative. It includes only Yongfengxiang Block, located in the southwestern part of the study area. This area is in the transition period from primary to secondary industries, and it has both a sparse agricultural population and working-class population, so this area is named as an agricultural and working-class population mixed social area (see Figure 7).
3.3. Socio-Spatial Structure of the Beijing Core Area
3.3.1. Main Factors and Their Spatial Features
By collating and analyzing original data from Beijing, this study constructed the basic datasets required for socio-spatial factor analysis in 2000, and extracted five main factors using principal component analysis, with the cumulative variance contribution rate reaching 91.979%, thereby accurately reflecting the basic characteristics of socio-spatial differentiation in the core area of Beijing (Table 3).
Table 3.
Main factor loads matrix of urban social spaces in Beijing’s core area in 2000.
- (1)
- Middle-class population
There is a strong positive correlation between the first main factor and 10 variables. These are: the number of people with junior college, undergraduate, and postgraduate education; the number of persons in charge of state organs, Party and mass organizations, enterprises, and public institutions; the number of people aged 60 and above; the number of locally registered residents; the number of professional and technical personnel; the number of clerical and related personnel; the number of members of the ethnic Mongolian population; and the number of households with homeownership. Related variable loads are mostly >0.6, and the first four variable loads are >0.7. This population class has a relatively high socioeconomic status in general, meaning that this factor can be accurately termed a middle-class population. This population is mainly located in the north and west of the study area, as shown in Figure 8a.
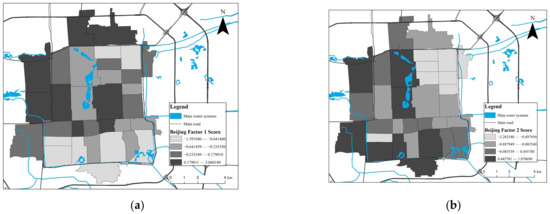
Figure 8.
Factor 1, 2 score map of Beijing Core area in 2000 ((a). Factor 1: middle-class population/(b). Factor 2: working-class population).
- (2)
- Working-class population
The second main factor is positively correlated with eight variables. These are: the number of surviving children of women at childbearing age; the number of people with primary and below, junior high, senior high, and secondary education; the number of agricultural, forestry, husbandry, fishery, and water conservancy workers; the number of commercial and service workers; and the number of production workers, transport workers, and related personnel. Among the population aged 6 years and above, the primary school and below, and secondary school education, loads are >0.65, and overall educational attainment is lower. The variable production and transportation workers and related personnel loads are >0.6. This category can be generally characterized as a population engaged in labor-skilled production, so it can be termed a working-class population. It is mainly located in the south and west of the study area, as shown in Figure 8b.
- (3)
- Relatively marginal population
The third main factor has a strong positive correlation with four variables. Of these, the number of self-built and rental housing households have variable loads >0.8. The number of members of the ethnic Manchu and Mongolian populations have variable loads >0.65. These loads jointly reflect the characteristics of a population without homeownership and a minority ethnic population; this population can therefore be termed a relatively marginal population and is mainly located in the northwest area within the city’s inner ring road, as shown in Figure 9a.
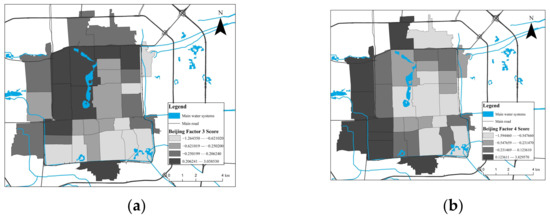
Figure 9.
Factor 3, 4 score map of Beijing Core area in 2000 ((a). Factor 3: relative marginal population/(b). Factor 4: special ethnic population).
- (4)
- Special ethnic population
The fourth main factor exhibits a strong positive correlation with the sex ratio and the number of members of the ethnic Hui minority population, with related variable loads >0.75. This category is mainly composed of a male population and an ethnic Hui population and can therefore be termed a special ethnic population. This population resides mainly in the southwest of the core area, as shown in Figure 9b.
- (5)
- Sparse large household population
The fifth main factor is correlated with the resident population density, with a variable load of −0.635, and is strongly positively correlated with the average household size, with a variable load of 0.876, exhibiting a low population density and higher than average family household size. This population can therefore be termed a sparse large household population. The distribution of the population in this category shows a scattered pattern, as shown in Figure 10.
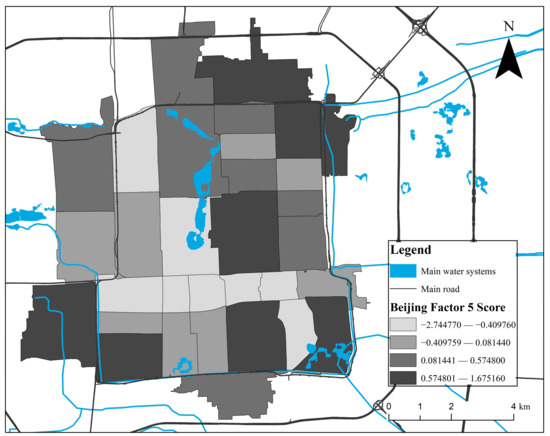
Figure 10.
Factor 5 score map of Beijing Core area in 2000 (Factor 5: sparse large household population).
3.3.2. Social Area Classification
By constructing the score matrix of the five main factors in 2000 for each city block, the results of the factor analysis were clustered to classify the types of urban social spaces. Six social areas were obtained and termed: the middle-class population social area; the working-class population social area; the high-density population mixed social area; the relatively marginal population social area; the middle-class and working-class population mixed social area; and the ethnic Hui population social area (Table 4).
Table 4.
Main factor loads matrix of social space of Beijing core area in 2000.
- (1)
- Middle-class population social area
This type of social area has the most prominent mean square value and mean value scores for the working-class population factor, where the latter value is negative. The mean value and mean square value scores for the sparse large household population factor are also prominent, where the former value is positive. This area includes 9 blocks such as the Andingmen, Chaoyangmen, and Donghuamen blocks, etc. It contains superior housing conditions and a population with higher-than-average incomes and can thus be termed a middle-class population social area (see Figure 11).
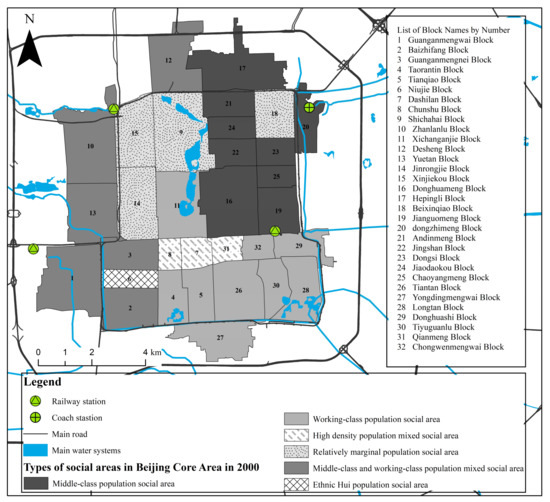
Figure 11.
Social areas classification of Beijing core area in 2000.
- (2)
- Working-class population social area
This social area has the most prominent mean square value and mean value for the second main factor (working-class population), where the mean value is positive, while the mean square value and mean value for the first main factor (middle-class population) are prominent, where the latter value is negative. This area includes 9 blocks, including Chongwenmenwai, Donghuashi, and Longtan blocks, etc. Income levels are lower, reflecting this population class, and the area can therefore be termed a working-class population social area (see Figure 11).
- (3)
- High-density mixed population social area
This social area has the most prominent mean square value and mean value for the sparse large household population factor, with a negative mean value, and has prominent mean square and mean values for the working-class population factor, where the mean value is also negative. The area includes three blocks, i.e., the Chunshu, Dashila, and Qianmen blocks. This area has a high population density and a complex population composition, so can be termed a high-density mixed population social area (see Figure 11).
- (4)
- Relatively marginal population social area
This social area has the most prominent mean square value and mean value for the third main factor (relatively marginal population), with the latter value being positive. The area includes the four blocks of Beixinqiao, Jinrongjie, Shichahai, and Xinjiekou. It reflects the characteristics of minority ethnic and non-homeownership populations on the relative margins of society, so can be termed a relatively marginal population social area (see Figure 11).
- (5)
- Middle-class and working-class population mixed social area
This social area has the most prominent mean square value and mean value scores for the middle-class population factor, with a positive mean value, as well as prominent mean square value and mean value scores for the working-class population factor, where the latter value is positive. The area includes six blocks, including Baizhifang, Desheng, and Guang’anmennei, etc. This social area reflects the characteristics of middle-class and working-class populations, so can be termed a middle-class and working-class population mixed social area (see Figure 11).
- (6)
- Ethnic Hui population social area
This social area has the most prominent mean square value and mean value for the fourth main factor (special ethnic population), and both are positive, indicating a higher proportion of males and a larger Hui population. The area is confined to the Niujie Block and can be termed a Hui population social area (see Figure 11).
4. Comparison and Discussion
4.1. Comparative Analysis between Chengdu and Beijing
4.1.1. Socio-Spatial Factors
- (1)
- Working-class populations
The working-class population in Chengdu is mainly concentrated in the periphery of the central area, distributed along the second ring road and extending to the northeast. The overall factor score is higher in the northeast and southwest, related largely to the layout of the secondary industry sector in the city. The blocks with a high working-class population concentration are dotted with factories and basic commercial markets. One of these blocks, the Fuqing Road Block, is located in the northeast of Chenghua District, and contains factories and warehousing logistics companies within its jurisdiction; a series of wholesale markets has been built to take advantage of the development of these warehousing logistics companies. The Niushikou Block is located in the eastern suburbs of the city, and contains production and service industry premises, attracting a large number of people to work here, thereby gradually forming an area predominantly inhabited by a working-class population.
The working-class population in Beijing is mainly distributed in the Xicheng, Xuanwu, and Chongwen Districts, as shown in Figure 8b. In 1990, the reconstruction of the old city put forward by the Beijing Municipal Government proposed the relocation of industrial land out of the inner city, meaning that a large number of factories covering a vast land area and characterized by low output rates and serious pollution levels that were located at the periphery of the core area were gradually replaced by residential and commercial buildings. Historically, Xuanwu District has been densely populated, with many dilapidated houses and a poor municipal infrastructure [46], so foreign investors have been less willing to develop real estate projects in this area. All these factors, such as the transformation of the old city, the differential investment of foreign capital, the shift from labor-intensive industry to a service economy, and industrial relocation and gentrification, have led to the rise of a mixed middle-class and working-class population in Xuanwu District, with the dominant population in Chongwen District remaining working class.
- (2)
- Middle-class populations
Overall, the middle-class population in Chengdu is concentrated in the western and southern suburbs of the city, areas called the ‘Noble West and Rich South’. By contrast, the middle-class population in Beijing is concentrated in the western and eastern parts of the city, areas called the ’Noble West and Rich East’.
The western margins of the city of Chengdu have a rich cultural heritage, including the Wuhou Temple, which commemorates Zhuge Liang, the prime minister of the Shu Dynasty; Jinli, one of the oldest and most famous commercial streets in western Sichuan; and Wen Weng’s stone room, a school that has been operating for more than 2000 years without interruption, etc. This area lies in an open and elevated terrain, and since the majority of the city’s dignitaries have lived in the west of the city, it is called the ‘Noble West’. The Party School of the Sichuan Provincial Committee of the Chinese Communist Party, the Sichuan Academy of Social Sciences, the Chengdu City Archives, and other government agencies are located in the western suburbs of the city. The western edge of the second ring road, the core area, has a large number of new, high-end residences, and has therefore attracted a more middle-class population. Historically, there were no large factories or residential houses in the south of Chengdu, but around 2000, as the city continued to expand, the south was gradually developed and utilized, and its relatively low land prices created conditions that were conducive to the development of high-quality residences. For example, with the influx of foreigners from the consulate area and foreign enterprises’ investment zone in the Tiaosanta Block, real estate enterprises took advantage of the opportunity provided by the construction of business buildings in the foreign affairs district to develop commercial real estate projects, and built a large number of new, high-end residential areas in the 1990s, gradually developing them into a ‘rich zone’.
In Beijing, following the reigns of the Yongzheng and Qianlong emperors of the Qing Dynasty, large gardens and palaces were built in the western suburbs, such as the famous ‘Three Mountains and Five Gardens’, which includes the Summer Palace and the Yuanmingyuan Garden. The emperor usually lived in the Yuanmingyuan Garden, so the royal family built most of the palaces on the western side of the city for easy access to the court. In addition, Yuquan Mountain and Kuming Lake in the west of Beijing were the water sources for the royal family, and the living environment around it was splendid, so a large number of dignitaries gathered here, eventually leading to the urban spatial pattern characteristic of Beijing’s western suburbs (and called the ‘Noble West’). This spatial differentiation between living spaces reflective of the different social attributes of residents was still evident in the division between different social area types around 2000. In Beijing, military compounds and government offices such as central and municipal agencies are located in the west. In the late Qing Dynasty, Jun Zhen’s ‘A Brief History of the Places Where Emperors Live’, a book that is also a miscellany of Beijing’s local customs and history, notes that, “there is a proverb in the capital that goes ‘Noble West and Rich East’”. With the Imperial City taken as the center, ‘East’ refers to the area around Chaoyangmen and Dongzhimen, where many wealthy merchants and warehouses were concentrated. The East Side was also the favored site of financial institutions: the ‘Four Great Heng’ old-style Chinese private banks and many banks opened by foreigners in the late Qing Dynasty were located in the East. In addition, around 2000, after the massive renovation of the old city, a series of high-quality residential neighborhoods, luxury villas, and high-class apartments sprang up in this prosperous district in the east of Beijing, where high-income groups such as entrepreneurs, cultural and sports stars, and embassy personnel replaced former populations living there, filtering the population in Beijing’s core area and promoting its gentrification, as well as perpetuating the urban socio-spatial structure of the city’s richer eastern suburbs.
- (3)
- Sparse agricultural populations
Firstly, a sparse agricultural population factor was identified only in the core area of Chengdu, with a more prominent factor score for the Yongfeng Block, a suburban rural area with a well-developed agricultural sector in the 1980s. After the introduction of new industries in the early 1990s, agricultural activity in the area had declined considerably by 2000; the block was experiencing a period of dynamic transition from primary to secondary industry, as shown in Figure 6a. Secondly, the new Huangzhong, Dongfeng South Road, and Banxianjie blocks are all located in the urban–rural junction near the second ring road, and are also experiencing the same industrial transformation period with a large number of agricultural households originally resident within these blocks. Thirdly, the Chunxilu Block, located in the center of Chengdu, has historically been a prosperous location for trade and commerce. With compact land use and a high building density, it has become the preferred destination for migrant laborer populations from neighboring areas. However, there has been no fundamental breakthrough in the population management mechanisms governing this urban–rural duality due to the unresolved problem of farmers’ household registration. As a result, there is an abnormally high agricultural population in the Chunxilu Block. Compared to the socio-spatial structural pattern of the Beijing core area, the conversion of agricultural land and activity in Chengdu has been a relatively slow process, and there remains a vast urban–rural transition area with a large agricultural population. In contrast, the core area of Beijing has completely replaced its former primary industries, forming a continuous and compact urban area.
- (4)
- Migrant populations
The migrant population of Chengdu is larger in the north than in the south of the city, and larger in the west than in the east. The migrants in the north of the city mostly come from Zhejiang, Hubei, and other provinces. They are mainly concentrated in Chengdu’s transportation hubs, such as railway and coach stations. On this basis, wholesale markets such as the Lotus Pool and Five Stones markets have gradually developed; these are the city’s top wholesale markets for daily necessities and small commodities. Most of the migrants in the west of Chengdu come from neighboring provinces in southwest China, such as Yunnan and Guizhou provinces, and the Chongqing Metropolitan Area. They rely on long-distance bus terminals for trade. The west of the city has thus gradually developed into a hub for trading and construction materials.
Beijing’s migrant population factor is not prominent. The two high-value migrant population factor areas are the Guang’anmenwai Block in the southwest corner of the core area, near Beijing West Railway Station, and the Chongwenmenwai and Donghuashi blocks in Chongwen District, near Beijing Railway Station. These blocks, close to major railway stations and termini, have temporarily become areas where migrant populations are concentrated. Beijing has only one permanent migrant population variable, while Chengdu has added a migrant population source variable, so the analytical results for Chengdu are more comprehensive.
In both cities, the migration population concentrations are strongly associated with transportation hubs, showing a significant distance-decay effect. The migrant populations concentrated near the coach stations mainly come from other areas within each native province and from neighboring provinces, while the migrant populations that have gathered near the railway stations mainly come from more distant provinces. Moreover, migrant populations of different origins can be connected with different occupations. A continuous influx of migrant populations has had a major impact on the formation of each city’s urban social space.
- (5)
- Intellectual populations
The intellectual population of Chengdu is mainly scattered on both sides of the first ring road and is evenly distributed in all directions. The agglomeration of intellectuals is closely related to the layout of universities, research institutes, hospitals, or high-tech industries. For example, the Wangjianglu Block possesses the highest concentration of intellectuals in the Chengdu core area because the number of people enrolled in Sichuan University accounts for two thirds of the total population within it.
The Xiaotianzhu Block is known as ‘Chengdu Technology Street’ and is the distribution center for electronic information products in western China. Within the area are the West China Hospital of Sichuan University and the West China Stomatology Hospital, institutions that are among the best hospitals in southwest China. Other blocks with a high intellectual population factor score are characterized by personnel with high levels of education, such as university teachers and students, engineers, as well as members of state organs or large state-owned enterprises. For example, the Qingyangzhengjie Block boasts universities and institutions such as the Sichuan Academy of Social Sciences and the Southwestern University of Finance and Economics, and the Tiaosanta Block is the main foreign affairs area of Chengdu.
Intellectuals in Beijing are classified as middle class, and these populations are mainly concentrated in the western and northern urban core areas, including the Yuetan, Zhanlanlu, Hepingli, Desheng, Chunshu, Jinrongjie, Donghuamen, and Qianmen blocks. For example, the National Development and Reform Commission, the Ministry of Finance, the National Radio and Television Administration, the All-China Federation of Trade Unions, and other state agencies are all located in the Yuetan Block.
The distribution of intellectuals in the two cities is closely related to the locations of colleges and universities, research institutes, high-tech industries, and state agencies. The socio-spatial distribution patterns of these areas are similar to those of other middle-class populations. During the housing welfare system (Danwei) period, most intellectuals working in scientific research institutions and state agencies lived within their work unit’s community housing near their workplaces, so the distribution of intellectuals in both cities was spatially agglomerated during the transition period.
- (6)
- Minority ethnic populations
Chengdu’s minority ethnic population is concentrated only in the Jiangxi Block in the southwest corner within the first ring road. Historically, Chengdu was an important transportation node between the central government and the Tibetan area. Since the Ming and Qing Dynasties, the Tibetan population has been concentrated in the Jiangxi Block. At present, institutions such as the Southwest Minority Ethnic University and the Chengdu Office of the People’s Government of the Tibet Autonomous Region are located here. It is noteworthy that the data show that some northern Chinese nationalities also have relatively large populations in Chengdu, such as the Manchu, Hui, and Mongolian ethnic minorities, but there is no obvious agglomeration in terms of spatial distribution, indicating their better social integration. During the reign of Emperor Kangxi of the Qing Dynasty, Chengdu was rebuilt, and the Mancheng (Shaocheng, or ‘small city’) Palace was built in the west within the overall ‘big city’ structure to serve as a residence for the descendants of the Manchu Eight Banners, the Qing Dynasty’s military organization. Royalty and nobility lived separately from the ordinary people of Chengdu [47], who lived in this ‘small city’. Until the collapse of the Qing Dynasty in 1911, the military government controlled the Mancheng. After the collapse of the city walls, the streets of the ‘small city’ and the ‘big city’ linked up, and descendants of the Eight Banners, officials, and aristocrats began to live in the same city with ordinary people. This represents a time when the hierarchical social spaces broke down and spatial integration was achieved [48].
The minority ethnic populations in Beijing’s core area are principally composed of members of the Hui population, residing mainly in the Xicheng and Xuanwu districts, with the Niujie Block having the most prominent minority ethnic population factor. The concentration of the ethnic Hui population is related to the locations of mosques, and the Niujie Block has historically been a Hui settlement. Owing to their long migration history, it has been easy for the Hui population to settle in the inner city and continue to socially migrate, as shown in Figure 11. It is noteworthy that most of the residents living in the alleys built by Mongolians (‘Hutong’) during the Qing Dynasty were the descendants of the Manchu Eight Banners. With the decline of the Qing government, the original owners either lived incognito and identified as Han ethnicity or moved to other places, but eventually they all integrated into society through successive generations and did not inhabit particular enclaves. The formation of minority ethnic population clusters has a certain historical heritage, with most of them spatially distributed at the edge of the old city.
4.1.2. Socio-Spatial Structural Models
Based on Figure 7 and Figure 11, the socio-spatial structural models of Chengdu’s and Beijing’s core areas can be summarized as follows. Chengdu shows a concentric circular structure, interspersed with fan-shaped and multiple cores, and Beijing shows a fan-shaped structure (see Figure 12). The socio-spatial structure of Chengdu’s core area in 2000 can be roughly divided into three concentric zones. The high-density local residential circle mainly occupies the area within the first ring road and extends from the northeast and southeast to the second and third ring roads. The mixed middle-class and migrant population circle is mainly distributed in a circular pattern in the western and southern parts of the second and third ring road areas within the core area. The minority ethnic population nucleus is mainly located in the southwest corner of the area bounded by the first ring road. The intellectual population’s multi-nuclei are mainly distributed in the south and east of the second and third ring road zones. The mixed agricultural and working-class population is mainly located on the southwestern sides of the second and third ring road areas, as shown in Figure 12.
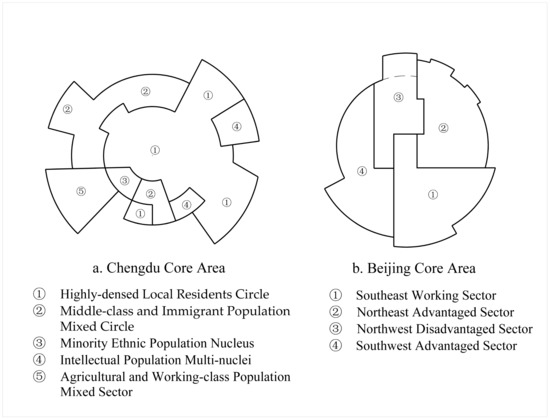
Figure 12.
Comparison of socio-spatial structure between Chengdu and Beijing core areas in 2000.
The socio-spatial structural model of Beijing’s core area in 2000 can be divided into four major sectors. The eastern part is further split up into northern and southern subsectors. The northeastern sector is the old Dongcheng District, mainly inhabited by a population with a high socioeconomic status; the southeastern sector is dominated by Chongwen District and is mainly inhabited by a working-class population. The western sector can also be divided into two subsectors, i.e., an inner and outer subsector, the northwestern inner subsector being dominated by Xicheng District and mainly inhabited by a relatively marginal population, and the southwestern outer subsector predominantly falling within Xuanwu District, including that part of Xicheng District outside the second ring road, and containing a mixed social area of middle-class and working-class populations.
4.1.3. Degree of Socio-Spatial Differentiation
In 2000, the urban development of Chengdu was lagging behind that of Beijing, and the margins of Chengdu’s urban core were still transitional zones between urban and rural land, and surrounded by farmland at the periphery (see Figure 12). Moreover, 74.14% of the blocks in Chengdu belonged to the first and second social areas and could not be clearly categorized. In contrast, Beijing, as the national capital, had a core area that could be classed as construction land in 2000 [49], and socio-spatial differentiation was more obvious than that in Chengdu.
Beijing was the political center for the Ming and Qing dynasties, when the socio-spatial differentiation within the city was constrained by the feudal system. The stratification of social classes established the city’s urban social space patterns and has had a lasting impact on its structure. In 1990, Beijing conducted a large-scale reconstruction of the old city, mainly involving the planning and construction of the central business district (CBD), the relocation of industrial land, and the transformation of residential areas in the old city, etc. In the context of the inflow of foreign capital and policies that engender the relocation of certain populations, social differentiation and spatial competition as determined by economic status has intensified, meaning that the differentiation between, and characteristics of, the socio-spatial structures within Beijing’s core area are more clearly defined. Differently from Beijing, Chengdu, as a safe haven, was flooded with tens of thousands of people and various institutions such as factories and schools after the outbreak of the anti-Japanese war in 1937. In modern times, Chengdu’s urban social spaces have undergone successive rounds of what can be termed a ‘great reshuffle.’ Only the minority ethnic population’s social area and the middle-class population’s social area have partly retained their traditional social pattern [50]. Chengdu had not reconstructed its old city by the year 2000, and the impact of foreign capital was limited. The differentiation between, and characteristics of, its socio-spatial structures were not therefore particularly marked.
4.1.4. Dynamic Mechanisms
- (1)
- Natural environmental foundations and historical inheritance
Both Chengdu and Beijing are located on an inclined piedmont plain, a subtype of the inland plain basin, but their relationships with the surrounding areas differ. Chengdu is located in southwestern China, west of the Sichuan Basin and east of the Longmen Mountains and west of the Longquan Mountains. However, Beijing is located in the northern part of the North China Plain, with the Yanshan Mountains to the north and the Taihang Mountains to the west. Beijing’s terrain slopes slowly to the southeast toward the Bohai Sea, forming the so-called ‘Beijing Bay’. Beijing, as the core city of the Beijing–Tianjin–Hebei urban agglomeration, is China’s national political center [51]. The topography of the region shapes the city’s functional zoning and developmental axes. Urban planning policy has facilitated the growth of Beijing and Chengdu eastward and southward as a whole, with both cities showing a certain similarity in the overall trend of urban construction. In both cities, the dignitaries and bureaucrats lived, and live, in the west, a factor which has much to do with the natural topography of the two cities and their ancient layout.
The history of Chengdu can be traced back to the ruins of Xinjin Baodun about 4500 years ago. After the Qin Dynasty unified Shu County, a complete set of urban construction standards was formed. During the Qin Dynasty, the two rivers (the Pi and Liu) flowed through what was then the southwestern part of the city. As a result of frequent flooding, the eastern part of the city became the center of urban development, and its governmental district and residential area, while the western part was the business district. In the late Tang Dynasty, Chengdu’s spatial landscape changed. Pian Gao, a Shu official, built Luo City and a weir in Mizao to change the course of the waterway of the Pi River (now the Fu River), allowing it to flow around the northeast of the city. This controlled the threat of flooding and eventually formed a ‘two rivers encircling’ pattern [52], as shown in Figure 13. After this flood control scheme was implemented, the western part of the city was gradually occupied by dignitaries.
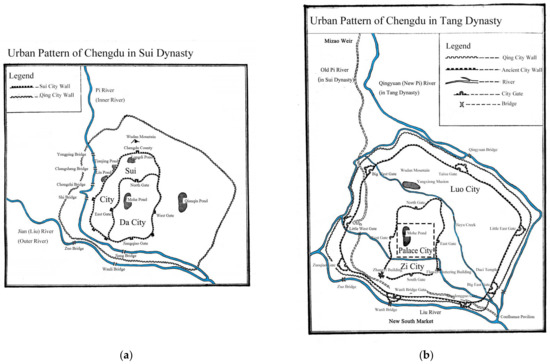
Figure 13.
Schematic diagram of river changes from Sui to Tang dynasties in Chengdu [52]. ((a). Urban pattern of Chengdu in Sui Dynasty/(b). Urban pattern of Chengdu in Tang Dynasty.
After Jian Wang, the founding emperor of the Former Shu Dynasty, invaded Chengdu and proclaimed himself emperor, the Palace City was built, and the ancient Chengdu urban structure of ‘Luo City–Zi City–Palace City’ came into existence. During the Emperor Kangxi’s reign in the Qing Dynasty, Chengdu rebuilt the city wall next to the moat. Mancheng (the ‘small city’) was built in the west as a residence for the Qing rulers. The Qing Dynasty’s urban structure can still be seen in Chengdu’s concentric zones today [50].
It is noteworthy that, with changes in the urban landscape pattern, the urban social spaces also changed. During the Qin Dynasty, merchants of low social status gathered in the western part of what was later the ‘small city’. After the risk of flooding had been eliminated, the west of the city gradually became occupied by dignitaries, and in the Qing Dynasty, the ‘small city’ became clearly isolated from the ‘big city’. The construction of the Chengdu Mansion during the Qing Dynasty laid the foundations for the urban pattern and population differentiation in the old urban area of modern Chengdu. Chengdu’s western sector retains this historical footprint of the ‘Noble West’.
Historical inheritance also plays an important role in Beijing’s population differentiation. Beijing has been the political center since the Yuan Dynasty. Its socio-spatial structure was based on the principle of the ’ideal’ planned layout contained in the Book of Artificers (Kao Gong Ji), which defined the urban spatial pattern as a uniform, regular, and hierarchical square, surrounded by a city wall [53]. Called Dadu during the Yuan Dynasty, this pattern of social and/or racial segregation had certain distinguishing characteristics. The ‘Outer City–Inner City–Imperial City’ urban model of construction was formed during the Qing Dynasty. The Forbidden City, where the emperor lived, was located in the center of Beijing. The second ring was inhabited by the siblings of the emperor and other people of imperial lineage, while the Manchu ministers and generals inhabited the third ring; ethnic Han ministers and generals lived in the Outer City [54]. In general, Beijing kept its traditional Chinese urban socio-spatial structure for more than seven centuries until the foundation of the new People’s Republic of China in 1949 [53]. Today’s center of power remains in the core area of central Zhongnanhai and the Forbidden City. Some of the high-end quadrangle courtyards on the outskirts of the Forbidden City are also home to celebrities such as movie stars and international tycoons. Although this concentric zonal structure has no direct spatial representation, its implicit social stratum meaning is generally recognized. The original Inner City, the Imperial City, and the central government district in the south constituted a huge administrative area, which divided the Inner City into two parts. The ‘Rich East and Noble West’, each with their own characteristics, laid the foundations for the differences between the eastern and western sectors of modern inner Beijing (see Figure 14) [55].
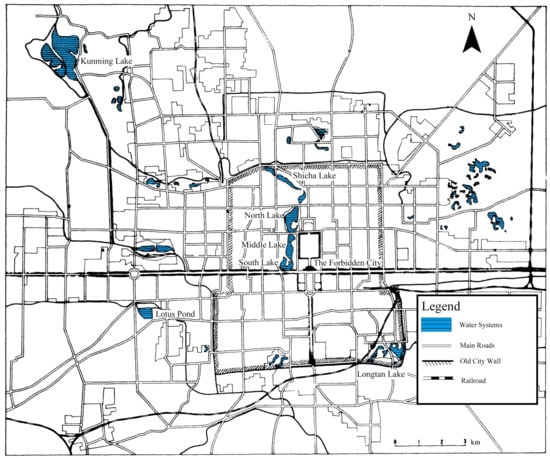
Figure 14.
Overview of Beijing’s urban spatial structure and major water systems [55].
Chengdu’s Jiangxi Block area became a transit hub for tributary envoys as well as one of the tea-horse trade routes, due to the tributary relationship between Tibetan areas and the central government during the Ming and Qing dynasties. Tibetans began to settle here and continue to do so today [47]. Similarly, the Niujie Block, inhabited by the Hui ethnic minority, and the anonymous Manchu settlement in the quadrangle courtyards of Beijing, represent the marks history has left on the population distribution within these two cities. This shows that the overall structure of each city and their demographic differentiation retain a strong historical continuity, and the clustering of different populations within the cities represent the integration of these groups of people into the city and their sense of belonging to the land.
- (2)
- Urban planning
A government’s influence on urban construction can be embodied in the development of strategic planning and other urban planning schemes, or it can indirectly influence the decision-making of enterprises and individuals through economic regulation, thereby affecting the evolution of urban social spaces.
The 1954 version of the Chengdu Master Plan put forward a circular development mode, set up industrial zones in the suburbs of the city, universities and scientific research units in the southern and western suburbs, and residential areas mainly within the second ring road. The distributional patterns of the working-class and intellectual populations in Chengdu have gradually taken shape. The 1982 Chengdu Master Plan proposed building an urban pattern of production areas in the east and residential areas in the west, with a series of high-end neighborhoods located in the western part of the city forming the city’s ‘Noble West’. The 1996 Chengdu Master Plan proposed the formation of six developmental axes along traffic arteries, with the central city as the core, an adjustment to the industrial structure of the eastern suburbs, and the implementation of a ‘reduce the proportion of secondary industry and develop tertiary industry’ policy. The city’s developmental pattern has changed from a core to a point-axis developmental pattern; the 1996 Chengdu Master Plan had already included a clear southward development axis, gradually forming a ‘Rich South’ pattern. However, due to a certain lag in planning, the working-class population of Chengdu was still concentrated in the northeast of the city in 2000, forming a ‘Poor East’ pattern. The construction of Chengdu City has been mainly based on axial development and outward expansion, resulting in developmental differences between each direction, expressed as indicative of a ‘Poor East and Noble West, Chaotic North and Rich South.’
During the First Five-Year Plan (1953–1957), Beijing was defined as ‘a modern industrial base and a science and technology center’ by the central planning office for industrial development. In the urban layout, priority was given to the location of industrial areas; other facilities such as residential buildings basically unfolded around these industrial areas. During the Cultural Revolution (1966–1976), due to the stagnation in urban planning, the construction of the inner city was chaotic, and factories and warehouses were built among residential areas, causing great inconvenience to both industrial production and people’s lives. The 1982 Beijing Urban Construction Master Plan was the first version of a city-wide urban plan to be promulgated after the implementation of China’s reform and open-door policy; this corrected the previous over-industrialization, removing the expression ‘economic center’ from its previously stated position at the heart of the city. This urban plan began to focus on the construction of the urban environment. The urban function and land use structure of the old city was reconfigured by the large-scale renovation of dilapidated buildings, leading to the emigration of both the population and industry. The 1992 Beijing Urban Master Plan set as a goal the ’planning and construction of the Beijing central business district (CBD)’ as a manifestation of a change to being both a ‘world-famous ancient capital and a modern international city’. This has brought great changes to the socio-spatial structure of the core, especially to Xicheng District, which has experienced massive urban renewal and reconstruction. The development of the CBD brought about large-scale construction, which played a role in engendering the migration of the original low-end industrial population outward, while at the same time attracting new high-income residents, thus actively filtering the population and facilitating a social class evolution.
In summary, urban planning plays an irreplaceable role in shaping urban social spaces and is also an important guarantee for maintaining the measured and consistent development of cities. Comparing the overall urban planning of Chengdu with that of Beijing, it was found that Chengdu mainly expanded to the west and south before 2000. However, there was no large-scale ‘old inner-city reconstruction’ as in Beijing in Chengdu’s core area, so many old residential areas remain in the center of its core area, and its population is composed mainly of local residents. Beijing’s core area has been altered by urban planning and the power of capital in a market economy, making the area’s socio-spatial structure more complex and the population types more diverse, with a predominantly high-income population, and a gradual gentrification.
- (3)
- Housing policies
Housing policy is an important factor in shaping the residential spaces and the differences between them, and thus contributing to the formation and development of urban socio-spatial structure [56]. The Institutional School argues that, based on the socioeconomic and political background of different countries, the form and extent of governmental intervention in the housing market through housing policies are important for the formation and evolution of urban social spaces. During the planned economy era before the implementation of the economic reform and open-door policy, the government adopted the work unit (Danwei) housing welfare system, meaning that employees lived in accommodation contained within the units where they worked. Different units made different levels of investment in their communal housing projects. The differences in housing conditions between units and communities made them isolated to a certain extent [57]. Meantime, even within the same work units, the housing acquired by different workers may have varied according to their length of employment, age, position, and educational background [58].
With the transformation of China’s socioeconomic system, the housing system accordingly changed from a planned to a market economy system. In July 1998, the work unit housing welfare system ended, housing allocation was monetized, and market forces gradually began to play their role in real estate. Housing system reform established different residential supply systems for different income groups [59]. The high-income group now had a wide choice of residences and tended to choose the areas with superior locations and abundant resources, while the low-income group had no choice but to live in areas with poor facilities because they could not afford the inflated prices of more upmarket residential areas. The reform of the housing system has not only greatly impacted the original work unit communities but has also promoted a systemic transformation from job–housing integration to job–housing separation and accelerated the migration of the population within the urban social spaces, thus promoting the reconfiguration and reorganization of urban social structures.
Beijing’s housing prices were high from the beginning because of its unique location [60] and national role compared to other cities in the country, as well as its superior medical and educational facilities. The implementation of the urban land use compensation policy also sped up the process of the urban renewal of inner Beijing, resulting in accelerating socio-spatial disparities [53]. In 1992–1997, about 90% of commercial home sales were group purchases, with strong institutional purchasing power driving up prices. High taxes and fees for shared institutional infrastructure purchases also contributed to higher house prices. High-income groups such as executives of financial and securities companies, cultural and entertainment stars, and managers of high-tech enterprises were able to afford high house prices. However, the abnormally high prices of commercial housing, as well as an inadequate supply of low-cost and affordable housing, made the market unaffordable for low- and middle-income groups, thus resulting in unimproved access to housing for lower-income groups. The old urban areas of Beijing were gentrified and saw significant capital investment. Conversely, although Chengdu’s core areas were also affected by changes in housing policy, social polarization and spatial segregation was not so severe. As part of its housing project for low-income families implemented in Chengdu, the municipal government reduced or exempted 13 taxes and fees and introduced a series of measures to promote affordable housing. Large- and medium-sized state-owned enterprises built affordable houses using individual fund-raising programs, unit subsidies, state loans, and governmental policy support to solve the housing difficulties of middle- and low-income employees. The population of Chengdu’s core area has therefore remained composed mainly of the old Chengdu population of locally registered households. Guided by a macroscale housing policy, the choice of housing available to different social classes has promoted the formation and reconstruction of the urban social space.
- (4)
- International influence
International influence on the evolution of Beijing’s urban social spaces originated from the construction of the embassy area at the end of the Qing Dynasty and the beginning of the period known as the Republic of China (1911–1949), the introduction of industrial technologies, and the Beijing Plan during the Japanese occupation of the city (1937–1945). After the founding of the People’s Republic of China in 1949, experts from the Soviet Union participated directly in the formulation of the Beijing City Master Plan. Since then, a strengthening internationalization, the location selection of foreign direct investment, the impact of the 1990 Asian Games, and other major international events have greatly influenced the spatial pattern and social composition of Beijing and its core area. Since the implementation of China’s reform and open-door policy, Beijing has become increasingly internationalized and has positioned itself as a ‘modern international city’, transforming its traditional function as a manufacturing center into a service and high-tech industry hub. During this process, the involvement of international capital has promoted the simultaneous growth of skilled and high-wage jobs in management and low-wage jobs in manufacturing, leading to a polarization of the distribution of income and jobs in the city [61,62], and, in turn, the polarization of the capital’s urban social spaces.
By contrast, due to its location on an inland plain far from the sea, and with no shipping access, Chengdu is not well connected to the outside world. In China’s west, Chengdu is a central city of strategic importance, but in the context of globalization, Chengdu has lagged behind eastern cities due to its congenital deficiency of location, a previous lack of policy inclination, and insufficient capital investment. In 1999, the Central Committee of the Chinese Communist Party put forward the initiative of ‘The Development of the Western Region in China’. Facing an historic opportunity, Chengdu has gradually undertaken the industrial transfer from the eastern region. However, Chengdu’s ability to attract foreign investment remains underdeveloped, its reliance on investment-driven economic growth is inadequate, the secondary industry sector is too large, and the proportion of high-tech, high value-added products within the secondary industry remains relatively small. Around 2000, the degree of internationalization in Chengdu was relatively low, and the degree to which globalization had made the city’s urban spatial pattern unequal remained limited, resulting in less of an impact on the reconfiguration of the city’s urban social spaces.
The process of globalization has become one of the forces influencing the development of cities, and the theory of globalization has become increasingly powerful in explaining the processes behind urban change. Some scholars believe that the evolution of urban spaces can be affected by globalization at the block level [63]. The role of globalization in the urban core greatly alters employment patterns and residential space differentials. When high-tech, high-income personnel and a low-tech, low-income labor force are agglomerated and differentiated within the employment space, the former is more capable than the latter of occupying a superior location and living environment. In short, globalization has led to ‘territorial or inter-place inequality’, as well as ‘inter-personal inequality’ or ‘social income distribution inequality’, making the rich richer and the poor poorer. In contrast to Chengdu, international influence is particularly evident in the core of a global city such as Beijing, causing a major shift in its socio-spatial pattern.
In this section, a comparison between the core areas of Beijing and Chengdu was based on four aspects, i.e., socio-spatial factors, socio-spatial structures, the degree of socio-spatial differentiation, and the dynamic mechanisms that shape the socio-spatial structures of Beijing and Chengdu. Table 5 is used to compare the key features of Beijing and Chengdu, showing more clearly the differences between the two.
Table 5.
Comparison between key features of urban social spaces in Chengdu’s and Beijing’s core areas.
4.2. Discussion
At the end of the 20th Century and the beginning of the 21st Century, China’s socioeconomic transformation and rapid urbanization have had an important impact on the socio-spatial structures of large cities. However, even within the same transition period, cities with different geographical/topographical locations and varied urbanization levels have experienced significantly different socio-spatial formation factors and structures.
In the core areas of Beijing and Chengdu, the factors forming the socio-spatial structure that are the same are the working-class and middle-class populations, as well as minority ethnic populations. The distribution of the working-class population is strongly related to the layout of the secondary industry sector, while the distribution of the middle-class population is greatly influenced by cultural and ecological conditions. The spatial manifestations of these two factors and the driving mechanisms behind them are similar in both cities. Ethnic minorities form clear enclaves in the core areas of both Chengdu (Tibetans) and Beijing (Hui), showing that the clustering of ethnic groups is related to both historical and geographical factors. Disparities between the main factors for the two cities exist in their sparse agricultural populations, migrant populations, and intellectual populations. The sparse agricultural population factor was not identified in the core area of Beijing, which is more urbanized, while Chengdu’s peripheral urban area remains in the transition period from primary industry to secondary industry, with large areas of farmland still evident. The migrant populations of both cities continue to be concentrated around their transportation hubs, while the spatial differentiation within, and occupational composition of, populations from different provinces could be identified in Chengdu’s migrant population. Beijing’s intellectual population can be included in the middle-class population factor.
Within Chengdu’s main population factors, five can be related to socioeconomic status, and only one can be related to ethnicity. Similarly, three of the main population factors in Beijing are related to socioeconomic status (one of which is simultaneously related to ethnic status), while the remaining two are separately related to ethnic status and family conditions. Accordingly, it is evident in the two cities that ethnic status and family conditions have certain impacts on the social space. Nevertheless, socioeconomic status plays a decisive role in shaping the urban social spaces of the core areas of these two cities.
The natural environmental substrate has shaped the functional zoning and developmental axes of the two cities. Their overall structure and demographic differentiation evince a strong historical continuity. In both cities, the high-income classes live in the more ecologically advantageous western suburbs, while their differential distribution is principally related to urban planning and construction and different levels of capital investment, as well as being influenced to some extent by the historical role of river traffic. Urban master plans have played an irreplaceable role in shaping the urban social spaces of the two cities and guarantee their measured and consistent urban development.
In 2000, Beijing was more urbanized and had developed faster than Chengdu. Beijing had completed a massive renovation of the old city and the population in the core area had been gentrified to some extent. This process was accompanied by social problems such as cultural and historical dilution, the fragmentation of the urban fabric, the dissolution of the everyday, traditional life of old Beijing City, and the local residents’ loss of their roots. Chengdu, on the other hand, in the same transition period, focused more on its spatial expansion mainly to the west and south along axial development corridors. In the process of development, late-developing cities can absorb the experience of the first-developed cities, and Chengdu City has learned from Beijing’s developmental experience. Using small-scale, gradual, ‘acupuncture-style’ core area renovation, Chengdu has successfully preserved its urban fabric, cultural roots, and original residents’ living spaces to a much greater extent. This has shown that subsequent urban development and construction should be prudent and far-sighted in policy making toward producing a more balanced and sustainable urban socio-spatial structure.
5. Conclusions
Based on the data of the Fifth National Population Census in 2000, this study compared the socio-spatial structures and dynamic mechanisms of the core areas of Beijing, the capital of China, and Chengdu, a major city in southwestern China. The results showed that Chengdu has a combination of a concentric circle, fan-shaped, and multi-core socio-spatial structure, while Beijing has a fan-shaped structure. In Beijing’s core area, its social differentiation and polarization is more complex than that of Chengdu, its speed of transformation has been faster, and the driving role of capital on the social differentiation and competition for space is more marked. The principal drivers behind the formation of socio-spatial structures in both cities include the natural environmental foundations, historical inheritance, social planning, housing policies, and internationalization. The three major variables in traditional Western socio-spatial studies—economic, family, and ethnic status—were confirmed as variables in both case cities cited in this study, with the biggest influence coming from socioeconomic status as indicated by occupation and housing conditions.
In terms of research content, this study considered many influencing factors and drivers, but ignored the impact of the development of large-scale industrial parks in the same transition period. In terms of research methodology, this study used traditional statistical data analysis, which does not pay sufficient attention to the individuals [64]. In terms of data selection, subsequent studies will continue to be supplemented by newer and more detailed indicators and data such as the sixth and seventh national censuses, and the evolution of urban social spaces will be further explored. Due to the limitations of scale, a discussion of special urban social spaces requires deeper analysis. The integration of qualitative research methods and big data vis-à-vis urban social space studies will be simultaneously pursued in the future. With the development of big data and data mining technology, analysis based on big data can effectively supplement the timeliness and accuracy of socioeconomic characteristics [65,66], and it is therefore imperative to embrace the paradigm shift that is being driven by the massive accumulation of big data in the mobile internet era.
Author Contributions
Conceptualization, C.X.; methodology, C.X.; data curation and analysis, C.X., Q.A. and Z.G.; writing—original draft preparation, Q.A., Z.G. and X.Y.; writing—review, C.X.; writing—translation, Q.A., Z.G., X.Y. and J.Z.; writing—modification, Q.A., Z.G., J.Z. and K.T.; visualization, Z.G.; supervision, C.X.; project administration, C.X.; funding acquisition, C.X. All authors have read and agreed to the published version of the manuscript.
Funding
This research was funded by “The 13th Five-Year Plan of National Economic and Social Development of the People’s Republic of China” Planning Project of Social Science Research in Sichuan Province (NO. SC21B094) and Open Funding Project of the Key Laboratory of the Evaluation and Monitoring of Southwest Land Resources (NO. TDSYS202103).
Institutional Review Board Statement
Not applicable.
Informed Consent Statement
Not applicable.
Data Availability Statement
Not applicable.
Acknowledgments
We express our sincere gratitude to the reviewers for their valuable comments and suggestions, as well as to Yanmei Yang, Ju Liu, Xin Tong, and Yan Qian for helping us collect data.
Conflicts of Interest
The authors declare no conflict of interest.
References
- Soja, E.W. The Socio-spatial Dialectic. Ann. Assoc. Am. Geogr. 1980, 70, 207–225. [Google Scholar] [CrossRef]
- Shevky, E.; Williams, M. The Social Areas of Los Angeles, Analysis and Typology; University of California Press: Berkeley, CA, USA; Los Angeles, CA, USA, 1949. [Google Scholar]
- Shevky, E.; Bell, W. Social Area Analysis: Theory, Illustrative Application and Computational Procedures; Stanford University Press: Stanford, CA, USA, 1955. [Google Scholar]
- Murdie, R.A. Factorial Ecology of Metropolitan Toronto, 1951–1961: An Essay on the Social Geography of the City; Department of Geography, University of Chicago: Chicago, IL, USA, 1969. [Google Scholar]
- Johnston, W.M. The Austrian Mind: An Intellectual and Social History, 1848–1938; University of California Press, Ltd.: Berkeley, CA, USA; Los Angeles, CA, USA, 1972. [Google Scholar]
- Li, Z.G.; Wu, F.L. Sociospatial Differentiation in Transitional Shanghai. Acta Geogr. Sin. 2006, 61, 199–211. (In Chinese) [Google Scholar]
- Schnell, I.; Benjamini, Y. Globalisation and the Structure of Urban Social Space: The Lesson from Tel Aviv. Urban Stud. 2005, 42, 2489–2510. [Google Scholar] [CrossRef]
- Knox, P.; Pinch, S. Urban Social Geography: An Introduction Six edition; Pearson Education Limited: London, UK, 2010. [Google Scholar]
- Van Noorloos, F.; Steel, G. Lifestyle Migration and Socio-spatial Segregation in the Urban(izing) Landscapes of Cuenca (Ecuador) and Guanacaste (Costa Rica). Habitat Int. 2016, 54, 50–57. [Google Scholar] [CrossRef]
- Lin, D.; Allan, A.; Cui, J. The Impacts of Urban Spatial Structure and Socio-economic factors on patterns of commuting: A review. Int. J. Urban Sci. 2015, 19, 238–255. [Google Scholar] [CrossRef]
- Modai-Snir, T.; Van Ham, M. Reordering, Inequality and Divergent Growth: Processes of Neighbourhood Change in Dutch Cities. Reg. Stud. 2020, 54, 1668–1679. [Google Scholar] [CrossRef]
- Barbosa, V.; Suárez Pradilla, M.M. Identifying the Social Urban Spatial Structure of Vulnerability: Towards Climate Change Equity in Bogotá. Urban Plan. 2021, 6, 365–379. [Google Scholar] [CrossRef]
- Galacho-Jiménez, F.B.; Carruana-Herrera, D.; Molina, J.; Ruiz-Sinoga, J.D. Evidence of the Relationship between Social Vulnerability and the Spread of COVID-19 in Urban Spaces. Int. J. Environ. Res. Public Health 2022, 19, 5336. [Google Scholar] [CrossRef]
- Champlin, C.; Sirenko, M.; Comes, T. Measuring Social Resilience in Cities: An Exploratory Spatio-temporal Analysis of Activity Routines in Urban Spaces during Covid-19. Cities 2023, 135, 104220. [Google Scholar] [CrossRef]
- Yu, W. Research and Planning of Urban Social Space. City Plan. Rev. 1986, 10, 25–28. [Google Scholar]
- Zhu, J.M. Analysis of the Socio-spatial Structure of Shanghai’s Population. Chin. J. Popul. Sci. 1995, 49, 21–30. [Google Scholar]
- Huang, Y. Models of Urban Residential Segregation: Residential Segregation in Metropolis Shanghai. Urban Plan. Forum 2005, 156, 31–37. [Google Scholar]
- Zhao, M.X. Research on the Social Spatial Distribution of Floating Population in the Central City of Shanghai. Geomat. World 2006, 31–38. [Google Scholar]
- Liao, B.G.; Xu, J.G.; Xuan, G.F.; Qi, Y.; Mei, A. Evolution of Residential Space Structure in Shanghai Central City Based on Land Use from 1947 to 2000. Acta Geogr. Sin. 2008, 63, 195–206. [Google Scholar]
- Xu, X.Q.; Hu, H.Y.; Ye, J.A. Factor Ecological Analysis of the Socio-spatial Structure of Guangzhou City. Acta Geogr. Sin. 1989, 44, 385–399. [Google Scholar]
- Feng, J.; Zhou, Y.X. Restructuring of Socio-spatial Differentiation in Beijing in the Transition Period. Acta Geogr. Sin. 2008, 63, 829–844. [Google Scholar]
- Feng, J.; Zhong, Y.C. Restructuring of Social Space in Beijing from 2000 to 2010. Acta Geogr. Sin. 2018, 73, 711–737. [Google Scholar]
- Wang, Y.; Liu, K. Evolution of Urban Socio-Spatial Structure in Modern Times in Xi’an, China. Sustainability 2017, 9, 1935. [Google Scholar] [CrossRef]
- Zhang, L.; Lei, J.; Zhang, X.L. Analysis of the Urban Social Areas in Urumqi. Acta Geogr. Sin. 2012, 67, 817–828. [Google Scholar]
- Jia, X.T.; Lei, J.; Zhang, X.L. Social Spatial Structure of Urumqi City During the Period of Republic of China. J. Univ. Chin. Acad. Sci. 2018, 35, 795–804. [Google Scholar]
- Tian, Y.P. The Effects of Urban Renewal on Urban Socio-spatial Segregation. Popul. J. 2012, 196, 72–80. [Google Scholar]
- Feng, J.; Zhang, Q.N. Urban Socio-spatial Structure and Differentiation: A Case Study of Wuhan. Urban Dev. Stud. 2021, 28, 66–78. [Google Scholar]
- Huang, X.J.; Huang, X. Evolution of Changchun’s Social Spatial Structure in the 20th Century. Prog. Geogr. 2013, 32, 1629–1638. [Google Scholar]
- Zhang, Z.T.; Liu, Y. The Social Spatial Structure in the Central Urban Area of Chongqing Based on Data of Census 2000. Hum. Geogr. 2015, 30, 43–49. [Google Scholar]
- Luo, R.Y.; Zhong, Y.L.; Zong, J.F. Study on Social Spatial Structure of Chengdu in the Transitional Period: Based on the Data of Sixth National Population Census in China. Areal Res. Dev. 2018, 37, 73–79. [Google Scholar]
- Luo, R.Y.; Zhong, Y.L. Socio-spatial Structure of Chengdu and Its Evolution (2000–2010). Resour. Environ. Yangtze Basin 2019, 28, 768–782. [Google Scholar]
- Wu, Z.G.; Liu, Y.; Zhou, C.S. The Structure and Formation Mechanism of Socio-Spatial Evolution in the Immigration City: A Case Study of Zhuhai. J. South China Norm. Univ. (Nat. Sci. Ed.) 2020, 52, 77–90. [Google Scholar]
- Chen, X.P.; Zhou, S.H.; Li, Q.P. Research on Social Differentiation of Urban Road Network in Guangzhou: Gender Differences of Travel Distribution Based on Trajectory Data. Geogr. Res. 2021, 40, 1652–1666. [Google Scholar]
- Ta, N.; Zeng, Y.T.; Zhu, Q.Y. Relationship Between Built Environment and Urban Vitality in Shanghai Downtown Area Based on Big Data. Sci. Geogr. Sin. 2020, 40, 60–68. [Google Scholar]
- Lynam, A.; Li, F.; Xiao, G.; Huang, H.; Utzig, L. Capturing Socio-spatial Inequality in Planetary Urbanisation: A Multi-dimensional Methodological Framework. Cities 2023, 132, 104076. [Google Scholar] [CrossRef]
- Chen, Z.F. Analyzing Urban Socio-Spatial Segregation through Space-time Behavioral Big Data. Hum. Geogr. 2022, 37, 72–80. [Google Scholar]
- Shi, C.Y. A Study on the Influencing Factors of Urban Epidemic-Susceptible Communities and their Causal Pathways: A Qualitative Comparative Analysis. City Plan. Rev. 2019, 24, 345–395. [Google Scholar]
- CnStats. Main Data Bulletin of the Fifth National Population Census of 2000 in Beijing [EB/OL] (2011-12-20). Available online: http://www.cnstats.org/rkpc/201112/bjs-2000-wuxws.html (accessed on 29 December 2022).
- CnStats. Main Data Bulletin of the Fifth National Population Census of 2000 in Chengdu [EB/OL] (2011-12-20). Available online: http://www.cnstats.org/rkpc/201112/cds-2000-exdwd.html (accessed on 29 December 2022).
- Yan, X.; Tian, K.; Gao, J. Breaking the Dual System and Developing a New Type Urbanization Route in China: The Reform and Innovation of Urban-Rural Integration in Chengdu as an Example. Reform Econ. Syst. 2011, 166, 112–115. [Google Scholar]
- Fang, X.Q.; Zhang, W.B.; Zhang, L.S. The Urban Expansion and the Evolution of Urban Fringe in Beijing in the 20th Century. City Plan. Rev. 2002, 26, 56–60. [Google Scholar]
- He, X.Q. Multivariate Statistical Analysis; China Renmin University Press: Beijing, China, 2008. [Google Scholar]
- Xu, J.H. Mathematical Methods in Contemporary Geography; Higher Education Press: Beijing, China, 1994. [Google Scholar]
- Wang, F.H. GIS-Based Quantity Method and Application; The Commercial Press: Beijing, China, 2009. [Google Scholar]
- Guo, Z.G. Social Statistics with SPSS; China Renmin University Press: Beijing, China, 1999. [Google Scholar]
- Tan, Y. A Study on the Way of Renovating Old City Residential Areas in Beijing from the Residents’ Perspective; School of Architecture, Tsinghua University: Beijing, China, 1997. [Google Scholar]
- Tian, K. Study on the Spatial Characteristics of Tibetan-inhabited Areas in Chengdu. Sichuan Build. Sci. 2014, 40, 264–267. [Google Scholar]
- Liu, S.Q.; Yu, Y. Research on Application of Spatial Gene Technology in Regional Urban Design: Taking the Renewal Design of Chengdu Shaocheng as An Example. Chin. Overseas Archit. 2022, 253, 27–35. [Google Scholar]
- Hu, Y.J.; Kong, X.B.; Zhang, B.D. Spatiotemporal Features of Land Use Change in Beijing in the Past 30 Years. J. China Agric. Univ. 2018, 23, 1–14. [Google Scholar]
- Sang, Y.Y. A Study on the History of ChengDu Early-modern City Planning; Southeast University: Nanjing, China, 2020. [Google Scholar] [CrossRef]
- Xue, C.Y. A Study on Beijing City Planning during Early-Modern Period (1900~1949); Wuhan University of Technology: Wuhan, China, 2003. [Google Scholar]
- Xie, Y.L. General History of Chengdu, Volume 3: Jin Southern and Northern Dynasties Sui and Tang Dynasties Volume; Sichuan People’s Publishing House: Chengdu, China, 2011. [Google Scholar]
- Gu, C.; Kesteloot, C. Beijing’s Socio-Spatial Structure in Transition. In Urban Ecology; Breuste, J., Feldmann, H., Uhlmann, O., Eds.; Springer: Berlin/Heidelberg, Germany, 1998. [Google Scholar] [CrossRef]
- Sit, V.F. Beijing: The Nature and Planning of a Chinese Capital City; Wiley: Chichester, UK, 1995. [Google Scholar]
- Hou, R.Z. Evolution of the City Plan of Beijing. Third World Plan. Rev. 2010, 8, 5. [Google Scholar]
- Zhang, J. The Change of Urban Housing System and the Evolution of Housing Property under the Background of Social Transformation. Chongqing Soc. Sci. 2021, 315, 100–111. [Google Scholar]
- Li, G.Q.; Zhong, T.J. The Historical Evolution of China’s Housing System and Its Social Effects. Sociol. Stud. 2022, 37, 1–22. [Google Scholar]
- Zhang, X.Q. Chinese Housing Policy 1949–1978: The Development of a Welfare System. Plan. Perspect. 1997, 12, 433–455. [Google Scholar] [CrossRef]
- Liu, W.B.; Weng, J.C. The Impact of Housing Reform an Residential Differentiation in Urban China. Hum. Geogr. 2007, 93, 49–52. [Google Scholar]
- Yan, X.F. Economic Analysis of Policy of Economic House in BeiJing; Tsinghua University: Beijing, China, 2004. [Google Scholar]
- Gu, C.L.; Kesteloot, C. Research on the Influencing Factors and Evolution of Beijing Social Spatial Structure. City Plan. Rev. 1997, 21, 12–15. [Google Scholar]
- Gu, C.L.; Kesteloot, C. Social Polarization and Spatial Segregation Phenomenon in Beijing. Acta Geogr. Sin. 1997, 52, 385–393. [Google Scholar]
- Giddens, A. Dimensions of Globalization: The New Social Theory Reader; Routledge: London, UK, 2001. [Google Scholar]
- Feng, J.; Wu, F.F. The Application of Qualitative Research Method in Urban Socio-spatial Structure Research. Geogr. Res. 2011, 30, 1956–1969. [Google Scholar]
- Liu, Y.X.; Tian, T.; Gu, J.Y. Fine Spatio-temporal Scale Estimation of Urban Population’s Socio-economic Characteristics Based on Big Data: Data, Methals and Applications. Popul. Econ. 2022, 250, 42–57. [Google Scholar]
- Niu, Q.; Wu, W.X.; Wu, L. Review and Prospect of the Evolution of Urban Activities and Space in the Information Age. Urban Dev. Stud. 2022, 29, 96–106. [Google Scholar]


Disclaimer/Publisher’s Note: The statements, opinions and data contained in all publications are solely those of the individual author(s) and contributor(s) and not of MDPI and/or the editor(s). MDPI and/or the editor(s) disclaim responsibility for any injury to people or property resulting from any ideas, methods, instructions or products referred to in the content. |
© 2023 by the authors. Licensee MDPI, Basel, Switzerland. This article is an open access article distributed under the terms and conditions of the Creative Commons Attribution (CC BY) license (https://creativecommons.org/licenses/by/4.0/).