Article

Sustainability-Oriented Optimization and Decision Making of Community Buildings under Seismic Hazard

by
Ghazanfar Ali Anwar
1,*,
Mudasir Hussain
2,
Muhammad Zeshan Akber
1,
Mustesin Ali Khan
3 and
Aatif Ali Khan
4
1
Center for Advances in Reliability and Safety, New Territories, Hong Kong, China
2
Department of Civil and Environmental Engineering, The Hong Kong Polytechnic University, Hung Hom, Kowloon, Hong Kong, China
3
Fire Safety Engineering, University of Central Lancashire, Doha 999043, Qatar
4
Department of Civil and Natural Resources Engineering, University of Canterbury Christchurch, Christchurch 8140, New Zealand
*
Author to whom correspondence should be addressed.
Sustainability 2023, 15(5), 4385; https://doi.org/10.3390/su15054385
Submission received: 20 February 2023 / Revised: 27 February 2023 / Accepted: 28 February 2023 / Published: 1 March 2023

Abstract

:
Optimization and decision-making tools are often utilized to enhance the performance of community buildings under extreme events, but this may compromise the ability of future generations to enhance performance. Hence, a sustainability-oriented approach is required to enhance the performance of community buildings under extreme events. In this context, this paper proposes an optimization and decision-making framework considering multiple performance indicators, including socioeconomic and environmental consequences as well as retrofit costs. These performance indicators are assessed by utilizing performance-based assessment methodologies in terms of sustainability dimensions. The performance indicators are then exploited as multiple performance objectives in a genetic optimization to determine the Pareto optimal solutions. Finally, the Pareto optimal solutions are utilized for decision making to extract ideal solutions for the given retrofit costs. The ideal solutions provide trade-offs between the consequences of extreme events and the retrofit costs required to reduce the consequences of extreme events.

1. Introduction

Sustainability is often identified as an approach in which existing community needs are fulfilled such that the needs of future generations are not compromised. This often correlates with the efficient utilization of non-renewable resources, a reduction in harmful anthropogenic impacts, the preservation of biodiversity, and a reduction in energy consumption, among others. The first step to reducing the burden on future generations is to assess sustainability in terms of the current resource utilization of the built environment and the impact it is having on the planet. Hence, numerous methodologies, tools, and techniques have been developed in response to measuring the sustainability of built environments, including buildings and other physical infrastructure systems [1,2,3,4,5].
Sustainability has three dimensions, including social, economic, and environmental, and is often measured in terms of performance indicators [6]. The social dimension may include characteristics such as health, housing, and safety, among others; the economic dimension may include financial performance, cost savings, and efficient implementation of monetary and fiscal policies, among others; and the environmental dimension may include reducing pollution, protecting biodiversity, reducing waste, and the efficient utilization of resources, among others. Numerous methodologies have been implemented to measure these dimensions and subsequent performance indicators for different structural systems and under various settings [7,8,9,10,11]. However, sustainability cannot be attained sufficiently without considering potential threats from extreme events, including natural hazards [12,13]. These natural hazards can compromise sustainable practices and should also be considered for the reduced risk, sustained resilience, and sustainability of built environments [14,15]. Hence, it is paramount to also consider the sustainability impacts of these natural hazards.
Among these natural hazards, earthquakes are the deadliest in terms of overall deaths and injuries, responsible for more than half of the casualties of all natural hazards. Furthermore, seismic hazards are termed the second highest in terms of economic losses, and the third most frequent natural hazard. Conventionally, these losses from seismic hazards are assessed in terms of risk, measuring the socioeconomic consequences occurring from direct damage to buildings and physical infrastructure systems [16,17].
Risk assessments on a regional scale have been widely investigated [18,19,20,21,22]. However, indirect losses from seismic hazards could be determined via a resilience performance indicator that measures the reduced functionality of buildings and physical infrastructure systems and tracks their recovery [23,24]. The resilience assessment is a relatively recent development with a conceptual framework originally proposed by Bruneau et al. [25] and illustrated on community buildings by Cimellaro et al. [26,27]. Various other researchers have attempted to propose methodologies to assess the resilience of buildings on the community level [28,29,30]. For instance, Feng et al. [31] proposed a functional interdependence model to measure functionality recovery as a measure of the resilience of community buildings; Lin and Wang [32] proposed the stochastic functionality recovery of community buildings as a discrete-state, continuous-time Markov chain; Masoomi et al. [33] proposed the functionality recovery of buildings considering utility networks; and Alisjahbana and Kiremidjian [34] proposed a housing recovery model using a stochastic queuing model, among others [35,36]. All these resilience assessment methodologies are limited to functionality recovery curves and there have been few attempts to connect socioeconomic consequences to performance indicators which can be more meaningful to stakeholders and consider sustainability aspects [37,38]. Additionally, there is also a need to include environmental consequences in the community assessment and enhancement frameworks. Furthermore, there is an increasing need to integrate these social, economic, and environmental consequences from risk-, resilience-, and sustainability-related performance indicators to possibly reduce the consequences in a sustainable manner, i.e., reduce the socioeconomic and environmental consequences so as to reduce the impact on the future generations.
Finally, the end goal of these assessment methodologies is to perform decision making [39]. Currently, there are few community resilience frameworks focused on building systems that provide such decision support [40,41]. For instance, Massomi and van de Lindt [42] proposed a community resilience-based design methodology for built environments by considering population outmigration performance objectives, and Kameshwar et al. [43] proposed a decision support framework for community resilience by considering the Bayesian network. However, these decision support frameworks provide a generalized decision-making approach and consider limited performance indicators, mostly just functionality recovery. Hence, as per the knowledge of the authors, multiple socioeconomic and environmental performance indicators for community buildings’ optimization, prioritization, and decision making considering pre-hazard mitigation alternatives from the perspective of enhancing sustainability have not yet been investigated.
In this context, we provide a performance-based multi-objective optimization, prioritization, and decision-making framework by considering sustainability-oriented socioeconomic and environmental performance indicators considering risk and resilience dimensions. The proposed methodology includes identifying performance objectives, hazard scenarios, and pre-hazard mitigation alternatives. Then, a performance-based assessment methodology is utilized to evaluate the sustainability-oriented socioeconomic and environmental consequences of community buildings under hazards in terms of performance indicators. The community buildings′ performance is then optimized by utilizing the genetic optimization of the given mitigation alternatives. For that purpose, we utilized fast and elitist non-dominating sorting- and crowding-distance multi-objective evolutionary optimization. The performance indicators are utilized as multi-objectives, and optimal Pareto solutions are developed against mitigation costs. Finally, for prioritization and decision making, the Pareto optimal solutions are ranked by utilizing the analytic hierarchy process (AHP) and technique for order of preference by similarity to ideal solution (TOPSIS) to extract the ideal solutions among the Pareto optimal solutions.
This paper is organized into five sections: (1) Section 1 provides the introduction of the paper, (2) Section 2 illustrates the proposed multi-objective decision-making framework, (3) Section 3 presents the performance-based assessment part of the framework to evaluate performance objectives, (4) Section 4 outlines the multi-objective evolutionary optimization algorithm to develop Pareto optimal solutions, (5) Section 5 presents the decision-making part that utilizes the Pareto optimal solutions and prioritizes them based on the performance scores, (6) Section 6 illustrates the proposed framework on community buildings, and (7) Section 7 presents the conclusion of the paper.

2. Proposed Multi-Objective Decision-Making Framework

The proposed multi-objective decision-making framework consists of three main parts: (1) a performance-based assessment, (2) multi-objective optimization [44], and (3) decision making. The framework (shown in Figure 1) starts with defining the community-level performance objectives in terms of performance indicators [45]. The next step is to define the probable hazard scenarios and to identify the search space. The search space consists of decision variables that include mitigation alternatives, such as pre-hazard retrofit options and land use planning, among others. After the performance objectives are defined, hazard scenarios are selected, a search space is identified, and the component fitness values of each building are determined by utilizing the performance-based assessment methodology. The component fitness values are socioeconomic and environmental consequences for each building in a community under a given hazard. The consequences for each building are accumulated over the entire community to assess the performance objectives.
The second part is performing multi-objective optimization by utilizing the performance indicators as performance objectives along with the mitigation costs. This part starts by generating an initial population, including the number of individuals depending on the population size. Each individual has two properties: (1) a chromosome which consists of the total number of buildings in a community, and (2) a community fitness value which represents the quality of the solution for a community. The quality of a solution is determined based on the considered performance indicators. The chromosome, which represents an entire community, consists of genes, which are the buildings in the community. Each gene further consists of two parts: (1) an allele which represents the building type and applied retrofit alternative or reference building type in case no-retrofit is applied, and (2) a locus which is represented as the spatial location of the building of interest in the community building portfolio. Next, the initial population is optimized to obtain Pareto optimal solutions for each individual in the considered population against the considered performance objectives. The Pareto optimal solutions provide the optimal performance objectives against the mitigation costs.
In the decision-making part, the weighting factors are determined from the AHP technique and are utilized in TOPSIS to evaluate the performance scores for each individual in the optimized population. The fitness scores provide the best solutions among the optimal solutions and are utilized for decision making. A detailed discussion on each part is presented in the subsequent sections.

3. Performance-Based Assessment of Buildings

Conventionally, buildings are designed utilizing building codes and standards that provide life safety performance objectives under design hazard scenarios. However, decision makers may need to assess performance under different hazard scenarios, considering different performance objectives, and may require enhanced community performance in light of the given hazard scenarios [46]. This can be accomplished by utilizing a performance-based assessment methodology [47]. The methodology formulated herein consists of four steps, including hazard assessment, damage assessment, consequence assessment, and performance objective assessment [48,49,50]. In the first step, intensity measures (IM) are determined for each building in a community under a given hazard scenario. This can be achieved by utilizing ground motion prediction equations and extracting information from the existing literature, codes, or standards, among others [51,52,53]. In the next step, a damage assessment is performed for all the considered buildings in a community. Then, the building damage is utilized to assess consequences, also referred to herein as the component fitness values of the building. The component fitness values are utilized to develop the community fitness values (i.e., performance objectives). The damage assessment, consequence assessment, and performance objective assessment are further elaborated in the subsequent subsections.

3.1. Damage Assessment

The damage assessment for each building in a community is determined by utilizing fragility functions. Fragility functions provide the probability of exceedance of the considered discrete damage states, such as slight, moderate, extensive, and complete damage states. Then, by utilizing the probability of the exceedance of damage states, the discrete damage states for all the buildings are determined probabilistically. This proposed approach is referred to herein as a probabilistic method of damage assessment, and mathematically can be represented as:
D S s | I M b = { i f   > p D S 1 | I M b   ;   D S 0 | I M b   e l s e i f   p D S n | I M b ;   D S n | I M b e l s e i f   p D S s + 1 | I M b < p D S s | I M b ;   D S s | I M b
where D S s | I M b is the S damage state of building b;   D S 0 | I M b is the no-damage state;   D S n | I M b is the nth damage state; is a function that will generate a number randomly ranging from 0 to 1; p D S 1 | I M b is the exceeding probability of damage state one (i.e., slight damage state); p D S s | I M b is the exceeding probability of S damage state (i.e., moderate or extensive damage state); and p D S n | I M b is the exceeding probability of the last damage state (i.e., complete damage state).

3.2. Consequence Assessment

The damage assessment will provide information related to the extent of damage to the buildings in a community under a given hazard scenario. These damage states can be correlated with socioeconomic and environmental consequences by considering consequence functions. The consequence functions are normal or lognormal communitive distribution functions defined for each damage state. The function defined herein takes a random number as an input and outputs a consequence value for a given damage state of a building per unit of material. The consequence values along with the total damaged material under a given damage state are then utilized to evaluate the decision variable [54]. The decision variable is the total consequence of a building, represented as the following:
D V c b = i = 1 n f i b × T i b × C i
where D V c b is the decision variable of building b having consequence C, f i b is percentage damage for building material i, T i b is the total quantity of a building material i, and C i is the consequence function providing consequence values.

3.3. Performance Objectives Assessment

The consequence assessment provides socioeconomic and environmental consequences for individual buildings. These consequences are accumulated for all the buildings in a community to develop performance objectives. The performance objectives quantify the overall performance of a community in terms of decision variables that are more meaningful to decision makers. In the subsequent section, these performance objectives are optimized by considering a multi-objective optimization technique.

4. Multi-Objective Evolutionary Optimization

There are two major approaches to solving a multi-objective optimization problem: (1) the preference-based approach [55,56,57], and (2) the ideal approach [58,59]. The preference-based approach solves multi-objective optimization problems by converting them into a single objective by utilizing higher-level information and solving by any suitable classical optimization technique. The ideal approach, however, can consider all the objectives in a single simulation run to develop multiple optimal solutions referred to as Pareto optimal solutions. The evolutionary computation techniques are population-based and can solve the multi-objective problem in a single simulation, without the need to convert to a single objective. These techniques are also suitable for multi-modal, discontinuous, and non-linear problems, including implicitly defined problems and discrete variable space [60]. This is particularly suitable for the multi-objective optimization of community buildings since it involves implicitly defined performance objectives. Hence, an evolutionary genetic algorithm is integrated to evaluate and optimize multi-objectives against pre-hazard mitigation alternatives. The subsequent subsection briefly explains the process utilized for the evaluation and optimization of performance objectives.

4.1. Evaluating Performance Objectives

The process starts by randomly generating an initial population that consists of several individuals. The total number of individuals in a population is referred to as the population size and the total number of generations in a simulation run is controlled by the optimization criteria T, or the maximum allowed number of generations. After generating the initial population, the next step is to evaluate community fitness values in terms of the considered performance indicators. This step requires input from the performance-based assessment part.
The next step is to check if the performance objectives are satisfying the optimization criteria, which generally depends on the generation count (i.e., the number of generations or iterations required). The optimization criterion is generally chosen based on the compromise between the computational expense and the accuracy of the Pareto optimal solution set. In the case in which the optimization criteria are not b met, the individuals are ranked based on the dominance depth method and diversity is measured based on the crowding distances.
The parents (i.e., originally individuals) are then selected from the population based on the crowded binary tournament selection followed by crossover and mutations. The crossover and mutations are performed to produce offspring from the parent population. The parent population together with the offspring population is then exploited to generate a new population, also referred to as the survivor population. Finally, the individuals are extracted from this survivor population and the performance objectives are determined again. At each iteration, the optimization criteria are checked and if the performance objectives meet the performance criteria, then the Pareto optimal solutions are extracted; otherwise, the process is repeated to generate a new survivor population. The subsequent sections discuss the algorithms and operators utilized to perform multi-objective evolutionary computations.

4.2. Ranking Individuals

In this paper, crowding distances and non-dominated sorting algorithms are utilized to rank the individuals in a population. The dominated solutions are the community fitness values for individuals but are not the optimal solutions, since they are dominated by better solutions in the objective space. The non-dominated solutions are the optimum solutions for the current population generation. To determine the non-dominated and dominated solution, the solutions are ranked based on the dominance depth method, as shown in Algorithm 1. Stage 1 is used to develop the non-dominating solutions referred to as front 1, and the rest of the fronts (i.e., dominated solutions) are determined by using stage 2 of the dominance depth algorithm.
Algorithm 1: Fast Non-Dominated Sorting (P)
  Stage 1: (Non-dominated solutions)       Stage 2: (dominated solutions)
01. For each p ϵ P                i = 1
02. Sp = [ ], np = 0               While Fi [ ]
03. For each q ϵ P                Q = [ ]
04.  If (p Հ q)                 For p ϵ Fi
05.   Sp = Sp U q               For q ϵ Sp
06.  Else If (q Հ p)                nq = nq − 1
07.   np = np + 1                If nq = 0
08.   End If                   qrank = i + 1
09.  End For                   Q = Q U [q]
10.  If np = 0                   End If
11.   prank = 1                  End For
12.   F1 = F1 U [p]                 End For
13.  End If                   i = i + 1
14. End For                    Fi = Q
15.                        End While
The diversity in the objective space is considered through the crowding distance algorithm, which ensures the objective space is not congested at certain locations and no solutions are available at other locations. The crowding distance algorithm, shown in Algorithm 2, measures the crowdedness of the neighboring solutions lying on the same front.
Algorithm 2: Crowding distance (F)
01. r = |F|
 02. for each i ϵ F, set di = 0
 03.  For each objective m
 04.    F = sort (F, m)
 05.    d1 = dr =
 06.     For I = 2 to (r − 1)
 07.      di = di + [(|fm(i + 1)− fm(i − 1)|)/(fmmax − fmmin)]
 08.    End For
 09.  End For

4.3. Generating New Population

The non-dominated sorting and crowding distance evaluations for individuals are utilized to generate new populations by adopting selection, crossover, and mutation strategies. The selection is a process of selecting better individuals and can be based on rankings or crowding distances. The selected individuals are then exploited to generate new individuals by utilizing the crossover and mutation operators. The simulated binary crossover operator is generally utilized for the crossover, and the polynomial mutation operator is utilized for the mutation of individuals. The crossover and mutations of above-average individuals help generate new, better individuals in a population. Finally, the best individuals equal to the population size are selected for the new population and the procedure is repeated till the set criteria for the optimization are achieved. After the optimization criteria are satisfied, the Pareto optimal solutions can be extracted for decision making.

5. Multi-Objective Decision Making

The Pareto optimal solutions provide a set of optimal solutions given mitigation alternatives. The decision makers still need to select the best solution among the Pareto optimal solutions for practical implementation. The solution to this problem might be to assign weighting factors to all the performance objectives and combine them into a single performance score for each individual in a population. This approach requires the following: (1) evaluating weighting factors for all the performance objectives, and (2) identifying multi-objective decision-making techniques to combine the performance objectives into a single performance score. The weighting factors can play a significant role in the overall performance score and are evaluated in this framework by utilizing the AHP technique. Finally, the performance scores for all the individuals are determined by utilizing TOPSIS. These two techniques are discussed in the subsequent subsections.

5.1. Analytic Hierarchy Process (AHP)

The AHP technique of multi-criteria decision making was originally proposed by Saaty [61]. It has been widely used in various social sciences, economics, and engineering applications, and is adopted herein to determine the weighting factors for the performance objectives. The AHP approach requires formulating pairwise comparisons based on the relative intensity of importance for each performance objective. The relative importance is selected based on the significance of one performance objective over another, and the intensity of importance is selected based on how important one performance objective is relative to another. This intensity of relative importance is evaluated by comparing the performance objectives in pairs.
In this technique, a value is assigned to each performance objective relative to all the other performance objectives. This helps to create a hierarchical structure for each performance objective relative to others, forming an inverted tree. For instance, the most important performance objective is placed on the top of the hierarchical structure, and the next best performance objective is placed at the second level. This decomposition of the performance objectives and relative pairwise comparison with respect to their contribution to community buildings′ performance can be utilized to extract the weighting factors for each performance objective.
Mathematically, it can be achieved by formulating a square matrix referred to herein as a judgment matrix. Each element of a matrix represents a pairwise comparison of performance objectives with respect to their importance, represented as follows:
A = [ x 11 x 1 n x m 1 x m n ] = [ w 1 w 1 w 1 w n w n w 1 w n w n ]
where A is a judgment matrix, xij is an element comparing the relative importance of performance objective i against the performance objective j (i.e., xij = wi/wj), n is the total number of performance objectives aligned along the columns, and m is the total number of performance objectives aligned along rows. The pairwise comparison is based on the fundamental scale which gives a numeric value to an element depending upon the intensity of importance of the pairwise-compared performance objectives. For instance, if two performance objectives have equal importance (i.e., wi = 1 and wj = 1), the numeric value of one is given to an element xij; if performance objective i has extreme importance with respect to performance objective j, then element xij is given a numeric value of nine; and depending upon the level of importance, the values between one and nine are assigned to all the elements. The inverse values are assigned for opposite levels of importance.
The judgment matrix is constructed based on the fundamental scale ranging from one to nine and then normalized as:
A   ¯ = [ x ¯ 11 x ¯ 1 n x ¯ m 1 x ¯ m n ] , x ¯ i j = x i j l = 1 m x i j
where x ¯ i j is the normalized elements of a judgment matrix, and m is the number of rows in a judgment matrix. Finally, the weighting factors for each performance objective can be extracted by averaging all the rows of a normalized judgment matrix as follows:
w n = l = 1 n x ¯ i j n
where w j is the weighting factor for the m performance objective, x ¯ i j are the elements of the normalized judgment matrix, and n is the total number of performance objectives placed along the columns.

5.2. Technique for Order of Preference by Similarity to Ideal Solution (TOPSIS)

TOPSIS is a multi-criteria decision-making technique that utilizes Euclidean distances to determine the performance score for each individual in a population by measuring the shortest and longest distances to the ideal solutions and non-ideal solutions. The methodology starts by formulating a matrix referred to herein as the decision matrix which is expressed as follows:
D = [ a 11 a 1 n a m 1 a m n ]
where D is a decision matrix, aij are the elements in a matrix, n is the total number of performance objectives, and m is the total number of individuals in a population. The decision matrix is then normalized to compare different performance objectives:
D ¯ = [ a ¯ 11 a ¯ 1 n a ¯ m 1 a ¯ mn ] , a ¯ i j = a i j k = 1 m a i j 2
where D ¯ is the normalized decision matrix, m is the total number of individuals in a population, and n is the total number of performance objectives.
Then, the normalized weighted decision matrix is formulated by utilizing the weighting factors from the AHP as follows:
V = [ v 11 v 1 n v m 1 v m n ] ,   v ij = w n ×   a ¯ i j
where V is the normalized and weighted decision matrix, w n is the weight of performance objective n, and v ij is the element of a matrix V.
The performance objectives that are expected to be minimized are referred to as cost objectives and those that are expected to be maximized are referred to as benefit objectives. The least ideal and most ideal solutions are evaluated by extracting the best and worst values for all the considered performance objectives, determined as follows:
v * = { v 1 * , , v n * } = { ( m a x   v i j | j J b ) , ( m i n   v i j | j j c ) } v = { v 1 , , v n } = { ( m i n   v i j | j j b ) , ( m a x   v i j | j j c ) }
where v * is the most acceptable solution, v is the least acceptable solution, j b and j c are the benefit and cost performance objectives, respectively, v j * is the j performance objective for most ideal solution, and v j is the j performance objective for the least ideal solution.
The most and the least ideal solutions for each performance objective are then utilized to evaluate the Euclidean distances, referred to as the separation measures from an ideal solution D b * and the least ideal solution D b calculated as follows:
D i * = z = 1 n ( v i j v j * ) 2 ,   D i = z = 1 n ( v i j v j ) 2
where D i * and D i are the Euclidean distances of performance objective i to the most ideal and least ideal solutions. Finally, the performance score p for all the individuals in a population can be determined as follows:
p = D i D i * + D i
Finally, these performance scores can be utilized for the prioritization of individuals and extracting the best solutions among the optimal solutions.

6. Illustrative Example

The proposed framework is illustrated on a community building portfolio that includes residential, commercial, emergency, educational, and healthcare facilities. The building portfolio comprises pre-code buildings as well as low-, moderate-, and high-code buildings with most of the buildings being dominated by residential construction with pre-code and low-code masonry structural configurations. The remaining buildings are mostly concrete moment frames with and without masonry infill walls. The pre-hazard mitigation measures considered in this example include the seismic retrofitting of individual buildings. It is important to note that different retrofit alternatives have varying costs of implementation and degrees of effectiveness on performance indicators. The costs of implementation and performance indicators are conflicting in general and hence there exist multiple feasible solutions to the problem, called Pareto optimal solutions. The Pareto optimal solutions for community buildings are evaluated by utilizing a performance-based assessment and optimization. Then, the Pareto optimal solutions are assigned a performance score by utilizing the AHP and TOPSIS techniques. The framework is illustrated in the subsequent subsections.

6.1. Performance-Based Assessment

The performance-based assessment methodology is considered herein to determine the socioeconomic and environmental consequences for all the buildings in the community building portfolio. Intensity measures are determined by utilizing ground motion prediction equations [52,62], codes [63], or relevant hazard assessment studies for different regions [64]. The considered community is prone to earthquake hazards with an estimated design hazard scenario of 0.33 peak ground acceleration (PGA). The considered PGA values for 95-y, 975-y, and 2475-y are 0.18 g, 0.42 g, and 0.56 g, respectively.
The probabilistic approach is adopted to evaluate the damage states of all the buildings in a community [65]. The resulting damage states of buildings under three hazard scenarios are illustratively shown in Figure 2. As shown, under half the design hazard scenario, most of the buildings are in slight to moderate damage states, while for the maximum considered hazard scenario, most of the buildings are in a moderate to complete damage state. For instance, the buildings with no damage decrease from 29.2% to 6.9%, 3.3%, and 1%, and the buildings suffering complete damage increase from 10.1% to 35.8%, 50.6%, and 67.9% for four hazard scenarios with increasing intensity measures.
In the next step, the damage states are correlated with the sustainability-oriented consequences. In this example, injuries, repair costs, downtime, embodied energy, and carbon emissions are considered socioeconomic and environmental consequences. The consequence functions are extracted from the literature and based on the percentage damage to the buildings and the resulting waste material generated, the consequences are determined for the considered buildings in the community building portfolio [65,66,67]. The relevant data for the fragility and consequence functions is shown in the Appendix A of this manuscript. The consequences for half the design and maximum considered earthquake hazard are illustratively shown in Figure 3. As shown, with the increase in intensity measures, the community suffers higher consequences.
Finally, the consequences for individual buildings can be summed up in the community performance objectives. For instance, the repair costs for all the buildings in a community are added together to determine the overall repair cost on a community level. Similarly, other socioeconomic and environmental consequences are summed up to determine the community-level performance objectives. These performance objectives provide cumulative consequences on the community level by adding building-level consequences. This offers community stakeholders a quantifiable impact of extreme events in terms of meaningful decision variables. In this example, socioeconomic consequences are summed as total casualties and total repair cost; total repair and delay times are summed as downtime; and the environmental consequences are summed in terms of total carbon emissions and total embodied energy. These socioeconomic and environmental consequences on a community level are shown in Figure 3.
HAZUS provides the casualty estimates in terms of four levels divided based on the severity of injuries after an earthquake event. Casualty-1 refers to people suffering injuries that require basic medical aid, such as bandages and cuts requiring stitches; casualty-2 would require a greater degree of medical attention, including x-rays and surgery; casualty-3 refers to life-threatening conditions; and casualty-4 refers to a fatal scenario. It is noted that the contribution of casualty-1 is higher under all four hazard scenarios.
In this illustrative example, the number of people (in thousands) suffering from casualty-1 for the four hazard scenarios is 2.12, 7.97, 11.1, and 15.17, respectively, and from casualty-4 under the four hazard scenarios is 0.20, 0.81, 1.14, and 1.61, respectively. The total repair costs to recover from the considered four hazard scenarios are USD 121, 316, 420, and 526 million, respectively. It is noted that steel has the highest contribution to the total repair costs, ranging from 36.36% to 43.43%, and is followed by wood, bricks, and concrete. The contribution of concrete building materials ranges from 12.16% to 14.61% of the total repair costs.
The total equivalent carbon emissions for the four hazard scenarios are 2.93, 8.04, 11.2, and 14.0 million metric tons, respectively, and the total embodied energy for the four hazard scenarios is 9.32, 23.0, 30.0, and 37.1 million giga joules, respectively, as shown in Figure 4. It is noted that concrete building material has the highest contribution to the equivalent carbon emissions, while bricks and wood building materials have the highest embodied energy. The concrete building material’s contribution to the equivalent carbon emissions under the four hazard scenarios ranges from 71.89% to 77.20% of the total equivalent carbon emissions under the hazards. The contribution of bricks to the embodied energy is from 35.02% to 39.11%, while the contribution of the wood building material is from 31.28% to 35.12% of the total embodied energy under the hazards. Steel has the lowest contribution to the equivalent carbon emissions, ranging from 5.43% to 5.81%, and concrete has the lowest contribution to the embodied energy, ranging from 8.9% to 11.82%. Note that these results are based on the community building portfolio in which 98.5% of the buildings are unreinforced masonry and the remaining are concrete buildings.
The additional consequences resulting from the non-functioning of a community are determined by adding downtime for all the buildings in a community. The accumulative downtime on a community level under the four hazard scenarios is 3.86, 6.54, 7.78, and 8.89 million days, respectively. Note that the buildings may be repaired simultaneously, and the community may recover from an earthquake hazard after some number of days. The community recovery can be assessed by evaluating the percentage of buildings recovered during the investigated time, in which the investigated time is measured in the number of days after an earthquake event. The community is said to be recovered from a hazard event when 90% of the buildings are fully recovered from the hazard event. For instance, the illustrative community recovered from the considered four hazard events 497, 708, 755, and 790 days after a hazard event, respectively. The community recovery during the investigated time can be seen in Figure 5.
These indicators provide meaningful information related to the impact of hazards on a community. Considering this information, community stakeholders may want to improve the performance of a community which may require some pre-hazard mitigation alternatives, such as retrofitting community buildings. The discussion on improving community performance is presented in the subsequent subsection.

6.2. Multi-Objective Evolutionary Optimization

There exist thousands of buildings in a given community with different structural configurations, building types, code levels, and stories, among other characteristics. All these buildings may be retrofitted with different types of retrofit alternatives to improve performance. Additionally, various retrofit techniques have varying implementation costs and degrees of effectiveness in improving community performance, including reinforced concrete jacketing, steel jacketing, fiber-reinforced polymer overlays, base isolation, and buckling restraint bracings, among others [49,68,69]. This is due to the differences in the ability to improve fragility functions by applying different retrofit types. These fragility functions are determined by exploring the literature [70,71,72] and are utilized in this example to evaluate building damage states given mitigation alternatives [73,74]. The repair costs related to the mitigation alternative are determined from FEMA, NIST [75,76] and similar literature, such as the work by Fung et al. [77,78].
Hazard mitigation alternatives incur a cost and different mitigation measures have different costs of implementation. Therefore, it is important to investigate the type of mitigation measures or retrofit alternatives to adopt, and the ideal performance against the cost incurred to apply the retrofit. Generally, the higher the retrofit cost, the higher the performance enhancement of a community, but this relationship may not be linear and depends on the improvement in fragility functions. Hence, there exist multiple optimal solutions depending upon the retrofit cost and the relevant performance enhancement of a community.
To evaluate these Pareto optimal solutions, a population size of 20 individuals is considered with a maximum of 100 generations as an optimization criterion. The consequences and downtime for all the buildings in a community for each individual are assessed utilizing a performance-based assessment. Then, selection, crossover, and mutations are performed to generate new solutions, and the best ones are selected for the next generation, maintaining the population size. Each generation improves the quality of the solutions and as a result, the solutions converge to Pareto optimal solutions.
The multi-objective Pareto optimal solutions for total repair costs and total retrofit costs under the four hazard scenarios are shown in Figure 6. It is noted that by implementing a retrofit cost of USD 50 million, the total repair costs will be reduced to USD 81.7, 248, 326, and 416 million for the four hazard scenarios, respectively. In this way, reductions of 41.77%, 27.36%, 25.81%, and 24.58% can be observed in the total repair costs under the four hazard events, respectively. If a retrofit cost of USD 100 million is implemented, the reduction in total repair costs would be reduced to 65.92%, 50.64%, 50.48%, and 44.89% of the total repair costs, respectively. The rate of reduction in the total repair costs decreases with the increasing retrofit costs. Additionally, the reduction in total repair costs is higher for high-intensity hazards and the percentage reduction in total repair costs is higher for low-intensity hazards. The Pareto optimal solutions for other performance indicators against the retrofit costs are shown in Figure 7.

6.3. Multi-Objective Decision Making

All the Pareto optimal solutions are the best solutions; to further ease decision making, a performance score for each optimal solution can be determined to extract the ideal solutions among the Pareto optimal solutions by employing a multi-objective decision-making approach. These performance scores can then be utilized to prioritize the optimal solutions and the best solution can be determined among these optimal solutions.
It is important to note that weighting factors can play a significant role in the overall performance scores for optimal solutions. For instance, Figure 8 shows the performance scores measured against the retrofit costs in a population for a 95-year hazard scenario under three cases. In the first case, the performance objective related to the total number of injuries is given the highest weightage, which resulted in an increase in the performance score of up to USD 133 million in retrofit costs, staying almost the same till USD 200 million in retrofit costs. A similar trend is also observed for the second case scenario in which equal weights are assigned to all the performance objectives in a decision matrix. In the third case, a higher importance is given to the retrofit costs, and it shows that the performance score increases till the retrofit costs reach USD 30 million and then start to decrease from retrofit costs of USD 38.3 million. Hence, if decision makers give a higher importance to the retrofit costs as compared to the performance indicators, the ideal solution represents a retrofit cost of USD 30 million. In the case of equal importance or preventing injuries given higher importance, an ideal solution gives a retrofit cost of USD 133 million.
The weighting factors are determined by utilizing the AHP technique which requires developing a pair-wise comparison matrix for all the performance objectives. For instance, comparing total retrofit costs with the total number of injuries, decision makers need to evaluate which of the performance objective should be given a higher importance and what should be the strength of this importance. In this illustrative example, the total number of injuries is given twice as much importance as that of the retrofit costs. Similarly, comparing the total retrofit costs with the total repair costs, the retrofit costs are given twice as much importance as the total repair costs. Similar pairwise comparisons are made for all the performance objectives and the pairwise comparison matrix is developed, as shown in Table 1.
The resulting performance scores for all the individuals in a population under the four hazard scenarios are shown in Figure 9. In the case of a 95-year hazard scenario, the performance score for a community building portfolio with no mitigation alternative applied is 0.41. The performance scores continue to increase with increasing retrofit costs till a score of 0.63 is reached against a retrofit cost of USD 141 million. Then, the performance score gradually decreases to 0.59 till reaching the retrofit cost of USD 200 million. Hence, under a 95-year hazard scenario, applying the retrofit costs of USD 141 million would represent the best solution. Similarly, for the 475-, 975-, and 2475-year hazard scenarios, the maximum performance score is achieved against the retrofit costs of USD 156, 156, and 164 million, respectively. The trends for all the other hazard scenarios can be investigated accordingly.

7. Conclusions

This paper proposed a performance-based multi-objective hybrid decision-making framework considering multiple performance indicators. A probabilistic approach for the damage and consequence assessment on a community level was considered, and Pareto optimal solutions were extracted by utilizing population-based multi-objective optimization. Finally, decision making was performed by assigning performance scores to optimal solutions. The proposed methodology was implemented on a community building portfolio to demonstrate its applicability.
The following conclusions can be drawn.
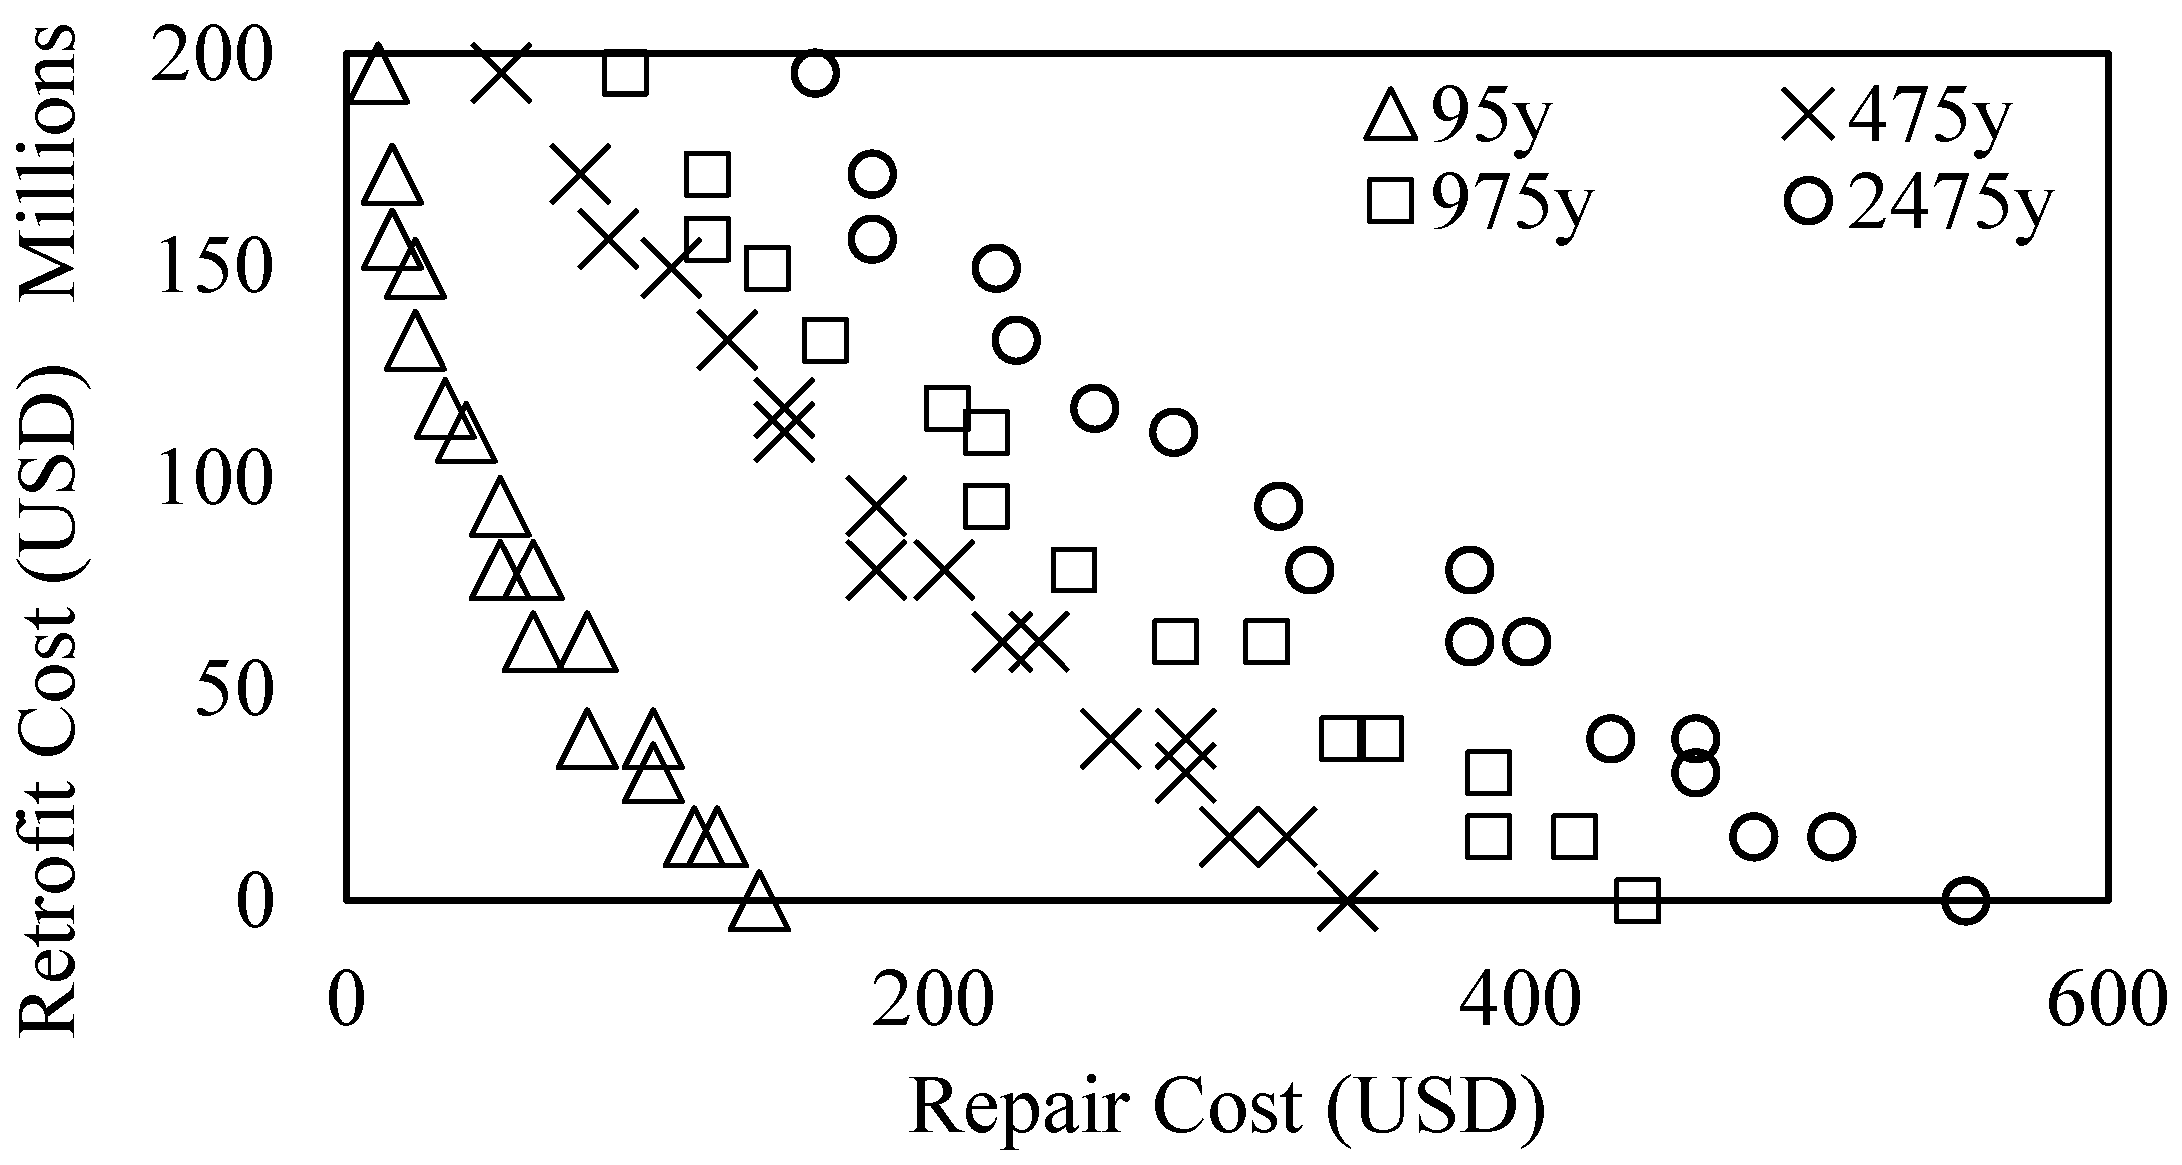
  • The proposed approach considered sustainability-oriented performance-based assessment techniques with genetic optimization and decision-making methods to provide meaningful information to decision makers. For instance, in the considered example, retrofit costs ranging from USD 141 to 164 million provide the best performance for the given weighting factors provided by the AHP.
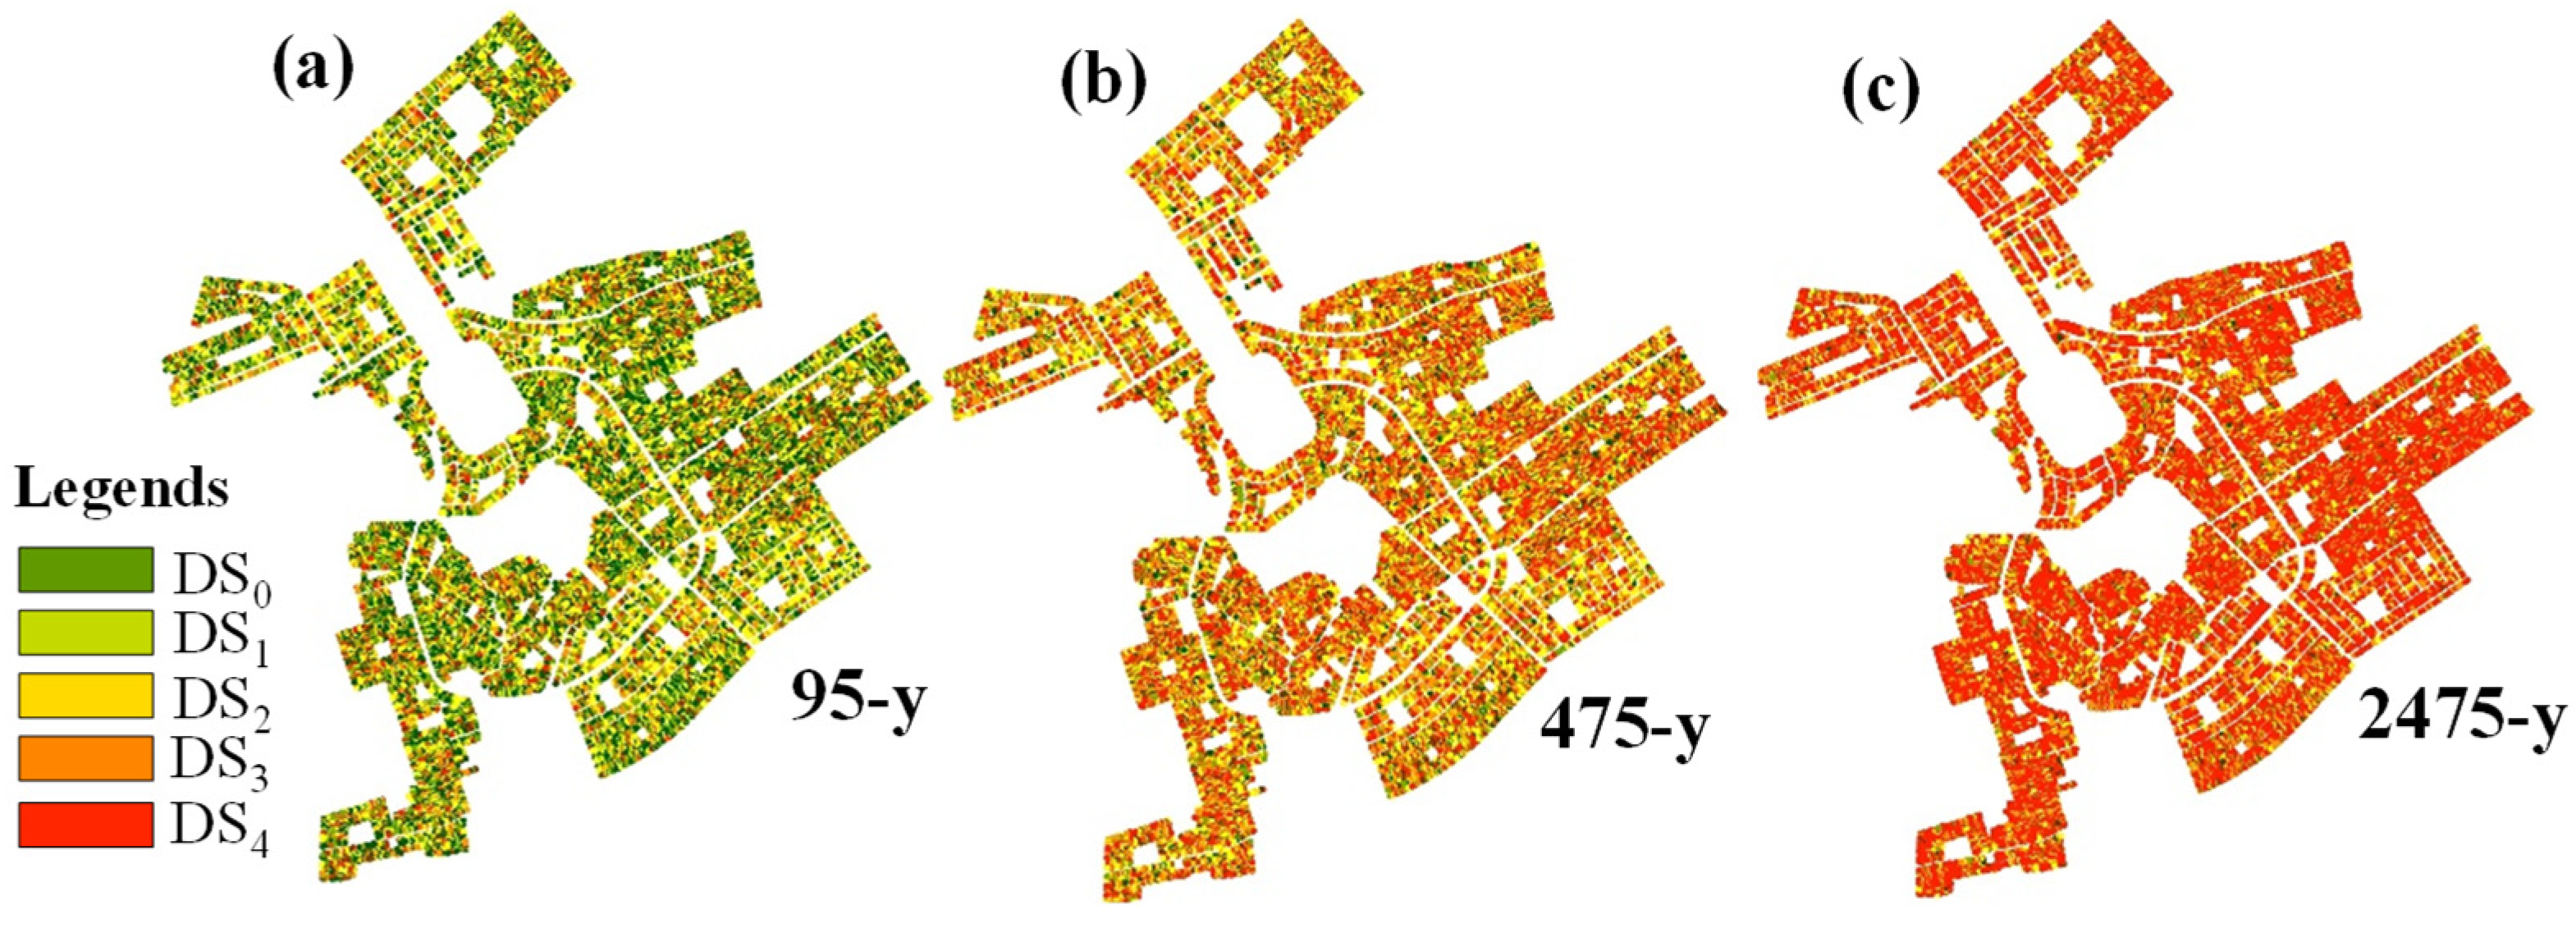
  • The damage to the buildings increased with the increasing intensity of hazard scenarios. For instance, for the frequent level earthquake scenario, 29.2% of buildings suffered no damage and 10.1% of buildings suffered complete damage, while for the maximum considered earthquake, the buildings with no damage decreased to 1%, while the buildings with complete damage increased to 67.9%.
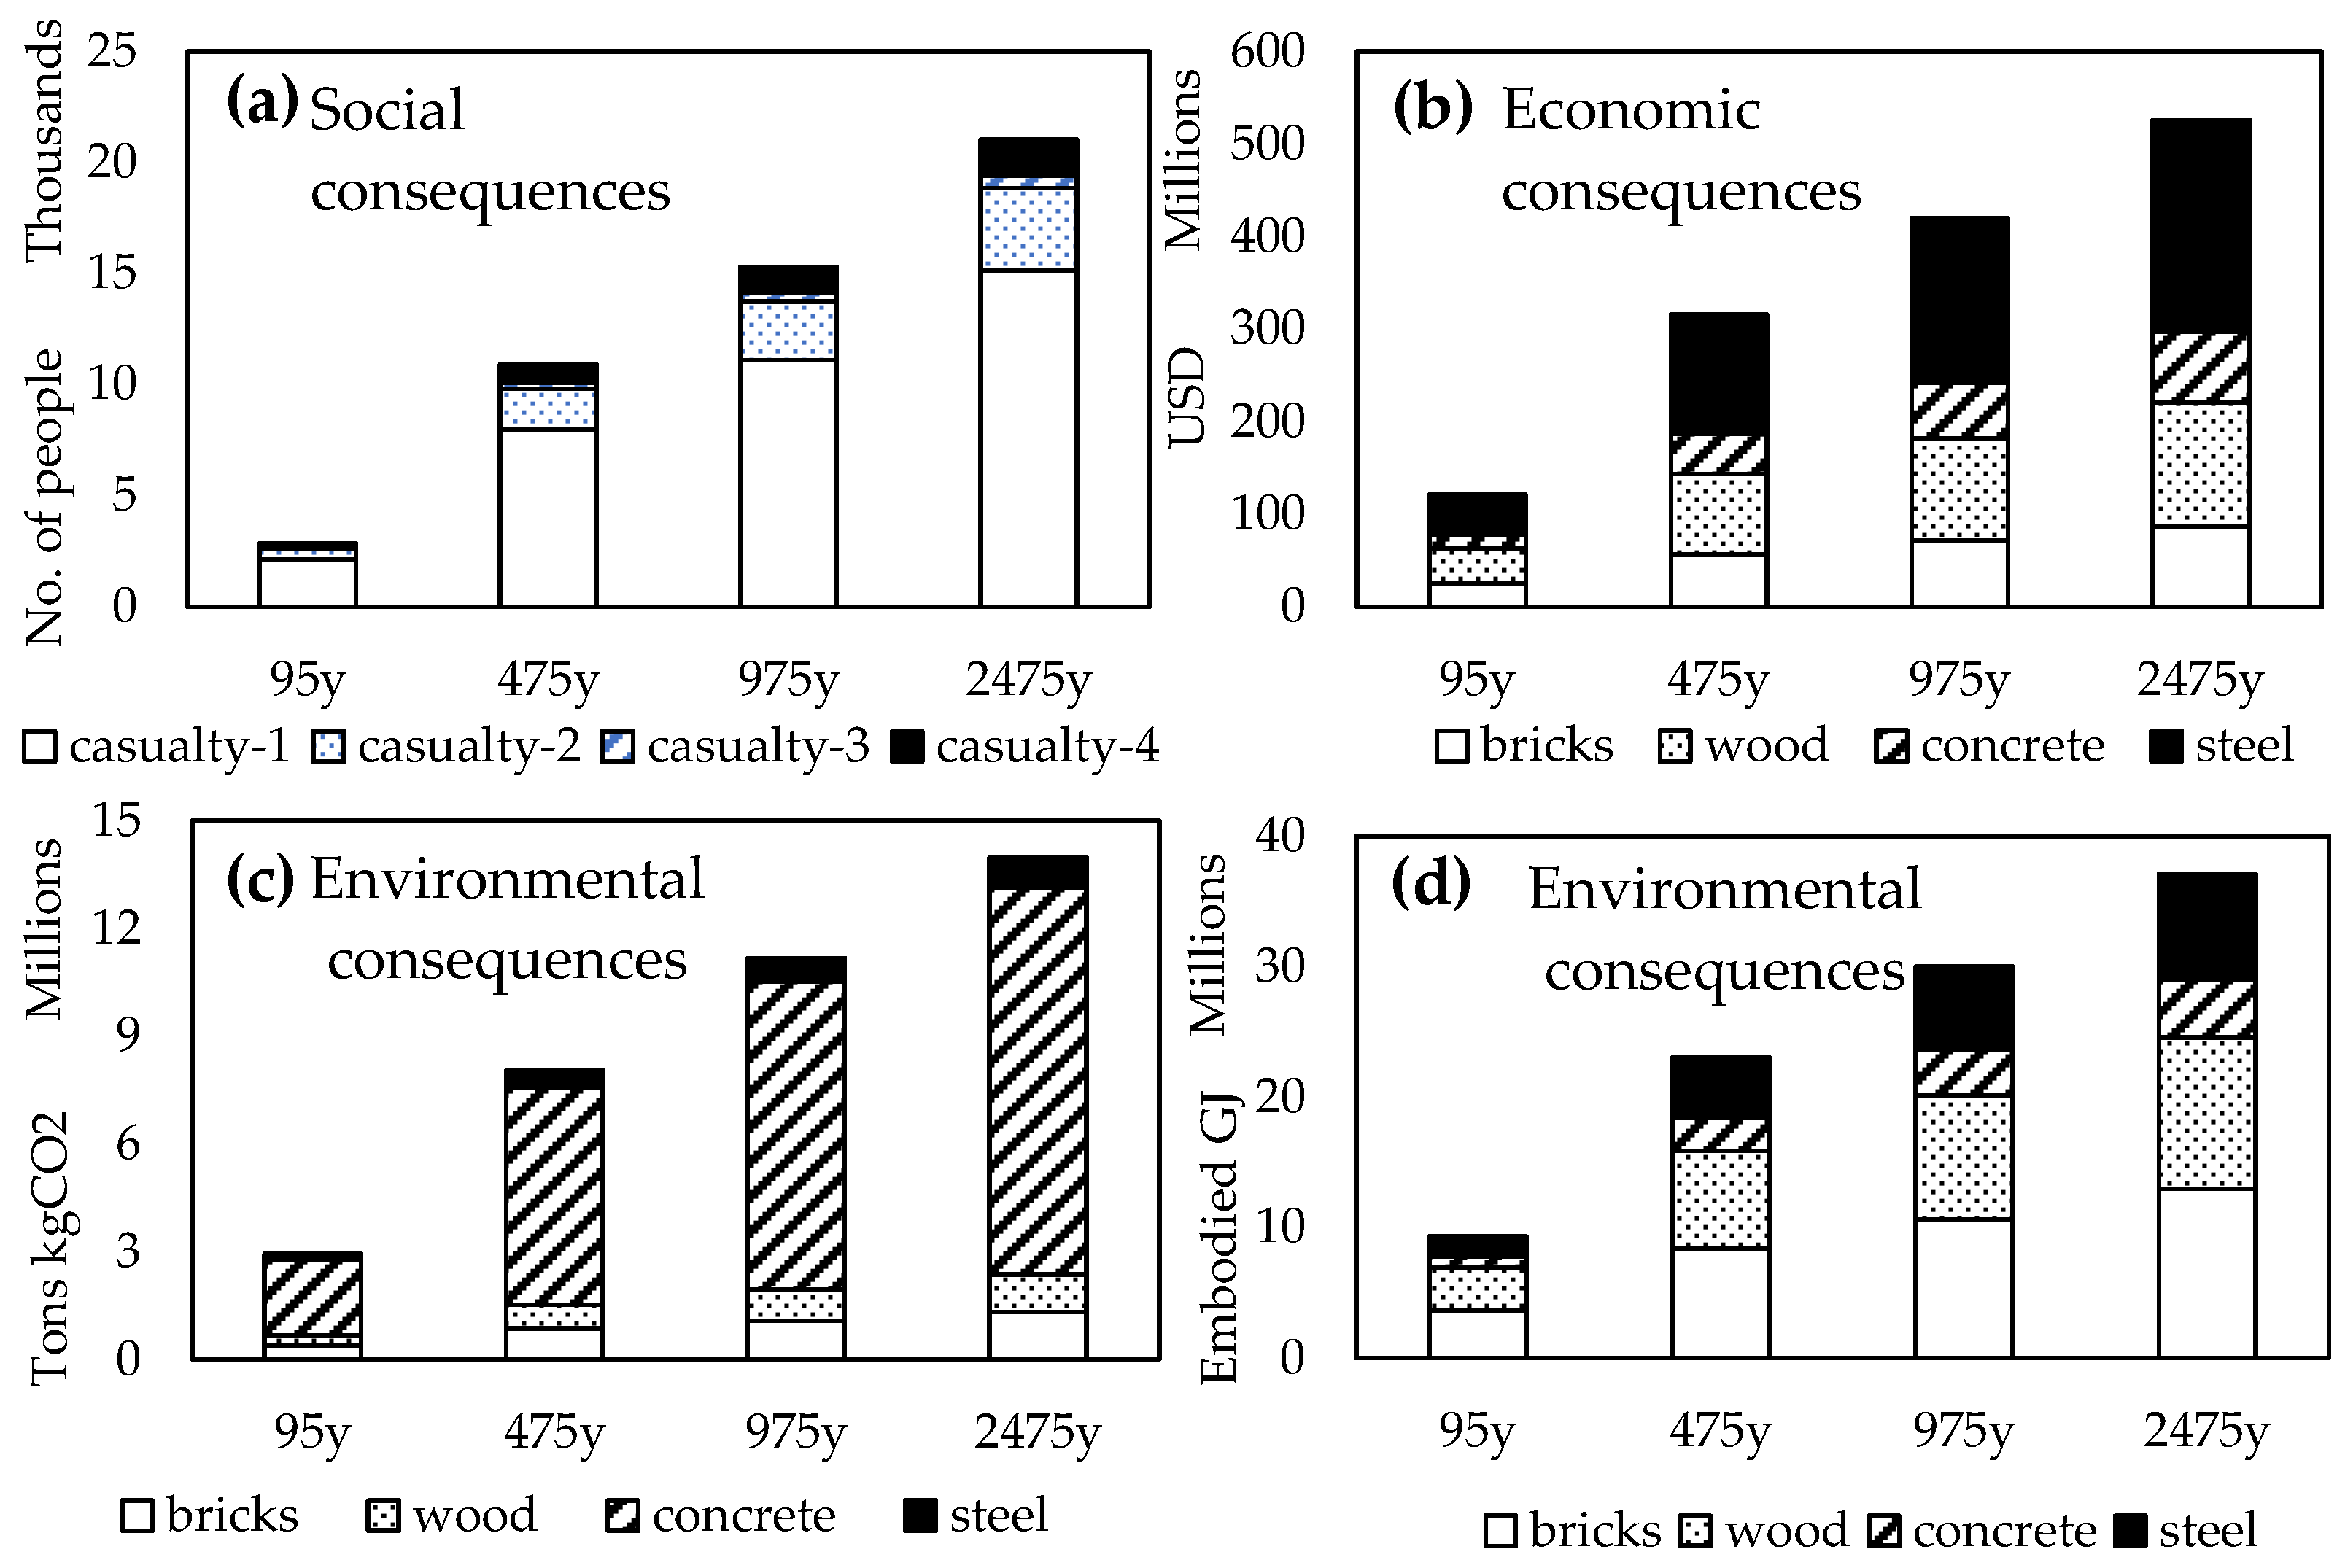
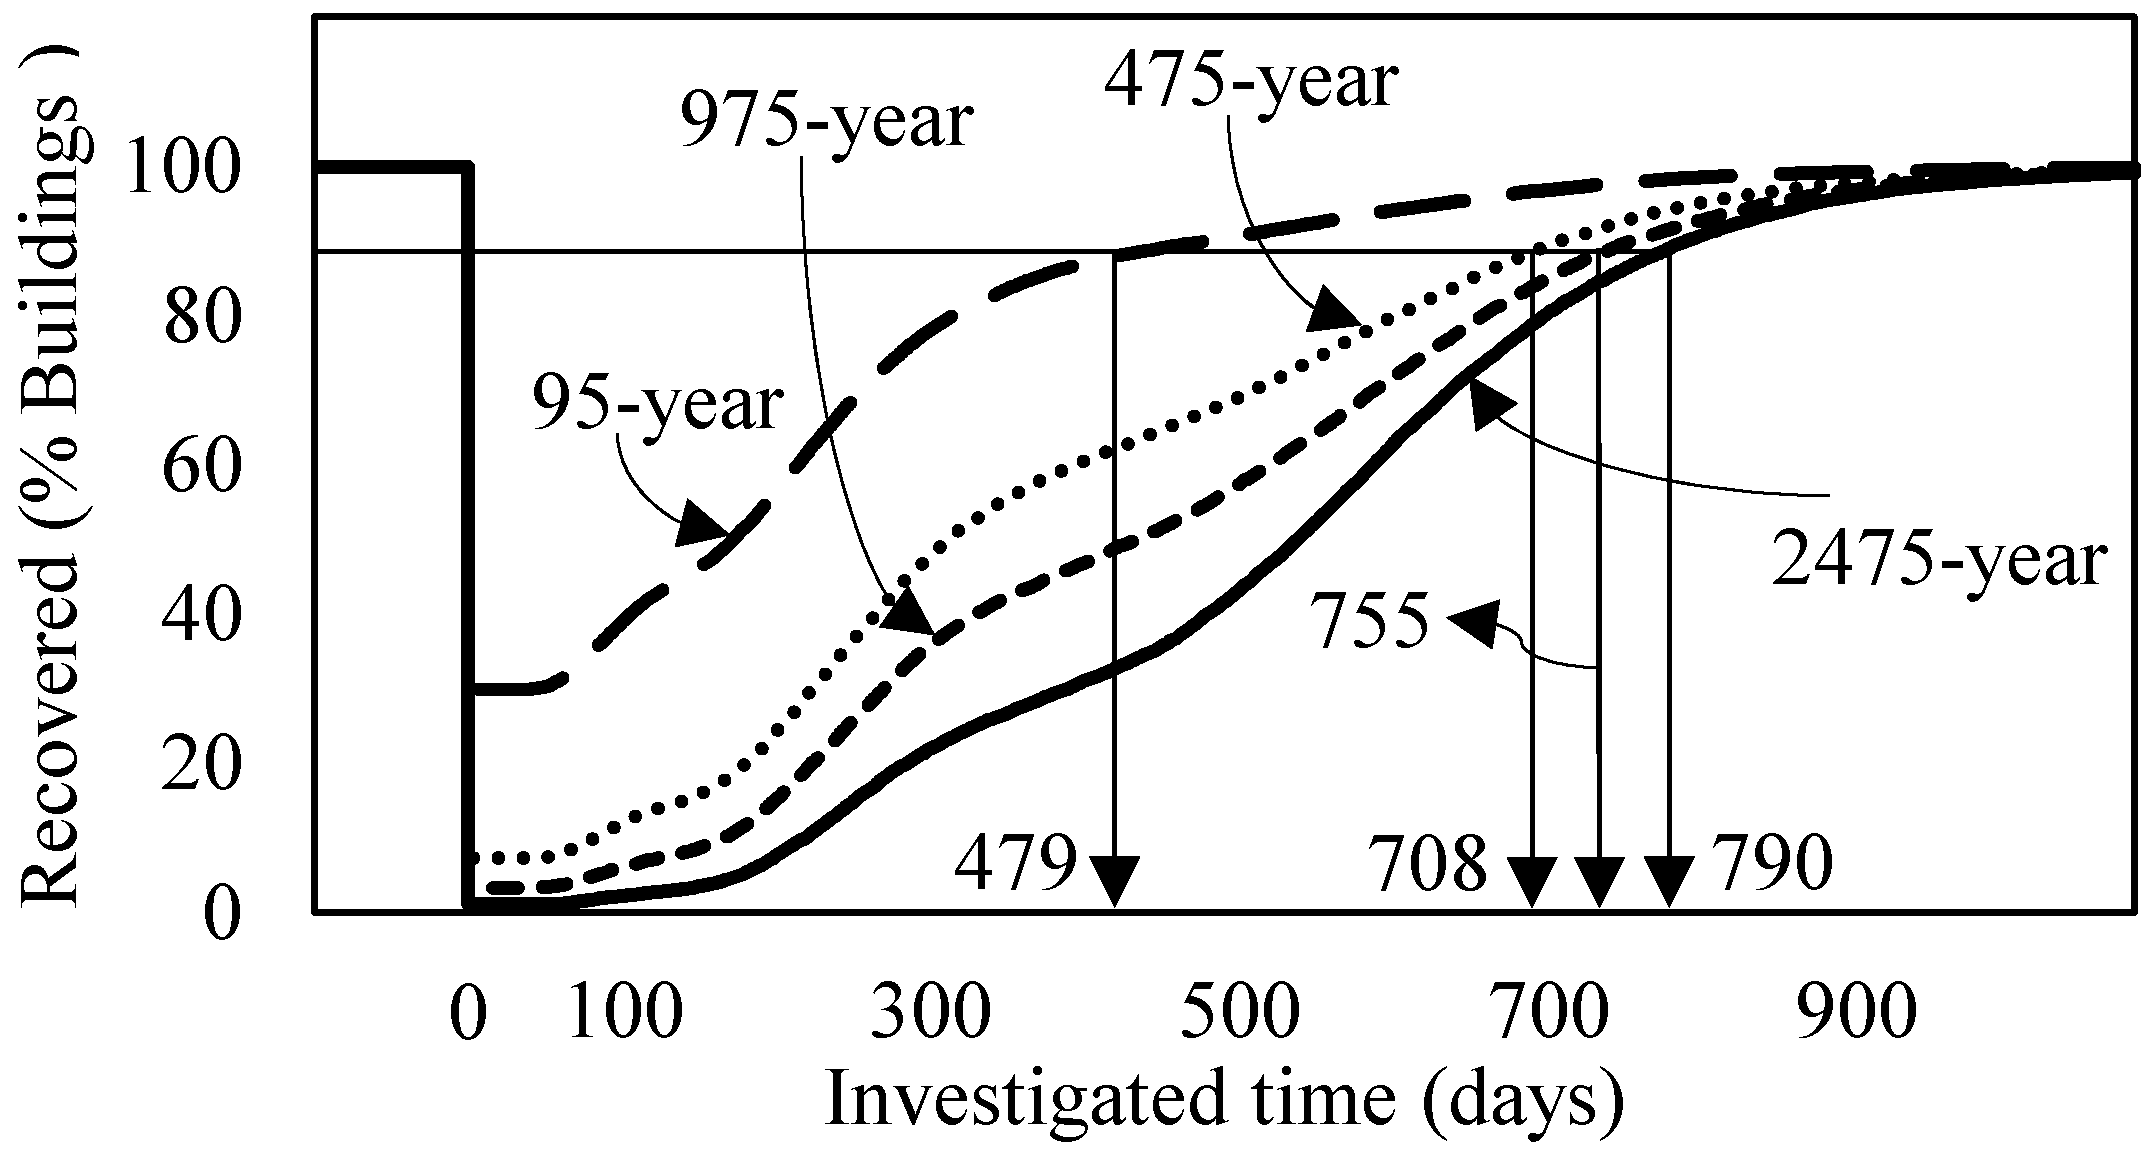
  • Similarly, with the increasing intensity of the hazard scenarios, the socioeconomic and environmental consequences increased. For instance, the casualties increased from 1832 to 6415, 9381, and 12,457 for the four hazard scenarios of increasing intensity, the repair costs increased from USD 133.58 million to 560.81 million, the carbon emissions increased from 2.95 million tons to 13.99 million tons, and the total downtime increased from 3.88 million days to 8.92 million days.
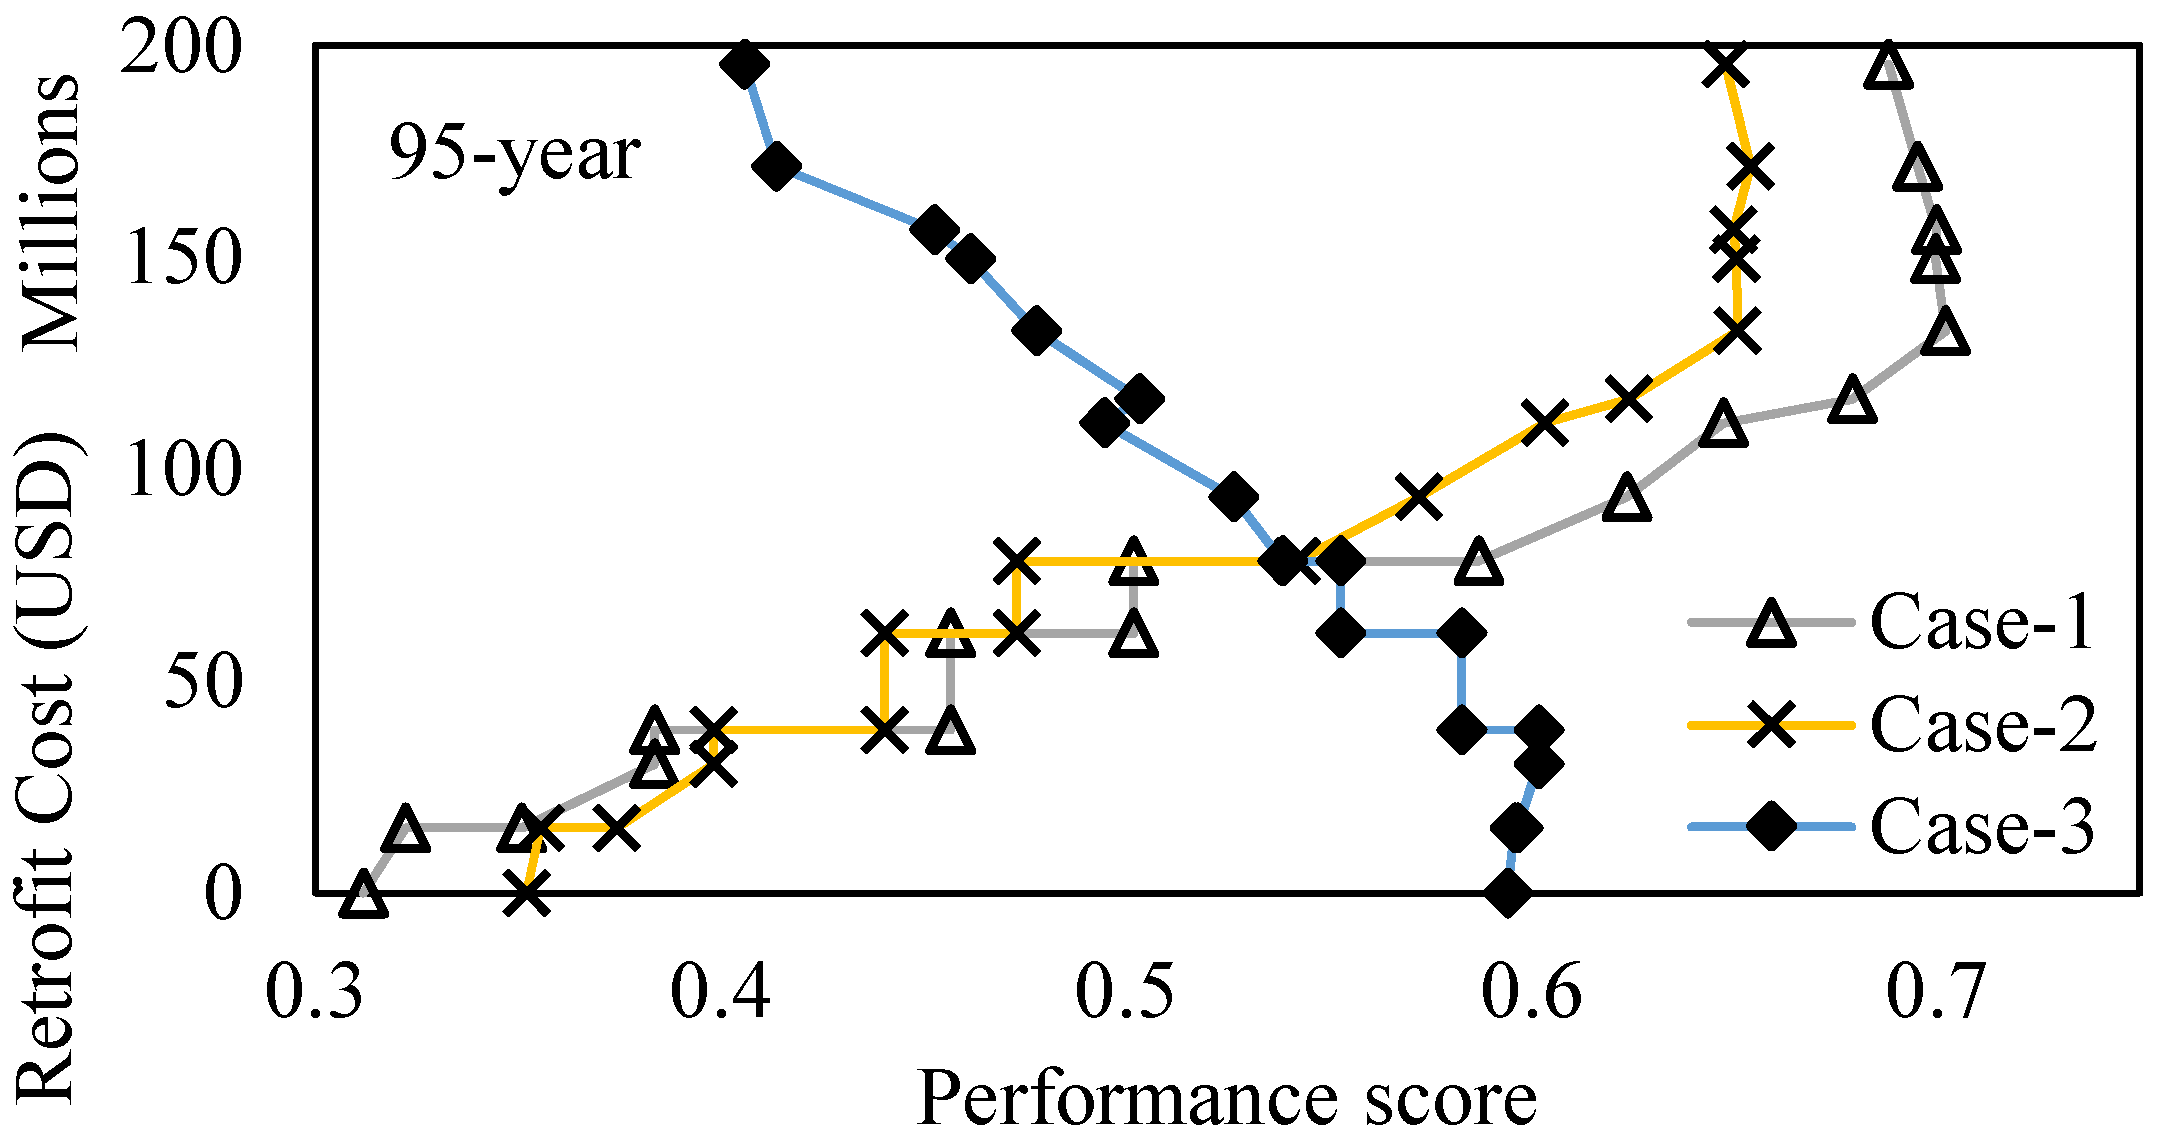
  • Pre-hazard retrofit alternatives were utilized to increase the performance indicators against the retrofit costs. For instance, applying a retrofit worth USD 5 million results in a 25.7% reduction in risk for the frequent-level earthquake scenario, and a 16.67% reduction in risk for the maximum considered earthquake scenario. In terms of USD, applying a retrofit of USD 5 million can save USD 36.1 million in case of a frequent-level earthquake, and 91.9 million USD in case of the maximum considered earthquake scenario.
In summary, the proposed framework provided a population-based multi-objective decision-making framework for community buildings considering multiple performance objectives. These objectives account for a wide range of performance indicators, including the direct impacts of a hazard (e.g., casualties, repair cost incurred), indirect impacts of a hazard due to reduced functionality (e.g., business losses), and objectives related to protecting the environment (e.g., limit to waste generation, greenhouse gas emissions).
The proposed methodology can be utilized and extended to post-hazard mitigation and management, including recovery prioritization, resource allocation for effective recovery, and strategies to improve the rapidity and resourcefulness of a community in post-hazard scenarios. Future studies can also include other infrastructure systems, and new dimensions can be added to performance indicators for improved decision making.

Author Contributions

G.A.A.: Visualization, Investigation, Conceptualization, Methodology, Software, Writing—original draft, Validation; M.H.: Writing—review and editing, Validation; M.Z.A.: Writing—review and editing, Validation; M.A.K.: Writing—review and editing, Validation; A.A.K.: Writing—review and editing, Validation. All authors have read and agreed to the published version of the manuscript.

Funding

The work is self-funded. The opinions and conclusions presented in this paper are those of the authors and do not necessarily reflect the views of the journal.

Institutional Review Board Statement

Not applicable.

Informed Consent Statement

Not applicable.

Data Availability Statement

Available on request to corresponding author.

Conflicts of Interest

The authors declare no conflict of interest.

Appendix A

Fragility and consequence functions adopted in the illustrative example.
Table A1. Fragility functions of buildings.
IDBuilding TypeCode Level Damage StateFragility Function
(g)
URML-PLow-Rise Unreinforced Masonry Bearing WallsP-CS
M
E
C
0.13
0.17
0.26
0.37
URML-LLow-Rise Unreinforced Masonry Bearing WallsL-CS
M
E
C
0.14
0.20
0.32
0.46
URMM-LMid-Rise Unreinforced Masonry Bearing WallsL-CS
M
E
C
0.10
0.16
0.27
0.46
C3L-LLow-Rise Concrete Frame with Unreinforced Masonry Infill WallsL-CS
M
E
C
0.12
0.17
0.26
0.44
C3M-LMid-Rise Concrete Frame with Unreinforced Masonry Infill WallsL-CS
M
E
C
0.11
0.17
0.32
0.51
C1M-LMid-Rise Concrete Moment FrameL-CS
M
E
C
0.12
0.17
0.32
0.54
C1M-MMid-Rise Concrete Moment FrameM-CS
M
E
C
0.13
0.21
0.49
0.89
The mean values are in PGA (g); coefficient of variation (COV) = 0.64; S= slight, M = Moderate, E = Extensive, C = Complete; P-C = Pre code, L-C = Low code, M-C = Moderate code.
Table A2. Construction material utilized.
IDConstruction
Materials
Tons kg/
Thousand Square Feet
URMM-L,
URML-L,
URML-P,
URMM-L
Brick35
Wood10.5
Concrete41
Steel4
C1M-M,
C1M-L,
C3M-L,
C3L-L
Brick20
Wood5.3
Concrete90
Steel4
The coefficient of variation in lognormal distribution is 0.2.
Table A3. Sustainability-related data of utilized construction material.
Construction
Materials
Cost in USD per kg TonsTons kgCO2 Emissions per kg Tons
Brick280.2–0.6
Wood1400.75–1.35
Concrete200.05–5.15
Steel6501.72–2.82
The uniform distribution is considered.
Table A4. Material needs to be replaced given damage states.
IDDamage StatePercentage of Material Damaged Given Damage State
BrickWoodConcreteSteel
URMM-L,
URML-L,
URML-P
S3.53.500
M18.518.566
E50502727
C100100100100
C3L-L,
C3M-L
S330.050.05
M161677
E47.547.53131
C100100100100
C1M-L,
C1M-M
S0.50.50.050.05
M3.53.56.56.5
E17.517.530.530.5
C100100100100

References

  1. Doughty, M.R.; Hammond, G.P. Sustainability and the built environment at and beyond the city scale. Build. Environ. 2004, 39, 1223–1233. [Google Scholar] [CrossRef]
  2. Kylili, A.; Fokaides, P.A.; Jimenez, P.A.L. Key Performance Indicators (KPIs) approach in buildings renovation for the sustainability of the built environment: A review. Renew. Sustain. Energy Rev. 2016, 56, 906–915. [Google Scholar] [CrossRef]
  3. Invidiata, A.; Lavagna, M.; Ghisi, E. Selecting design strategies using multi-criteria decision making to improve the sustainability of buildings. Build. Environ. 2018, 139, 58–68. [Google Scholar] [CrossRef]
  4. Ingrao, C.; Messineo, A.; Beltramo, R.; Yigitcanlar, T.; Ioppolo, G. How can life cycle thinking support sustainability of buildings? Investigating life cycle assessment applications for energy efficiency and environmental performance. J. Clean. Prod. 2018, 201, 556–569. [Google Scholar] [CrossRef]
  5. Poveda, C.A.; Lipsett, M.G. A review of sustainability assessment and sustainability/environmental rating systems and credit weighting tools. J. Sustain. Dev. 2011, 4, 36. [Google Scholar] [CrossRef]
  6. Nelms, C.; Russell, A.D.; Lence, B.J. Assessing the performance of sustainable technologies for building projects. Can. J. Civ. Eng. 2005, 32, 114–128. [Google Scholar] [CrossRef]
  7. Frangopol, D.M.; Soliman, M. Life-cycle of structural systems: Recent achievements and future directions. In Structures and Infrastructure Systems; Routledge: Abingdon-on-Thames, UK, 2019; pp. 46–65. [Google Scholar]
  8. Hossaini, N.; Reza, B.; Akhtar, S.; Sadiq, R.; Hewage, K. AHP based life cycle sustainability assessment (LCSA) framework: A case study of six storey wood frame and concrete frame buildings in Vancouver. J. Environ. Plan. Manag. 2015, 58, 1217–1241. [Google Scholar] [CrossRef]
  9. Lounis, Z.; McAllister, T.P. Risk-based decision making for sustainable and resilient infrastructure systems. J. Struct. Eng. 2016, 142, F4016005. [Google Scholar] [CrossRef] [Green Version]
  10. Kamali, M.; Hewage, K.; Milani, A.S. Life cycle sustainability performance assessment framework for residential modular buildings: Aggregated sustainability indices. Build. Environ. 2018, 138, 21–41. [Google Scholar] [CrossRef]
  11. Passoni, C.; Marini, A.; Belleri, A.; Menna, C. Redefining the concept of sustainable renovation of buildings: State of the art and an LCT-based design framework. Sustain. Cities Soc. 2021, 64, 102519. [Google Scholar] [CrossRef]
  12. Hay, J.; Mimura, N. The changing nature of extreme weather and climate events: Risks to sustainable development. Geomat. Nat. Hazards Risk 2010, 1, 3–18. [Google Scholar] [CrossRef]
  13. Li, C.; Lu, T.; Fu, B.; Wang, S.; Holden, J. Sustainable city development challenged by extreme weather in a warming world. Geogr. Sustain. 2022, 3, 114–118. [Google Scholar] [CrossRef]
  14. Anwar, G.A.; Dong, Y.; Li, Y. Performance-based decision-making of buildings under seismic hazard considering long-term loss, sustainability, and resilience. Struct. Infrastruct. Eng. 2020, 17, 454–470. [Google Scholar] [CrossRef]
  15. Zhou, Z.; Anwar, G.A.; Dong, Y. Performance-Based Bi-Objective Retrofit Optimization of Building Portfolios Considering Uncertainties and Environmental Impacts. Buildings 2022, 12, 85. [Google Scholar] [CrossRef]
  16. Zhong, J.; Mao, Y.; Yuan, X. Lifetime seismic risk assessment of bridges with construction and aging considerations. Structures 2023, 47, 2259–2272. [Google Scholar] [CrossRef]
  17. Barbat, A.H.; Carreño, M.L.; Pujades, L.G.; Lantada, N.; Cardona, O.D.; Marulanda, M.C. Seismic vulnerability and risk evaluation methods for urban areas. A review with application to a pilot area. Struct. Infrastruct. Eng. 2010, 6, 17–38. [Google Scholar] [CrossRef]
  18. Newman, J.P.; Maier, H.R.; Riddell, G.A.; Zecchin, A.C.; Daniell, J.E.; Schaefer, A.M.; van Delden, H.; Khazai, B.; O’Flaherty, M.J.; Newland, C.P. Review of literature on decision support systems for natural hazard risk reduction: Current status and future research directions. Environ. Model. Softw. 2017, 96, 378–409. [Google Scholar] [CrossRef]
  19. Kircher, C.A.; Whitman, R.V.; Holmes, W.T. HAZUS earthquake loss estimation methods. Nat. Hazards Rev. 2006, 7, 45–59. [Google Scholar] [CrossRef]
  20. Whitman, R.V.; Anagnos, T.; Kircher, C.A.; Lagorio, H.J.; Lawson, R.S.; Schneider, P. Development of a national earthquake loss estimation methodology. Earthq. Spectra 1997, 13, 643–661. [Google Scholar] [CrossRef]
  21. Silva, V.; Crowley, H.; Pagani, M.; Monelli, D.; Pinho, R. Development of the OpenQuake engine, the Global Earthquake Model’s open-source software for seismic risk assessment. Nat. Hazards 2014, 72, 1409–1427. [Google Scholar] [CrossRef]
  22. Khan, M.A.; Khan, A.A.; Anwar, G.A.; Usmani, A. Framework for fire risk assessment of bridges. Structures 2021, 33, 523–532. [Google Scholar] [CrossRef]
  23. Hughes, W.; Zhang, W.; Ding, Z. Multiobjective Optimization for Hurricane Retrofit to Improve Coastal Community Structural and Socioeconomic Resilience. Nat. Hazards Rev. 2022, 23, 04022033. [Google Scholar] [CrossRef]
  24. Joyner, M.D.; Kurth, M.H.; Pumo, I.; Linkov, I. Recovery-based design of buildings for seismic resilience. Int. J. Disaster Risk Reduct. 2021, 65, 102556. [Google Scholar] [CrossRef]
  25. Bruneau, M.; Chang, S.E.; Eguchi, R.T.; Lee, G.C.; O’Rourke, T.D.; Reinhorn, A.M.; Shinozuka, M.; Tierney, K.; Wallace, W.A.; Von Winterfeldt, D. A framework to quantitatively assess and enhance the seismic resilience of communities. Earthq. Spectra 2003, 19, 733–752. [Google Scholar] [CrossRef] [Green Version]
  26. Cimellaro, G.P.; Reinhorn, A.M.; Bruneau, M. Framework for analytical quantification of disaster resilience. Eng. Struct. 2010, 32, 3639–3649. [Google Scholar] [CrossRef]
  27. Cimellaro, G.P.; Reinhorn, A.M.; Bruneau, M. Seismic resilience of a hospital system. Struct. Infrastruct. Eng. 2010, 6, 127–144. [Google Scholar] [CrossRef]
  28. Burton, H.V.; Deierlein, G.; Lallemant, D.; Lin, T. Framework for incorporating probabilistic building performance in the assessment of community seismic resilience. J. Struct. Eng. 2015, 142, C4015007. [Google Scholar] [CrossRef] [Green Version]
  29. Miles, S.B.; Burton, H.V.; Kang, H. Community of Practice for Modeling Disaster Recovery. Nat. Hazards Rev. 2018, 20, 04018023. [Google Scholar] [CrossRef]
  30. Anwar, G.A.; Dong, Y.; Ouyang, M. Systems thinking approach to community buildings resilience considering utility networks, interactions, and access to essential facilities. Bull. Earthq. Eng. 2022, 21, 633–661. [Google Scholar] [CrossRef]
  31. Feng, K.; Wang, N.; Li, Q.; Lin, P. Measuring and enhancing resilience of building portfolios considering the functional interdependence among community sectors. Struct. Saf. 2017, 66, 118–126. [Google Scholar] [CrossRef]
  32. Lin, P.; Wang, N. Stochastic post-disaster functionality recovery of community building portfolios I: Modeling. Struct. Saf. 2017, 69, 96–105. [Google Scholar] [CrossRef]
  33. Masoomi, H.; Burton, H.; Tomar, A.; Mosleh, A. Simulation-Based Assessment of Postearthquake Functionality of Buildings with Disruptions to Cross-Dependent Utility Networks. J. Struct. Eng. 2020, 146, 04020070. [Google Scholar] [CrossRef]
  34. Alisjahbana, I.; Kiremidjian, A. Modeling housing recovery after the 2018 Lombok earthquakes using a stochastic queuing model. Earthq. Spectra 2021, 37, 587–611. [Google Scholar] [CrossRef]
  35. Gonzalez, C.; Niño, M.; Jaimes, M.A. Event-based assessment of seismic resilience in Mexican school buildings. Bull. Earthq. Eng. 2020, 18, 6313–6336. [Google Scholar] [CrossRef]
  36. Logan, T.M.; Guikema, S.D. Reframing Resilience: Equitable Access to Essential Services. Risk Anal. 2020, 40, 1538–1553. [Google Scholar] [CrossRef] [PubMed]
  37. Nozhati, S.; Rosenheim, N.; Ellingwood, B.R.; Mahmoud, H.; Perez, M.J.S.; Engineering, I. Probabilistic framework for evaluating food security of households in the aftermath of a disaster. Struct. Infrastruct. Eng. 2019, 15, 1060–1074. [Google Scholar] [CrossRef]
  38. Hassan, E.M.; Mahmoud, H. An integrated socio-technical approach for post-earthquake recovery of interdependent healthcare system. Reliab. Eng. Syst. Saf. 2020, 201, 106953. [Google Scholar] [CrossRef]
  39. Caruso, M.; Pinho, R.; Bianchi, F.; Cavalieri, F.; Lemmo, M.T. Multi-criteria decision-making approach for optimal seismic/energy retrofitting of existing buildings. Earthq. Spectra 2023, 39, 191–217. [Google Scholar] [CrossRef]
  40. Anwar, G.A.; Dong, Y. Surrogate-based decision-making of community building portfolios under uncertain consequences and risk attitudes. Eng. Struct. 2022, 268, 114749. [Google Scholar] [CrossRef]
  41. Zheng, Y.; Dong, Y.; Che, B.; Anwar, G.A. Seismic damage mitigation of bridges with self-adaptive SMA-cable-based bearings. Smart Struct. Syst. Int. J. 2019, 24, 127–139. [Google Scholar]
  42. Masoomi, H.; van de Lindt, J.W. Community-Resilience-Based Design of the Built Environment. ASCE-ASME J. Risk Uncertain. Eng. Syst. Part A Civ. Eng. 2018, 5, 04018044. [Google Scholar] [CrossRef]
  43. Kameshwar, S.; Cox, D.T.; Barbosa, A.R.; Farokhnia, K.; Park, H.; Alam, M.S.; van de Lindt, J.W. Probabilistic decision-support framework for community resilience: Incorporating multi-hazards, infrastructure interdependencies, and resilience goals in a Bayesian network. Reliab. Eng. Syst. Saf. 2019, 191, 106568. [Google Scholar] [CrossRef]
  44. Yu, X.; Gen, M. Introduction to Evolutionary Algorithms; Springer Science & Business Media: Berlin/Heidelberg, Germany, 2010. [Google Scholar]
  45. Anwar, G.A.; Dong, Y.; Zhai, C. Performance-based probabilistic framework for seismic risk, resilience, and sustainability assessment of reinforced concrete structures. Adv. Struct. Eng. 2020, 23, 1454–1472. [Google Scholar] [CrossRef]
  46. Clemett, N.; Carofilis Gallo, W.W.; Gabbianelli, G.; O’Reilly, G.J.; Monteiro, R. Optimal Combined Seismic and Energy Efficiency Retrofitting for Existing Buildings in Italy. J. Struct. Eng. 2023, 149, 04022207. [Google Scholar] [CrossRef]
  47. Mauro, G.M.; Menna, C.; Vitiello, U.; Asprone, D.; Ascione, F.; Bianco, N.; Prota, A.; Vanoli, G.P. A multi-step approach to assess the lifecycle economic impact of seismic risk on optimal energy retrofit. Sustainability 2017, 9, 989. [Google Scholar] [CrossRef] [Green Version]
  48. Krawinkler, H.; Zareian, F.; Medina, R.A.; Ibarra, L.F. Decision support for conceptual performance-based design. Earthq. Eng. Struct. Dyn. 2006, 35, 115–133. [Google Scholar] [CrossRef]
  49. Dong, Y.; Frangopol, D.M. Performance-based seismic assessment of conventional and base-isolated steel buildings including environmental impact and resilience. Earthq. Eng. Struct. Dyn. 2016, 45, 739–756. [Google Scholar] [CrossRef]
  50. Qian, J.; Dong, Y. Uncertainty and multi-criteria global sensitivity analysis of structural systems using acceleration algorithm and sparse polynomial chaos expansion. Mech. Syst. Signal Process. 2022, 163, 108120. [Google Scholar] [CrossRef]
  51. Cornell, C.A. Engineering seismic risk analysis. Bull. Seismol. Soc. Am. 1968, 58, 1583–1606. [Google Scholar] [CrossRef]
  52. Stewart, J.P.; Douglas, J.; Javanbarg, M.; Bozorgnia, Y.; Abrahamson, N.A.; Boore, D.M.; Campbell, K.W.; Delavaud, E.; Erdik, M.; Stafford, P.J. Selection of ground motion prediction equations for the global earthquake model. Earthq. Spectra 2015, 31, 19–45. [Google Scholar] [CrossRef] [Green Version]
  53. Qian, J.; Dong, Y. Multi-criteria decision making for seismic intensity measure selection considering uncertainty. Earthq. Eng. Struct. Dyn. 2020, 49, 1095–1114. [Google Scholar] [CrossRef]
  54. Cardone, D.; Perrone, G. Damage and loss assessment of pre-70 RC frame buildings with FEMA P-58. J. Earthq. Eng. 2017, 21, 23–61. [Google Scholar] [CrossRef]
  55. Kim, J.-H.; Han, J.-H.; Kim, Y.-H.; Choi, S.-H.; Kim, E.-S. Preference-based solution selection algorithm for evolutionary multiobjective optimization. IEEE Trans. Evol. Comput. 2011, 16, 20–34. [Google Scholar] [CrossRef]
  56. Wang, F.; Li, Y.; Zhang, H.; Hu, T.; Shen, X.-L. An adaptive weight vector guided evolutionary algorithm for preference-based multi-objective optimization. Swarm Evol. Comput. 2019, 49, 220–233. [Google Scholar] [CrossRef]
  57. Aziz, S.; Jiang, H.; Peng, J.-C.; Ruan, J.-Q.; Wang, H.-Z. Optimization of base operation points of MTDC grid for improving transition smooth. In Proceedings of the 2017 IEEE Conference on Energy Internet and Energy System Integration (EI2), Beijing, China, 26–28 November 2017; pp. 1–6. [Google Scholar]
  58. Deb, K.; Pratap, A.; Agarwal, S.; Meyarivan, T. A fast and elitist multiobjective genetic algorithm: NSGA-II. IEEE Trans. Evol. Comput. 2002, 6, 182–197. [Google Scholar] [CrossRef] [Green Version]
  59. Aziz, S.; Peng, J.; Wang, H.; Jiang, H. Admm-based distributed optimization of hybrid mtdc-ac grid for determining smooth operation point. IEEE Access 2019, 7, 74238–74247. [Google Scholar] [CrossRef]
  60. Deb, K. Multi-objective optimisation using evolutionary algorithms: An introduction. In Multi-Objective Evolutionary Optimisation for Product Design and Manufacturing; Springer: Berlin/Heidelberg, Germany, 2011; pp. 3–34. [Google Scholar]
  61. Saaty, T.L. A scaling method for priorities in hierarchical structures. J. Math. Psychol. 1977, 15, 234–281. [Google Scholar] [CrossRef]
  62. Tang, Y.; Lam, N.; Tsang, H.-H.; Lumantarna, E. An adaptive ground motion prediction equation for use in low-to-moderate seismicity regions. J. Earthq. Eng. 2022, 26, 2567–2598. [Google Scholar] [CrossRef]
  63. Katsanos, E.I.; Sextos, A.G.; Manolis, G.D. Selection of earthquake ground motion records: A state-of-the-art review from a structural engineering perspective. Soil Dyn. Earthq. Eng. Struct. Dyn. 2010, 30, 157–169. [Google Scholar] [CrossRef]
  64. Waseem, M.; Khan, S.; Khan, M.A. Probabilistic Seismic Hazard Assessment of Pakistan Territory Using an Areal Source Model. Pure Appl. Geophys. 2020, 177, 3577–3597. [Google Scholar] [CrossRef]
  65. HAZUS. Multi-Hazard Loss Estimation Methodology, Earthquake Model; Department of Homeland Security, FEMA: Washington, DC, USA, 2003.
  66. Chau, C.; Hui, W.; Ng, W.; Powell, G. Assessment of CO2 emissions reduction in high-rise concrete office buildings using different material use options. Resour. Conserv. Recycl. 2012, 61, 22–34. [Google Scholar] [CrossRef]
  67. Gencturk, B.; Hossain, K.; Lahourpour, S. Life cycle sustainability assessment of RC buildings in seismic regions. Eng. Struct. 2016, 110, 347–362. [Google Scholar] [CrossRef]
  68. Ma, C.-K.; Apandi, N.M.; Sofrie, C.S.Y.; Ng, J.H.; Lo, W.H.; Awang, A.Z.; Omar, W. Repair and rehabilitation of concrete structures using confinement: A review. Constr. Build. Mater. 2017, 133, 502–515. [Google Scholar] [CrossRef]
  69. Mwafy, A.; Elkholy, S. Performance assessment and prioritization of mitigation approaches for pre-seismic code structures. Adv. Struct. Eng. 2017, 20, 917–939. [Google Scholar] [CrossRef]
  70. Caterino, N.; Iervolino, I.; Manfredi, G.; Cosenza, E. Comparative analysis of multi-criteria decision-making methods for seismic structural retrofitting. Comput.-Aided Civ. Infrastruct. Eng. 2009, 24, 432–445. [Google Scholar] [CrossRef]
  71. Caterino, N.; Iervolino, I.; Manfredi, G.; Cosenza, E. Multi-criteria decision making for seismic retrofitting of RC structures. J. Earthq. Eng. 2008, 12, 555–583. [Google Scholar] [CrossRef]
  72. Anwar, G.A.; Dong, Y. Seismic resilience of retrofitted RC buildings. Earthq. Eng. Eng. Vib. 2020, 19, 561–571. [Google Scholar] [CrossRef]
  73. Thermou, G.; Elnashai, A.S. Seismic retrofit schemes for RC structures and local-global consequences. Prog. Struct. Eng. Mater. 2006, 8, 1–15. [Google Scholar] [CrossRef]
  74. ASCE-41-13; Seismic Evaluation and Retrofit of Existing Buildings. American Society of Civil Engineers: Reston, VA, USA, 2013.
  75. Fung, J.F.; Fung, J.F.; Butry, D.T.; Sattar, S.; McCabe, S.L. A Methodology for Estimating Seismic Retrofit Costs; US Department of Commerce, National Institute of Standards and Technology: Gaithersburg, MD, USA, 2017.
  76. Hart, G.C.; Srinivasan, M. Typical costs of seismic rehabilitation of existing buildings. Struct. Des. Tall Spec. Build. 2008, 17, 445–469. [Google Scholar] [CrossRef]
  77. Fung, J.F.; Sattar, S.; Butry, D.T.; McCabe, S.L. A predictive modeling approach to estimating seismic retrofit costs. Earthq. Spectra 2020, 36, 579–598. [Google Scholar] [CrossRef]
  78. Fung, J.; Sattar, S.; Butry, D.; McCabe, S. Selecting building characteristics to predict seismic retrofit costs of a building portfolio. In Proceedings of the 2nd International Conference on Natural Hazards & Infrastructure, Chania, Greece, 23–26 June 2019; pp. 23–26. [Google Scholar]
Figure 1. The proposed framework for multi-objective optimization and decision making to enhance the performance of community buildings.
Sustainability 15 04385 g001
Figure 2. Damage states of buildings against (a) 95-y; (b) 475-y; and (c) 2475-y earthquake hazards.
Sustainability 15 04385 g002
Figure 3. Consequences: (a) social (injuries); (b) economic (repair costs); (c) environmental (embodied energy); and (d) environmental (tons kgCO2).
Sustainability 15 04385 g003
Figure 4. Consequences under four hazard scenarios: (a) social (injuries); (b) economic (repair costs); (c) environmental (embodied energy); and (d) environmental (tons kgCO2).
Sustainability 15 04385 g004
Figure 5. Additional consequences under four hazard scenarios in terms of non-functional buildings.
Sustainability 15 04385 g005
Figure 6. Pareto optimal solutions for risk performance indicator showing total repair costs against total retrofit costs.
Sustainability 15 04385 g006
Figure 7. Pareto optimal solutions for performance indicators related to the following: (a) risk (casualty-1); (b) resilience (days); (c) sustainability (tons kg CO2); and (d) sustainability (embodied energy GJ).
Sustainability 15 04385 g007
Figure 8. Performance scores under 95-year hazard scenario for case 1: Injuries given high weightage; case 2: Equal weighting factors; and case 3: Retrofit costs given high weightage.
Sustainability 15 04385 g008
Figure 9. Population performance scores under four hazard scenarios.
Sustainability 15 04385 g009
Table 1. Pairwise comparison matrix utilized in this illustrative example.
Performance ObjectivesRetrofit Costs (USD)Total Number of InjuriesTotal Repair Costs (USD)Total Downtime (Days)Total Carbon Emissions (Tons kg CO2)Total Embodied Energy
(GJ)
Retrofit costs (USD)1.000.502.003.004.005.00
Total number of Injuries2.001.002.003.004.005.00
Total repair costs (USD)0.500.501.002.003.004.00
Total downtime (days)0.330.330.501.002.003.00
Total carbon emissions (Tons kg CO2)0.250.250.330.501.002.00
Total embodied energy
(GJ)
0.200.200.250.330.501.00
Disclaimer/Publisher’s Note: The statements, opinions and data contained in all publications are solely those of the individual author(s) and contributor(s) and not of MDPI and/or the editor(s). MDPI and/or the editor(s) disclaim responsibility for any injury to people or property resulting from any ideas, methods, instructions or products referred to in the content.

