1. Introduction
Water and energy are two intertwined global issues. Access to safe drinking water is a major issue that affects a large number of people and is expected to worsen as a result of population growth. Water desalination is considered the best choice to secure sustainable fresh water; however, it requires a significant amount of energy [
1]. Wastewater discharge has been on the rise in tandem with global population growth, industrialization, and urbanization [
2,
3,
4,
5]. While securing fresh water is critical for several countries, wastewater is discharged in large quantities. The proper treatment of such wastewater can secure a considerable portion of fresh water requirements. High salts can be found in various industrial wastewaters, including textiles, medicines, leather goods, fish, meat processing, and marine products [
6,
7]. Along with contaminated groundwater and wastewater from mining operations and recycling units in the gas and oil industries, salt can also be discovered in significant amounts in the leachate of urban dumpsites [
8,
9]. The fish processing industry needs a lot of sodium chloride for preservation [
10,
11]. High salt concentrations are necessary in the tanning process used by the leather industry to strip hair and wool from animal skins [
12,
13]. Furthermore, the salt content of the effluent from the oil refining, extraction, and processing sectors varies significantly, often being several times higher than the salt content of saltwater [
14].
If wastewater is not handled correctly, the environment and human health can suffer [
15]. These consequences may involve harm to fish and wildlife populations, in addition to oxygen reduction and drinking water pollution [
16]. The main purpose of wastewater treatment is the removal of suspended solids and metal ions before returning the effluent to the environment [
17,
18]. As solid organic matter decays, it consumes oxygen that is necessary for plants and animals. The proper treatment/management of wastewater signifies a genuine sanitary and environmental challenge for all stakeholders worldwide [
19,
20,
21,
22,
23,
24]. Effective treatment options are available, including reusing treated wastewater [
25,
26].
The biological wastewater treatment approach, the conventional wastewater treatment method, is a widespread treatment method [
27,
28]. It considers biodegradation bleaching with the help of various microorganisms, algae, yeast, fungi, and bacteria [
29]. This simple and inexpensive process combines aerobic and anaerobic processes [
30]. The use of biological treatment methods for treating saline wastewater is currently unattainable because of the dehydration of microbial cells in high-salt wastewater. Therefore, in the case of saline wastewater, salt removal is necessary before biological treatment [
31]. However, conventional technologies rarely succeed in removing salt from wastewater. For the treatment of wastewater with a high salt concentration, membrane treatment methods, including reverse osmosis, nanofiltration, ultrafiltration–nanofiltration, and sophisticated oxidation processes, including electrolysis and the electro-Fenton process, have been proposed [
32,
33,
34]. These wastewaters have a high electrical conductivity because of their high concentration of cations and anions. Therefore, treating such wastewater with electron-assisted approaches may be a good solution [
35,
36].
The reaction time, pH, salt concentration, and DC applied voltage are considered essential factors that influence the performance of the electrochemical oxidation process. The performance of the electrochemical oxidation process is measured through the chemical oxygen demand (COD) and total organic carbon (TOC) removal. Optimizing the controlling parameters, i.e., reaction time, pH, salt concentration, and the applied voltage, is essential to increase the overall performance of the treatment process in terms of COD and TOC removal efficiencies. Experimental optimization of such parameters is time-consuming, costly, and needs significant effort and money. Although there has been success in this regard using mathematical and physical modelling, the accuracy of these models is limited by the need for assumptions [
37]. Artificial intelligence (AI) is a robust modelling and optimization method that is effectively used in various processes [
38]. AI was applied successfully to modelling and optimizing the performance of microbial fuel cells in terms of increasing the power production at higher COD removal [
22,
39], biodiesel production [
40,
41], syngas production [
42,
43,
44], biohydrogen production [
45,
46], power output of solid oxide fuel cells [
47,
48], carbon capture [
49,
50], and wastewater treatment [
51]. Consequently, this work aims to improve the performance of the electrochemical oxidation process by simultaneously boosting the COD and TOC removal efficiencies using artificial intelligence and modern optimization. Unlike normal mathematical tools, ANFIS expresses the functionality between the output and the inputs in the form of some IF-THEN fuzzy rules. The proposed methodology for the case under investigation contains two phases. The first phase is building an accurate model using ANFIS to simulate the electrochemical oxidation process in terms of three controlling input parameters. The second phase is the optimal parameter identification process using the hunger games search algorithm (HGSA). During the optimization process, three controlling parameters were used. The reaction time, pH, salt concentration, and DC applied voltage were used as decision variables, whereas the objective function was simultaneously maximization of the COD and TOC removal efficiencies.
The main contributions can be outlined as follows.
Creating an precise ANFIS model of the electrochemical oxidation process.
For the first time, a hunger games search algorithm is used to define the best values of reaction time, pH, salt concentration, and DC applied voltage
Boosting the COD and TOC removal efficiencies simultaneously
Demonstration of the proposed methodology
3. Methodology
The considered methodology comprises two stages: ANFIS modelling and optimal parameter determination.
3.1. ANFIS-Modelling
For the ANFIS model, the nonlinear mapping of the inputs is achieved using membership functions (MFs) during the fuzzification stage. Creating the rules, evaluating the rules’ outputs, and merging the fired rules to obtain the output occurs during the inference engine phase [
53]. Ultimately, the output is switched from a fuzzy shape to a crisp shape during the defuzzification stage. Despite various MF shapes and defuzzification methods, the Gaussian structure and weight average are considered in this work. The relationships between the inputs and outputs are patterned by an IF-THEN system as presented as follows [
49]:
IF x is X and y is Y THEN z = f(x, y);
Where, x and y represent the inputs and z denotes the output; X and Y denote the membership functions.
The output
f is defined in terms of the two rules’ outputs,
f1 and
f2, as follows:
| (Output Layer) |
| Evaluating | (Defuzzification Layer) |
| | (N Layer) |
| (π Layer) |
| are the MF values of the two inputs | (Fuzzification Layer) |
3.2. Hunger Games Search
The original code of HGS is proposed by Yang et al. [
54]. We integrated this optimizer for the first time with ANFIS modelling to determine the best values of the reaction time, pH, salt concentration, and DC applied voltage in order to improve the efficiency of the electrochemical oxidation process. The behavior of the HGS can be expressed mathematically to emulate the contraction stage as follows [
54]:
where
and
are randoms;
is current iterations;
and are the weights of hunger;
is the location information of a random individual in all the optimal individuals;
is each individual’s location;
The expression of
is presented in (2) [
54].
where
,
is the fitness value;
denotes the best fitness;
denotes a hyperbolic function .
The expression of
is presented in (3):
where
denotes a random value;
denotes the maximum iterations number.
The starvation characteristics of particles can be presented as follows:
The expressions of
and
can be presented as in (5) and (6) respectively [
54]:
here
denotes the hunger of every particle;
is the number of particles;
is the sum of hungry feelings of all particles;
, and denote randoms values.
The expression for
can be presented as follows:
where
is the fitness of every particle in the present iteration.
The expression for
is presented in (9):
where
is a random value;
is the fitness of every particle;
denotes the best fitness;
WF is the worst fitness obtained in the current iteration process;
and are the maximum and minimum limits;
The hunger sensation is limited to a lower bound, .
4. Results and Discussion
The number of measured points that were used for creating the ANFIS model is 29. These samples were distributed to two parties. The first part had 20 samples. It was employed to train the model, whereas the reminder was employed to test it. The ANFIS model was trained by LSE and backpropagation in the forward and backward paths, respectively. The SC was adopted for generation ANFIS rules. In this work the number of rules are 17 and 19 for COD and TOC models, respectively. Next, the models were trained until the minimum RMSE value was attained. The statistical assessment of the ANFIS-based model is explained in
Table 3.
Referring to
Table 1, the RMSE values were 0.611 and 6.74during training and testing, respectively, of the COD-based model. The
R-squared values were 0.999 and 0.91 during training and testing the model, respectively. The RMSE decreased from 23.7 using ANOVA [
36] to 3.79 using ANFIS (decrease of 84%). The adjusted
R-squared increased from 0.92 using ANOVA to 0.95 using ANFIS (increase of 3.26%). For the TOC-based ANFIS model, the RMSE values were 0.838 and 4.547 for training and testing data, respectively. The
R-squared values were 0.994 and 0.92 for training and testing. Compared with ANOVA [
36], the RMSE decreased from 18.78 using ANOVA to 2.63 using ANFIS (decrease of 86%). The adjusted
R-squared raised from 0.89 using ANOVA to 0.96 using ANFIS (increase of 7.87%). In sum, the lowered RMSE and the boosted
R-squared values of the ANFIS model demonstrate a successful modelling stage.
Figure 2a,b presents the 4-inputs-single-output structure of the ANFIS model for COD and TOC. There were 17 and 19 rules for COD and TOC models, respectively. To obtain the rules, the subtractive clustering method was used. The shapes of the Gaussian MFs are presented in
Figure 3a,b for COD and TOC models. The colors in
Figure 3 represent the clusters.
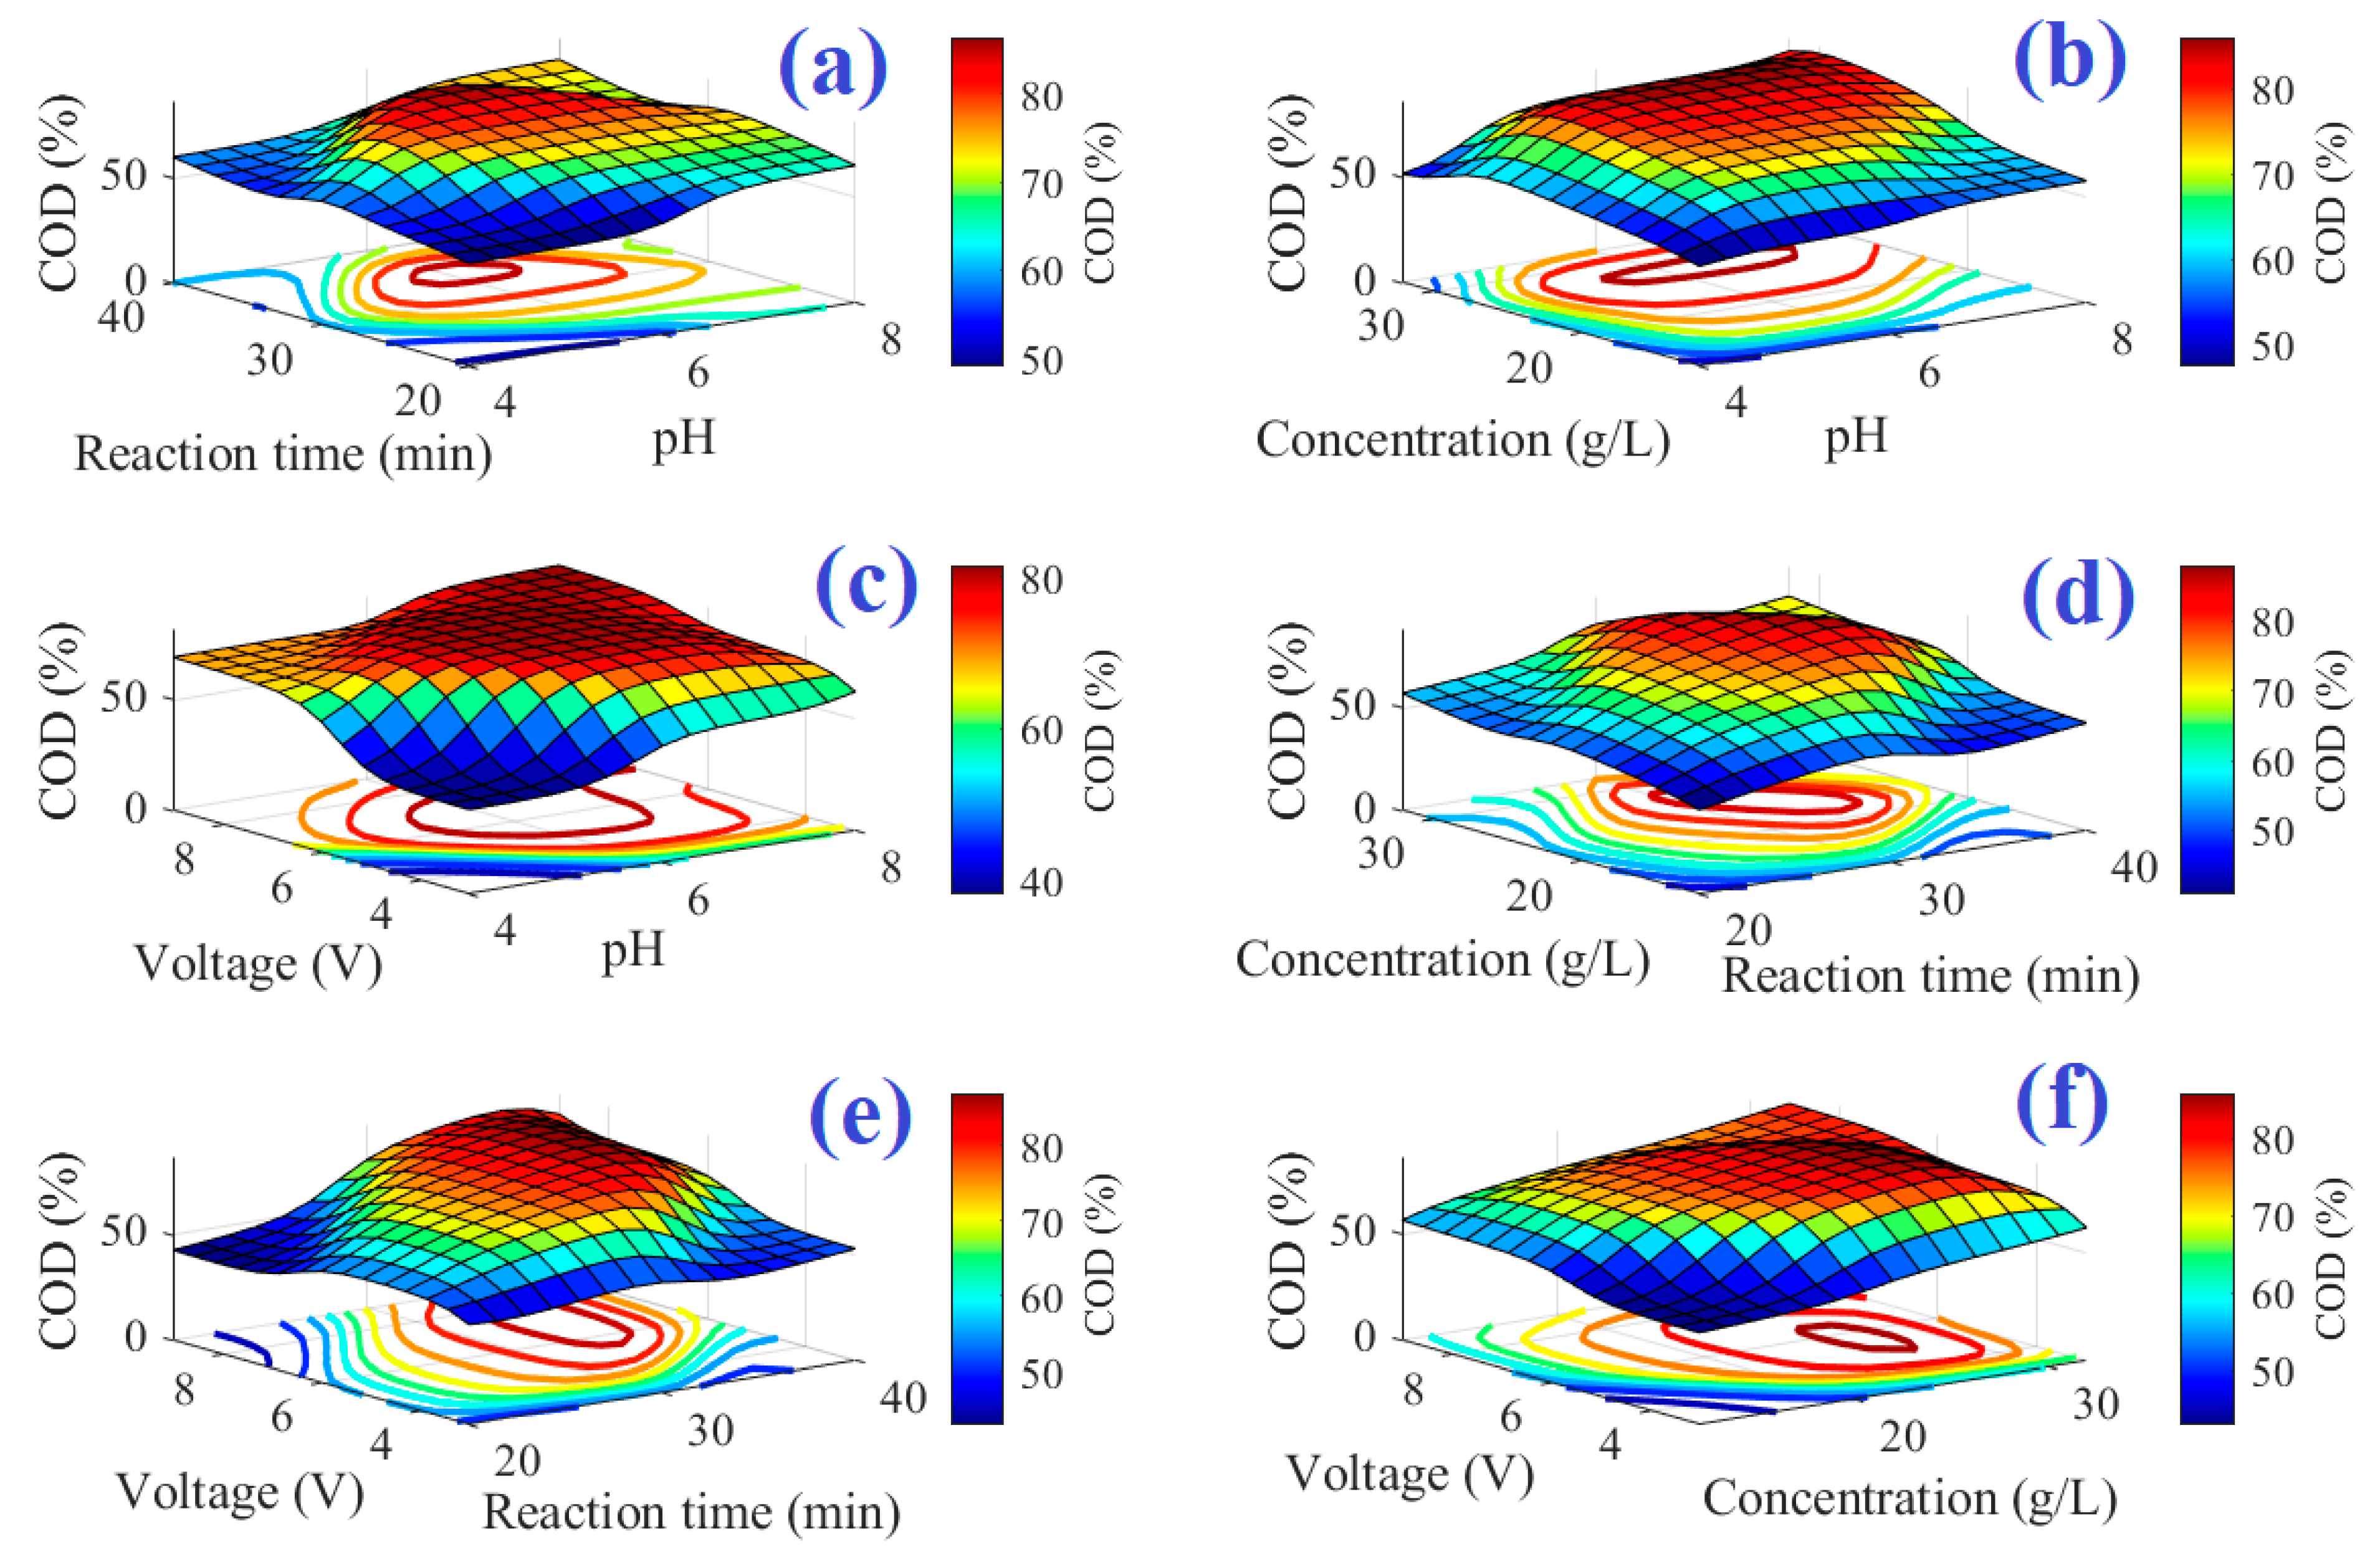
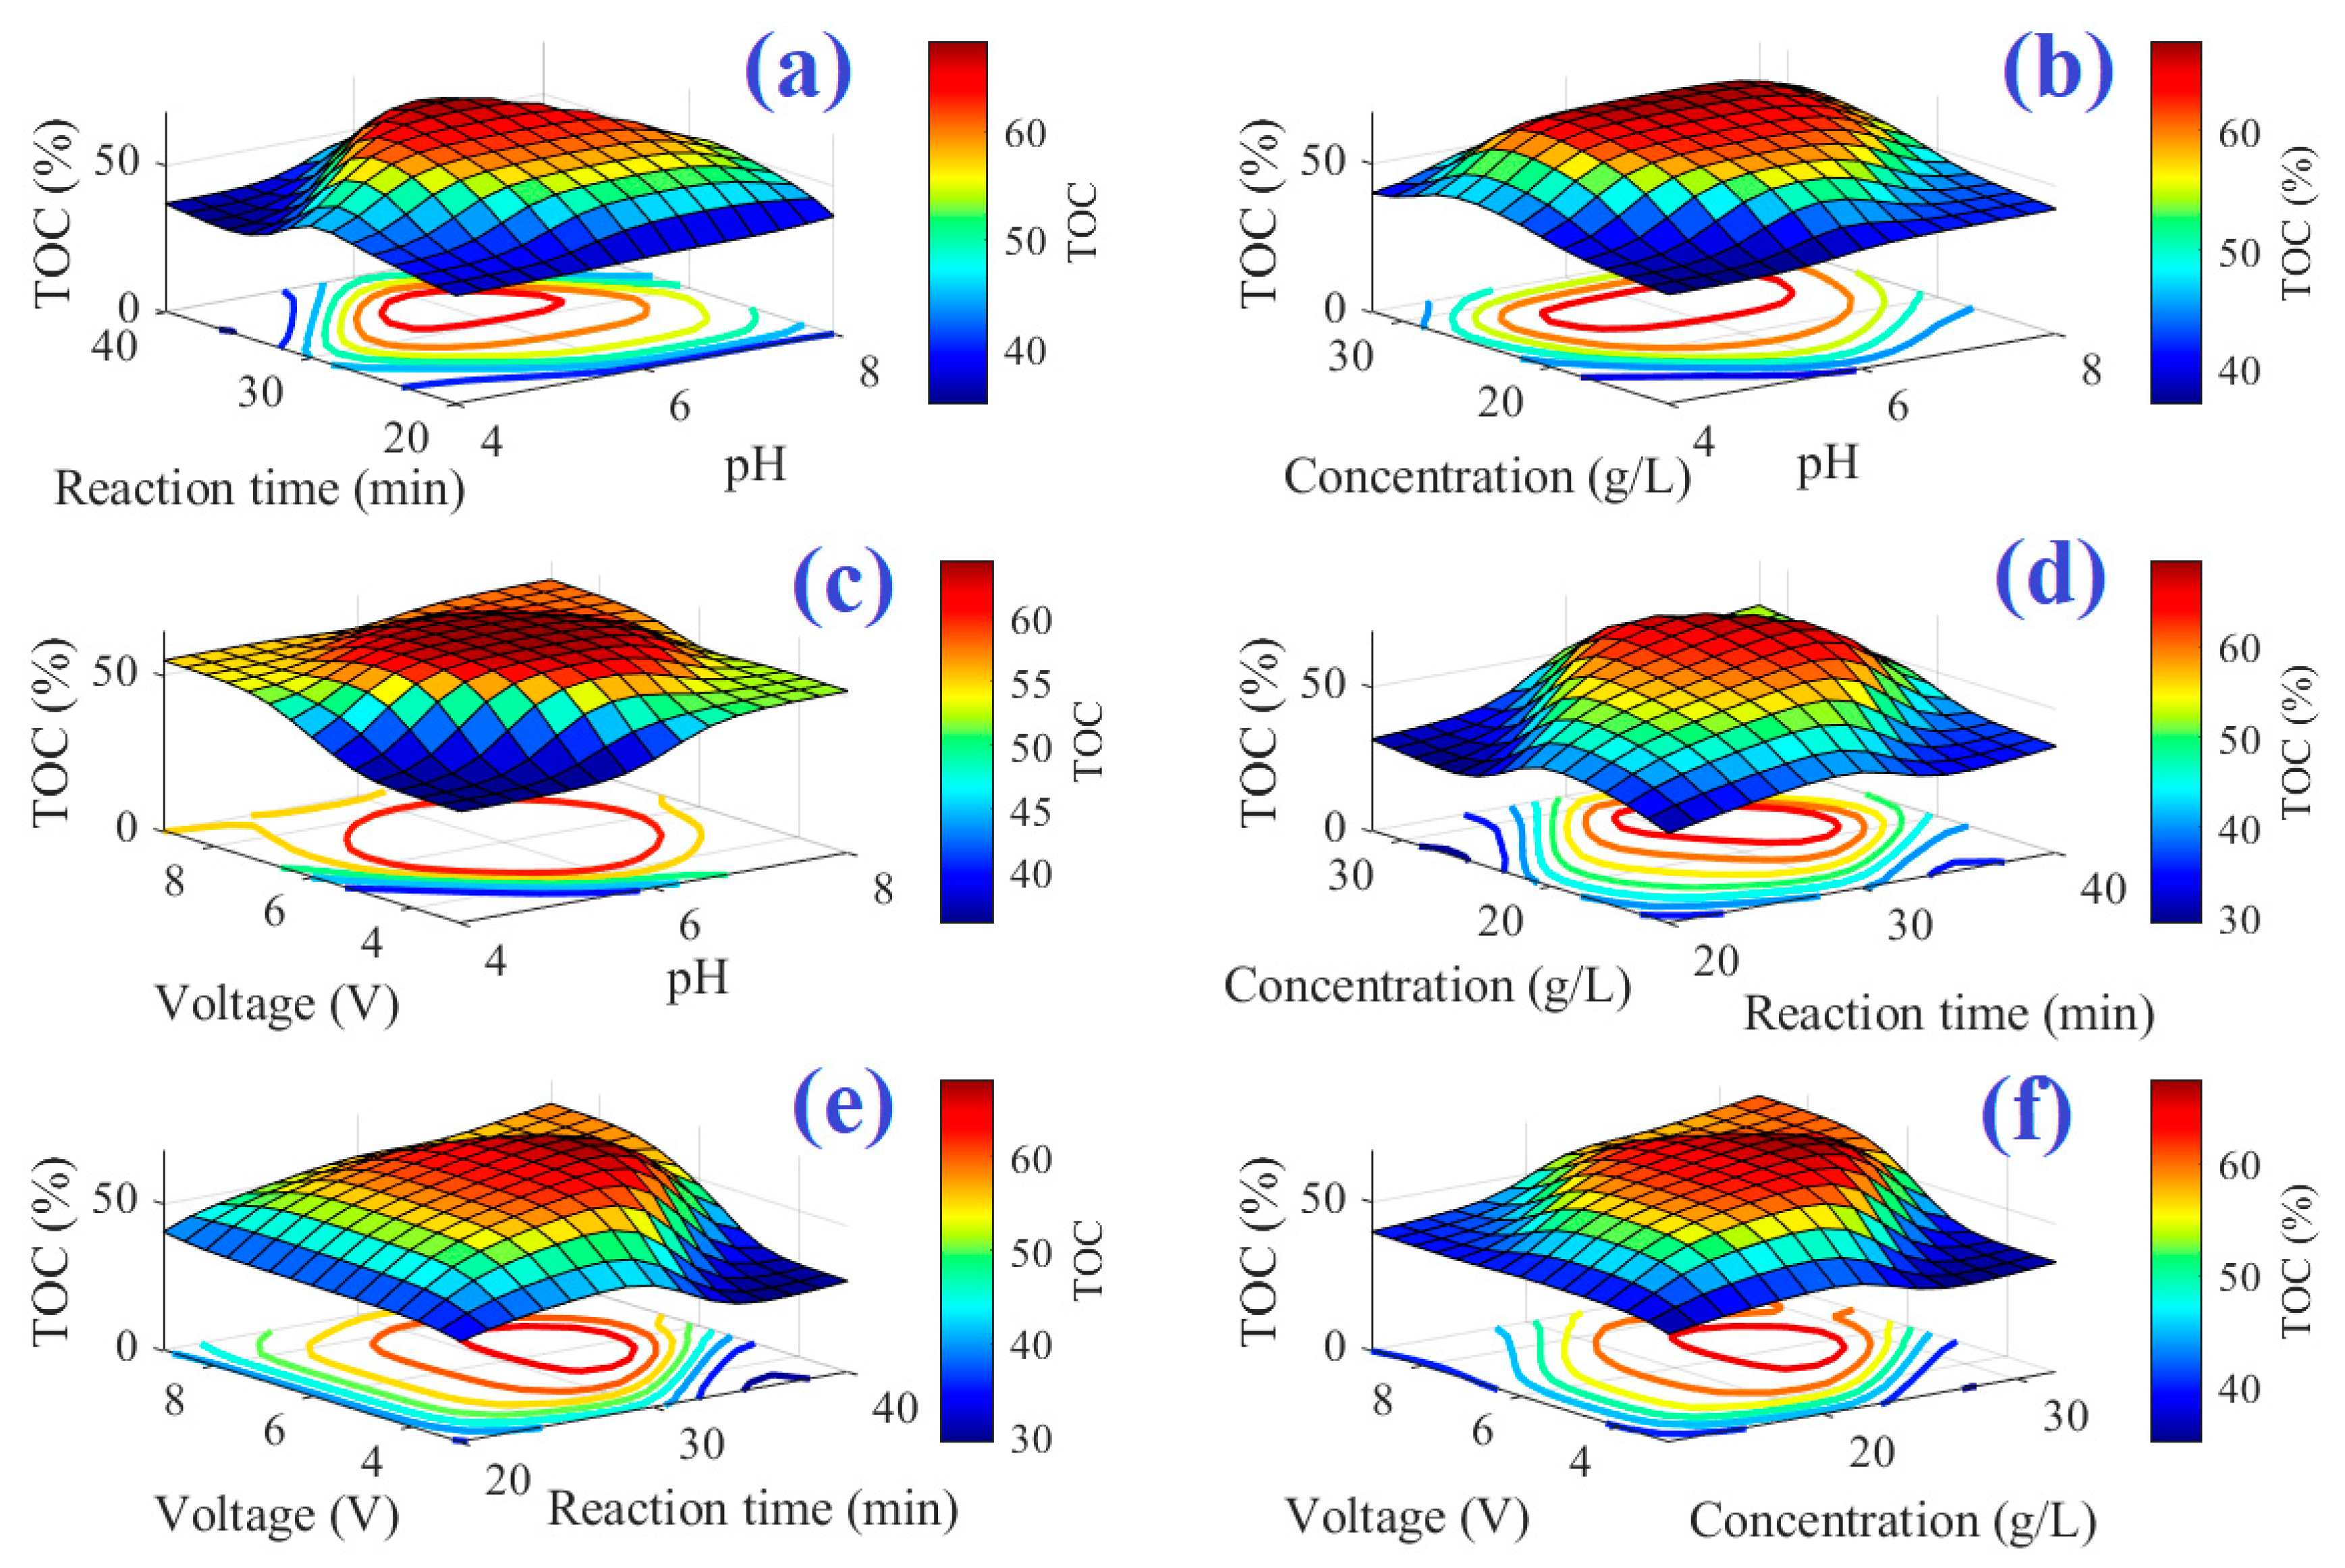
Figure 4 and
Figure 5 point out the three-dimensional description with contours of the system’s input–output for COD and TOC models, respectively. The maximum point of the output reaches dark red, but the minimum point reaches dark blue.
Figure 4 illustrates the surface of ANFIS-based models for COD removal at the different interactions of (a) pH and reaction time, (b) pH and salt concentration, (c) applied voltage and pH, (d) salt concentration and reaction time, (e) applied voltage and reaction time, and (f) applied voltage and salt concentration. As depicted in the figure, there is an optimum condition of the various parameters, i.e., pH, salt concentration, reaction time, and applied voltage. As shown in these figures, as the salt concentration increases, so does the percentage of COD and TOC removed. This is due to indirect oxidation caused by the production of chloride or hypochlorite in response to the NaCl electrolysis process occurring in the reactor, which, together with the produced hydroxyl radicals, causes organic compound degradation [
55]. The values of COD and TOC removal increase as pH values rise. This rising trend is predicted for pH values up to 7, after which the removal percentage will continue to fall. Chloride compounds such as hypochlorite, chloride ions, chlorine gas, and chlorate are formed during electrochemical treatment. The appropriate pH for this study was alkaline. The chlorine gas produced from Cl ions at the anode (Equation (10)) is converted to hydrolyzed hypochlorite in this alkaline environment via the following reactions (Equations (11) and (12)) [
36]:
Such hypochlorite ions are used in the oxidation of the organic materials according to the following equation (Equation (13)):
As is clear from the figure, the TOC and COD removal increased over time until 30 min, and then decreased with a further increase in time. The optimum time for the COD and TOC removal was around 30 min. This is because as reaction time increases, the percentage removal of the TOC and COD increases, however, as time proceeds, the salt concentration (responsible for the hypochlorite production) decreases, and thus the percentage removal decreases again. Furthermore, it is clear that the increase in the applied voltage from 4 to 6 V increased the removal percentages of the TOC and COD. However, they decreased at higher applied voltages. This could be related to the sequestration of metal hydroxides at the electrode level [
36,
56]. The increase in the salt concentration resulted in an increase in both TOC and COD removal, and again they decreased at higher salt concentrations beyond 22 g/L. The increased removal percentages with increasing salt concentration could be related to the positive role of the Cl on the oxidation of the organic materials, as discussed above and reported by Panizza and Cerisola [
57]. However, at higher salt concentrations, the evolution of the Cl
2 gas from the reactor decreased the removal percentages.
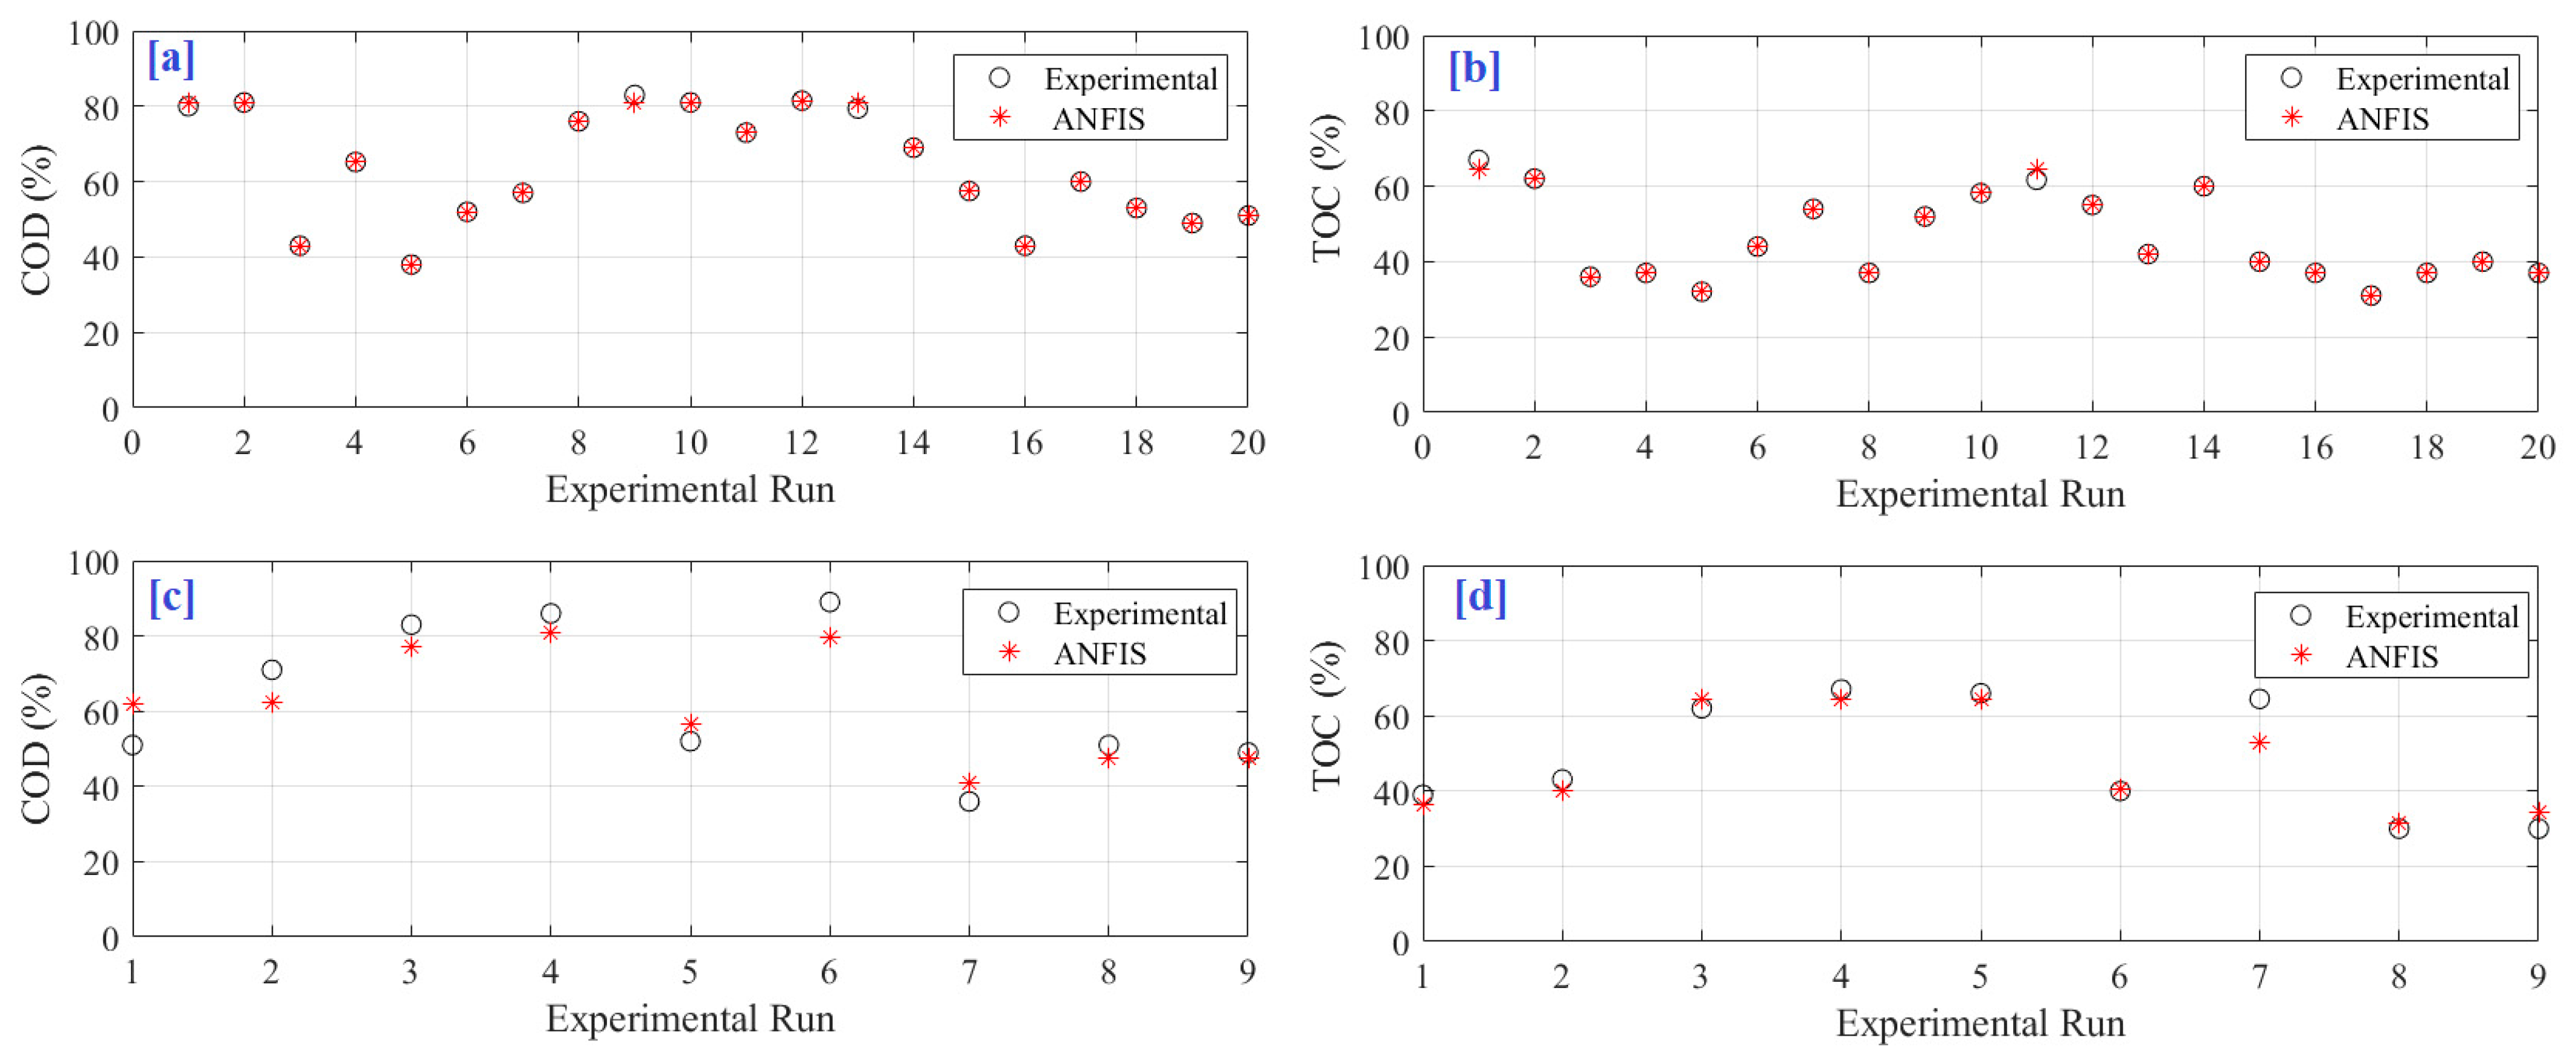
Catching the accurate relation between the inputs and outputs of electrochemical oxidation motivates the created model to estimate both COD and TOC perfectly. This is obvious from the mapping of the ANFIS model’s predicted outputs with the measured dataset as illustrated in
Figure 6a–d, for training the COD model, training the TOC model, testing the COD model, and testing the TOC model, respectively. There is a match between both experimental and ANFIS data. In addition, the predictions’ plots across the 100% accuracy line are demonstrated in
Figure 7a,b, respectively, for COD and TOC during the training period.
The following section shows the parameter identification process. The parameter identification process aims to define the optimal values of reaction time, pH, salt concentration, and applied voltage to increase COD and TOC simultaneously. Consequently, after creating a consistent ANFIS model, HGSA was used to define the optimal values for four input parameters. To prove the effectiveness of HGSA, a comparison was made with slime mold algorithm, sine cosine algorithm (SCA) and Harris’s hawks optimization (HHO). The following relation can define the optimization problem of the case study:
where
x is the four input parameters.
Table 4 presents the optimal values of action time, pH, salt concentration, and DC applied voltage and the corresponding COD and TOC using measured data, RSM methodology, and the HGSA. The combination between ANFIS and HGSA simultaneously increased the COD and TOC. The COD increased to 97.63% with a rate of 9.7% and 6.4% compared to experimental and RSM methodology, respectively. In the same way, the TOD increased to 69.42% with a rate of 7.63% and 1.4% compared with measured data and RSM methodology, respectively.
To check the robustness of the considered optimization algorithms, each one was implemented 30 times.
Table 5 demonstrates a comparison among the considered algorithms. The number of populations (5) and iterations (100) were fixed with algorithms during the optimization.
Table 5 shows the superiority of HGSA compared with SMA, SCA, and HHO. HGSA achieved the lowest STD value of 0.0127, whereas the maximum STD of 3.2264 was obtained by HHO.
Figure 8 demonstrates the statistical analysis of 30 runs.
Figure 8a shows the maximum objective function found over 30 runs of HGSA. The details of the 30 run values for HGSA, HHO, SCA, and SMA are presented in
Figure 8b–e. The best mean cost function of 166.9904 was obtained by HGSA, whereas SCA obtained the worst cost of 155.2735. This demonstrated the efficacy of the suggested methodology.
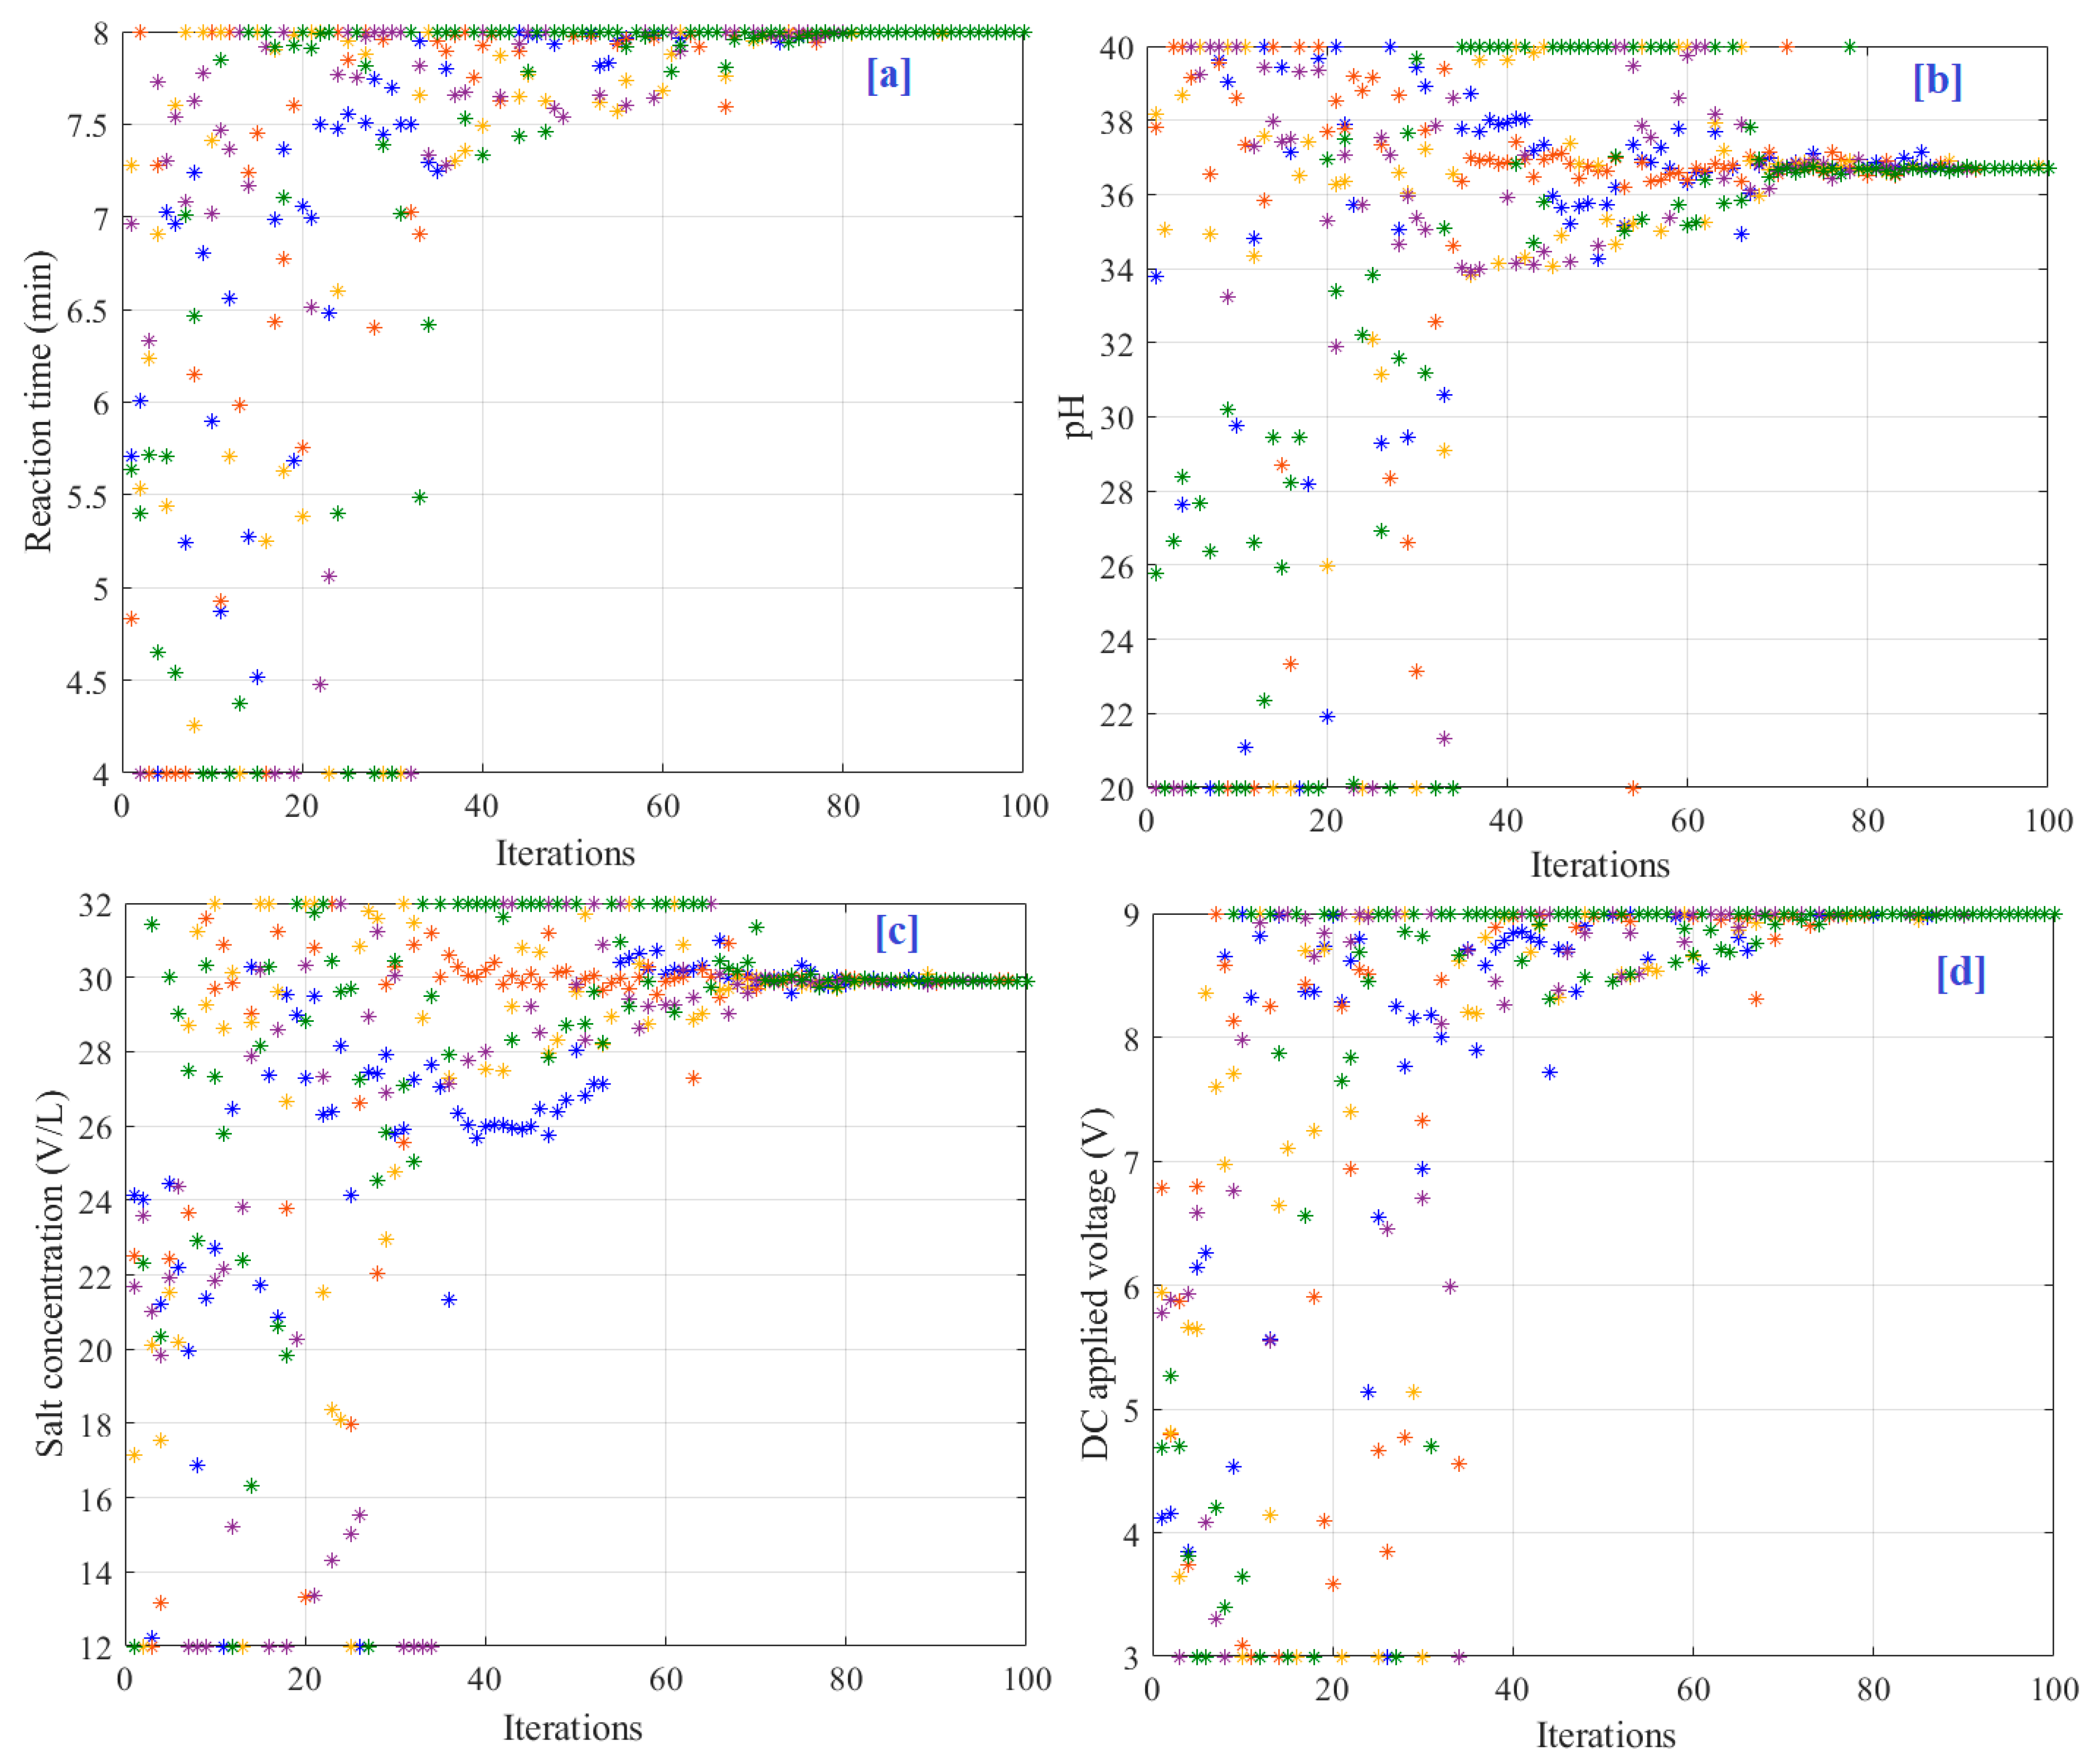
Figure 9a–d shows the particle convergence during the optimization process for reaction time, pH, salt concentration, and DC applied voltage, respectively. As presented in
Figure 8, the optimal solutions were 36.69 min, 8, 29.9 g/L, and 9.0 V, respectively, for reaction time, pH, salt concentration, and DC applied voltage.
5. Conclusions
The objective of this research is to model and optimize the performance of the electrochemical oxidation process. The methodology integrates the ANFIS modelling and parameter identification with HGSA. Two important outputs, COD and TOC removal efficiencies of saline wastewater treatment, were increased through optimal tuning of the reaction time, pH, salt concentration, and DC applied voltage. The ANFIS model was compared with ANOVA. At first, a robust ANFIS-based model of the electrochemical oxidation process was created. Compared with ANOVA, the COD-based ANFIS model’s RMSE value was reduced from 23.7 using ANOVA to 3.79 using ANFIS. This is a decrease of 84%. The adjusted R-squared was boosted from 0.92 (ANOVA) to 0.95 (ANFIS). This is a increase of 3.26%. Additionally, for the TOC-based ANFIS model, the RMSE value was reduced from 18.78 using ANOVA to 2.63 using ANFIS. This is a decrease of 86%. The adjusted R-squared was boosted from 0.89 (ANOVA) to 0.96 (ANFIS). This is a increase of 7.87%. This proved the accuracy of ANFIS modelling. Then, using HGSA, the best values for controlling parameters of 36.69 min, 8, 29.9 g/L and 9.0 V were identified for reaction time, pH, salt concentration, and DC applied voltage, respectively. Under this condition, the COD increased to 97.63% with a rate of 9.7% and 6.4% compared with measured data and RSM methodology, respectively. In the same direction, the TOD increased to 69.42% with a rate of 7.63% and 1.4% compared with measured data and RSM methodology, respectively.


 ,
, 


