Article

The Costs of Soil Erosion to Crop Production in Canada between 1971 and 2015

Department of Soil Science, Faculty of Agricultural and Food Science, University of Manitoba, 13 Freedman Crescent, Winnipeg, MB R3T 2N2, Canada
*
Author to whom correspondence should be addressed.
Sustainability 2023, 15(5), 4489; https://doi.org/10.3390/su15054489
Submission received: 29 January 2023 / Revised: 26 February 2023 / Accepted: 28 February 2023 / Published: 2 March 2023
(This article belongs to the Section Sustainable Agriculture)

Abstract

:
Canada is known for its massive and fertile landscape, and one of the biggest industries in Canada is crop production, which is responsible for contributing to the national economy as well as the global food supply. Soil erosion is considered the top challenge facing Canadian farmers in the 21st century. This study aims to evaluate soil erosion’s impact on Canadian crop production, assessed based on the integration of soil erosion analysis and multitemporal crop market values from 1971 to 2015. Soil Erosion Risk Indicator models were used to assess soil erosion’s impact on crop productivity using the relationship of soil organic carbon with crop yield gain/loss. The total soil erosion cost of yield losses in the 44 years leading up to 2015 is estimated to be CAD 33.51 billion. 2013 was found to show the highest loss, with CAD 1.93 billion. Oilseeds, small grains, and potatoes were the major crop commodities that were impacted by yield loss as a direct result of soil erosion, the costs being 41%, 37%, and 15%, respectively. Ontario and Saskatchewan were the most impacted provinces, with costs of 45.25% and 22.50%, respectively. Four eras were detected in this research, each having unique soil erosion costs, which reflect different agriculture policy and soil conservation efforts: Era 1 (1971–1988), Era 2 (1989–1995), Era 3 (1996–2007), and Era 4 (2008–2015). This research is the beginning of exploring the cost of the environmental impacts on agriculture sustainability in Canada and supporting decision makers in adopting effective soil conservation strategies to mitigate these impacts.

1. Introduction

Canada is one of the top five agricultural exporters worldwide and is recognized as a major world producer of cereals [1]. The development and sustainability of crop production are threatened by soil erosion [2,3,4]. In general, soil erosion is caused by wind, water, and tillage, resulting from various farming practices that disturb and translocate the topsoil and leave it unprotected by a vegetative cover [5,6,7,8]. It is also responsible for the loss of soil organic matter, which adversely affects the physical and chemical properties of topsoil, decreasing the soil’s infiltration and water-holding capacity, reducing soil fertility, and, ultimately, degrading the soil’s ability to produce crops [9,10,11,12].
In the early 1980s, Rennie (1985) [13] estimated the cost of soil degradation in Canada and found soil erosion to cost about CAD 0.43 billion per year (equivalent to CAD 1.06 billion in 2022). These estimated values were alarming and were a major impetus for developing and enhancing soil conservation technologies and practices to increase awareness and adoption of soil conservation technologies and practices throughout the agriculture industry and across Canada. No-till climbed to about 60% of the cropped area across the country, and summer fallow dropped from about 14% to 3%. No assessment of the cost of soil degradation has been carried out in Canada since. With respect to public awareness, government support through policies, programs and research, and industry action, there has been a steady decline in interest in soil conservation. There is a pervasive belief amongst all these stakeholders that “we know all there is to know about soil erosion and soil conservation,” and that “the job is done, and we need to move on”.
Few investigations have been intended to estimate the worldwide economic implication of soil erosion [14] because of the analytical challenges of assessing the cost of environmental degradation. Various influencing factors can introduce undetectable uncertainties [15], such as calculating the exact cause of cumulative soil erosion impact, crop yield estimation [16], and national crop yield variation due to other factors like drought, cultivars, market demand and crop market value [17,18]. Integrating multitemporal economic and environmental databases for statistical analysis requires a profound framework to address the connection between the assessed drivers, such as the relationship between topsoil organic carbon accumulation, crop yield and crop market value [19]. Despite these analytical challenges and uncertainties, national and global soil erosion cost studies in food production are exceptionally imperative for providing high-level information on soil losses in various landscapes, cropland productivity, and provincial/federal conservation policies’ effectiveness [20,21]. This national-level information helps improve land tenure security, such as the adoption of sustainable soil management practices [20], and also provides useful information to local and federal governments for reducing poverty in rural areas and enhancing ecosystem services that could mitigate conservation costs, such as nature-based solutions (NbS) for protecting carbon-sink landscapes such as wetlands, marginal lands, and riparian areas [22].
According to the United Nations Convention to Combat Desertification (UNCCD) (2013) [23], the annual global land degradation cost is USD 685.4 billion (USD 984.13 billion equivalent cost in 2022; 43.6% cumulative rate of inflation [24]). Dregne and Chou (1992) [25] estimated annual cost of cropland and grassland loss due to land degradation to about USD 43 billion (USD 92.7 billion in 2022). Basson (2010) [26] found that the off-site cost of soil erosion through the reduction of water storage and irrigation reservoirs is about USD 21 billion (USD 28.85 billion in 2022). The United States and Canada have irreplaceable terrestrial ecosystems, such as wetlands, forests, shrublands, and grasslands, with a total value of about USD 5.55 trillion [27], the total annual cost of land degradation being USD 16.86 billion according to the 2022 cumulative rate of inflation [27].
After almost 40 years, there is a need to improve and update cost estimates to assess status and progress, since data science and computational technology have greatly advanced, in addition to our complete and accurate understanding of soil erosion processes; there are now enhanced prediction models for soil erosion assessment using complex geospatial databases [28,29]. This study benefits from these recent advances in computer technology, programming, and data management tools, which have made it possible to assemble and analyze large nationwide datasets. In response to this need, a study was initiated consisting of five components: (i) a detailed spatial and temporal assessment of soil erosion using an integrated soil erosion model; (ii) a model of the response of soil organic carbon in topsoil to the loss of soil and the inputs of crop biomass; (iii) a model of the response of crop yield to soil organic carbon content in topsoil; (iv) agricultural market analysis to understand the temporal dynamics of seeded/harvested areas, yield, crop production, and market values in each Canadian province over the past four decades; and (v) an estimation of the soil erosion cost (SEC) to crop production on national and provincial scales. The discussion in this investigation is organized into three major components: (1) a description of Canadian crop production and value between 1971 and 2015, (2) a provincial summary of multi-temporal soil erosion in Canada, and (3) a demonstration of crop-related and provincial-based soil erosion cost. The rationales for investigating soil erosion cost in Canada between 1971 and 2015 are as follows: (1) nationwide data availability and interoperability: the data quality of this research is highly dependent on synchronizing time, location, and crop to common annual averages in crop-related metrics and soil erosion estimation in order to compare among years, crops and provinces; (2) data cleaning and management: some missing years could be replaced by federal information from Statistics Canada, and we give extra attention to justify interpolation limits, using 2015 as the edge of the reliable crop and soil erosion database; (3) the Census of Agriculture in Canada, published every five years, which aligned perfectly with the proposed temporal dimension of this study focusing on crop productivity, value, and soil erosion for each crop type, year, and province.

2. Materials and Methods

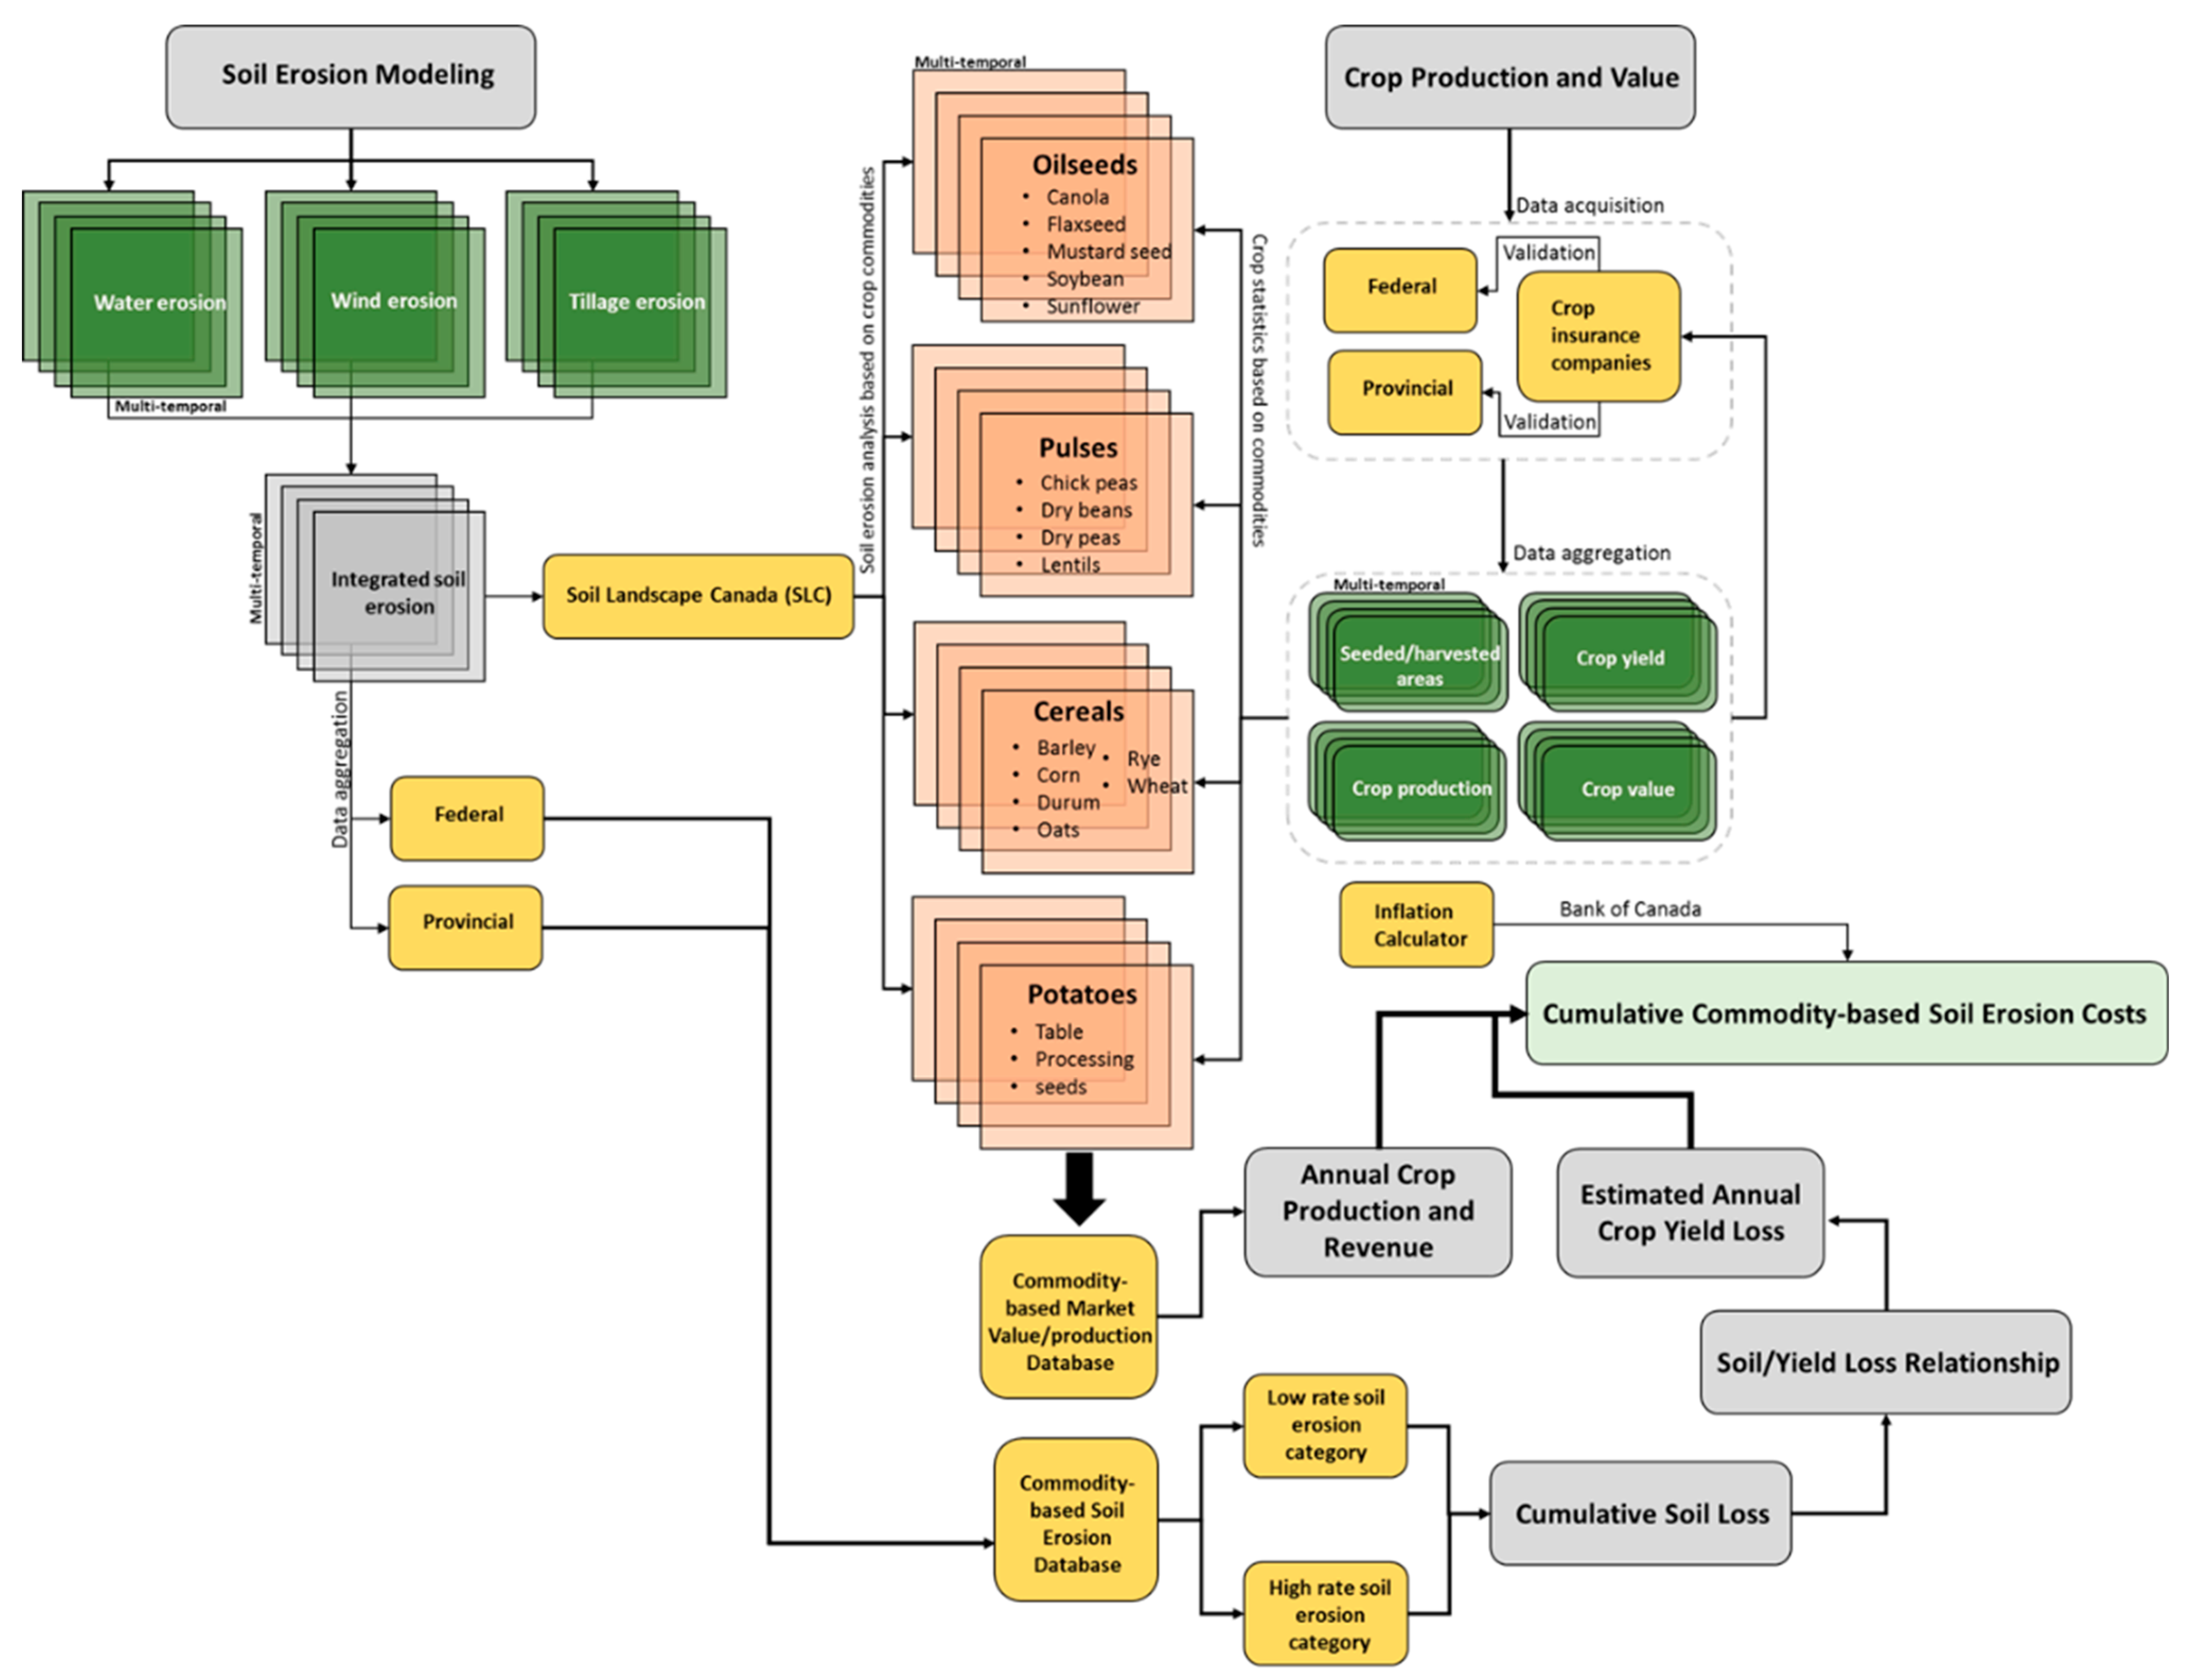
2.1. Soil Erosion Modeling

Soil erosion was estimated using the Soil Erosion Risk Indicator (SoilERI) model as part of Agriculture and Agri-Food Canada’s agri-environmental indicators (AEI) program [30]. AEI models apply the spatial framework of the Soil Landscapes of Canada (SLC) polygon data. The SLC data are part of the Canadian National Soil Database (NSDB) and portray generalized soil and landscape information for each polygon at a scale of 1:1 million. The polygon size varies, ranging from 10,000 ha to 1 M ha. One or more representative landforms characterize each SLC polygon, and a generalized hillslope characterizes each landform with four hillslope segments (upper, mid, lower slopes and depression). Each hillslope segment is characterized by a slope gradient and a slope length. Cropping and tillage practices data were obtained from the Census of Agriculture for 1981, 1986, 1991, 1996, 2001, 2006, 2011, and 2016. Modeling processes were carried out using the R programming language, and each particular modelling task has a specific script. Data modeling has three major phases: data preparation, indicator calculation, and aggregation. All results were generated in dBase File format (dbf) for further data visualization and mapping using ArcGIS 10. 8 software, USA.
SoilERI generated erosion values were categorized into six classes of soil loss magnitude. The SoilERI classes were designed to identify the degree of soil loss at different temporal and spatial scales. SoilERI Mg   ha 1 yr 1 is treated as no soil loss (“Negligible”), and ≥33 Mg   ha 1 yr 1 is considered as extreme soil loss (“Very High”). The SoilERI classes are used in this study to measure the degree of soil loss in agricultural land in Canada for 1981, 1986, 1991, 1996, 2001, 2006 and 2011.
Negligible if   SoilERInumerical <3 Mg   ha 1 yr 1
Very Lowif   3 Mg   ha 1 yr 1 ≤ SoilERInumerical <6 Mg   ha 1 yr 1
Lowif   6 Mg   ha 1 yr 1 ≤ SoilERInumerical <11 Mg   ha 1 yr 1
SoilERIcategorical =Moderateif   11 Mg   ha 1 yr 1 ≤ SoilERInumerical <22 Mg   ha 1 yr 1
Highif   22 Mg   ha 1 yr 1 ≤ SoilERInumerical <33 Mg   ha 1 yr 1
Very Highif   SoilERInumerical ≥33 Mg   ha 1 yr 1

2.2. Soil Erosion Cost (SEC) Modeling

The crop yields are expressed relative to potential crop yield on non-eroded sites, which is assumed to be a function of the organic carbon content of the remaining eroded soil. Crop yield is a function of topsoil depth, the depth of carbonates, and soil organic carbon (SOC) content; these factors affect soil moisture and fertility. Battiston et al. (1987) [31] have found a strong relationship between crop yield and soil organic matter.
Assessing the cost of soil erosion to crop production in Canada was carried out in several steps; these steps depend on intensive big-data analysis using a supercomputer platform at the University of Manitoba with the analytical capability to conduct data modeling for more than 5 terabytes of data using the R programming language and ArcGIS (see Figure 1). Three soil erosion data aggregation levels were analyzed to combine crop commodity values with the soil erosion metrics. SLC was used to calculate cropped areas in each SoilERI category, including more crop-specific data such as seeded/harvested areas, crop yield, crop production, and crop values. Each crop commodity’s overall soil erosion cost (SEC) was calculated at the federal level. The provincial level was calculated to demonstrate the most affected provinces and the costliest crops.
The SoilERI VeryLow and SoilERI Low represent the low-rate soil erosion category. The remaining topsoil organic carbon (RTSOC) and soil erosion are the two major key factors for exploring the relationship between soil loss and the amount of the SOC ( r 2 = 0.98 ) , which was simulated based on previous research studies by David A. Lobb (e.g., [32,33,34]), as shown in Figure 2a. Furthermore, the amount of the original topsoil SOC% has a strong relationship with crop yield loss (CYL) and crop yield gain (CYG) ( r 2 = 0.99 ) , which are aligned with the research of Oldfield et al. (2019) [35] on the global meta-analysis of SOC and cropland productivity (see Figure 2b). Thus, the annual crop production and revenue for the period between 1971 to 2015 were estimated based on the annual changes in the Canadian dollar value from the Bank of Canada, and the estimated annual CYL between 1971 and 2015 was used to assess the cumulative crop commodity-based SEC for Canadian crop production.

3. Results

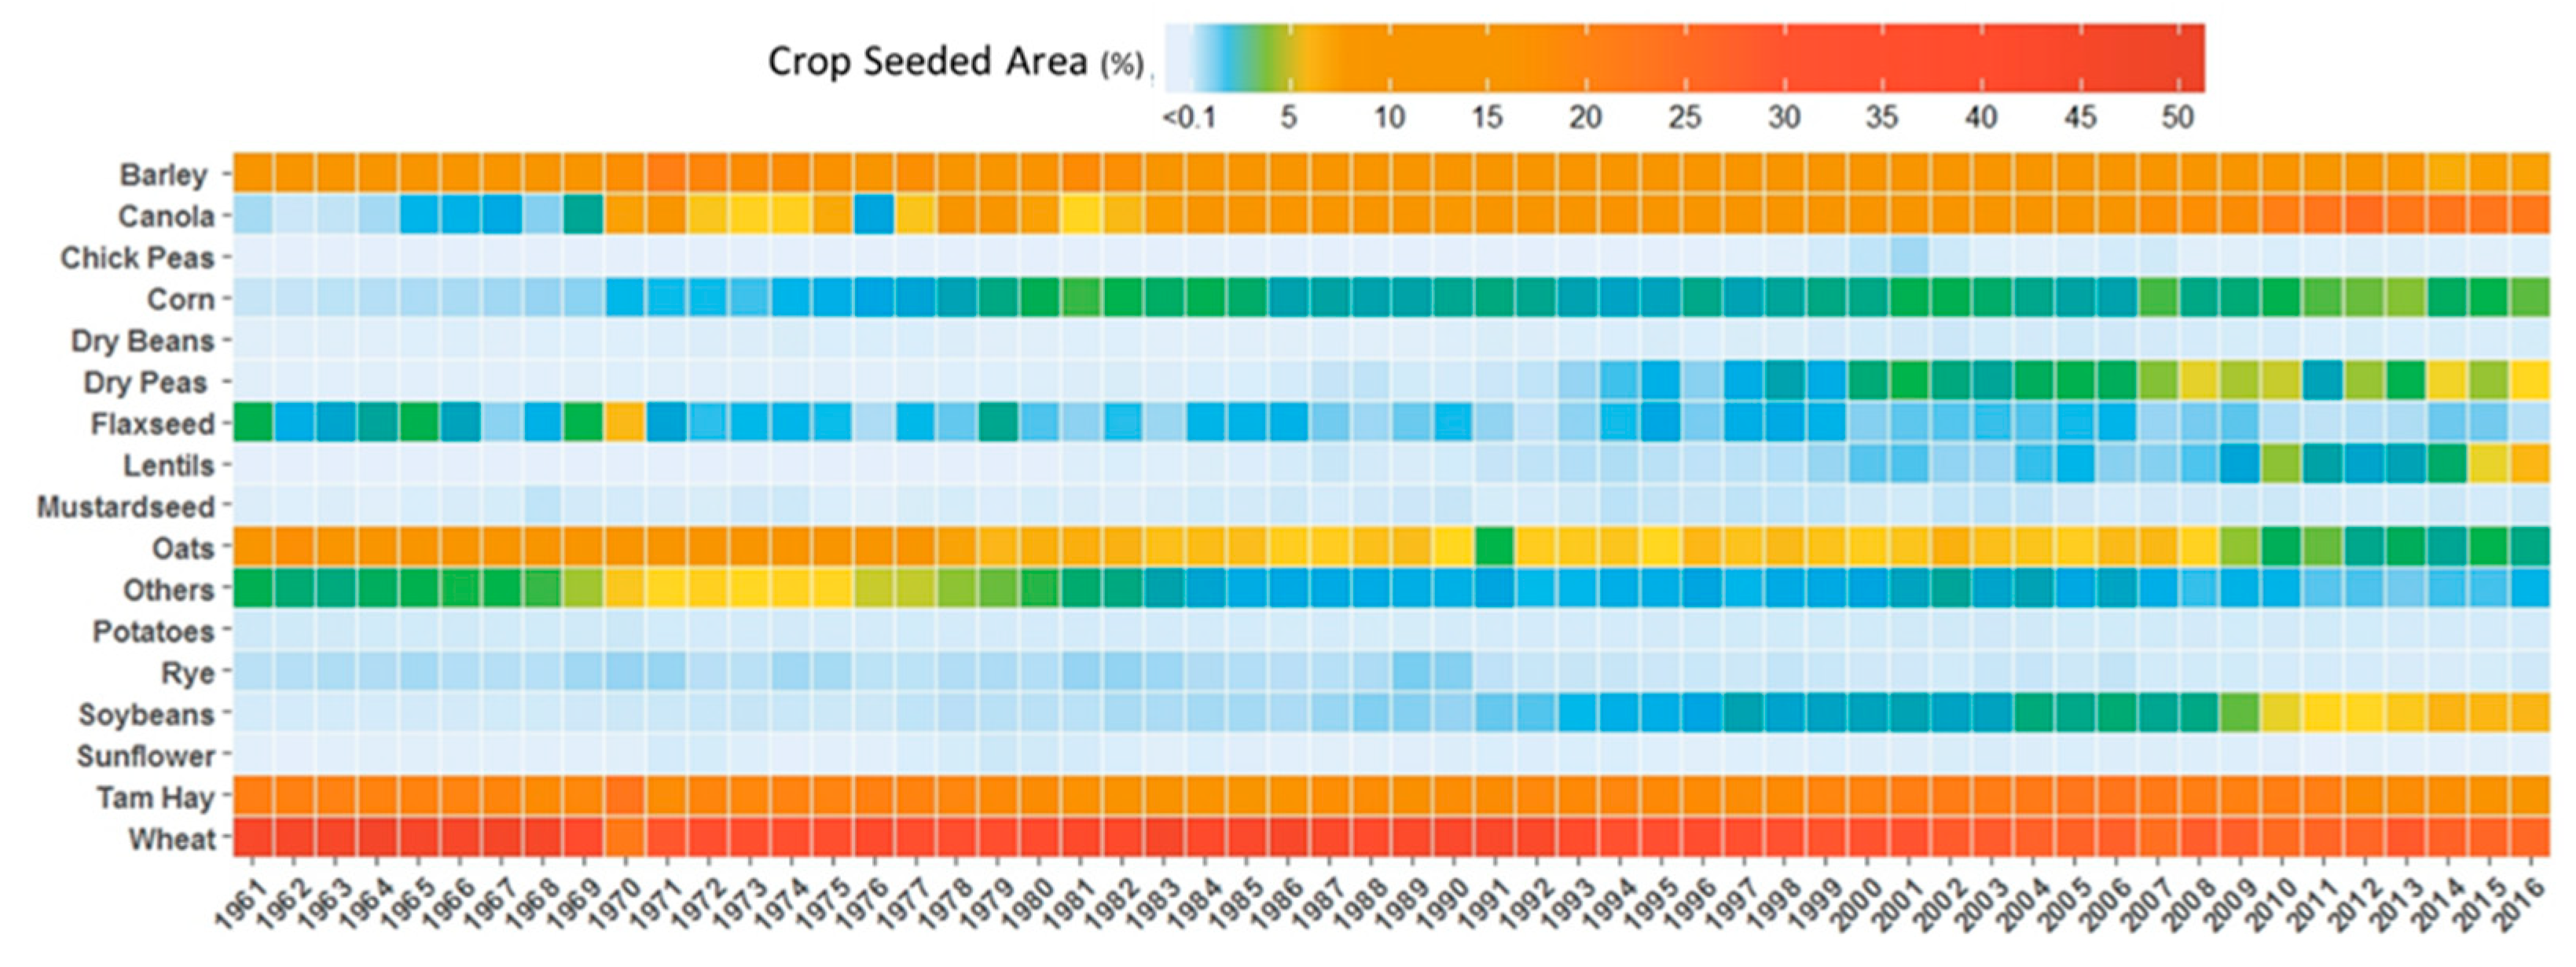
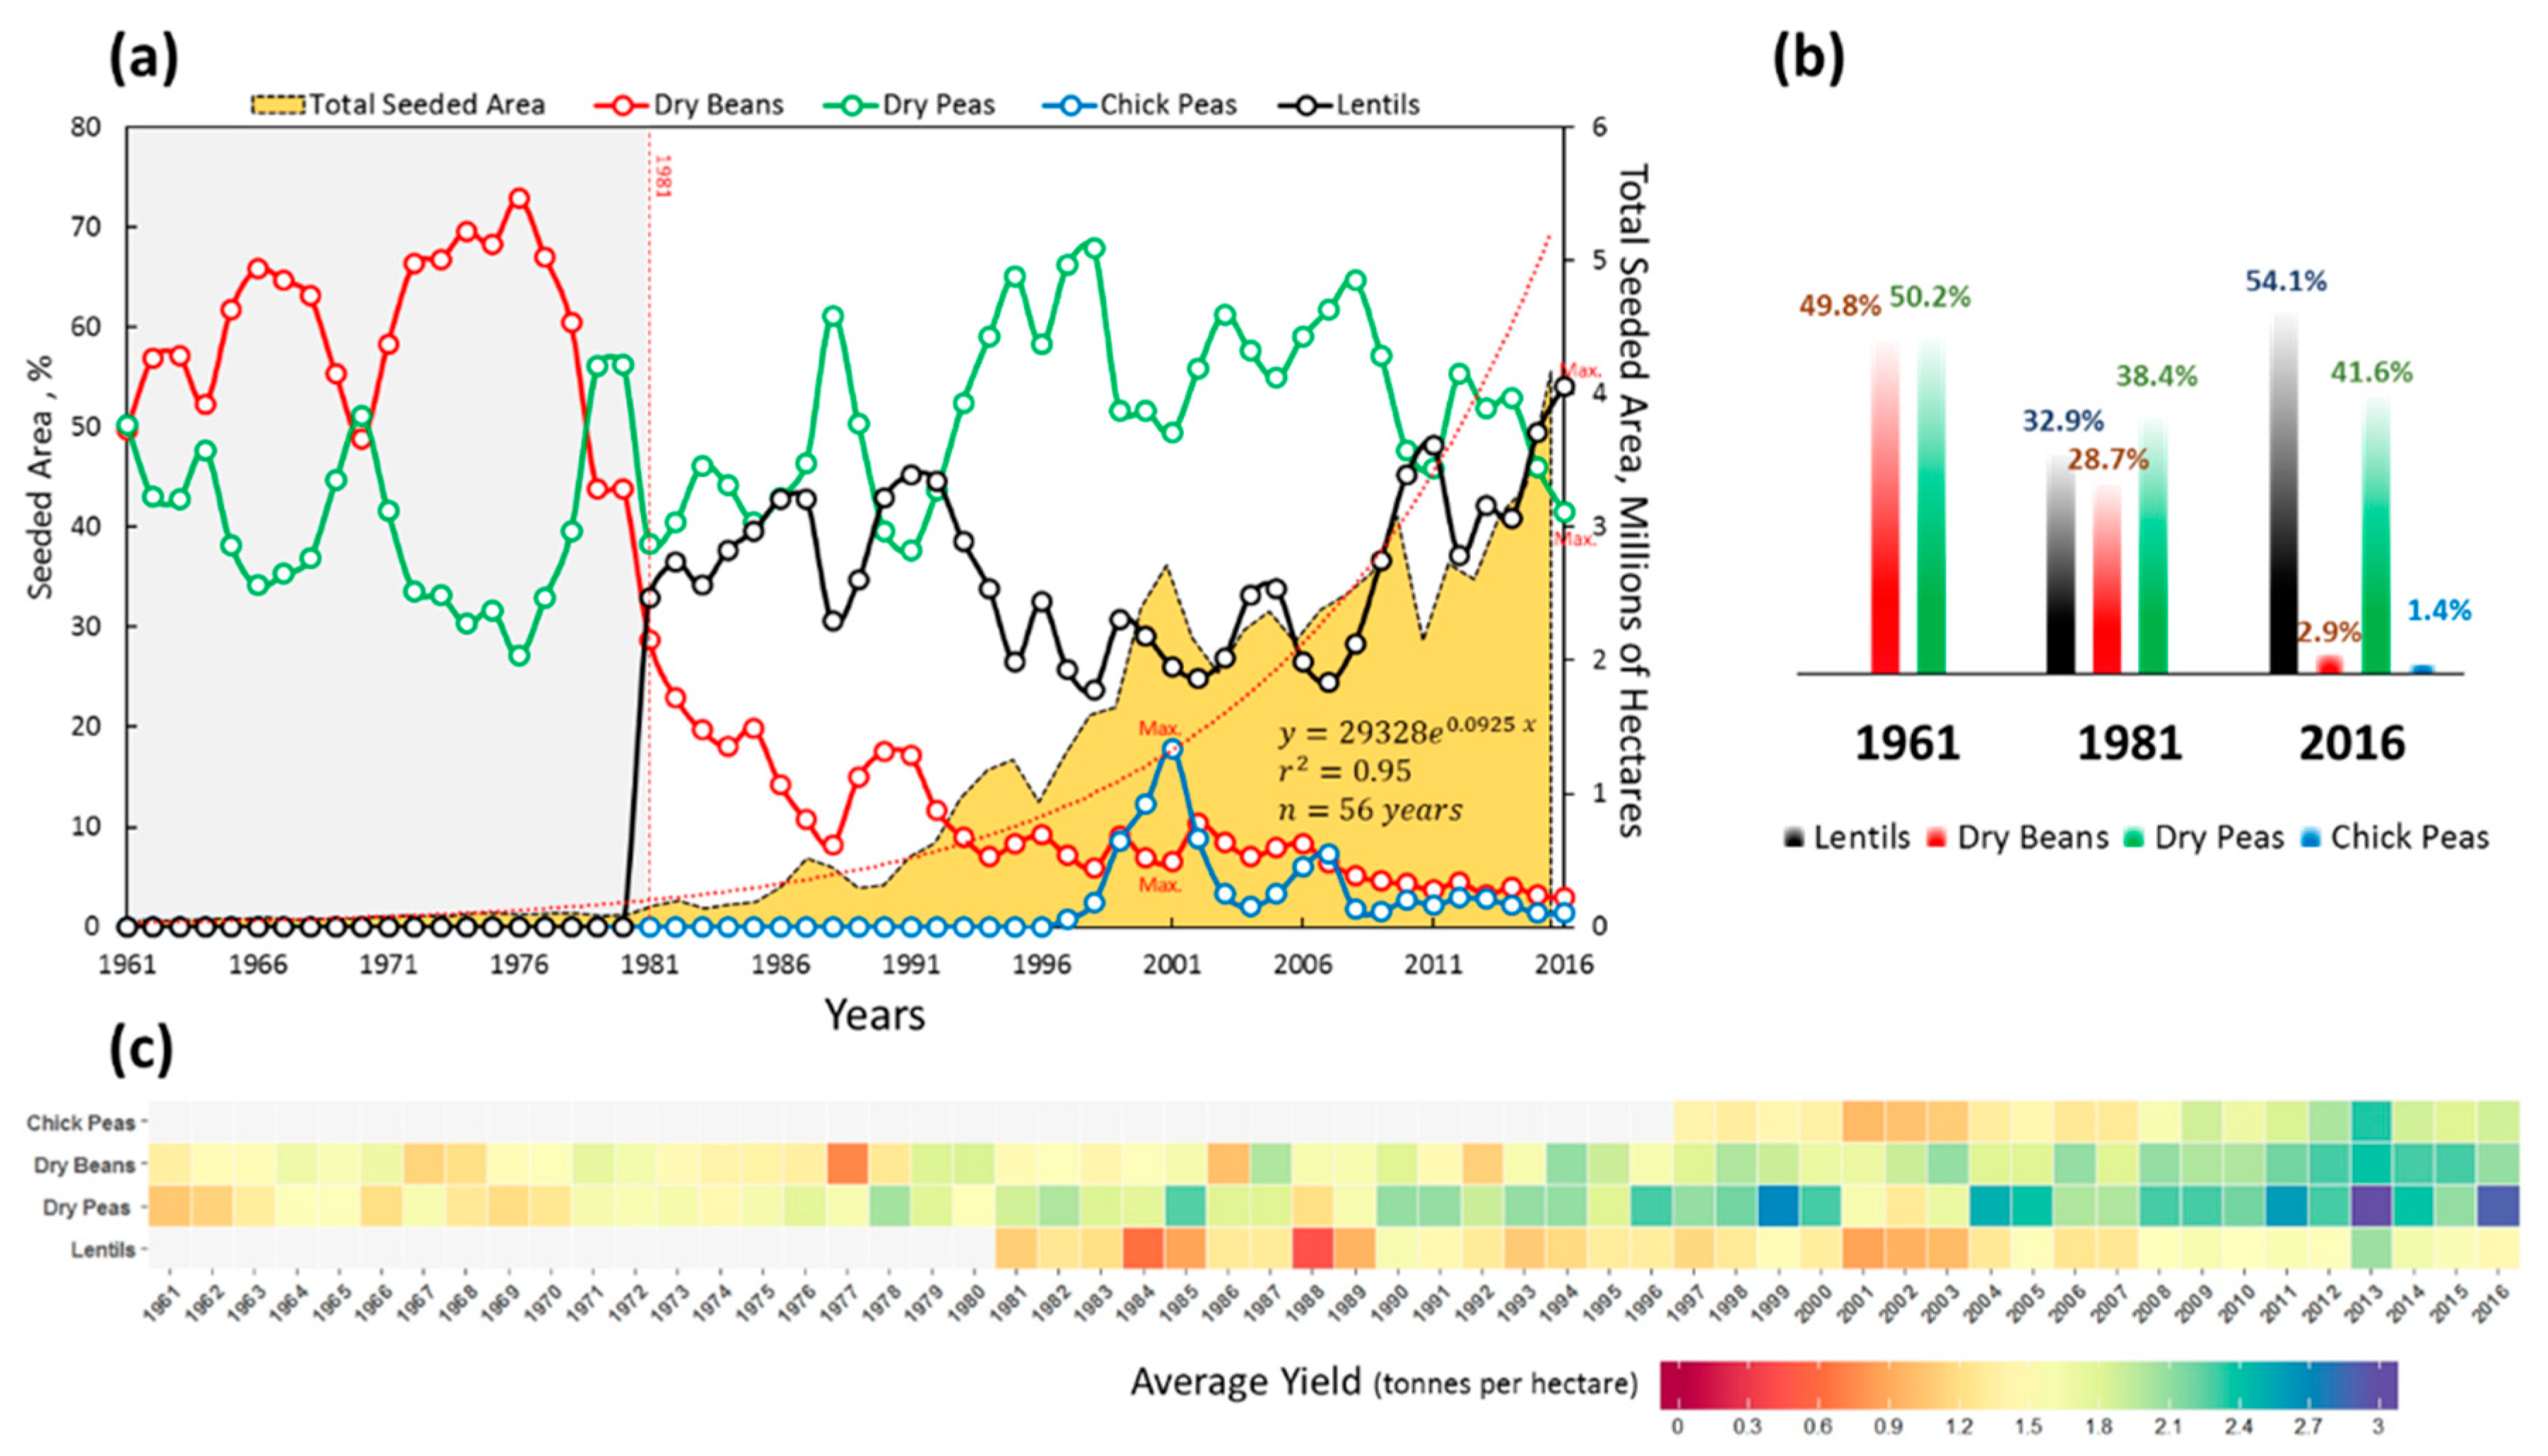
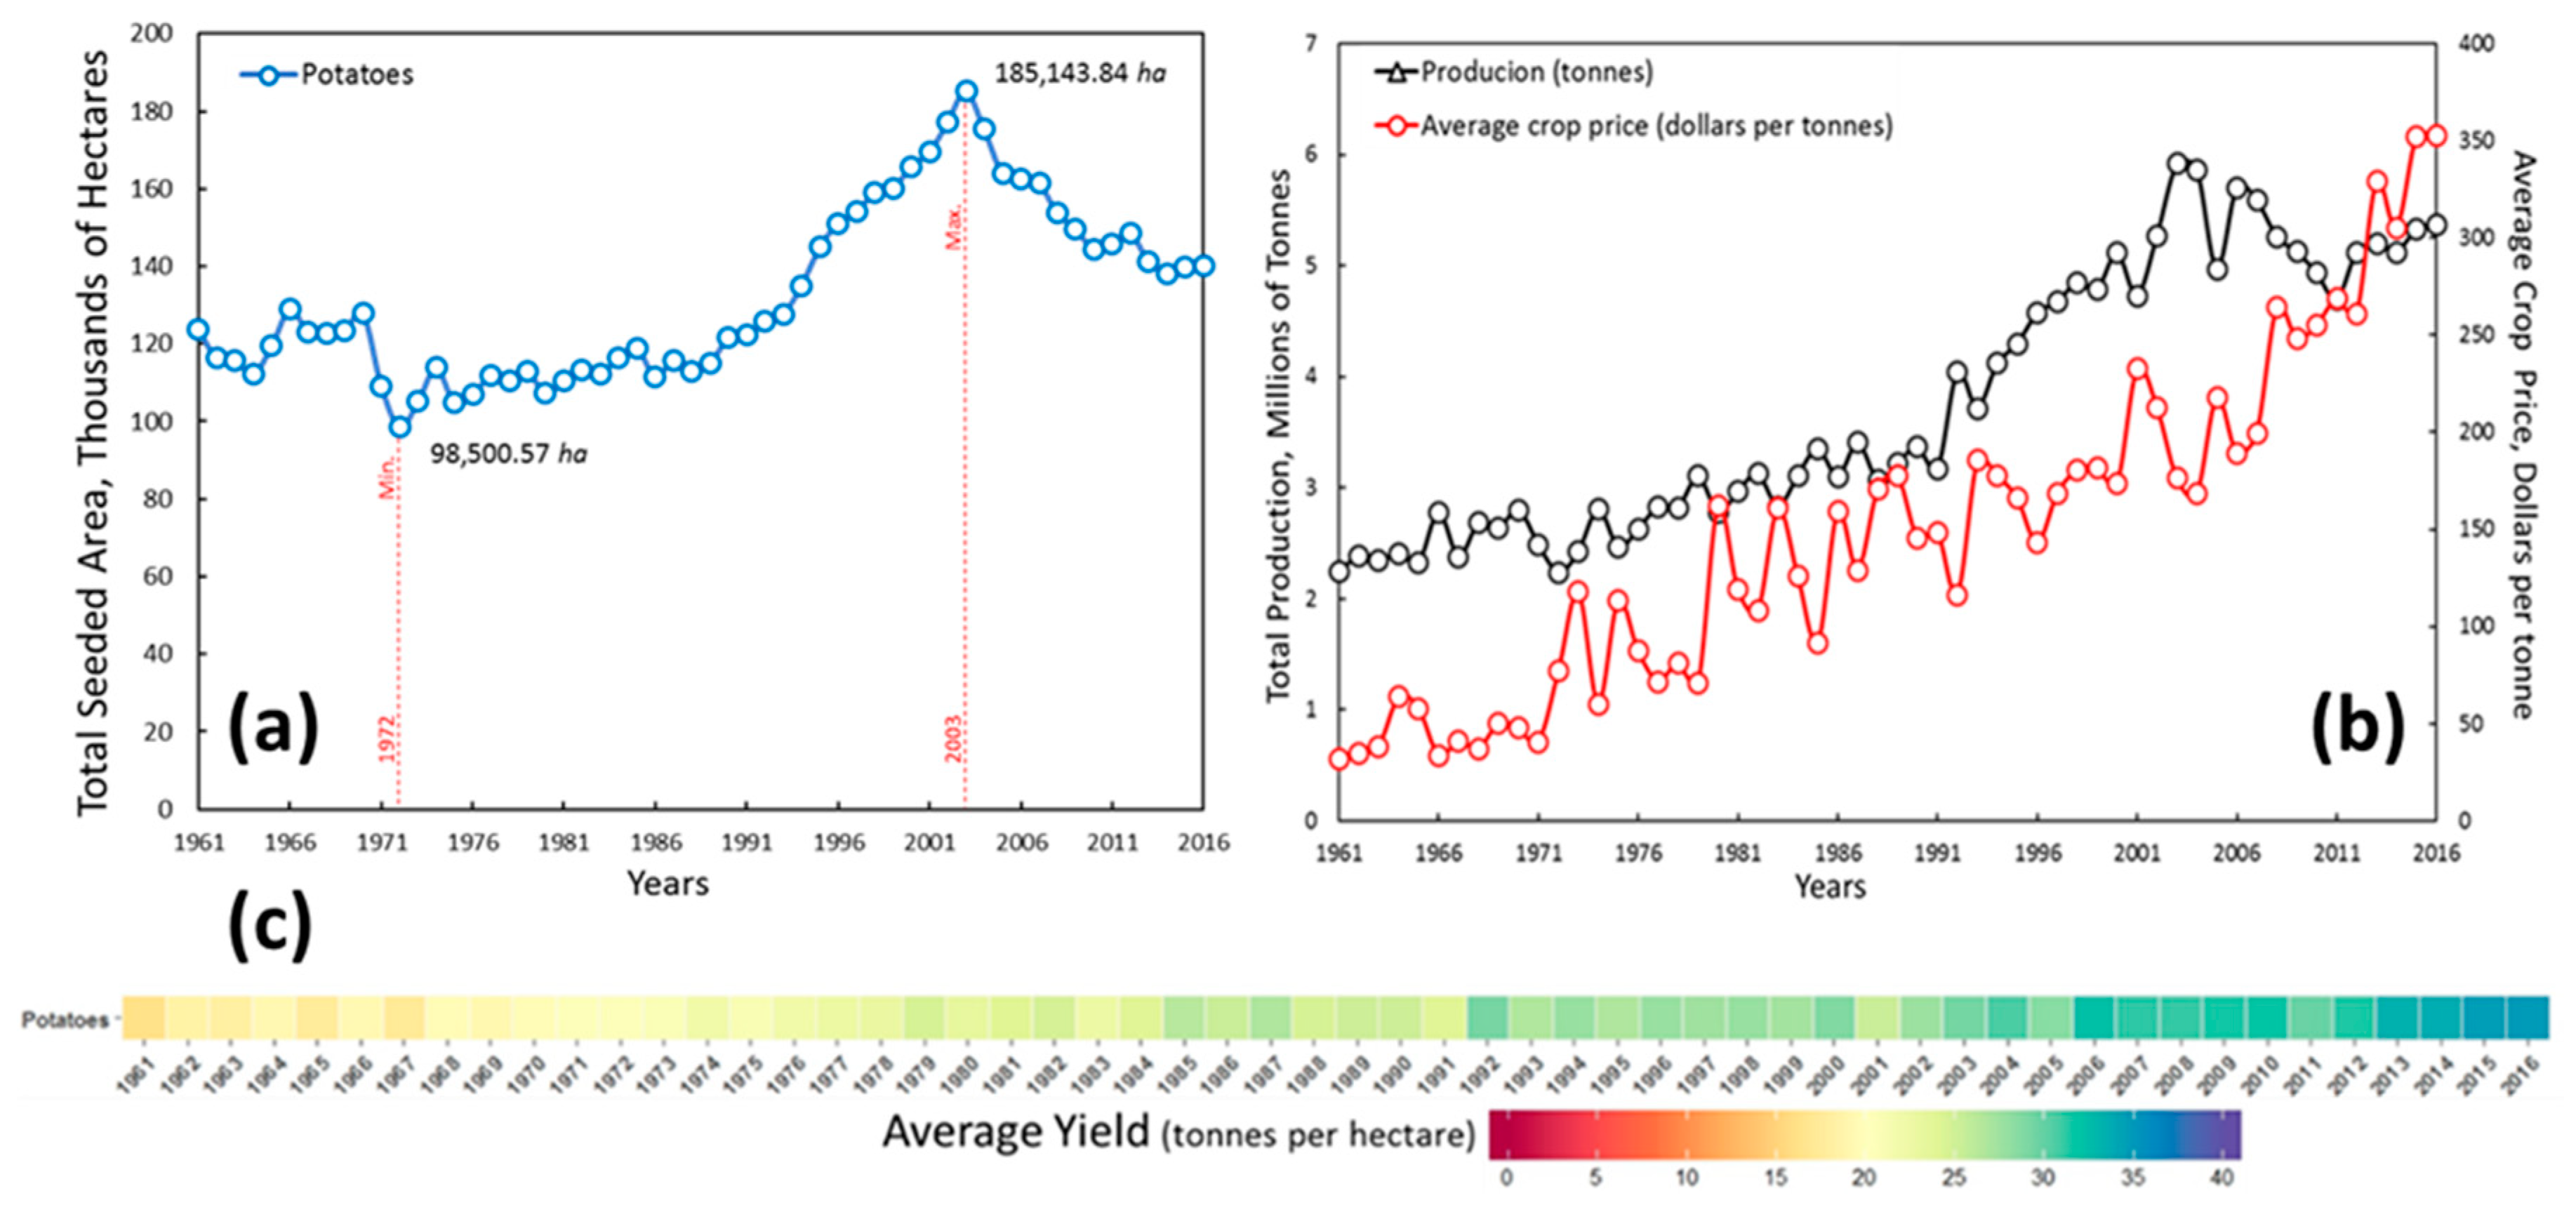
3.1. Crop Production and Values between 1971 and 2015

Seeded areas in Canada have been increasing dramatically since 1961, from 23.5 million hectares (M ha) to about 37.5 M ha in 2016. Overall, national summer fallow areas have decreased by 10.4 M ha between 1961 and 2016. In 1970, the total national seeded area declined to about 23 M ha, Canada’s highest summer fallow record (14.9 M ha). Also, other sudden declines in the total national seeded area were recorded in 2010 and 2011 (see Figure 3a).
Between 1961 and 2016, Saskatchewan (SK) and Alberta (AB) increased their contribution to national agricultural development with more seeded area at 5.42% and 2.01%, respectively. In 2016, Québec (QP) and Ontario (ON) contributed less to national agricultural development with 3.75%, 3.52% less area than in 1961. Also, in 2016 Québec seeded 226,346 ha less than in 1961. In New Brunswick (NB), Nova Scotia (NS), and Prince Edward Island (PE), seeded area declined to 68,409, 34,410, and 888 ha, respectively. In Manitoba (MB), seeded area has increased by 1.76 M ha since 1961. British Columbia (BC) has added 266,206 ha of seeded area since 1961. Newfoundland and Labrador (NF) have 6300 ha of seeded area, mainly cultivated with tam hay (see Figure 3b).
Canadian crop priorities changed between 1961 and 2016; the total national seeded percentage of the flaxseed crop was 3.6% in 1961 and about 1% in 2016. Canola and soybeans were 1.2% and 0.4%, respectively, in 1961 and 22.4% and 6.1%, respectively, in 2016 (see Figure 4).
Oilseeds, pulses, and cereals are Canada’s three primary crop commodities. In 1961, cereals were the dominant crops in Canada with about 16.32 M ha (69.25%), 4.95% of the agricultural land was seeded with tam hay, 1.25 M ha were seeded with oilseed crops (5.43%), potatoes (0.52%), and pulses (0.23%), and 3.55% was seeded with other crops such as borage seed, canary seed, caraway seed, coriander seed, hemp, and sugar beets.
In 2016, cereals dropped about 30% to 40.5% of the total seeded area in Canada. Oilseeds have increased by 24.7% to 30.1% (11.3 M ha), while 11.1% was seeded with pulses (4.2 M ha). The year 1970 was the lowest recorded for the area seeded with cereals observed on the national scale, while oilseed doubled from 7.85% in 1969 to 14.03% in 1970.
In 1961, the flaxseed crop had the dominant share of 66% of seeded area within oilseeds. The second most important crop in this crop commodity was canola (22.5%), and the third was soybeans with about 6.7%. In 2016, canola became the major seeded crop in the oilseed group with 74.5%, while soybeans increased to 20.1% and flaxseed decreased to 3.4%, a drop of 63% over the preceding 55 years (see Figure 5a,b). In 1961, the average canola yield was 0.9 tonnes per ha (t/ha), compared to 0.4 t/ha for flaxseed and 2.1 t/ha for soybeans. Mustard seed and sunflower yields were 0.35 and 0.8 t/ha, respectively. In 2016, the productivity of one hectare had increased for most crops; canola increased to 2.4 t/ha, flaxseed to 1.7 t/ha, and soybeans to 3 t/ha. Mustard seed and sunflowers were 1.21 and 1.84 t/ha (see Figure 5c).
Since 1961, canola’s average crop price has increased by CAD 402 per tonne (t) at an average annual rate of CAD 7.31 per year (yr). There was a significant price drop in 2012–2013 to CAD 121/t less than the previous period (see Figure 5d). We found a positive relationship between canola productivity (t) and average crop price (r2 = 0.7). National productivity has increased by 19.3 million tonnes (Mt) since 1961. Between 1998 and 2002, national canola productivity decreased by 4.3 Mt. As shown in Figure 5e, flaxseed crop productivity had the strongest fluctuations in the oilseed group. The lowest productivity was recorded in 1967 with 0.24 Mt; the highest productivity was recorded in 1970 with 1.2 Mt, which had the lowest average crop price (CAD 87/t). In 2008, the average crop price reached its maximum at CAD 618.7/t, the second-highest crop price among all crops after lentils (pulses), which was CAD 656.9/t. From 1961 to 2016, national soybean productivity exponentially increased, and we predict that Canada will be producing about 9.1 Mt in 2020 (r2 = 0.97). Productivity has increased by 6.4 M t since 1961 and average crop price increased by CAD 359.41/t during the study period. The highest price was recorded in 2013 (CAD 514.3/t). The soybean market has direct proportionality of about r2 = 0.5 for productivity vs. price, except for 2006, 2007, 2014, 2015, and 2016, which showed a price decline. In 2001, total soybean income had dropped by CAD 0.29 billion within a single year (see Figure 5f).
Wheat is the major cereal crop. In 1961, 62.7% of seeded cereals were wheat, 21.2% oats, 13.7% barley, 1.4% rye, and about 1% corn (grains). In 1967, barley became the second-largest seeded area among cereal commodities. In 2010, corn (grains) became the third most seeded area (8.9%). In 1970, wheat reached its lowest point (38.3%), with 19.1% less seeded area than in 1969. Barley and oats showed a dramatic increase, 30.4, and 24.9%, respectively. In 1971, barley had the highest share during the studied period, about 32%. The second-lowest drop in wheat-seeded area was recorded in 2007 to 7.5% less than in 2006 (see Figure 6a). In 2016, average cereal crop yield (t/ha) had increased by about 2.5 t/ha, more than the unit area (ha) produced in 1961, when yields were 1.1 t/ha for barley, 1.3 t/ha for oats, 0.73 t/ha for rye, and 0.75 t/ha for wheat. In 2016, the yields were 3.9 t/ha for barley, 3.5 t/ha for oats, 3.1 t/ha for rye, and 3.6 t/ha for wheat. Between 1987 and 1988, a major yield drop was recorded among all cereals with an average rate of about 0.42 ± 0.22 (t. ha−1. yr−1). Other yield decreases were recorded in 1964,1967, 1974, 1979, 1988, 2002, 2007, and 2012.
As shown in Figure 6b, barley in 1971 had the highest harvested area, 5.6 M ha, and the lowest years were recorded in 1962 and 2014 (2.1 and 2.2 M ha). Production has increased by 6.4 Mt since 1961. Oats have an inverse correlation between productivity and average yield (Figure 6c). Rye had the lowest harvested area (76,800 ha) in 2002, losing about 97,000 tonnes compared to the previous year (Figure 6d). In 1970, wheat had the lowest harvested area with about 5 M ha, which was lower by 5 M ha than the previous year (Figure 6e). Also, wheat had the highest price value in 2008 at CAD 398.5/t and the lowest in 1969 at CAD 47/t, followed by a 50% drop in total national production (9 M t) in 1970. This significant decline in wheat productivity amounted to CAD 0.38 billion in losses compared with 1969 revenue (CAD 858.6 million). Total revenue for wheat was the highest (CAD 11.4 billion) in 2008, and in 2013, total revenue was CAD 10.1 billion. Another decrease in revenue was recorded in 2010 (CAD 4.2 billion) (see Figure 6f).
Figure 7a shows that Canada’s total pulse seeded area is increasing exponentially. In 1961, dry beans and dry peas were the major pulse crops. Among pulse commodities, the seeded area percentage was 49.8% for dry beans and 50.2% for dry peas. In 1981, dry peas became the most seeded pulse crop (38.4%), with lentils as the second most seeded area (32.9%) (see Figure 7b). Dry beans have decreased by about 21% since 1961. In 2016, lentils became the most seeded pulse crop with 54.1%, followed by dry peas (41.6%), dry beans (2.9%), and chickpeas (1.4%). In 1997, chickpeas started at a low proportion (0.82%), while in 2000 and 2007, it was the third most seeded crop among pulse commodities with 12.3% and 7.3%, respectively. As shown in Figure 7c, average yield for pulses didn’t change significantly during the studied period (1961–2016); average yield for dry beans was 1.7 ± 0.35 t/ha, for dry peas, 1.9 ± 0.45 t/ha, for chickpeas, 1.5 ± 0.36 t/ha, and for lentils, about 1.3 ± 0.31 t/ha. In 2013, the average national yields were at their maximum, at 2.4 t/ha for dry beans, 3 t/ha for dry peas, 2.4 t/ha for chickpeas, and 2.1 t/ha for lentils.
As shown in Figure 8a, the minimum national seeded area for potatoes was recorded in 1972 at 98,500.6 ha, which was about 0.4% of the seeded area in Canada, and the maximum national seeded area was recorded in 2003 at 185,143.8 ha, which was 0.5% of the seeded area in Canada. Between 2003 and 2016, seeded potato area declined, averaging 3458 ha/yr. From 1961 to 2016, total national production increased by 3.13 Mt (see Figure 8b), with the annual production change rate at about a 56,906 t/yr increase. The lowest production year (2.2 Mt) during the studied period was 1972. In 1961, the average crop price started at CAD 31.5/t, and was CAD 352.8/t in 2016. The annual crop price average increase is about CAD 5.84 /t·yr−1 (see Figure 8b). Also, in 1961, average yield was 16.2 t/ha, with yield at 34.7 t/ha in 2016. Annual average yield is 25.50 t/ha and yearly yield change rate is about 0.34 ± 1.6 t·ha−1·yr−1 (see Figure 8c).

3.2. SoilERI of Canada

In 1971, 5.5% of the cropland in Canada was in the highest category of H i g h e n d S o i l E R I V e r y   H i g h , which means that about 2 M ha showed soil loss from the topsoil of ≥33 Mg   ha 1 yr 1 . This reached 1.5% in 2015 (0.56 M ha). S o i l E R I N e g l i g i b l e   increased from 9.4% to 55.8% between 1971 and 2015.
As shown in Figure 9, S o i l E R I within the provinces has shown different trends between 1971 and 2015. In 1971, 40.4% of the cropland in NF was S o i l E R I V e r y   H i g h , 24% in ON, and 10.4% in NB. BC, AB, SK and MB have shown a dramatic decrease in the high-rate soil erosion category from 11.7%, 33.3%, 36.2% and 35.1%, respectively, in 1971 to 5.3%, 2.6%, 0.3% and 9.8%, respectively. Nova Scotia (NS) has shown a slow increase in the low-rate soil erosion category, from 51.8% in 1979 to 71.3% in 2015. With almost 50.1% S o i l E R I N e g l i g i b l e   in QP, the low-rate soil erosion category has been stable, from 28.3% in 1971 to 30.3% in 2015. An average of 77% ± 0.42 of the cropland in PE has been in the high- rate soil erosion category in the studied years.

3.3. Costs of Soil Erosion for Crop Commodities

The cost of soil erosion is measured in terms of lost crop yield. The total national SEC to crop production in Canada between 1971 and 2015 is CAD 33.51 billion. In the past 44 years, oilseed crop commodities have lost CAD 13.68 billion, which is 40.82% of the total loss; soybeans lost CAD 8.02 billion (23.95%), sunflower CAD 3.75 billion (11.20%), canola CAD 1.78 billion (5.31%), and flaxseed CAD 0.12 billion (0.36%). Small grains have lost CAD 12.32 billion, 36.78% of the total loss. Wheat, barley, and oats have lost CAD 11.11 billion (33.15%), and rye CAD 1.21 billion (3.63%). In the past four decades, the highest single crop loss, with CAD 5.22 billion, was potatoes, which had 15.59% crop loss due to soil erosion. Pulses have CAD 1.23 billion (3.66%) in crop loss, corn (grains) CAD 0.67 billion (1.99%), and forage CAD 0.39 billion (1.16%) (see Figure 10).

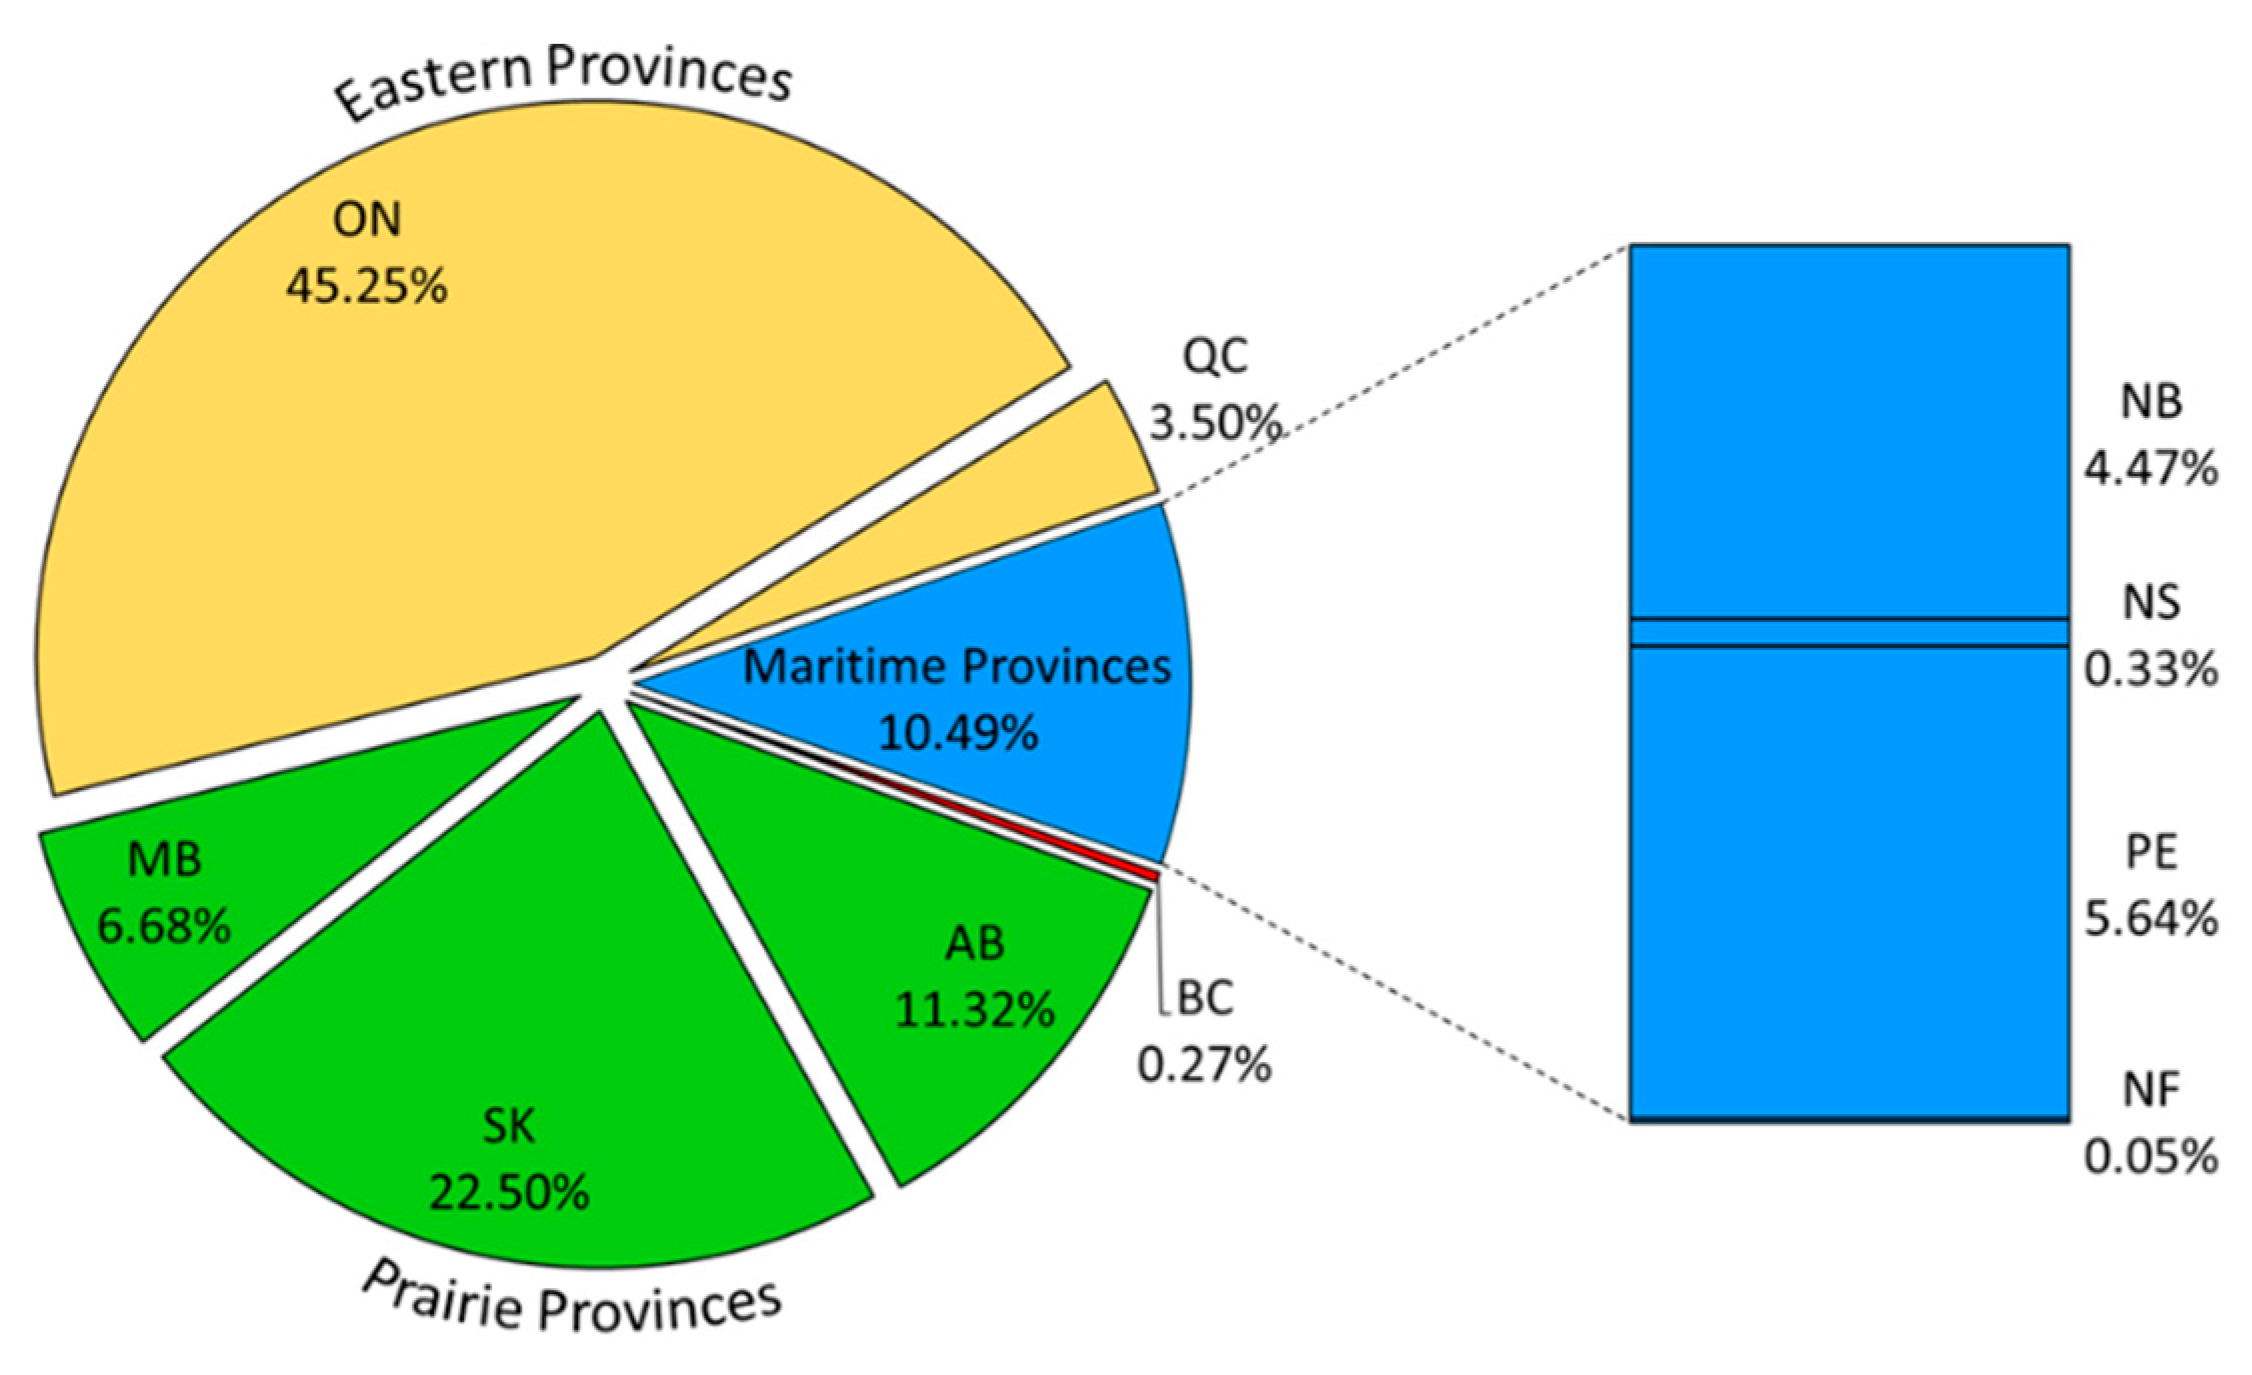
3.4. Provincial Costs of Soil Erosion to Crop Production

Almost 50% of the SEC in Canada came from the eastern provinces of ON and QP, and ON has the highest SEC among the Canadian provinces, with 45.24% (CAD 14.98 billion) for all crop production between 1971 and 2015. Oilseeds in ON had the highest losses, with a value of CAD 10.9 billion, contributing to 79.86% of the soil erosion cost in Canadian oilseed production, compared to losses in corn production of CAD 0.62 billion, and in pulse production of CAD 0.63 billion (see Figure 11).
On the Canadian prairie, SK has the second highest losses with 22.5% (CAD 7.45 billion) SEC, the highest cost in small-grain crop production with 48.09% (CAD 5.93 billion), and the second highest cost in the pulse production at CAD 0.42 billion. AB has the third highest SEC in Canada with 11.32% (CAD 3.75 billion), the second highest cost in small-grain production with CAD 2.76 billion, and the third in oilseed production at CAD 0.66 billion. MB has the fourth highest SEC in Canadian crop production with 6.68% (CAD 2.21 billion), the third highest cost in small grain production at CAD 1.52 billion, and the fourth in oilseed SEC with CAD 0.52 billion.
In the maritime provinces of Canada, the total SEC for Canadian crop production is about 10.5% (CAD 3.47 billion). PE has the highest SEC, with a total SEC of CAD 1.87 billion, 89.3% of which comes from potatoes, which has the highest national cost with CAD 1.67 billion (31.9%). CAD 1.48 billion was the total SEC for the crop production of NB, with 92.45% of this cost from potato production with CAD 1.37 billion, which was the third highest SEC (26.2%). NS has a total SEC of about CAD 0.11 billion, with 64.2% from potato production, which was CAD 0.07 billion. NF has the lowest total SEC for crop production with CAD 0.01 billion; 96.5% of this cost comes from potato crop production (see Figure 11).

4. Discussion

Cropland area subject to moderate to very high annual soil erosion rates decreased from 5.5% to 1.5% between 1971 and 2015, although 1.5% (0.56 M ha) is still a considerable area. This reduction in soil erosion is in response to the adoption of conservation tillage practices and a decline in the use of summer fallow. Cumulative soil losses have pushed yield losses into a state of steep decline; as the soil organic carbon content decreases, a loss in soil organic carbon results in a disproportionately larger loss in crop yield, with total national yield loss at about 141 Mt. Although the area experiencing a moderate to very high annual soil erosion rate has decreased substantially, the cumulative loss of productive topsoil, as indicated by soil organic carbon content, has increased crop yield losses by 26.9%, with estimated remaining topsoil organic carbon of 53.8%. There was little decrease in the soil erosion rate of 0.78 t·ha−1·yr−1 between 1971 and 2015. This indicates little net improvement in soil productivity in response to less intensive tillage practices.
The cumulative value of yield losses in the 44 years leading up to 2015 is estimated at CAD 33.51 billion. Areas where soil erosion is now controlled through soil conservation practices still suffer from historical soil losses. In assessing cost, it is necessary to consider cumulative historical soil losses. Soil conservation practices are essential for protecting soil health and maintaining agricultural productivity, but their effectiveness can be limited if they do not account for the long-term impacts of soil erosion, which is rarely, if ever, done in soil conservation planning. Without considering cumulative historical soil losses, soil conservation planning may underestimate the potential benefits of conservation practices. It may not prioritize conservation efforts in areas that have already experienced significant soil losses. The annual lost crop value is expected to have continued since 2015 at similar levels, with the cumulative value continuing to grow. This research suggests that soil erosion and its impact on crop yields in Canada represent a significant economic loss. It also highlights the need for continued attention to soil conservation and sustainable land use practices on the Canadian prairies.
In 2013, the annual SEC was CAD 1.93 billion, the highest during the study of 44 years in Canadian crop production. During this period, 2008 had the second highest SEC at CAD 1.7 billion. Figure 12 shows four (4) SEC eras found in this study. Era 1, between 1971 and 1988, has a total SEC of CAD 3.59 billion and an annual average of CAD 0.2 billion. Era 2, between 1989 and 1995, has a total SEC of CAD 4.76 billion with an annual SEC average of CAD 0.68 billion. Era 3, between 1996 and 2007, has a total SEC of CAD 12.42 billion and an annual SEC average of CAD 1.03 billion. Era 4, between 2008 and 2015, has a total SEC of CAD 2.75 billion and an annual SEC average of CAD 1.59 billion.
Changes in crop production are primarily responsible for the unexpected increased cost of soil erosion between 1971 and 2015. Higher-yielding and higher-value crops are being grown on land that has not improved in soil productivity, as noted previously. Remarkably, cereal crops have not changed in seeded area. Despite soil losses, yields have tripled in response to better production techniques (varieties, nutrient and pest management, seeding and harvesting practices). The ever-increasing yields would explain crop producers’ apparent lack of concern regarding soil loss and its impacts on crop productivity and profitability. Still, it should be acknowledged that crop yields on restored (non-eroded) soils would be more than three times higher than in 1971. Many soil conservation practices can be implemented in Canada to promote sustainable agriculture and reduce soil erosion. Conservation and no-till help maintain soil structure and reduce soil erosion by leaving crop residue on the soil surface as a protective cover. Also, cover crops and rotation, which involves planting different crops in a particular sequence in a field over several years, can reduce runoff and improve soil structure and fertility.

5. Conclusions

The SoilERI models for water, wind and tillage erosion have provided invaluable data to discuss more deeply the impact of soil erosion on the agricultural economy of Canada. However, these models will need to be upgraded to represent the higher spatial distribution of soil erosion over agriculture in Canada. Including machine learning, big remote sensing data and cloud computing in the SoilERI modeling will open the door to unlimited development in Canada’s spatiotemporal soil erosion modeling.
Oilseeds, pulses, cereals, and potatoes are the major crop commodities in Canada. Each Canadian province has crop production preferences, and within the provinces these preferences have changed over time due to market value, bioengineering, and machinery developments. For example, oilseeds have shown these changes: flaxseeds used to dominate in 1961 with about 66% of the seeded oilseed areas in Canada, falling to 3.4% in 2016, while the opposite story happened with canola and soybeans.
The Canadian provinces had different SEC levels due to crop production and soil conservation strategies. QP is one of the eastern provinces with the lowest yield losses and lower SEC than ON. MB has the lowest SEC among the prairie provinces, 15.8% lower than SK and 4.6% lower than AB. In the maritime provinces, PE contributes 53.7% of the total SEC, with most of the crop yield losses coming from potato crop production.
The adoption of conservation tillage and the decline in the use of summer fallow have dramatically reduced the annual rates of soil erosion on much of the cropland across Canada. However, the annual average of SEC has increased from CAD 0.2 billion per year in Era 1 to CAD 1.6 billion per year in Era 4. Although the area experiencing moderate to very high annual rates of soil erosion has decreased substantially, the cumulative historical loss of productive topsoil continues to depress crop yields in an increasingly severe manner; there has been a slight net improvement in soil productivity in response to the adoption of conservation tillage.
This research is the first step toward reversing the significant economic impact of SEC on Canadian agriculture, as well as encouraging the scientific community to pursue detailed research on developing new methodologies to distinguish accurately between SEC and crop yield costs from other important variables such as crop rotation, pathogens, crop nutrient uptake (i.e., nutrient stewardship), and climate impacts (e.g., drought). We suggest incorporating advanced remote sensing technologies, such as proximal soil sensing using soil-spectroscopy-based approaches, to assess SOC dynamics and their relationship with spatiotemporal crop yield variability [36,37,38,39]. Also, there have been recent advances in remote sensing technology for modeling large-scale SOC dynamics to generate accurate geospatial datasets of soil-erosion-related physical and chemical properties [40,41,42].
More aggressive measures are needed to increase soil organic matter levels and restore soil productivity in Canada, such as using the practice of soil-landscape restoration.

Author Contributions

Conceptualization, D.A.L. and N.B.; methodology, D.A.L. and N.B.; software, N.B.; validation, D.A.L. and N.B.; formal analysis, N.B.; investigation, D.A.L. and N.B.; resources, D.A.L.; data curation, N.B. and D.A.L.; writing—original draft preparation, N.B.; writing—review and editing, D.A.L.; visualization, N.B.; supervision, D.A.L.; project administration, D.A.L.; funding acquisition, D.A.L. All authors have read and agreed to the published version of the manuscript.

Funding

This work was also supported by the Natural Sciences and Engineering Research Council of Canada (NSERC) Discovery Grant and the University of Guelph.

Institutional Review Board Statement

Not applicable.

Informed Consent Statement

Not applicable.

Data Availability Statement

Data are contained within the article. Further requests can be made to the corresponding author.

Acknowledgments

The research team wishes to express gratitude to the Soil Conservation Council of Canada (SCCC) and the University of Guelph for their assistance in this study. Additionally, the team extends appreciation to Marita Loro, Sheng Li, and Brian McConkey for their contributions to data collection and soil erosion modeling in Canada. The team also recognizes the valuable feedback and recommendations provided by anonymous reviewers.

Conflicts of Interest

The authors declare no conflict of interest.

References

  1. Bradshaw, B.; Dolan, H.; Smit, B. Farm-Level Adaptation to Climatic Variability and Change: Crop Diversification in the Canadian Prairies. Clim. Chang. 2004, 67, 119–141. [Google Scholar] [CrossRef]
  2. Gupta, S.; Kumar, S. Simulating Climate Change Impact on Soil Erosion Using RUSLE Model—A Case Study in a Watershed of Mid-Himalayan Landscape. J. Earth Syst. Sci. 2017, 126, 43. [Google Scholar] [CrossRef] [Green Version]
  3. Larney, F.J.; Bullock, M.S.; McGinn, S.M.; Fryrear, D.W. Quantifying Wind Erosion on Summer Fallow in Southern Alberta. J. Soil Water Conserv. 1995, 50, 91–95. [Google Scholar]
  4. Vanwalleghem, T.; Gómez, J.A.; Infante Amate, J.; González de Molina, M.; Vanderlinden, K.; Guzmán, G.; Laguna, A.; Giráldez, J.V. Impact of Historical Land Use and Soil Management Change on Soil Erosion and Agricultural Sustainability during the Anthropocene. Anthropocene 2017, 17, 13–29. [Google Scholar] [CrossRef]
  5. Lobb, D.A.; Huffman, E.; Reicosky, D.C. Importance of Information on Tillage Practices in the Modelling of Environmental Processes and in the Use of Environmental Indicators. J. Environ. Manag. 2007, 82, 377–387. [Google Scholar] [CrossRef]
  6. Prasuhn, V. Twenty Years of Soil Erosion On-Farm Measurement: Annual Variation, Spatial Distribution and the Impact of Conservation Programmes for Soil Loss Rates in Switzerland. Earth Surf. Process. Landf 2020, 45, 1539–1554. [Google Scholar] [CrossRef]
  7. Muoni, T.; Koomson, E.; Öborn, I.; Marohn, C.; Watson, C.A.; Bergkvist, G.; Barnes, A.; Cadisch, G.; Duncan, A. Reducing Soil Erosion in Smallholder Farming Systems in East Africa through the Introduction of Different Crop Types. Exp. Agric. 2020, 56, 183–195. [Google Scholar] [CrossRef] [Green Version]
  8. Clarke, M.L.; Rendell, H.M. The Impact of the Farming Practice of Remodelling Hillslope Topography on Badland Morphology and Soil Erosion Processes. Catena 2000, 40, 229–250. [Google Scholar] [CrossRef]
  9. Armbrust, D.V.; Retta, A. Wind and Sandblast Damage to Growing Vegetation. Ann. Arid. Zone 2000, 39, 273–284. [Google Scholar]
  10. McCool, D.K.; Wischmeier, W.H.; Johnson, L.C. Adapting the Universal Soil Loss Equation to the Pacific Northwest. Trans. ASAE 1982, 25, 0928–0934. [Google Scholar] [CrossRef]
  11. Chappell, A.; Baldock, J.; Sanderman, J. The Global Significance of Omitting Soil Erosion from Soil Organic Carbon Cycling Schemes. Nat. Clim. Chang. 2015, 6, 187–191. [Google Scholar] [CrossRef]
  12. Obalum, S.E.; Chibuike, G.U.; Peth, S.; Ouyang, Y. Soil Organic Matter as Sole Indicator of Soil Degradation. Environ. Monit. Assess. 2017, 189, 1–19. [Google Scholar] [CrossRef] [PubMed]
  13. Rennie, D.A. Soil Degradation, A Western Perspective. Can. J. Agric. Econ. Rev. Can. D’agroeconomie 1985, 33, 19–29. [Google Scholar] [CrossRef]
  14. Martínez-Casasnovas, J.A.; Ramos, M.C. The Cost of Soil Erosion in Vineyard Fields in the Penedès–Anoia Region (NE Spain). Catena 2006, 68, 194–199. [Google Scholar] [CrossRef]
  15. Barbier, E.B. Capitalizing on Nature: Ecosystems as Natural Assets; Cambridge University Press: Cambridge, UK, 2011; ISBN 1139503065. [Google Scholar]
  16. Woodward, D.E. Method to Predict Cropland Ephemeral Gully Erosion. Catena 1999, 37, 393–399. [Google Scholar] [CrossRef]
  17. Alfsen, K.H.; de Franco, M.A.; Glomsrød, S.; Johnsen, T. The Cost of Soil Erosion in Nicaragua. Ecol. Econ. 1996, 16, 129–145. [Google Scholar] [CrossRef]
  18. Wen, X.; Yao, S.; Sauer, J. Shadow Prices and Abatement Cost of Soil Erosion in Shaanxi Province, China: Convex Expectile Regression Approach. Ecol. Econ. 2022, 201, 107569. [Google Scholar] [CrossRef]
  19. Cohen, M.J.; Brown, M.T.; Shepherd, K.D. Estimating the Environmental Costs of Soil Erosion at Multiple Scales in Kenya Using Emergy Synthesis. Agric. Ecosyst. Environ. 2006, 114, 249–269. [Google Scholar] [CrossRef]
  20. Nkonya, E.; Mirzabaev, A.; von Braun, J. Economics of Land Degradation and Improvement: An Introduction and Overview. In Economics of Land Degradation and Improvement—A Global Assessment for Sustainable Development; Springer: Berlin/Heidelberg, Germany, 2015; pp. 1–14. [Google Scholar] [CrossRef]
  21. Sartori, M.; Philippidis, G.; Ferrari, E.; Borrelli, P.; Lugato, E.; Montanarella, L.; Panagos, P. A Linkage between the Biophysical and the Economic: Assessing the Global Market Impacts of Soil Erosion. Land Use Policy 2019, 86, 299–312. [Google Scholar] [CrossRef]
  22. Nkonya, E.; von Braun, J.; Mirzabaev, A.; Le, Q.B.; Kwon, H.Y.; Kirui, O. Concepts and Methods of Global Assessment of the Economics of Land Degradation and Improvement. In Economics of Land Degradation and Improvement—A Global Assessment for Sustainable Development; Springer: Berlin/Heidelberg, Germany, 2015; pp. 15–32. [Google Scholar] [CrossRef]
  23. The Economics of Desertification, Land Degradation and Drought: Methodologies and Analysis for Decision-Making: Background Document: UNCCD 2nd Scientific Conference. 2013. Available online: https://digitallibrary.un.org/record/749587?ln=en (accessed on 1 May 2021).
  24. US Bureau of Labor Statistics CPI Inflation Calculator. Available online: https://www.bls.gov/data/inflation_calculator.htm (accessed on 6 January 2023).
  25. Dregne, H.E.; Chou, N.-T. Global Desertification Dimensions and Costs. Degrad. Restor. Arid. Lands 1992, 1, 73–92. [Google Scholar]
  26. ICOLD CIGB. Sedimentation and Sustainable Use of Reservoirs and River Systems. International Commission on Large Dams (ICOLD) Bulletin, 1st ed.; CRC Press: Boca Raton, FL, USA, 2010. [Google Scholar] [CrossRef]
  27. Nkonya, E.; Anderson, W.; Kato, E.; Koo, J.; Mirzabaev, A.; von Braun, J.; Meyer, S. Global Cost of Land Degradation. In Economics of Land Degradation and Improvement—A Global Assessment for Sustainable Development; Springer: Berlin/Heidelberg, Germany, 2015; pp. 117–165. [Google Scholar] [CrossRef]
  28. Gallo, B.C.; Sérgio, P.; Magalhães, G.; Demattê, J.A.M.; Rossi Cervi, W.; Luís, J.; Carvalho, N.; Carneiro Barbosa, L.; Bellinaso, H.; César De Mello, D.; et al. Soil Erosion Satellite-Based Estimation in Cropland for Soil Conservation. Remote Sens. 2022, 15, 20. [Google Scholar] [CrossRef]
  29. Panagos, P.; Lugato, E.; Ballabio, C.; Biavetti, I.; Montanarella, L.; Borrelli, P. Soil Erosion in Europe: From Policy Developments to Models, Indicators and New Research Challenges. In Global Degradation of Soil and Water Resources: Regional Assessment and Strategies; Springer Nature Singapore: Singapore, 2022; pp. 319–333. [Google Scholar] [CrossRef]
  30. AAFC. Environmental Sustainability of Canadian Agriculture: Agri-Environmental Indicator Report Series Report No. 4; NCR: Ottawa, ON, Canada, 2016. [Google Scholar]
  31. Battiston, L.A.; Miller, M.H.; Shelton, I.J. Soil erosion and corn yield in ontario. I. field evaluation. Can. J. Soil Sci. 1987, 67, 731–745. [Google Scholar] [CrossRef]
  32. Vandenbygaart, A.J.; Kroetsch, D.; Gregorich, E.G.; Lobb, D. Soil C Erosion and Burial in Cropland. Glob. Chang. Biol. 2012, 18, 1441–1452. [Google Scholar] [CrossRef]
  33. Baulch, H.M.; Elliott, J.A.; Cordeiro, M.R.C.; Flaten, D.N.; Lobb, D.A.; Wilson, H.F. Soil and Water Management: Opportunities to Mitigate Nutrient Losses to Surface Waters in the Northern Great Plains. Environ. Rev. 2019, 27, 447–477. [Google Scholar] [CrossRef]
  34. Schneider, S.K.; Cavers, C.G.; Duke, S.E.; Schumacher, J.A.; Schumacher, T.E.; Lobb, D.A. Crop Responses to Topsoil Replacement within Eroded Landscapes. Agron. J. 2021, 113, 2938–2949. [Google Scholar] [CrossRef]
  35. Oldfield, E.E.; Bradford, M.A.; Wood, S.A. Global Meta-Analysis of the Relationship between Soil Organic Matter and Crop Yields. Soil 2019, 5, 15–32. [Google Scholar] [CrossRef] [Green Version]
  36. Wang, S.; Guan, K.; Zhang, C.; Lee, D.K.; Margenot, A.J.; Ge, Y.; Peng, J.; Zhou, W.; Zhou, Q.; Huang, Y. Using Soil Library Hyperspectral Reflectance and Machine Learning to Predict Soil Organic Carbon: Assessing Potential of Airborne and Spaceborne Optical Soil Sensing. Remote. Sens. Environ. 2022, 271, 112914. [Google Scholar] [CrossRef]
  37. Mozaffari, H.; Moosavi, A.A.; Cornelis, W. Vis-NIR-Spectroscopy- and Loss-on-Ignition-Based Functions to Estimate Organic Matter Content of Calcareous Soils. Arch. Agron. Soil Sci. 2022, 1–19. [Google Scholar] [CrossRef]
  38. Zhao, X.; Zhao, D.; Wang, J.; Triantafilis, J. Soil Organic Carbon (SOC) Prediction in Australian Sugarcane Fields Using Vis–NIR Spectroscopy with Different Model Setting Approaches. Geoderma Reg. 2022, 30, e00566. [Google Scholar] [CrossRef]
  39. Jayanthi, D.; Gokila, B. Continuous Cropping and Fertilization on Vertical Distribution of Major Nutrients, SOC Dynamics Through FT-IR Spectroscopy and Developing Soil Quality Indices Under Sandy Clay Loam Soil. Commun. Soil Sci. Plant Anal. 2022, 54, 356–377. [Google Scholar] [CrossRef]
  40. Zhao, D.; Eyre, J.X.; Wilkus, E.; de Voil, P.; Broad, I.; Rodriguez, D. 3D Characterization of Crop Water Use and the Rooting System in Field Agronomic Research. Comput. Electron. Agric. 2022, 202, 107409. [Google Scholar] [CrossRef]
  41. Ma, Y.; Minasny, B.; Viaud, V.; Walter, C.; Malone, B.; McBratney, A. Modelling the Whole Profile Soil Organic Carbon Dynamics Considering Soil Redistribution under Future Climate Change and Landscape Projections over the Lower Hunter Valley, Australia. Land 2023, 12, 255. [Google Scholar] [CrossRef]
  42. Zhao, D.; Wang, J.; Zhao, X.; Triantafilis, J. Clay Content Mapping and Uncertainty Estimation Using Weighted Model Averaging. Catena 2022, 209, 105791. [Google Scholar] [CrossRef]
Figure 1. Schematic drawing of the soil erosion cost analysis workflow, starting from soil erosion modeling, crop production metrics, cumulative soil loss estimation, and crop yield loss estimation; all dollar values were revalued to the 2020 Canadian dollar value based on the inflation rate published by the Bank of Canada.
Sustainability 15 04489 g001
Figure 2. Statistical relationships between soil organic carbon (SOC), cumulative soil loss, and crop yield loss/gain: (a) the relationship between cumulative soil loss (t/ha), the amount of the original topsoil remaining, and SOC (%) in SoilERIwind, SoilERIwater, SoilERItillage, and SoilERIintegrated (r2 = 0.98); and (b) the relationship between original topsoil remaining, SOC (%), crop yield loss (CYL), and crop yield gain (CYG) %, (r2 = 0.99).
Sustainability 15 04489 g002
Figure 3. (a) Total historical area (M ha) of Canadian agriculture seeded land and summer fallow land between 1961 and 2016; (b) the percentage of provincial seeded area in Canadian agriculture for 1961 and 2016.
Sustainability 15 04489 g003
Figure 4. National crop-commodities seeded area percentage (%) between 1961 and 2016.
Sustainability 15 04489 g004
Figure 5. Crop production metrics for oilseed crops (canola, flaxseed, soybean) in Canada: (a) seeded area (%) between 1961 and 2016; (b) seeded area (%) comparisons between oilseed crops in 1961 and 2016; (c) average national crop yield (t/ha) for canola, flaxseed, mustard seed, soybeans, and sunflower between 1961 and 2016; (d) total national canola production (Mt) and average crop price (CAD/t) between 1961 and 2016; (e) total national flaxseed production (Mt) and average crop price (CAD/t) between 1961 and 2016; and (f) total national soybean production (M t) and average crop price (CAD/t) between 1961 and 2016.
Sustainability 15 04489 g005
Figure 6. Crop production metrics for small grain crops (barley, oats, rye, and wheat) in Canada: (a) average national crop yield (t/ha) for barley, oats, rye, and wheat between 1961 and 2016; total national harvested area (M ha) and average national yield (t/ha) between 1961 and 2016 for (b) barley, (c) oats, (d) rye, and (e) wheat; (f) total national wheat production (Mt) and average crop price (CAD/t) between 1961 and 2016.
Sustainability 15 04489 g006
Figure 7. (a) Total seeded area (%) and (M ha) for pulse crops (dry beans, dry peas, chickpeas, and lentils) between 1961 and 2016; (b) seeded area (%) comparisons between pulse crops in 1961, 1981 and 2016; (c) average national crop yield (t/ha) for chickpeas, dry beans, dry peas, and lentils between 1961 and 2016.
Sustainability 15 04489 g007
Figure 8. (a) Total seeded area in thousands of hectares (T ha) for the potato crop between 1961 and 2016; (b) total national potato production (M t) and average crop price (CAD/t) between 1961 and 2016; and (c) average national crop yield (t/ha) for potatoes between 1961 and 2016.
Sustainability 15 04489 g008
Figure 9. Cropped areas (%) for Canadian provinces BC, AB, SK, MB, ON, QP, NB, NF, NS, and PE in different SoilERI categories ( S o i l E R I N e g l i g i b l e , S o i l E R I V e r y L o w , S o i l E R I L o w , S o i l E R I M o d e r a t e , S o i l E R I H i g h , and S o i l E R I V e r y   H i g h ) between 1961 and 2016.
Sustainability 15 04489 g009
Figure 10. Canada’s total national crop-commodity-based soil erosion cost (SEC) percentages (%) between 1971 and 2015.
Sustainability 15 04489 g010
Figure 11. Total provincial soil erosion cost (SEC) in percentage (%) between 1971 and 2015.
Sustainability 15 04489 g011
Figure 12. Annual national soil erosion cost (SEC) in CAD (billions) for the period between 1971 and 2015, divided into four SEC eras: Era 1 (1971–1988), Era 2 (1989–1995), Era 3 (1996–2007), and Era 4 (2008–2015).
Sustainability 15 04489 g012
Disclaimer/Publisher’s Note: The statements, opinions and data contained in all publications are solely those of the individual author(s) and contributor(s) and not of MDPI and/or the editor(s). MDPI and/or the editor(s) disclaim responsibility for any injury to people or property resulting from any ideas, methods, instructions or products referred to in the content.

