Article

Utilizing Intelligent Portable Bicycle Lights to Assess Urban Bicycle Infrastructure Surfaces

1
UHasselt, The Transportation Research Institute (IMOB), Martelarenlaan 42, 3500 Hasselt, Belgium
2
UHasselt, Faculty of Engineering Technology, Agoralaan, 3590 Diepenbeek, Belgium
*
Author to whom correspondence should be addressed.
Sustainability 2023, 15(5), 4495; https://doi.org/10.3390/su15054495
Submission received: 2 February 2023 / Revised: 21 February 2023 / Accepted: 27 February 2023 / Published: 2 March 2023
(This article belongs to the Special Issue Vulnerable Road Users in Safe System Approach)

Abstract

:
Vibration from bicycle infrastructure affects the cyclists’ comfort and the choice of this transportation mode. This study uses smart portable bicycle lights to measure the vibration and quantify the level of cycling comfort on cycling infrastructure. A total of 28 bicycle streets and paths were selected in the city of Hasselt, Belgium, as the case study area. Six volunteer cyclists were recruited for the vibration sensitivity test of the device before the actual data collection. The results showed no considerable difference in the vibration recorded separately on each tested bicycle surface. The average vibration values vary from 1 to 17.78, indicating that riding comfort varies significantly across different surfaces. Asphalt and concrete roads had the lowest vibration and were the most comfortable in the study area. In contrast, cobblestone-paved bike paths were the least comfortable because of higher vibration. A comfort level map was developed based on the relationship between cycle vibration and subjective perception of comfort level. Twenty cyclists participated in the perception of vibration test. The comfort level is inversely correlated with the vibration. This methodology is adaptable to any other setting. Additionally, practitioners can use it to check and track the quality of the surface of the bicycle infrastructure over time.

1. Introduction

Cycling, similarly to walking, is a healthy and sustainable transportation mode [1,2]. It also offers long-term environmental effects that aid energy conservation and create a pleasant atmosphere with lower air emissions and noise pollution [3,4,5,6]. Problems such as traffic congestion, noise, and air pollution are common in urban areas nowadays [7,8]. These issues are strongly linked to motorized modes of transportation, making cycling a more appealing means of transport [9,10,11]. Policymakers are increasingly looking for solutions to create a more flexible and sustainable transportation system and to change habits to encourage a decrease in the use of private automobiles in response to these urgent concerns [12,13,14]. As an alternative, the bicycle has additional advantages in that it is affordable and, in traffic, can be faster than other vehicles [15,16,17].
Biking comfort levels on various cycling infrastructures can significantly impact cyclists’ perceptions of comfort and mode choice [2,18,19,20,21,22]. Additionally, the pavement surface quality frequently influences riders’ selection of the ideal route [23,24]. Therefore, bicycle paths and roadways dedicated to bicycles should be smooth, requiring minimum effort [25,26,27]. In evaluating the best routes for cyclists, a component of bicycle network assessment, the surface pavement type, is included (along with other parameters, such as traffic volumes and road width) [28,29]. Moreover, surface roughness can have safety implications for bicyclists. Rough paths can cause vibrations that can lead to discomfort or even injury. In addition, potholes, cracks, and other irregularities in the road surface can pose a hazard to users, potentially causing accidents or falls [30]. As a result, the significance of cycling infrastructure becomes increasingly vital from a safety perspective and in terms of the comfort level of cycling [26]. In addition, comfort and safety are considered a top priority for city planners and decision makers by enhancing road infrastructure quality and guaranteeing a safe and comfortable ride [30,31].
Cycling comfort is a broad concept, and we can generally categorize cycling comfort analysis from various perspectives (e.g., measuring vibration, emotion, etc.) with information technology [32]. The second example includes a cyclist’s study, reflecting on their opinions and feelings or evaluating the ride while cycling [33]. The quality of bicycle infrastructure, which is the primary focus of this study, can affect the ride’s comfort. Badly maintained bicycle infrastructure creates vibration, which is undesirable for cyclists and is mainly perceived as discomfort during the ride. Furthermore, the pavement surface quality frequently influences riders’ preferred routes [33,34,35]. The degree of vibration reflects the pavement’s influence on cycling comfort [36]. In addition, bicycle roads are a critical component of smart mobility. Additionally, the number of bike roads is used as a technical infrastructure indicator to assess the smart mobility system’s potential [37]. Creating smoother, safer bike lanes with improved surfaces might encourage more people to cycle, significantly impacting the environment, traffic congestion, and general health [38]. As a result, it is critical to invest in creating bike paths with smoother surfaces to make riding comfortable, safer, more pleasant, and appealing in order to encourage more people to cycle [37,38].
Although numerous techniques have obtained data on bicycle infrastructure conditions, most methods have limited applications [39]. Direct visual inspection has traditionally been used to assess cycle-path pavement conditions [40,41]. However, such methods take time and are restricted by the surveying engineer’s walking speed and technical knowledge, producing biased results [4,42,43]. Some techniques, e.g., modern probe bicycles that require specialized measurement equipment (such as sophisticated profilers), are expensive and require expert operators, making them relatively difficult to replicate [25]. Hence, this paper aims to establish the feasibility of low-cost equipment (SEE.SENSE portable bicycle lights) for assessing bicycle pavement conditions. SEE.SENSE is a company that develops a range of innovative products for cyclists. SEE.SENSE develops portable bicycle lights that can detect vibration on bicycle infrastructure surfaces. Hence, it has the potential to help evaluate bicycle infrastructure. Additionally, one of the critical benefits of these lights is that they are low-cost devices. Therefore, this study evaluates the SEE.SENSE portable bicycle light’s accuracy, sensitivity, and consistency to verify its usability in bicycle infrastructure assessment. In addition, the ease of completing the device configuration would also be checked, which is somewhat challenging to copy in other methods.
The paper is structured as follows. Section 2 reviews previous work regarding bicycle infrastructure assessment. Section 3 discusses the methodology adopted for the study. The results of the study are presented in Section 4. Section 5 discusses the results obtained, highlighting the results’ potential useability. Finally, Section 6 summarizes the study and provides recommendations and an outlook for future studies.

2. Literature Review

Bike riders are subjected to a multitude of environments that are not bicycle-friendly. Ride vibration and factors such as roadway and traffic settings, including frequent vehicle engagement, stops, steep slopes, and impediments such as humps and curbs, dramatically reduce bicycle riding [44,45]. Comfort decreases as vibration intensity rises [46,47,48]. Vibrations are caused mainly by an uneven road surface [25,48]. In addition, it is argued by some researchers that strong and long-lasting vibrations might be harmful to health [9,48,49,50]. On the other hand, a smooth surface indicates that bicycle users consume less energy while riding [9,51]. Thus, developing a bicycle-friendly environment begins with determining if a bicycle segment is comfortable and produces less vibration.
Relevant research on assessing bicycle infrastructure can be divided into traffic engineering and sensor and detecting technology applications. Transportation engineering research has focused on bicycle level of service (BLOS) and indices for bicycle commuting quality. [4,44,52,53,54]. BLOS measures the effectiveness of the current bike infrastructure on streets and assesses its quality for its users [1,3,4,55]. It is generally accepted that various performance measures, such as traffic conditions, facility characteristics, environmental factors, etc., impact BLOS [2,56]. Typically, different parts of the cycling infrastructure are given points, totaled up to generate a score that ranks the comfort level from desirable to undesirable [4,52]. Since these methods employ direct field measurement for various cycling infrastructure attributes, these methods are time-consuming.
In contrast, vertical acceleration or vibration is essential in sensor and detecting technology. Many researchers have studied its effect on bicycle riders’ comfort over the years [19,25,28,47,48]. Cyclists perceive surface quality through bicycle vibrations, one of the most common sources of discomfort [36]. Despite efforts by bicycle manufacturers to increase cycling comfort through various technical advances [51], efforts to improve the cycling network’s quality or locate problematic areas still require an objective mapping of vibrations along cycling tracks and roadways [25].
Inertial sensors (accelerometers) are excellent pavement sensors for wide-area instrumentation [57]. In 2013, a bicycle monitoring index using GPS and an accelerometer mounted to a bicycle was introduced [44]. Researchers estimated a road segment’s cycling suitability using vibration and speed data. However, the findings are single numbers for entire bicycle segments and do not identify locations with extreme outliers [25]. Similarly, cycling track vibration mapping frequently makes use of bicycles with accelerometers. Many researchers have used an instrumented probe bicycle (IPB) technology to assess bicycle comfort [2,58,59]. The IPBs are outfitted with several technologies that measure bicycle position and acceleration [25]. The objective of IPBs is to provide dependable bicycle instrumentation to automate the collection of actual data [60]. The cycling track measurements with IPBs yield a wealth of information, but it can be challenging for other researchers to replicate the findings [25,32]. However, IPBs cannot be installed on numerous bicycles and used for extensive testing under real-world circumstances [60]. Moreover, these systems are also expensive.
Olieman et al. (2012) used acceleration sensors to measure cyclists’ vibrations [19]. The findings demonstrated that the road surface, speed of the bike, and tire pressure directly impacted the intensity of vibrations caused to the bicycle’s frame and fork. Nuñez et al. (2020) evaluated cycling infrastructure using vertical acceleration and environmental quality. These studies show the importance of detecting vibrations to evaluate cycleway quality and user comfort [9]. These studies have demonstrated the relevance of detecting vibrations to assess the quality of cycleways and the close link with user comfort. More recently, GPS receivers and specialized accelerometers were integrated to evaluate the state of the pavement [47,48,61]. Embedded sensors with georeferencing make it easier to include smartphone measurements in cycleway inventory and evaluation procedures. A GIS approach to measuring road surface roughness has many advantages over earlier methods [19,62]. The above methods for collecting vibration data were either too expensive or difficult to install on multiple bikes.
Recent technological advancements have embedded GPS and bicycle vibration in cycling equipment such as bicycle lights. This study advances this knowledge by introducing a reliable and impartial vibration measurement utilizing portable bicycle lights developed by SEE.SENSE. The device will be installed on bicycles to collect the data. Since this study seeks vibration data from portable bicycle lights, there is no need for direct field measurement. Hence, gathering data is quicker and more effective. Additionally, different people can engage in the collaborative method of data collection on bicycle surface quality, potentially resulting in an extensive and diversified dataset. Unlike previous methods such as BLOS, a detailed statistical analysis such as outlier detection and classification can be carried out on this dataset, making it feasible to determine the road surface roughness more realistically and precisely. To the author’s knowledge, no such study evaluating bicycle infrastructure using bicycle accessories has been carried out. These may also be installed on many bikes and used for long periods.

3. Materials and Methods

3.1. Study Area

The main objective of selecting case studies is to evaluate whether ACE portable bicycle lights developed by SEE.SENSE are a reliable tool for assessing bicycle infrastructure. ACE is an intelligent bicycle light that can illuminate the rider’s path and collect vibration data. This ability to collect vibration data makes ACE portable bicycle lights valuable for evaluating and helping practitioners suggest locations for improving bicycle infrastructure. For this purpose, bicycle streets and cycle paths in the Hasselt city center, a medium-sized city in Belgium, were selected to conduct the tests. Figure 1 illustrates the street and bicycle paths chosen in this study.
Since the bicycle infrastructure pavement finishing in each case study is different, testing these different types of bike infrastructure will help us test and analyze the sensor quality. Figure 2 displays examples of cycling tracks and street pavements where the data were collected.
Figure 3 shows a clear and organized representation of the steps involved in the research process. The flowchart provides an overview of the stages that were followed in conducting the research.

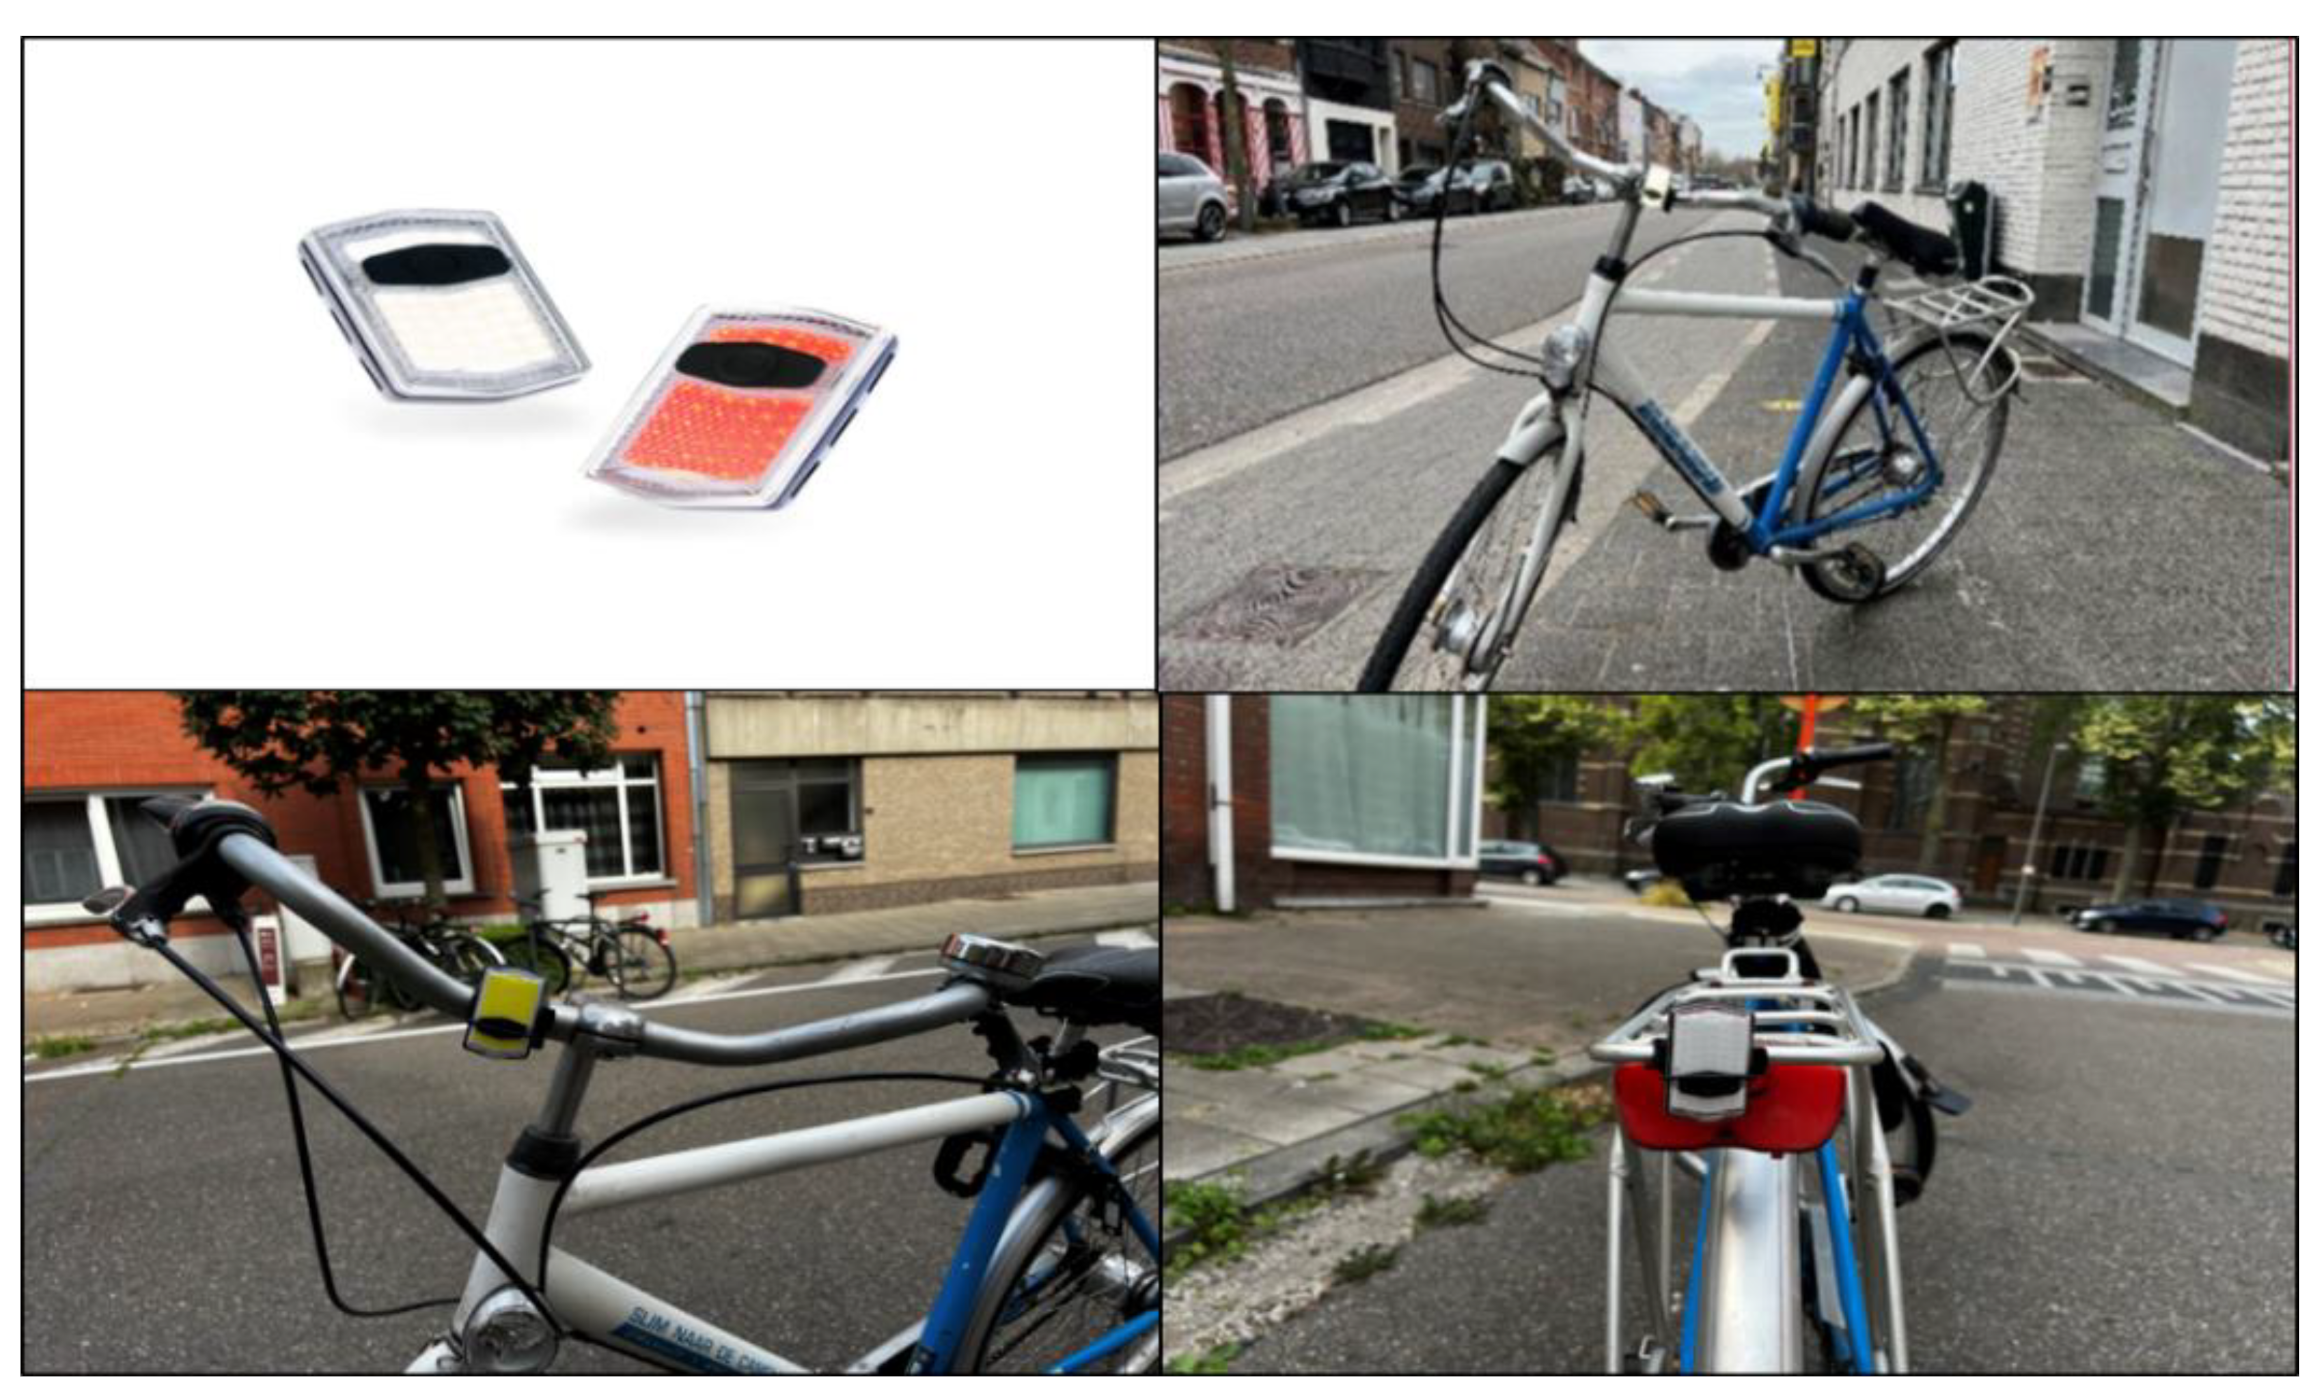
3.2. Measuring Equipment

As illustrated in Figure 4, cycling vibration data were gathered using SEE.SENSE ACE portable bicycle light. The SEE.SENSE ACE device used for collecting vibration values can measure vibrations within 0–100. Values close to 0 indicate that the cycling surface is smooth. In contrast, higher values suggest that the surface is rough, resulting in increased vibration. To measure vibration, two portable SEE.SENSE lights are attached to a regular bicycle at the front and the rear, as shown in Figure 4. The lights are connected to the smartphone through the SEE.SENSE application. SEE.SENSE uses crowdsourcing edge processing and artificial intelligence sensor data to analyze road surface quality. The SEE.SENSE sensors utilize a remarkably sensitive and precise three-axis accelerometer capable of providing up to 800 readings per second, describing the cyclist’s movement in all three dimensions. The smartphone app used with bicycle lights automatically pairs readings with GPS locations. GPS-linked accelerometer data help identify problematic areas.

3.3. Measuring Technique

The device configuration used in the experiment was straightforward and uncomplicated. The process of configuring the device for data collection involves three simple steps that can be followed to get started. Firstly, the portable SEE.SENSE bicycle lights are mounted at the front and rear of the bicycle to conduct the test for infrastructure vibration data collection. Secondly, both lights are connected to the app using Bluetooth. Then, the cyclist activates SEE.SENSE lights using the app or the physical button on the SEE.SENSE lights. The sensors begin collecting the data once the lights are turned on and stop when the lights are turned off. Finally, the cyclist begins cycling along the designated route.

3.4. Importing Data in GIS for Bicycle Infrastructure Roughness

The portable lights can collect the GPS location of each data point collected on the route. The spatial location of the infrastructure defects is critical because it helps practitioners and decision-makers identify problematic sites. As a result, they can prioritize sites and propose appropriate countermeasures to help alleviate the problem—the SEE.SENSE data were transferred to arc map software to visualize the roughness data. Arc map software (version 9.3), developed by the Environmental Systems Research Institute headquartered in Redlands, California, was used for spatial analysis [63]. The software has become popular for various transportation applications [64,65,66,67]. The software was also used to locate and eliminate false outliers in the dataset. This entailed examining the data visually on a map to detect any abnormal or unexpected outcomes that could have resulted from measurement or data processing errors. The dataset contained a small number of false outliers, which were removed to ensure the precision and dependability of the analysis.

3.5. Cyclists’ Perception of Vibration

The cycling comfort varies from person to person and depends on users’ perceptions [35]. After collecting vibration data, cyclists were asked about vibration and comfort. Twenty participants completed the questionnaire and provided their ratings on vibration and comfort after cycling on each pavement segment. The cyclists who participated in the perception study of cycling infrastructure ranged in age from 18 to 40. This age range was chosen to capture the perspectives and experiences of cyclists who are more likely to use cycling infrastructure for commuting to school/work, recreation, shopping, and other purposes. The report revealed that about 40% of school trips are more likely to be made by cycling, and approximately 25% of work trips are made by bicycle in Flanders [68]. In addition, we chose participants who understood the study’s objectives and the purpose of the perception-based survey regarding vibrations. Hence, it ensured that the collected data accurately reflected the perceptions and experiences of the larger cycling population within the study area. Volunteer riders were asked to score their comfort level from 1 (extremely uncomfortable) to 5 (very comfortable). Due to the time-consuming nature of assessing vibration perception for all 28 streets, most participants could not participate in the entire bicycle streets perception test. Excluding some of these sections from the test sample was faster without compromising the results. Thus, eight pavement portions were selected for vibration perception testing.

4. Results

4.1. Sensitivity Test

For the sensitivity test, two bicycle paths along the Hasselt Inner Ring (R70) were selected for cycling. The bicycle path on the city center side is bidirectional and newly built. Furthermore, the bicycle path is asphalt paved, while the other path on the outer side has mainly been constructed using paving tiles and concrete blocks. It was essential to see the sensitivity and accuracy of the results obtained from different lights and cyclists. For this purpose, we recruited six volunteers to record the vibration. Figure 5 shows the two bicycle paths along the inner ring R70 of Hasselt. The blue indicates the newly built path, while the green shows the old bicycle path.
The descriptive statistics for the inner cycling path (R70) are shown in Table 1. The field test in this section included six volunteers. The cyclists find it more convenient if they encounter fewer high-stress circumstances. The bike vibrates a lot on a rough road, which makes it hard for the rider to manage the bike and requires more effort to keep from colliding. We consider the roughness of the road’s surface when developing our method. The bike’s z-direction acceleration is monitored to quantify these adverse effects in numerical value. This provides details regarding the degree of the road’s roughness. Portable SEE.SENSE ACE bicycle lights can record the vibration on the bicycle path in values ranging from 0 to 100. The values closer to 0 suggest that the bicycle surface is smooth, while a rough surface implies increased vibration and less comfort. The maximum vibration recorded on this path was 51, with most cyclists experiencing maximum vibrations ranging from 30 to 40. Only two bicycle riders’ vibrations exceeded 40. Similarly, there is no significant variance in the cyclist’s mean vibration.
Moreover, the standard deviation of those measurements also shows that the individual measurements are almost equivalent to the vibration mean value. The mean values in Table 1 are the average set of all vibrations along the cycle path (R70). The highest mean vibration among all cyclists was 3.07, with the rest ranging from 2.3 to 2.9. The riders were asked to cycle at varying speeds. However, the average speed of all cyclists is almost the same. Nevertheless, the maximum speed achieved by each rider is different. It is evident from Table 1 that the bicyclists ride at nearly the same average speed. Rider 4 recorded the highest maximum speed of 25.4 km, while the rest were near 20. There was no considerable difference in the vibration recorded on the bicycle surface.
The SEE.SENSE devices were also tested on the old bicycle path on R70 in Hasselt. The descriptive statistics of the outer (old) bicycle path are shown in Table 1. The green color in Figure 5 represents the outer (old) bicycle path. The primary purpose was to observe the sensitivity of the devices in a different context and on a differently paved bicycle path. This bicycle path is paved with concrete. The device registered a maximum vibration of 43 on this cycle surface for riders 2 and 7. The maximum mean vibration recorded for this surface was 3.42, while the others’ were between 2.6 and 3.0. The maximum speed recorded was 23.82 km/h, and 14.22 km/h was the maximum mean speed on this bicycle path.
Based on the descriptive statistics for both cycle paths, there was no significant difference in the vibration. SEE.SENSE devices can detect vibration correctly. Different instruments were used on the same surface for this test, but there was no significant difference. Hence, the reliability test of the utilized devices is confirmed, and these devices can be used to correctly record the vibration on the bicycle paths.

4.2. Cycling Vibration on Tested Bicycle Segments

Twenty volunteers were involved in the data collection of Hasselt city to analyze the road conditions cyclists are exposed to. Figure 6 presents a map of the vibration values collected via portable SEE.SENSE bicycle lights. Each point on the map represents a specific vibration value. The red points on the map depict higher roughness, meaning that the riders have felt a significant anomaly while cycling. In contrast, the green points show a smoother surface, with a highly comfortable experience for the cyclist. Successive red points in specific lengths usually indicate a rough road surface or a problematic area.
Figure 7 shows that there are several areas where these anomalies were recorded. Hence, visual observation was needed to cross-check the testify situation on the field. Eleven areas were observed to have such anomalies in the study area. Figure 7 indicates 11 areas where possible infrastructure defects or rough surfaces were identified. A two-step approach analysis was adopted for the detailed investigation of each bicycle path section. Three vibrational categories were created to visualize the results. The vibration data were overlayed with ArcMap software satellite imagery to understand the data and draw meaningful conclusions.
The initial results suggested that vibrational values over 24 are concerning, and there might be some irregularities in the bicycle path. Hence, ground truthing for green dots and reds was carried out, which also helped understand, interpret, and analyze the collected information. For this reason, a succession of points with a vibration value greater than 24 was identified in the study area because it might indicate something unusual on the bicycle path. All identified sections of bicycle paths or streets are located in the city center of Hasselt.
In Figure 8, the left photo represents the first step in analyzing and identifying sections with anomalies. We used the GPS and vibration through a smartphone application utilized with the SEE.SENSE ACE bicycle lights—this way, our measurements are quickly matched with a GPS location value. Hence, by assigning a vibration value to each spatial location, we can identify particular areas of bicycle paths and streets causing the most discomfort to cyclists.
Additionally, with spatial location linked with the vibration, the magnitude can be known at each location, with a red point indicating a greater roughness. The second phase, seen in the center of Figure 8, entails the highest roughness at a specific location. This confirms that this location is where most cyclists are experiencing the most extensive vibrations, making the bicycle street uncomfortable. On the right side of Figure 8 is photographic documentation of the road in this troublesome portion of the street.
The green points on the map (refer to Figure 7) represent very low vibration. These green points indicate that the bicycle path and streets are relatively smooth. Figure 9 illustrates the vibration in a location where the cyclists experienced minimum vibration recorded.
The cycling vibration on each pavement segment is presented in Table 2. A rough surface suggests less comfort and more vibration. The vibration scores of the 28 bicycle paths and streets are shown in Table 2. The average vibration values vary from 1 to 17.78, indicating that riding comfort varies significantly across these segments.

4.3. Infrastructure Type and Vibration

A rough road makes the bicycle vibrate excessively, making it much harder for the rider to control the bicycle and demanding more energy to ride safely. In our technique, we consider the vibration of the cycling surface. Figure 10 depicts vibration charts for different bicycle surfaces. Large vibration values represent a poor road, for instance, in the case of cobblestone, but measurements on a good road, such as an asphalt-paved road, vary very little between 0 and 5.
Figure 11 overviews the different types of pavement surfaces and average vibration in the study area. The study yielded some intriguing results. The average vibration on cobblestone bicycle surfaces was around 15 (the highest). The concrete- and asphalt-paved paths recorded average vibrations of under 4, while streets paved with paving slabs and small paving material recorded an average vibration of 8 and 6.5, respectively. There is substantial evidence that different surfaces produced different vibration levels.
The ANOVA test was performed to determine whether vibration values differ across various pavement types. The results showed a significant difference in vibration values across different pavement types, with an F-value of 47.636 and a significance level (sig) of less than 0.001. This indicates that the difference in vibration values between the various pavement types is statistically significant and supports the conclusion that the type of pavement influences the vibration experienced by cyclists.
Table 3 presents the results of a multiple comparisons (Tukey HSD) test that was conducted on the vibration values recorded on different types of infrastructure pavement (asphalt, concrete, small paving slabs, paving slabs, and cobblestone). The test’s purpose was to determine if there are any significant differences in the mean vibration values across the different types of pavement. The results show that the mean difference in vibration values is significant (at the 0.05 level) for all pairs of infrastructure pavement types, except for the comparison between asphalt and concrete (Sig.= 0.114). This means that the mean vibration values for asphalt and concrete are not significantly different. In contrast, the mean vibration values for the other pavement types are significantly different. For example, the mean difference in vibration values between asphalt and cobblestone is 14.56800, with a standard error of 1.23396 and a significance value of <0.001. This indicates that the mean vibration values recorded on cobblestone pavements are significantly higher than those recorded on asphalt pavements.

4.4. Effect of Speed on Cycling Vibration

The cyclists were instructed to cycle at varying speeds on a cycling segment to explore the relationship between cycling speed and vibration. A Pearson correlation coefficient was computed to test the relationship between speed and vibration on bicycle paths. The Pearson correlation between the two variables was negative and somewhat low (r = −0.150, p < 0.001).
Figure 12 shows that the vibration slightly decreases with an increase in speed. The vibration is higher at a slower speed. This is because the riders tend to slow down when the bicycle path is not smooth or they cannot bike faster on rough pavement. Similarly, the rider opts to cycle at a higher speed when there are no irregularities on the bike path surface.

4.5. Cyclist Perception of Vibration

The opinion of cyclists on vibration was assessed in terms of acceptable comfort after evaluating the data from the questionnaires filled out by the volunteers based on their cycling experience on the tested segments. Volunteer cyclists answered a question regarding ride comfort, ranking it from extremely comfortable to extremely uncomfortable. The results are displayed in Figure 13. A Pearson correlation test was performed to observe the correlation between the perception of cyclists regarding the vibration. A close relationship between vibration and subjective comfort was found in the study. The Pearson correlation coefficient between the vibration on the bicycle paths and the comfort evaluation of the respondents was 0.91, indicating a strong positive correlation between the two variables. This suggests a strong association between the level of vibration experienced by cyclists and their feelings of comfort while cycling.
Figure 13 shows that when the vibration was less than 4, it was reported as “extremely comfortable.” The vibration values between 4 and 10 were regarded as “intermediately comfortable” for the cyclist. Cyclists were not bothered much when the vibration was recorded between 11 and 15 and was considered “neither comfortable nor uncomfortable.” The discomfort for the cyclists started when the vibration levels were above 15. The surfaces with a vibration value of more than 26 were regarded as “extremely uncomfortable”.
This study could provide a bicycle comfort map. As shown in Figure 14, cycling comfortable levels are mapped in the study area. This map was constructed based on user perception and on the vibration values collected by SEE.SENSE since vibration values alone cannot suggest if a pavement portion can provide a comfortable riding experience unless a threshold is defined for comfort. Thus, the opinion of the cyclists is critical to know the perception of vibration and for making a cycling comfort level map.
Eight street sections were selected to conduct the cyclist perception test. Volunteers’ opinions on vibration can be assessed regarding acceptable comfort once the questionnaires they filled out are based on their riding experience on all tested portions. The selected pavement portions have comparable vibration values, and it was more efficient to omit a few of these parts from the test sample without affecting the results’ representativeness. The green color represents comfort, the light green shows a comfortable bicycle path, and the yellow color shows bicycle paths that are neither comfortable nor uncomfortable.
Similarly, extremely uncomfortable bicycle paths are shown in red, while slightly uncomfortable bicycle paths are represented in light red. In order to make the necessary investments to raise the service quality of bicycle pathways, the mapping system enables the concerned authorities to objectively analyze the riding comfort of their road infrastructure.

4.6. Comparison of Results with Root Mean Square Method

Given its widespread use and acceptance, the root mean square (RMS) was chosen as the standard to compare the study results. Since the RMS method has been widely used to measure acceptable vibrations, it is a helpful reference point against other approaches. RMS is a statistical measure for assessing dataset vibration. RMS quantifies bicycle path roughness and cyclist comfort. RMS can be calculated using the following equation (refer to Equation (1)).
RMS = 1 N i = 1 N x i 2
N is the number of vibration values collected, x i is the individual vibration values at a given point. The vibration values were collected with the help of a mobile application called a vibration meter. ISO 2631–1 (International Organization for Standardization., 1997) was used as a reference for inferring quantitative assessment of the RMS values. To compare the results of RMS with this study, the test was conducted on three routes: asphalt, paving slabs, and cobblestone. Table 4 shows the results of the RMS and SEE.SENSE data. The table suggests that the likely user reaction is similar in both methods. Both methods rate the cobblestone-paved bicycle paths as the worst, and the asphalt-paved as the best. In addition, it was possible to see if the scores of the two roughness indices can represent distinct road surfaces and how they respond under different data-gathering settings. The comparison between our approach and RMS allowed us to show that our method could obtain findings that were at least as accurate and dependable as those generated using the traditional and widely accepted method.

4.7. Rider’s Reported Location

Vibration is one of the significant concerns for bicyclists. However, some issues, such as vehicles parked on a bicycle path, slippery bicycle surfaces, visual blockage, etc., can also cause discomfort while riding. The portable SEE.SENSE application can help in identifying such areas of concern for cyclists. The cyclists can mark such a location through the SEE.SENSE app on riders’ smartphones. Once the rider completes their trip, the application sends an automated questionnaire where the rider can point the location of their concern, such as vehicles parked on the bicycle path, closed streets, or blocked sight distance. Figure 15 shows all areas reported by the riders. The actual picture of the site is also shown in Figure 15. This feature can help city planners identify the locations causing concerns to the rider other than higher vibration.

5. Discussion

The study’s main aim was to establish the feasibility of low-cost equipment for assessing bicycle pavement conditions. For this purpose, we used ACE portable bicycle lights developed by SEE.SENSE. The research had three main aspects: to find out the SEE.SENSE portable bicycle light’s accuracy, sensitivity, and consistency to see the usability in bicycle infrastructure assessment; to measure the vibration on the bicycle path; and to utilize the device to create a comfort level map in the study area.

5.1. Sensitivity of SEE.SENSE Device

Two bicycle routes were chosen along the Hasselt Inner Ring (R70) to conduct the sensitivity and accuracy test of the bicycle lights. It was essential to conduct this test to ensure that the device was a reliable tool for detecting vibration on bicycle paths for assessing bicycle infrastructure. We selected two bicycle paths because the objective was to evaluate how sensitive the devices were in two cycling paths before concluding. Six volunteers were involved in conducting the light’s accuracy and sensitivity test. The cyclist was asked to ride the bicycle at varying speeds.
Results have shown that the device (portable bicycle lights) can accurately detect and record the vibration on bicycle paths. On the inner ring bicycle path, the mean vibration of all riders was 3.07, with the others ranging from 2.3 to 2.9. However, the average speed of all cyclists was nearly identical. The highest speed attained by each rider, however, varies. Rider 4 had the highest maximum speed of 25.4 km, while the others were close to 20. The vibration recorded on the bicycle surface did not differ significantly. A similar test was conducted for the outer ring. The results on both paths found no significant variation in vibration readings across numerous runs. This test confirms the device’s reliability for recording vibration on bicycle paths. Hence, using portable SEE.SENSE bicycle lights and matching vibration data with GPS location values is a novel and practical approach to identifying problem areas and informing decision making for infrastructure improvement.

5.2. Vibration on Tested Bicycle Segments

The results of this study also provide important insights into the bicycle pavement conditions that cyclists are exposed to in Hasselt city. The cyclists’ bicycle pavement conditions were analyzed with the involvement of 20 volunteers in collecting data. The use of portable SEE.SENSE bicycle lights to collect vibration data and match it with GPS location values through a smartphone application allowed the identification of specific areas of the bicycle paths and streets that cause the most discomfort to cyclists. The data collected were categorized in GIS for detailed investigation and inference. The categorized vibrational data were then overlaid with satellite imagery in GIS to understand the data better and draw meaningful conclusions. The study results indicate that several areas with possible infrastructure defects or rough surfaces need further investigation. Eleven areas were found to have certain anomalies. Hence, a visual observation was necessary to verify the results on the field.
Additionally, the initial results showed that vibrational values over 24 are concerning and might indicate irregularities in the bicycle path. The two-step approach analysis used in this study allowed for a detailed investigation of such bicycle path sections. The vibration data were divided into three categories to visualize the results. The average vibration values were found to vary from 1 to 17.78, indicating that riding comfort varies significantly across these segments. The results suggest that a rough surface leads to less comfort and more vibration. The highest roughness bicycle segments were primarily located in the city center of Hasselt. The findings support the use of the SEE.SENSE bicycle lights as a reliable tool for evaluating the condition of bicycle paths. This information can be used by transportation agencies, municipalities, and advocacy groups to improve bicycle infrastructure and ensure the safety of cyclists. Additionally, intelligent bicycle lights can help monitor bicycle paths quickly and in short periods.

5.3. Infrastructure Type and Vibration

The study also investigated the correlation between infrastructure type and bicycle vibration. The research findings indicated a clear relationship between the type of cycling surface and the level of vibration experienced by the rider. Cobblestone surfaces were found to cause the highest vibration, while asphalt- and concrete-paved bicycle paths were the smoothest. These findings are consistent with previous studies that have reported similar results [22,25,69]. Hölzel et al. (2012) researched the effects of four different road surfaces, suggesting that vertical acceleration on asphalt surfaces is the lowest, while it is the highest in cobblestone-paved bicycle paths [26]. The findings highlight the importance of considering the type of infrastructure when designing bike lanes and paths, as different surfaces can significantly impact cyclists’ comfort. The results of this study can be used to inform concerned authorities of the development of user-friendly bicycle infrastructure and encourage more people to adopt cycling as a mode of transportation.

5.4. Correlation between Speed and Vibration

A correlation between speed and vibration was also studied. The results indicated a negative and low correlation between the two variables, with vibration slightly decreasing as speed increases. Previous studies have suggested an almost linear relationship between the two variables [19,25]. Olieman et al. (2012) found that as speed increases, so do the vibrations and accelerations experienced by the cyclist. Generally, there is an approximately proportional relationship between speed and roughness index, meaning that higher speeds result in rougher rides and more significant discomfort for cyclists [48]. Our results showed that this relationship is not always linear. The results revealed that riders tend to slow down when faced with rough pavement and cycle at higher speeds on smoother surfaces. The findings suggest that the quality of the bike path surface is an essential factor influencing cycling speed and comfort and, therefore, should be a key consideration in the development of bike infrastructure.

5.5. Cyclist Perception of Cycling Vibration on Tested Segment

We also explored the opinion of cyclists on vibration in terms of acceptable comfort by evaluating data from questionnaires filled out by volunteers based on their cycling experience on tested segments. The results showed that when the vibration was lower than 4, it was reported as “extremely comfortable,” whereas values between 4 and 10 were regarded as “intermediately comfortable.” Vibration levels between 11 and 15 were considered “neither comfortable nor uncomfortable,” and discomfort for the cyclists started when the vibration levels were above 15. Surfaces with a vibration value of more than 26 were regarded as “extremely uncomfortable”. The results helped develop a cycling comfort level map for the study area. Previous studies have also suggested that the cyclists’ comfort decreases as the level of vibration increases. For example, Gao et al. (2014) suggested that cycling comfort is inversely proportional to the level of vibration experienced by cyclists [28]. Similarly, Bíl et al. (2015) also reported a strong correlation between the objectively measured values and the subjectively assessed evaluations of cycling comfort [25]. Knowing the cyclist’s perception of vibration and the relationship between vibration levels and comfort provides valuable insights for planners and designers. The results emphasize the importance of considering the rider’s experience when designing bike paths.

6. Conclusions and Recommendations

Cycling tracks of low quality and general on-road or off-road cycling amenities may deter cyclists from using them [42]. Previously, methods were available for assessing the bicycle infrastructure based on vibration. However, traditional methods, such as direct visual inspection, are time-consuming, restricted by the surveying engineer’s walking speed, or involve technical knowledge [41]. In addition, these might produce biased results [40]. Other methods, e.g., modern probe bicycles, as sophisticated profilers or IPBs, require specialized measurement equipment, are too costly, and require expert operators, making them relatively difficult to replicate [25]. Hence, a simple, transferrable, and objective method for bicycle vibration mapping is needed [25]. This research proposed a viable, low-cost, practical method for assessing cycling infrastructure based on portable bicycle lights.
The instrument (ACE SEE.SENSE portable bicycle lights) was tested for its accuracy and sensitivity on two bicycle routes before collecting the data. The results showed no significant difference in the data over multiple runs involving multiple cyclists. Then, the study examined the connection between vibration and various forms of cycling infrastructure or common bicycle routes. The vibration data and GPS data were integrated and imported into GIS for analysis. Experiments using accurate data obtained on test routes indicate surface-type impact bicycle vibrations. The results indicated smooth pavement creates less vibration than unpaved or broken surfaces. The most pleasant surface was asphalt pavements, with average vibration values of less than 4.
On the other hand, the cobblestone-paved bicycle paths had the highest vibration values above 15. The vibration scores of the 28 bicycle paths and streets in the study area values vary from 1 to 17.78, indicating that riding comfort varies significantly across these segments. A Pearson correlation test was conducted for speed and vibration, showing that the two variables were negative and lowly (r = −0.150, p < 0.001) correlated. The vibration slightly decreases with an increase in speed. Afterward, the opinions of cyclists on vibration were assessed regarding acceptable comfort. User perception indicated that a bicycle surface feels extremely comfortable when the vibration is less than 4. As the vibration rises, the bicycle path’s comfort decreases, as verified by previous researchers [25,28,35]. The discomfort for the cyclists started when the vibration levels were above 15. The surfaces with a vibration of more than 26 were considered “extremely uncomfortable”. The vibration data collected from the device and the cyclist’s perception helped develop a bicycle comfort leveling mapping.
SEE. SENSE’s ability to monitor and revisit specific infrastructure lengths more frequently may provide a fuller picture of surface deterioration, allowing for a preventative maintenance strategy based on accurate and up-to-date data. The suggested technology may be merged as an inventory in a single GIS database, where physical attributes, construction and maintenance activity times, and general information are all maintained. The ability of portable lights to link GPS location with vibration data can aid in creating a road network database related to cycling comfort. Additionally, it can provide transport planners and road authorities with easy-to-follow, evidence-based guidelines for monitoring pavement quality and improving cycling experiences on urban roads. This can be achieved since the study developed a methodology that could assess the comfort level based on vibration and perception of vibration to evaluate the quality of cycling infrastructure. Thus, by mapping the comfort level, it is possible to identify and prioritize the areas that need improvement in construction and monitoring. Additionally, implementing this framework on a larger scale would further validate the results. Subsequently, it would enable a more accurate classification system for roads based on their vibration levels, leading to standardization and the potential creation of guidelines.
We tested the portable bicycle lights only on regular bikes. It will be interesting to observe the results considering other types of bikes, such as electric, mountain, or racing. In addition, the study did not consider other factors that can influence the relationship between cycling comfort and vibration, including tire type, the weight of the rider, and riding posture. Future studies could employ this approach for a broader sample of people, considering user characteristics, gender, age, and type of bicycle. In addition, cyclists’ comfort is also tied to environmental factors such as lightning, greenery, obstacles on bicycle paths, and the specific qualities (of the vehicle and the infrastructure). Hence, knowing these variables’ impact on bicyclist comfort and vibration would be helpful.

Author Contributions

Conceptualization, T.A., A.P., D.J. and G.W.; Data curation, A.P. and D.J.; Formal analysis, T.A.; Investigation, T.A.; Methodology, T.A., A.P. and D.J.; Resources, A.P., D.J. and G.W.; Software, T.A.; Supervision, A.P., D.J. and G.W.; Validation, A.P. and D.J.; Visualization, T.A.; Writing—original draft, T.A.; Writing—review and editing, A.P. and D.J. All authors have read and agreed to the published version of the manuscript.

Funding

This research received no external funding.

Institutional Review Board Statement

Not applicable.

Informed Consent Statement

Not applicable.

Data Availability Statement

The datasets are available from the corresponding author upon request.

Acknowledgments

The authors thank Irene McAleese, Philip McAleese, and Rachael Irwin for providing SEE.SENSE ACE bicycle lights for data collection. We also thank them for providing the data collected through the device.

Conflicts of Interest

The authors declare no conflict of interest.

References

  1. Ahmed, T.; Moeinaddini, M.; Almoshaogeh, M.; Jamal, A.; Nawaz, I.; Alharbi, F. A New Pedestrian Crossing Level of Service (Pclos) Method for Promoting Safe Pedestrian Crossing in Urban Areas. Int. J. Environ. Res. Public Health 2021, 18, 8813. [Google Scholar] [CrossRef] [PubMed]
  2. Zhu, S.; Zhu, F. Cycling Comfort Evaluation with Instrumented Probe Bicycle. Transp. Res. Part A Policy Pract. 2019, 129, 217–231. [Google Scholar] [CrossRef]
  3. Asadi-Shekari, Z.; Moeinaddini, M.; Zaly Shah, M. A Bicycle Safety Index for Evaluating Urban Street Facilities. Traffic Inj. Prev. 2015, 16, 283–288. [Google Scholar] [CrossRef]
  4. Asadi-shekari, Z.; Moeinaddini, M.; Zaly, M. Non-Motorised Level of Service: Addressing Challenges in Pedestrian and Bicycle Level of Service. Transp. Rev. A Transnatl. Transdiscipl. J. 2013, 33, 166–194. [Google Scholar] [CrossRef]
  5. Lowry, M.B.; Furth, P.; Hadden-Loh, T. Prioritizing New Bicycle Facilities to Improve Low-Stress Network Connectivity. Transp. Res. Part A Policy Pract. 2016, 86, 124–140. [Google Scholar] [CrossRef]
  6. Hardinghaus, M.; Nieland, S.; Lehne, M.; Weschke, J. Article More than Bike Lanes—A Multifactorial Index of Urban Bikeability. Sustainability 2021, 13, 11584. [Google Scholar] [CrossRef]
  7. Melis, G.; Masala, E.; Tabasso, M. From the Smart City to the People-Friendly City: Usability of Tools and Data in Urban Planning. In Handbook of Research on Social, Economic, and Environmental Sustainability in the Development of Smart Cities; IGI Global: Hershey, PA, USA, 2015; pp. 363–381. [Google Scholar]
  8. Zefreh, M.M.; Esztergar-Kiss, D.; Torok, A. Implications of Different Road Pricing Schemes in Urban Areas: A Case Study for Budapest. Proc. Inst. Civ. Eng.—Transp. 2021, 174, 407–418. [Google Scholar] [CrossRef]
  9. Nuñez, J.Y.M.; Bisconsini, D.R.; Rodrigues da Silva, A.N. Combining Environmental Quality Assessment of Bicycle Infrastructures with Vertical Acceleration Measurements. Transp. Res. Part A Policy Pract. 2020, 137, 447–458. [Google Scholar] [CrossRef]
  10. Beura, S.K.; Bhuyan, P.K. Development of a Bicycle Level of Service Model for Urban Street Segments in Mid-Sized Cities Carrying Heterogeneous Traffic: A Functional Networks Approach. J. Traffic Transp. Eng. Engl. Ed. 2017, 4, 503–521. [Google Scholar] [CrossRef]
  11. Matcha, B.N.; Sivanesan, S.; Ng, K.C. Modelling Road Traffic Congestion at Urban Merge Section under Mixed Traffic Conditions. In Proceedings of the Institution of Civil Engineers-Transport; Thomas Telford Ltd.: London, UK, 2021; pp. 1–17. [Google Scholar] [CrossRef]
  12. Cafiso, S.; Di Graziano, A.; Marchetta, V.; Pappalardo, G. Urban Road Pavements Monitoring and Assessment Using Bike and E-Scooter as Probe Vehicles. Case Stud. Constr. Mater. 2022, 16, e00889. [Google Scholar] [CrossRef]
  13. Li, Z.; Wang, W.; Liu, P.; Schneider, R.; Ragland, D.R. Investigating Bicyclists’ Perception of Comfort on Physically Separated Bicycle Paths in Nanjing, China. Transp. Res. Rec. 2012, 2317, 76–84. [Google Scholar] [CrossRef]
  14. Pojani, D.; Bakija, D.; Shkreli, E.; Corcoran, J.; Mateo-Babiano, I. Do Northwestern and Southeastern Europe Share a Common “Cycling Mindset”? Comparative Analysis of Beliefs toward Cycling in the Netherlands and the Balkans. Eur. J. Transp. Infrastruct. Res. 2017, 17, 25–45. [Google Scholar] [CrossRef]
  15. Li, Z.; Wang, W.; Liu, P.; Ragland, D.R. Physical Environments Influencing Bicyclists’ Perception of Comfort on Separated and on-Street Bicycle Facilities. Transp. Res. Part D 2012, 17, 256–261. [Google Scholar] [CrossRef]
  16. Zuo, T.; Wei, H. Bikeway Prioritization to Increase Bicycle Network Connectivity and Bicycle-Transit Connection: A Multi-Criteria Decision Analysis Approach. Transp. Res. Part A Policy Pract. 2019, 129, 52–71. [Google Scholar] [CrossRef]
  17. Schmid-Querg, J.; Keler, A.; Grigoropoulos, G. The Munich Bikeability Index: A Practical Approach for Measuring Urban Bikeability. Sustainability 2021, 13, 428. [Google Scholar] [CrossRef]
  18. Jain, H.; Tiwari, G.; Zuidgeest, M.H. P Evaluating Bicyclists Comfort and Safety Perception. In Proceedings of the 12th World Conference for Transportation Research, Lisbon, Portugal, 11–15 July 2010; pp. 1–19. [Google Scholar]
  19. Wage, O.; Feuerhake, U.; Koetsier, C.; Ponick, A.; Schild, N.; Beening, T.; Dare, S. Ride Vibrations: Towards Comfort-Based Bicycle Navigation. Int. Arch. Photogramm. Remote Sens. Spatial Inf. Sci. 2020, 43, 367–373. [Google Scholar] [CrossRef]
  20. Beura, S.K.; Bhuyan, P.K. Development of Artificial Intelligence-Based Bicycle Level of Service Models for Urban Street Segments. Int. J. Intell. Transp. Syst. Res. 2021, 20, 142–156. [Google Scholar] [CrossRef]
  21. Van Petegem, J.H.; Schepers, P.; Wijlhuizen, G.J. The Safety of Physically Separated Cycle Tracks Compared to Marked Cycle Lanes and Mixed Traffic Conditions in Amsterdam. Eur. J. Transp. Infrastruct. Res. 2021, 21, 19–37. [Google Scholar] [CrossRef]
  22. Hardinghaus, M.; Papantoniou, P. Evaluating Cyclists’ Route Preferences with Respect to Infrastructure. Sustainability 2020, 12, 3375. [Google Scholar] [CrossRef] [Green Version]
  23. Wang, P.; Yan, X.; Gao, Z. Vehicle Counting and Traffic Flow Analysis with UAV by Low Rank Representation. In Proceedings of the 2017 IEEE International Conference on Robotics and Biomimetics (ROBIO), Macau, Macao, 5–8 December 2017; pp. 1401–1405. [Google Scholar] [CrossRef]
  24. Osman, S.A.; Almoshaogeh, M.; Jamal, A.; Alharbi, F.; Al Mojil, A.; Dalhat, M.A. Intelligent Assessment of Pavement Condition Indices Using Artificial Neural Networks. Sustainability 2023, 15, 561. [Google Scholar] [CrossRef]
  25. Bíl, M.; Andrášik, R.; Kubeček, J. How Comfortable Are Your Cycling Tracks? A New Method for Objective Bicycle Vibration Measurement. Transp. Res. Part C Emerg. Technol. 2015, 56, 415–425. [Google Scholar] [CrossRef]
  26. Hölzel, C.; Höchtl, F.; Senner, V. Cycling Comfort on Different Road Surfaces. Procedia Eng. 2012, 34, 479–484. [Google Scholar] [CrossRef] [Green Version]
  27. Miah, S.; Kaparias, I.; Ayub, N.; Milonidis, E.; Holmes, W. Measuring Cycle Riding Comfort in Southampton Using an Instrumented Bicycle. In Proceedings of the 6th International Conference on Models and Technologies for Intelligent Transportation Systems, Cracow, Poland, 5–7 June 2019. [Google Scholar]
  28. Gao, J.; Sha, A.; Huang, Y.; Hu, L.; Tong, Z.; Jiang, W. Evaluating the Cycling Comfort on Urban Roads Based on Cyclists’ Perception of Vibration. J. Clean. Prod. 2018, 192, 531–541. [Google Scholar] [CrossRef]
  29. Menghini, G.; Carrasco, N.; Schüssler, N.; Axhausen, K.W. Route Choice of Cyclists in Zurich. Transp. Res. Part A Policy Pract. 2010, 44, 754–765. [Google Scholar] [CrossRef]
  30. Pomoni, M. Exploring Smart Tires as a Tool to Assist Safe Driving and Monitor Tire–Road Friction. Vehicles 2022, 4, 744–765. [Google Scholar] [CrossRef]
  31. Hull, A.; O’Holleran, C. Bicycle Infrastructure: Can Good Design Encourage Cycling? Urban Plan. Transp. Res. 2014, 2, 369–406. [Google Scholar] [CrossRef] [Green Version]
  32. Gogola, M. Analysing the Vibration of Bicycles on Various Road Surfaces in the City of Žilina. Arch. Motoryz. 2020, 88, 77–97. [Google Scholar] [CrossRef]
  33. Bernardi, S.; Rupi, F. An Analysis of Bicycle Travel Speed and Disturbances on Off-Street and on-Street Facilities. Transp. Res. Procedia 2015, 5, 82–94. [Google Scholar] [CrossRef] [Green Version]
  34. Rybarczyk, G.; Wu, C. Bicycle Facility Planning Using GIS and Multi-Criteria Decision Analysis. Appl. Geogr. 2010, 30, 282–293. [Google Scholar] [CrossRef]
  35. Calvey, J.C.; Shackleton, J.P.; Taylor, M.D.; Llewellyn, R. Engineering Condition Assessment of Cycling Infrastructure: Cyclists’ Perceptions of Satisfaction and Comfort. Transp. Res. Part A Policy Pract. 2015, 78, 134–143. [Google Scholar] [CrossRef]
  36. Giubilato, F.; Petrone, N. A Method for Evaluating the Vibrational Response of Racing Bicycles Wheels under Road Roughness Excitation. Procedia Eng. 2012, 34, 409–414. [Google Scholar] [CrossRef]
  37. Wolniak, R. Analysis of the Bicycle Roads System as an Element of a Smart Mobility on the Example of Poland Provinces. Smart Cities 2023, 6, 368–391. [Google Scholar] [CrossRef]
  38. Winters, M.; Zanotto, M.; Butler, G. The Canadian Bikeway Comfort and Safety (Can-Bics) Classification System: A Common Naming Convention for Cycling Infrastructure. Health Promot. Chronic Dis. Prev. Can. 2020, 40, 288–293. [Google Scholar] [CrossRef] [PubMed]
  39. SEE.SENSE. Sense Road Surface Monitoring Capability; SEE.SENSE: Newtownards, UK, 2019. [Google Scholar]
  40. Asadi-Shekari, Z.; Moeinaddini, M.; Aghaabbasi, M.; Cools, M.; Zaly Shah, M. Exploring Effective Micro-Level Items for Evaluating Inclusive Walking Facilities on Urban Streets (Applied in Johor Bahru, Malaysia). Sustain. Cities Soc. 2019, 49, 101563. [Google Scholar] [CrossRef]
  41. Heinen, E.; van Wee, B.; Maat, K. Commuting by Bicycle: An Overview of the Literature. Transp. Rev. 2010, 30, 59–96. [Google Scholar] [CrossRef]
  42. Aghaabbasi, M.; Moeinaddini, M.; Shah, M.Z.; Asadi-shekari, Z. Addressing Issues in the Use of Google Tools for Assessing Pedestrian Built Environments. J. Transp. Geogr. 2018, 73, 185–198. [Google Scholar] [CrossRef]
  43. Labdaoui, K.; Mazouz, S.; Moeinaddini, M.; Cools, M.; Teller, J. The Street Walkability and Thermal Comfort Index (SWTCI): A New Assessment Tool Combining Street Design Measurements and Thermal Comfort. Sci. Total Environ. 2021, 795, 148663. [Google Scholar] [CrossRef]
  44. Joo, S.; Oh, C. A Novel Method to Monitor Bicycling Environments. Transp. Res. Part A Policy Pract. 2013, 54, 1–13. [Google Scholar] [CrossRef]
  45. Joo, S.; Oh, C.; Jeong, E.; Lee, G. Categorizing Bicycling Environments Using GPS-Based Public Bicycle Speed Data. Transp. Res. Part C Emerg. Technol. 2015, 56, 239–250. [Google Scholar] [CrossRef]
  46. Torbic, D.; Elefteriadou, L.; El-Gindy, M. Methodology for Evaluating Impacts of Rumble Strips on Bicyclists. In Proceedings of the Transportation Research Board 82nd Annual Meeting, Washington, DC, USA, 12–16 January 2003; Transportation Research Board of the National Academies: Washington, DC, USA, 2003; p. 24. [Google Scholar]
  47. Litzenberger, S.; Christensen, T.; Hofstätter, O.; Sabo, A. Prediction of Road Surface Quality during Cycling Using Smartphone Accelerometer Data. Proceedings 2018, 2, 217. [Google Scholar] [CrossRef] [Green Version]
  48. Olieman, M.; Marin-Perianu, R.; Marin-Perianu, M. Measurement of Dynamic Comfort in Cycling Using Wireless Acceleration Sensors. Procedia Eng. 2012, 34, 568–573. [Google Scholar] [CrossRef] [Green Version]
  49. Gemne, G.; Taylor, W. Hand-Arm Vibration and the Central Autonomic Nervous System: A Special Volume of Journal of Low Frequency Noise & Vibration; Multi-Science: Kent, UK, 1983. [Google Scholar]
  50. Griffin, M.J.; Bovenzi, M. The Diagnosis of Disorders Caused by Hand-Transmitted Vibration: Southampton Workshop 2000. Int. Arch. Occup. Environ. Health 2002, 75, 1–5. [Google Scholar] [CrossRef] [PubMed]
  51. Vanwalleghem, J.; Mortier, F.; De Baere, I.; Loccufier, M.; Van Paepegem, W. Design of an Instrumented Bicycle for the Evaluation of Bicycle Dynamics and Its Relation with the Cyclist’s Comfort. Procedia Eng. 2012, 34, 485–490. [Google Scholar] [CrossRef]
  52. Labdaoui, K.; Mazouz, S.; Acidi, A.; Cools, M.; Moeinaddini, M.; Teller, J. Utilizing Thermal Comfort and Walking Facilities to Propose a Comfort Walkability Index (CWI) at the Neighbourhood Level. Build. Environ. 2021, 193, 107627. [Google Scholar] [CrossRef]
  53. Dixon, L.B. Bicycle and Pedestrian Level-of-Service Performance Measures and Standards for Congestion Management Systems. Transp. Res. Rec. 1996, 1538, 1–9. [Google Scholar] [CrossRef]
  54. Kazemzadeh, K.; Laureshyn, A.; Hiselius, L.W.; Ronchi, E. Expanding the Scope of the Bicycle Level-of-Service Concept: A Review of the Literature. Sustainability 2020, 12, 2944. [Google Scholar] [CrossRef] [Green Version]
  55. Castañon, U.N.; Ribeiro, P.J.G. Bikeability and Emerging Phenomena in Cycling: Exploratory Analysis and Review. Sustainability 2021, 13, 2394. [Google Scholar] [CrossRef]
  56. Ivanjko, E.; Kušić, K.; Gregurić, M. Simulational Analysis of Two Controllers for Variable Speed Limit Control. Proc. Inst. Civ. Eng.—Transp. 2022, 175, 413–425. [Google Scholar] [CrossRef] [Green Version]
  57. Levenberg, E. Estimating Vehicle Speed with Embedded Inertial Sensors. Transp. Res. Part C Emerg. Technol. 2014, 46, 300–308. [Google Scholar] [CrossRef]
  58. Feizi, A.; Oh, J.S.; Kwigizile, V.; Joo, S. Cycling Environment Analysis by Bicyclists’ Skill Levels Using Instrumented Probe Bicycle (IPB). Int. J. Sustain. Transp. 2019, 14, 722–732. [Google Scholar] [CrossRef]
  59. Feizi, A.; Joo, S.; Kwigizile, V.; Oh, J.-S. Analysis of Bicycle Environment Using Instrumented Probe Bicycle. J. Transp. Health 2018, 9, S32. [Google Scholar] [CrossRef]
  60. Mason, G.; Larson, M.; Deng, R.; Reed, D.; Pahlmeyer, M.; Wright, N.; Wu, Z.P.; Yahata, J. A Robust Low Cost Device for Measuring Road Induced Vibrations. J. Sci. Cycl. 2016, 5, 13–17. [Google Scholar]
  61. Castells-Graells, D.; Salahub, C.; Pournaras, E. On Cycling Risk and Discomfort: Urban Safety Mapping and Bike Route Recommendations. Computing 2020, 102, 1259–1274. [Google Scholar] [CrossRef] [Green Version]
  62. Ul-Abdin, Z.; De Backer, H.; De Winne, P.; Rajper, S.Z. Ride Quality for Bicycle Paths under Different Pavement Conditions; American Society of Civil Engineers: Reston, VA, USA, 2018. [Google Scholar]
  63. Esri, R. ArcGIS Desktop: Release 10; Environmental Systems Research Institute (ESRI): Redlands, CA, USA, 2011. [Google Scholar]
  64. Zahid, M.; Chen, Y.; Khan, S.; Jamal, A.; Ijaz, M.; Ahmed, T. Predicting Risky and Aggressive Driving Behavior among Taxi Drivers: Do Spatio-Temporal Attributes Matter? Int. J. Environ. Res. Public Health 2020, 17, 3937. [Google Scholar] [CrossRef] [PubMed]
  65. Al-Ahmadi, H.M.; Jamal, A.; Ahmed, T.; Rahman, M.T.; Reza, I.; Farooq, D. Calibrating the Highway Safety Manual Predictive Models for Multilane Rural Highway Segments in Saudi Arabia. Arab. J. Sci. Eng. 2021, 46, 11471–11485. [Google Scholar] [CrossRef]
  66. Milakis, D.; Athanasopoulos, K. What about People in Cycle Network Planning? Applying Participative Multicriteria GIS Analysis in the Case of the Athens Metropolitan Cycle Network. J. Transp. Geogr. 2014, 35, 120–129. [Google Scholar] [CrossRef]
  67. Zahid, M.; Jamal, A.; Chen, Y.; Ahmed, T.; Ijaz, M. Predicting Red Light Running Violation Using Machine Learning Classifiers BT—Green Connected Automated Transportation and Safety; Wang, W., Chen, Y., He, Z., Jiang, X., Eds.; Springer: Singapore, 2022; pp. 137–148. [Google Scholar]
  68. Kenniscentrum Voor Het Fietsbeleid in Vlaanderen Fiets DNA. 2020. Available online: https://fietsberaad.be/documenten/fietsdna2020/ (accessed on 14 November 2022).
  69. Li, H.; Harvey, J.T.; Thigpen, C.; Wu, R. Surface Treatment Macrotexture and Bicycle Ride Quality; Research Report UCPRC-RR-2013-07; University of California Pavement Research Center: Davis, CA, USA, 2013. [Google Scholar]
Figure 1. Study area map.
Sustainability 15 04495 g001
Figure 2. Example of asphalt, cobblestone, and concrete paved cycling streets (left to right).
Sustainability 15 04495 g002
Figure 3. Study flowchart.
Sustainability 15 04495 g003
Figure 4. SEE.SENSE portable bicycle lights installed on bicycle.
Sustainability 15 04495 g004
Figure 5. Inner ring bicycle paths.
Sustainability 15 04495 g005
Figure 6. Vibration on bicycle paths.
Sustainability 15 04495 g006
Figure 7. Problematic areas.
Sustainability 15 04495 g007
Figure 8. Photographic representation of the bicycle street with high vibration.
Sustainability 15 04495 g008
Figure 9. Photographic representation of the bicycle street with low vibration.
Sustainability 15 04495 g009
Figure 10. Vibration plots for various bicycle surface types.
Sustainability 15 04495 g010
Figure 11. Bicycle pavement type and average vibration.
Sustainability 15 04495 g011
Figure 12. Speed and vibration correlation.
Sustainability 15 04495 g012
Figure 13. Vibration and likely user reaction.
Sustainability 15 04495 g013
Figure 14. Cycling comfort level map.
Sustainability 15 04495 g014
Figure 15. Rider’s reported location of concern.
Sustainability 15 04495 g015
Table 1. Descriptive statistics of bicycle path (R70).
Inner Bicycle Path (R70)
Run Maximum Vibration ValueMean Vibration ValueStandard Deviation of VibrationMean Speed (km/h)Max Speed (km/h)
1493.074.1215.6220.3
2312.984.0115.6421.1
3512.904.5515.8020.7
4362.654.0115.725.4
5372.623.9216.119.9
6322.393.3715.3620.2
Outer bicycle path (R70)
1373.084.2613.3123.8
2433.424.9112.922.3
3372.643.9513.323.8
4372.614.0114.2221.18
5372.563.813.3423.82
6432.814.3412.8222.40
Table 2. Cycling vibration of each tested road section.
Street Section IDAS-1AS-2AS-3AS-4
Average Vibration2.572.483.713.89
Infrastructure TypeAsphaltAsphaltAsphaltAsphalt
Street Section IDAS-5AS-6AS-7AS-8
Average Vibration3.594.067.51
Infrastructure TypeAsphaltAsphaltAsphaltAsphalt
Street Section IDAS-9PS-1PS-2PS-3
Average Vibration1.638.004.2510.06
Infrastructure TypeAsphaltPaving slabsPaving slabsPaving slabs
Street Section IDPS-4PS-5PS-6CS-1
Average Vibration3.33.723.2217.78
Infrastructure TypePaving slabsPaving slabsPaving slabsCobblestone
Street Section IDCS-2CS-3CS-4CS-5
Average Vibration14.151917.410.7
Infrastructure TypeCobblestoneCobblestoneCobblestoneCobblestone
Street Section IDCO-1CO-2SPS-1SPS-2
Average Vibration5.823.075.476.48
Infrastructure TypeConcreteConcreteSmall paving slabsSmall paving elements/slabs
Street Section IDM-1M-2M-3M-4
Average Vibration14.0913.0610.95.50
Infrastructure TypeMixed (small paving slabs and cobblestone)Mixed (asphalt and cobblestone)Mixed (asphalt and cobblestone)Mixed (asphalt and paving slabs)
Table 3. Post hoc Tukey method for vibration on different types of pavement.
Multiple Comparisons
Tukey HSD
(I) Infrastructure Type(J) Infra_typeMean Difference (I-J)Std. ErrorSig.95% Confidence Interval
Lower BoundUpper Bound
AsphaltConcrete−3.215001.284340.114−6.91950.4895
Small paving slabs−6.90250 *1.28434<0.001−10.6070−3.1980
Paving slabs−9.87857 *1.31916<0.001−13.6834−6.0737
Cobblestone−14.56800 *1.23396<0.001−18.1271−11.0089
ConcreteAsphalt3.215001.284340.114−0.48956.9195
Small paving slabs−3.68750 *1.126440.020−6.9365−0.4385
Paving slabs−6.66357 *1.16598<0.001−10.0266−3.3005
Cobblestone−11.35300 *1.06864<0.001−14.4353−8.2707
Small paving slabsAsphalt6.90250 *1.28434<0.0013.198010.6070
Concrete3.68750 *1.126440.0200.43856.9365
Paving slabs−2.976071.165980.103−6.33910.3870
Cobblestone−7.66550 *1.06864<0.001−10.7478−4.5832
Paving slabsAsphalt9.87857 *1.31916<0.0016.073713.6834
Concrete6.66357 *1.16598<0.0013.300510.0266
Small paving slabs2.976071.165980.103−0.38706.3391
Cobblestone−4.68943 *1.110240.002−7.8917−1.4872
CobblestoneAsphalt14.56800 *1.23396<0.00111.008918.1271
Concrete11.35300 *1.06864<0.0018.270714.4353
Small paving slabs7.66550 *1.06864<0.0014.583210.7478
Paving slabs4.68943 *1.110240.0021.48727.8917
* The mean difference is significant at the 0.05 level.
Table 4. Comparison of comfort assessment on different bicycle pavement types using RMS and SEE.SENSE.
Section IDPavement TypeRMS ValuesUser Reaction (ISO 2631–1)SEE.SENSE ValuesUser Reaction
AS-1Asphalt0.302Not uncomfortable2.57Extremely comfortable
PS-1Paving slab0.61A little uncomfortable8.00Somewhat comfortable
CS-1Cobblestone2.43Very uncomfortable17.78Extremely uncomfortable
Disclaimer/Publisher’s Note: The statements, opinions and data contained in all publications are solely those of the individual author(s) and contributor(s) and not of MDPI and/or the editor(s). MDPI and/or the editor(s) disclaim responsibility for any injury to people or property resulting from any ideas, methods, instructions or products referred to in the content.

