
Development of Sustainable Magnetic Biosorbent Using Aqueous Leaf Extract of Vallesia glabra for Methylene Blue Removal from Wastewater

 , ,
, ,  , and
, and
Abstract
:1. Introduction
2. Materials and Methods
2.1. Materials
2.2. Vg Extract Preparation
2.3. Phytochemical Screening
2.4. Preparation of Magnetic NP Adsorbent
2.5. Characterization of Magnetic NPs
2.5.1. Fourier Transform Infrared Spectroscopy (FTIR)
2.5.2. Powder X-ray Diffractometry (XRD)
2.5.3. Vibration Sample Magnetometer (VSM)
2.5.4. X-ray Photoelectron Spectroscopy (XPS)
2.5.5. Scanning Electron Microscopy (SEM)
2.6. Batch Sorption Experiments
2.7. Adsorption Isotherm Test
2.8. The Kinetic Study of the Adsorption of MB
2.9. Desorption and Regeneration Studies
3. Results and Discussion
3.1. Characterization of Magnetic NPs
3.1.1. FTIR Spectroscopy
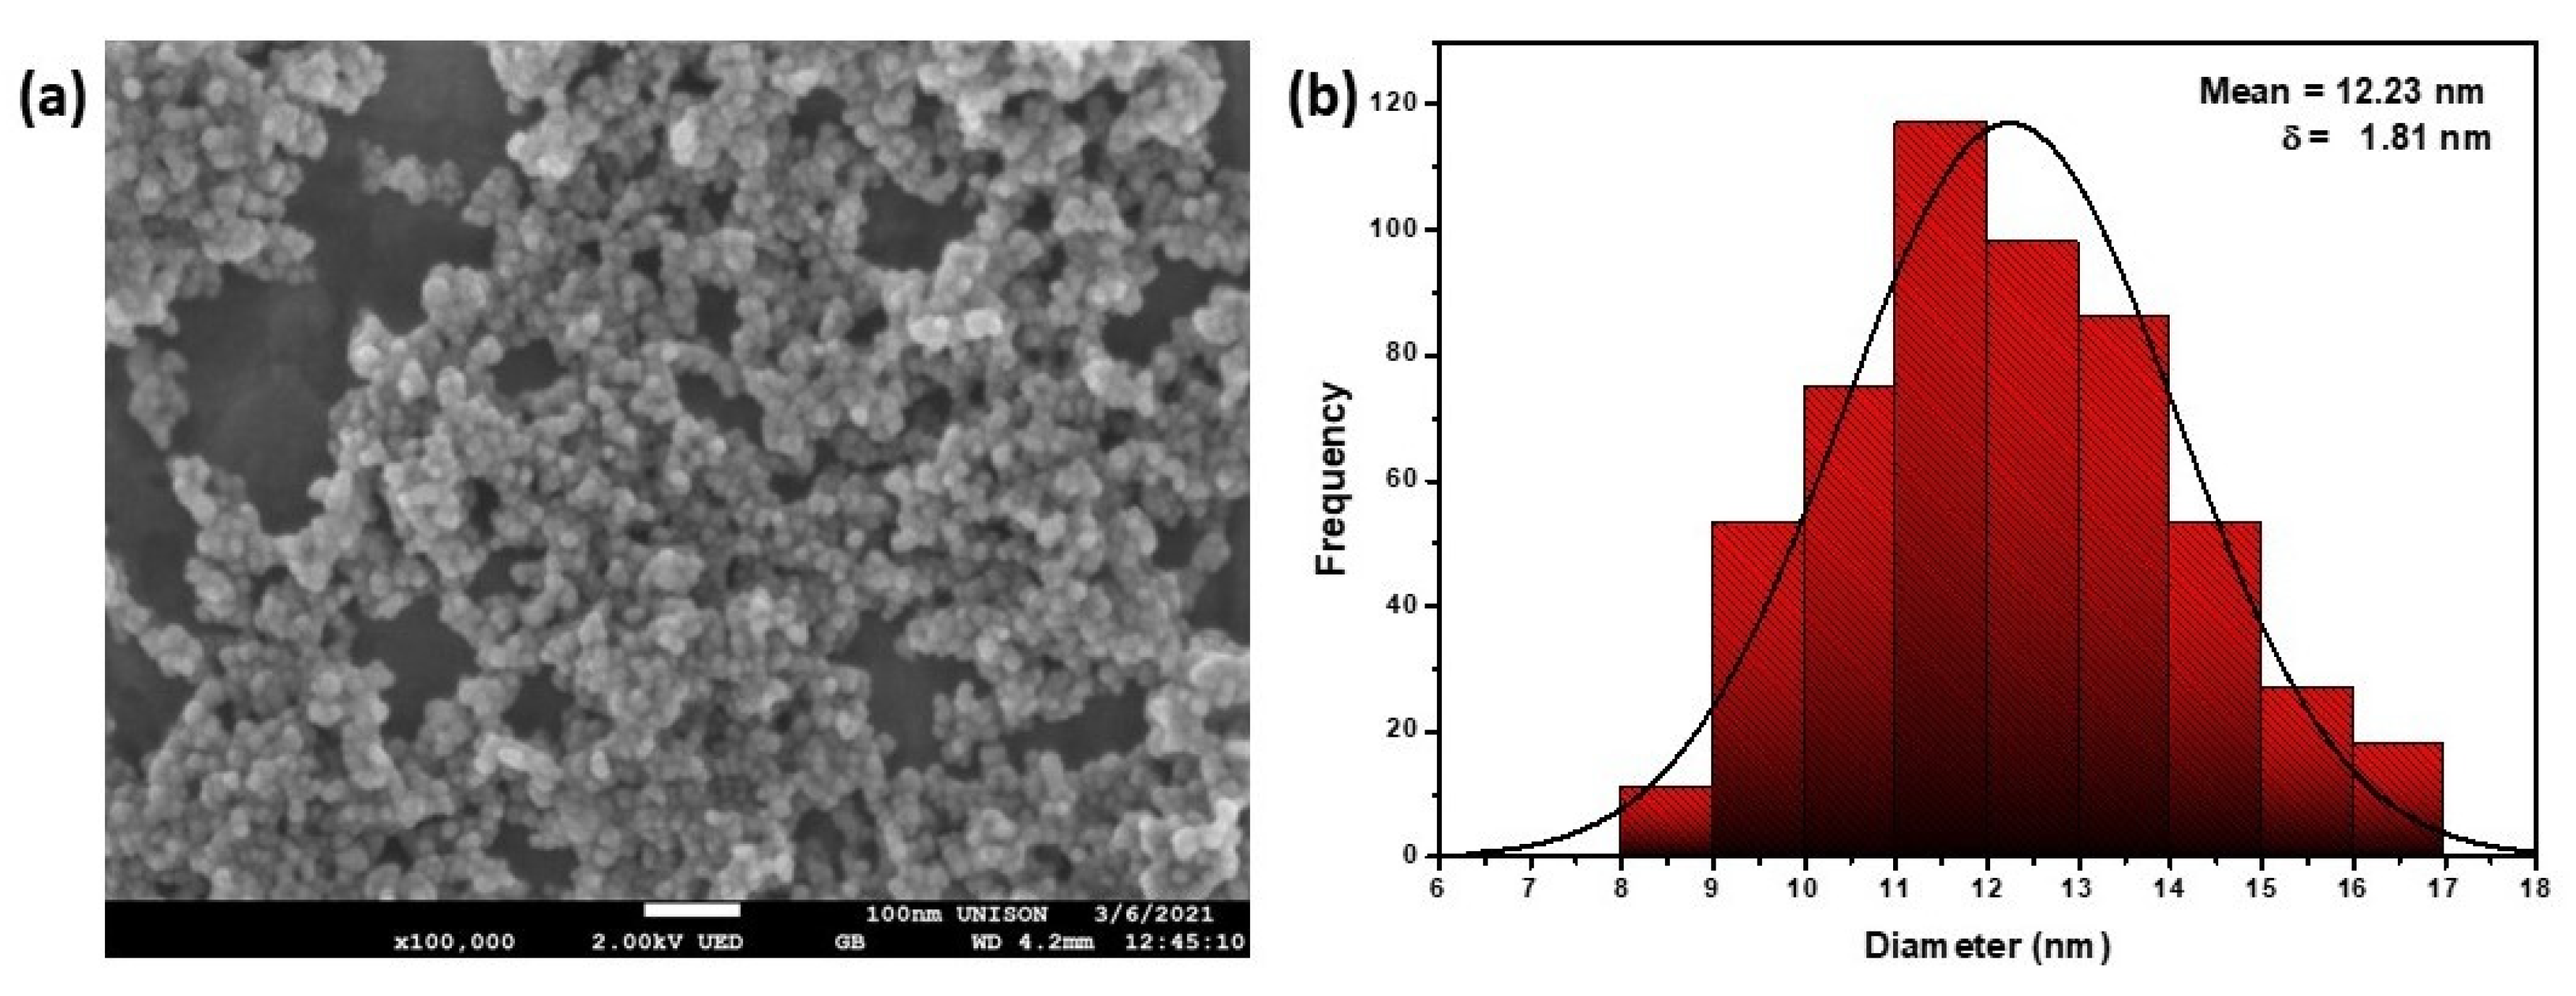
3.1.2. SEM
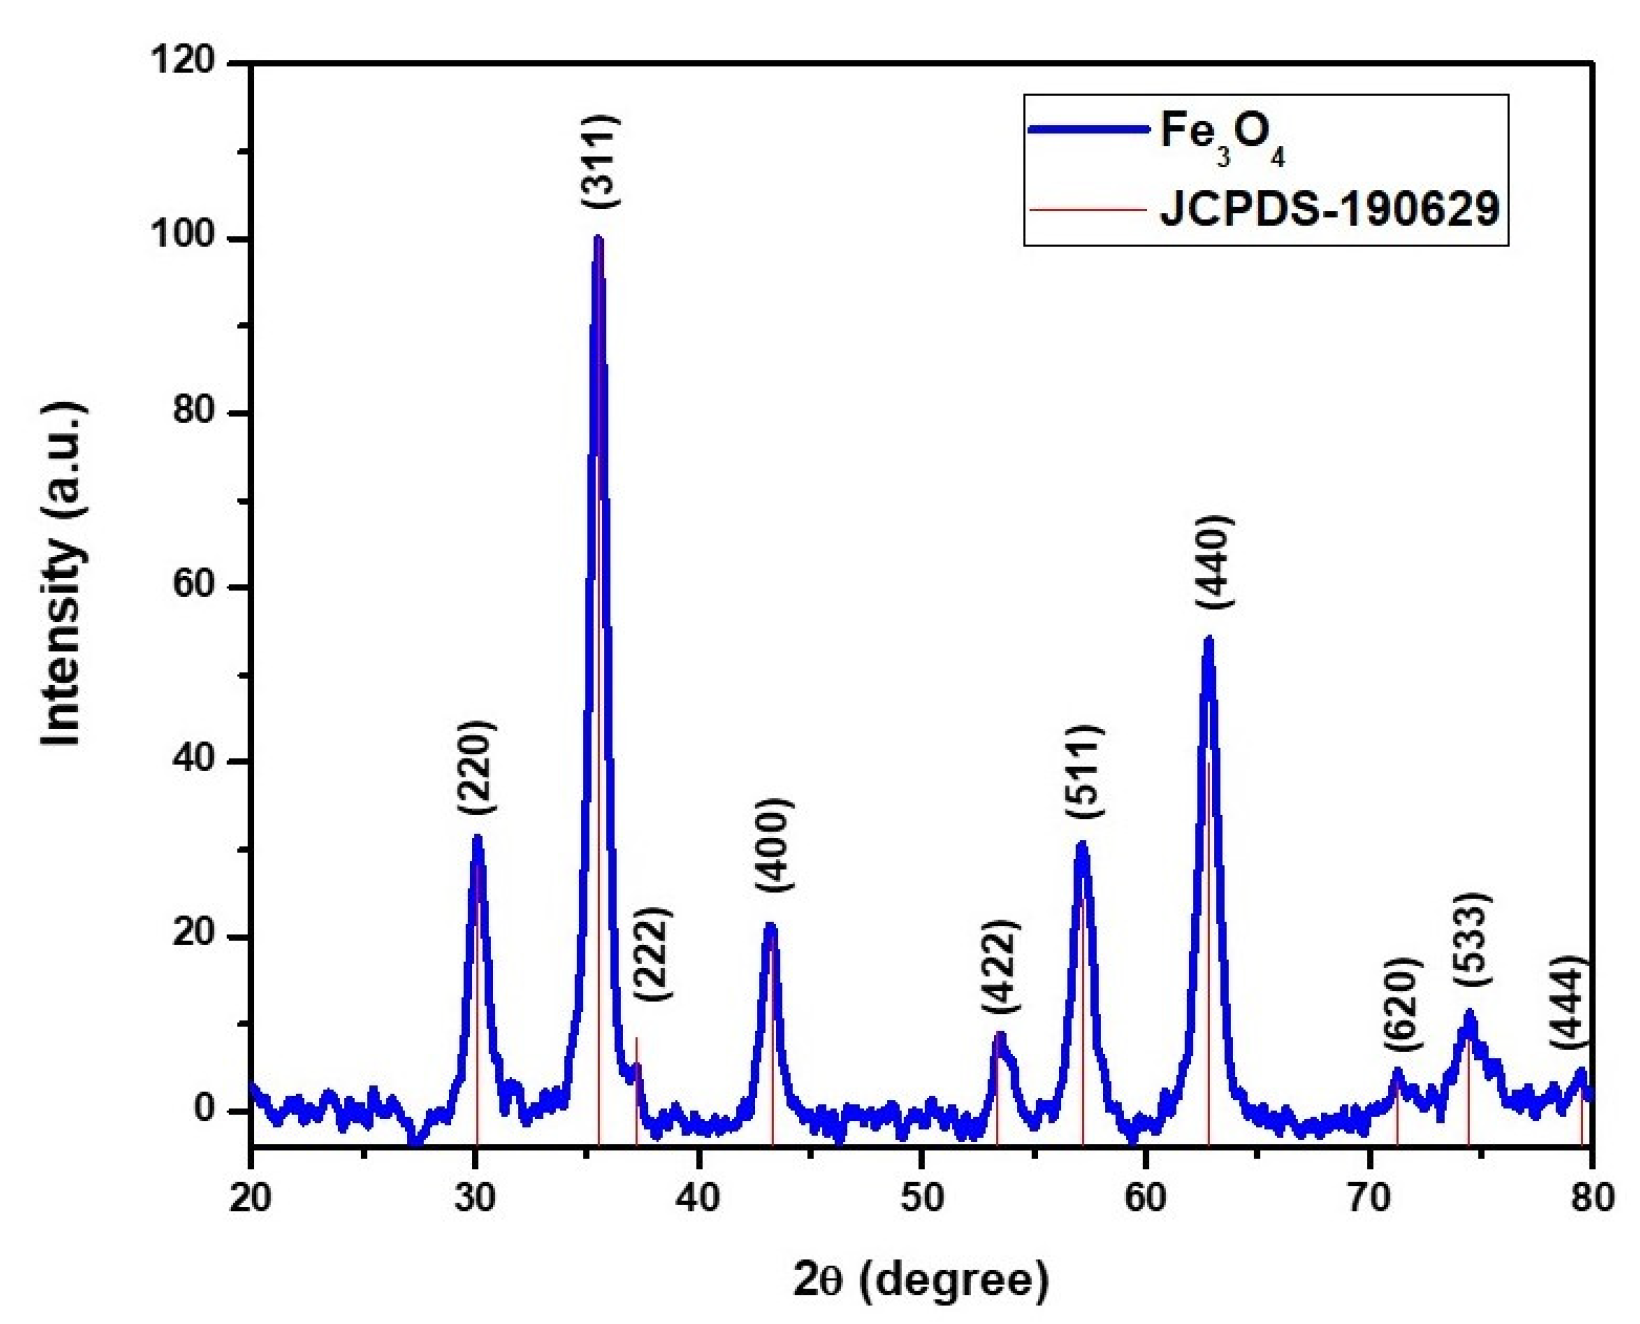
3.1.3. XRD
3.1.4. XPS
3.1.5. VSM
3.2. MB Removal from Aqueous Media
3.2.1. Effect of pH on MB Adsorption
3.2.2. Effect of Adsorbent Dose on Dye Adsorption
3.3. MB Adsorption Isotherms
3.4. Kinetics Study of Adsorption
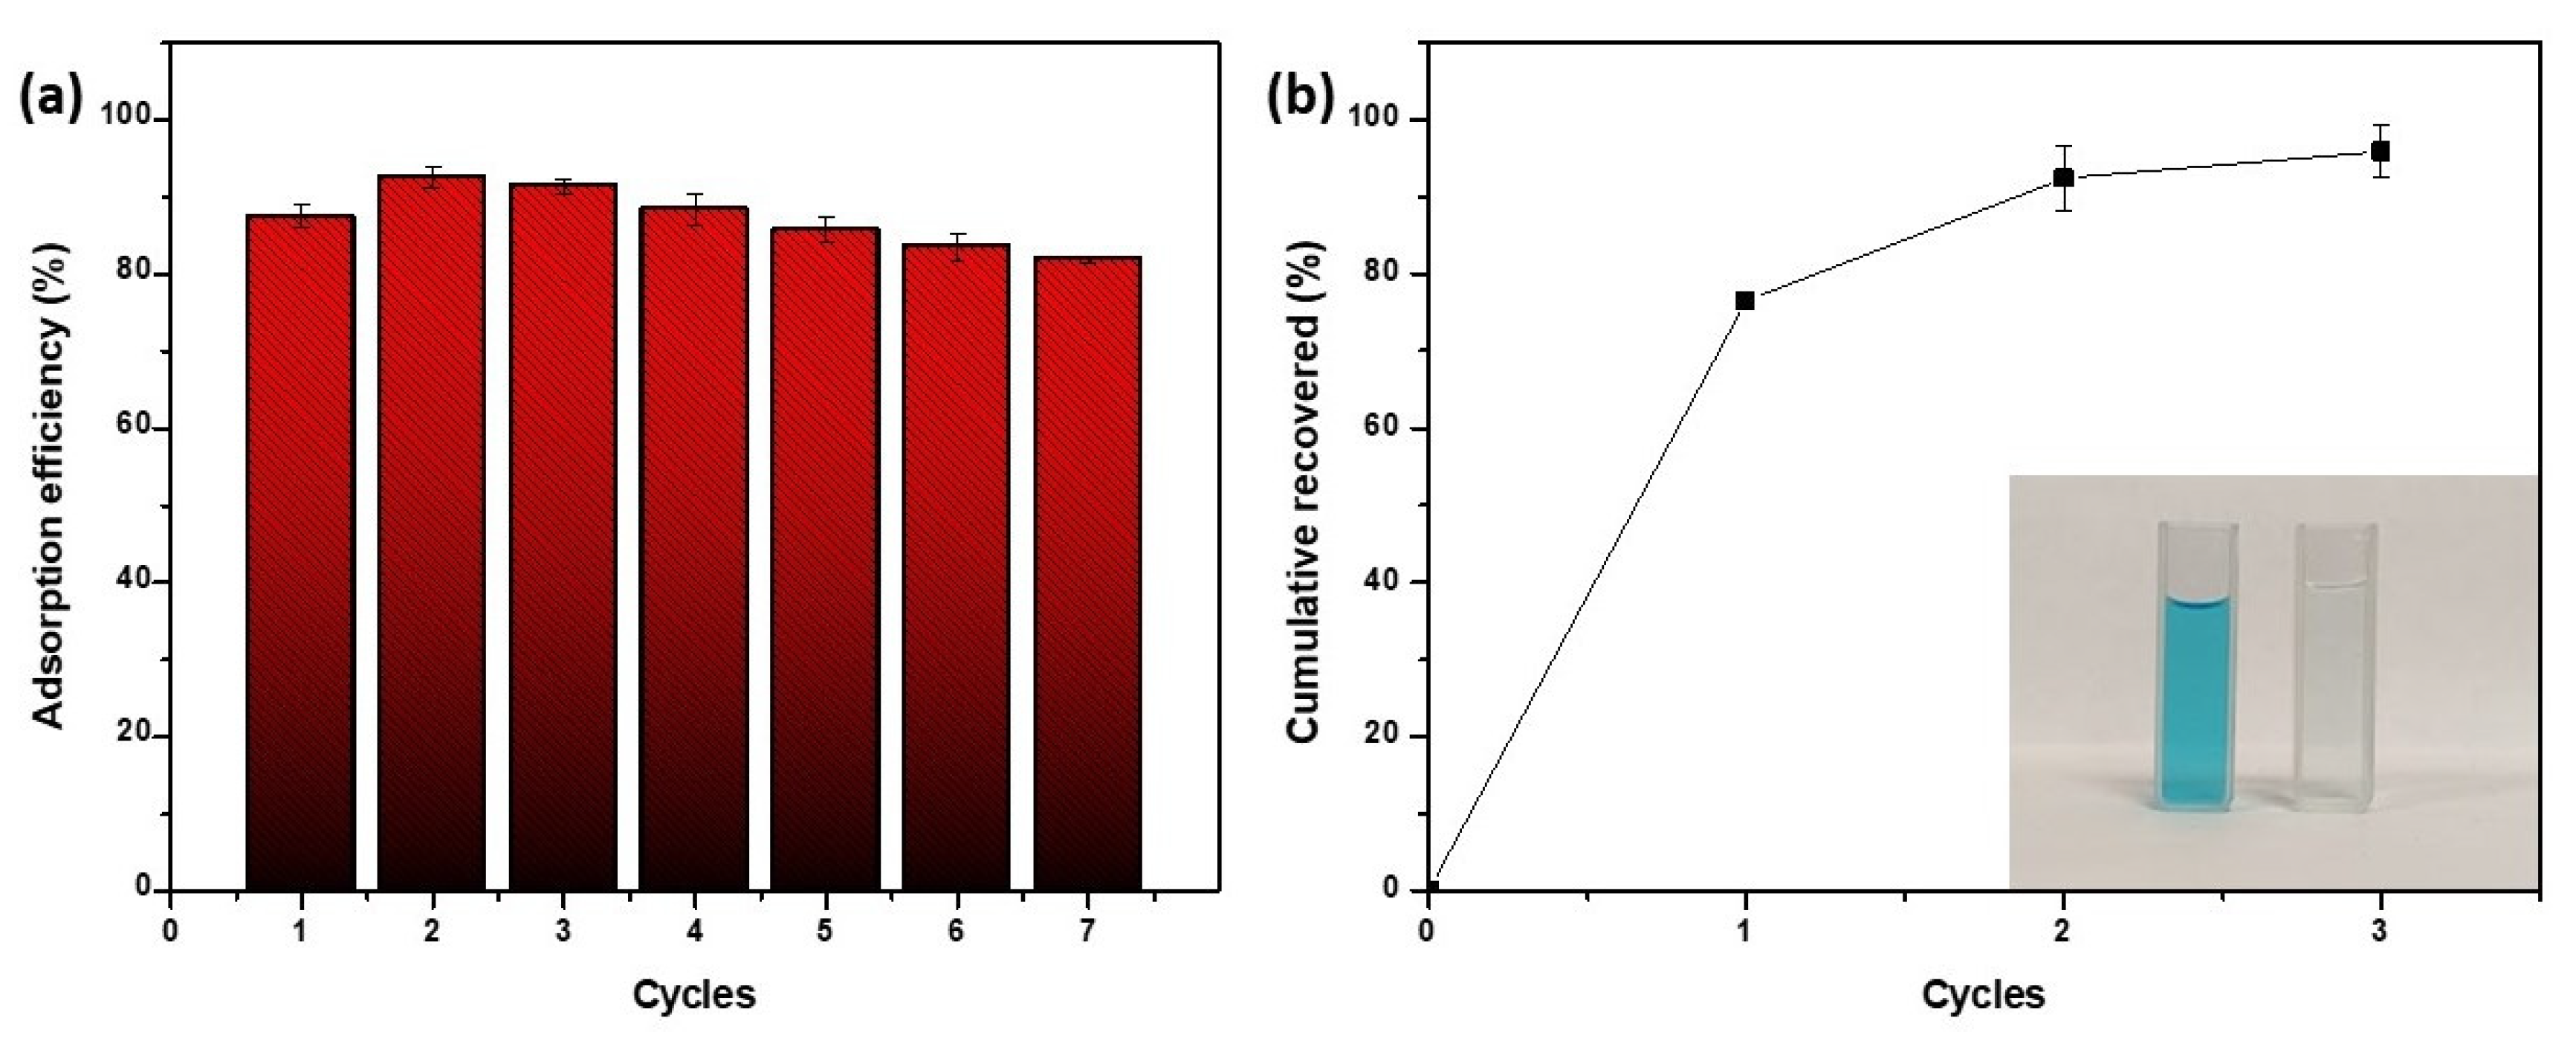
3.5. Reusability of the Novel Biosorbent
4. Conclusions
Author Contributions
Funding
Institutional Review Board Statement
Informed Consent Statement
Data Availability Statement
Acknowledgments
Conflicts of Interest
References
- Boretti, A.; Rosa, L. Reassessing the projections of the world water development report. NPJ Clean Water 2019, 2, 1–6. [Google Scholar] [CrossRef] [Green Version]
- Palansooriya, K.N.; Yang, Y.; Tsang, Y.F.; Sarkar, B.; Hou, D.; Cao, X.; Meers, E.; Rinklebe, J.; Kim, K.-H.; Ok, Y.S. Occurrence of contaminants in drinking water sources and the potential of biochar for water quality improvement: A review. Crit. Rev. Environ. Sci. Technol. 2020, 50, 549–611. [Google Scholar] [CrossRef]
- Chen, L.; Wang, L.; Wu, X.; Ding, X. A process-level water conservation and pollution control performance evaluation tool of cleaner production technology in textile industry. J. Clean. Prod. 2017, 143, 1137–1143. [Google Scholar] [CrossRef]
- Ferrero, F. Adsorption of Methylene Blue on magnesium silicate: Kinetics, equilibria and comparison with other adsorbents. J. Environ. Sci. 2010, 22, 467–473. [Google Scholar] [CrossRef] [PubMed]
- Piaskowski, K.; Świderska-Dąbrowska, R.; Zarzycki, P.K. Dye removal from water and wastewater using various physical, chemical, and biological processes. J. AOAC Int. 2018, 101, 1371–1384. [Google Scholar] [CrossRef]
- Singh, A.; Pal, D.B.; Mohammad, A.; Alhazmi, A.; Haque, S.; Yoon, T.; Srivastava, N.; Gupta, V.K. Biological remediation technologies for dyes and heavy metals in wastewater treatment: New insight. Bioresour. Technol. 2022, 343, 126154. [Google Scholar] [CrossRef] [PubMed]
- Huang, J.; Cao, Y.; Liu, Z.; Deng, Z.; Wang, W. Application of titanate nanoflowers for dye removal: A comparative study with titanate nanotubes and nanowires. Chem. Eng. J. 2012, 191, 38–44. [Google Scholar] [CrossRef]
- Guo, Y.; Qi, P.; Liu, Y. A review on advanced treatment of pharmaceutical wastewater. In IOP Conference Series: Earth and Environmental Science; IOP Publishing: Bristol, UK, 2017; p. 012025. [Google Scholar]
- Crini, G.; Lichtfouse, E.; Wilson, L.D.; Morin-Crini, N. Conventional and non-conventional adsorbents for wastewater treatment. Environ. Chem. Lett. 2019, 17, 195–213. [Google Scholar] [CrossRef]
- Ramesh, A.; Rama Devi, D.; Mohan Botsa, S.; Basavaiah, K. Facile green synthesis of Fe3O4 nanoparticles using aqueous leaf extract of Zanthoxylum armatum DC. for efficient adsorption of methylene blue. J. Asian Ceram. Soc. 2018, 6, 145–155. [Google Scholar] [CrossRef] [Green Version]
- Jan, H.; Gul, R.; Andleeb, A.; Ullah, S.; Shah, M.; Khanum, M.; Ullah, I.; Hano, C.; Abbasi, B.H. A detailed review on biosynthesis of platinum nanoparticles (PtNPs), their potential antimicrobial and biomedical applications. J. Saudi Chem. Soc. 2021, 25, 101297. [Google Scholar] [CrossRef]
- Salari, M.; Hosseini, H. Application of nanoparticle technology in water and wastewater treatment (overview). Adv. Appl. NanoBio-Technol. 2021, 2, 86–92. [Google Scholar]
- Abid, M.A.; Abid, D.A.; Aziz, W.J.; Rashid, T.M. Iron oxide nanoparticles synthesized using garlic and onion peel extracts rapidly degrade methylene blue dye. Phys. B Condens. Matter 2021, 622, 413277. [Google Scholar] [CrossRef]
- Gutierrez, A.M.; Dziubla, T.D.; Hilt, J.Z. Recent advances on iron oxide magnetic nanoparticles as sorbents of organic pollutants in water and wastewater treatment. Rev. Environ. Health 2017, 32, 111–117. [Google Scholar] [CrossRef] [PubMed] [Green Version]
- Nasseh, N.; Barikbin, B.; Taghavi, L.; Nasseri, M.A. Adsorption of metronidazole antibiotic using a new magnetic nanocomposite from simulated wastewater (isotherm, kinetic and thermodynamic studies). Compos. Part B Eng. 2019, 159, 146–156. [Google Scholar] [CrossRef]
- Shen, Y.; Tang, J.; Nie, Z.; Wang, Y.; Ren, Y.; Zuo, L. Preparation and application of magnetic Fe3O4 nanoparticles for wastewater purification. Sep. Purif. Technol. 2009, 68, 312–319. [Google Scholar] [CrossRef]
- Venkateswarlu, S.; Rao, Y.S.; Balaji, T.; Prathima, B.; Jyothi, N. Biogenic synthesis of Fe3O4 magnetic nanoparticles using plantain peel extract. Mater. Lett. 2013, 100, 241–244. [Google Scholar] [CrossRef]
- Velsankar, K.; Parvathy, G.; Mohandoss, S.; Krishna Kumar, M.; Sudhahar, S. Celosia argentea leaf extract-mediated green synthesized iron oxide nanoparticles for bio-applications. J. Nanostructure Chem. 2022, 12, 625–640. [Google Scholar] [CrossRef]
- Abbasi, B.A.; Iqbal, J.; Zahra, S.A.; Shahbaz, A.; Kanwal, S.; Rabbani, A.; Mahmood, T. Bioinspired synthesis and activity characterization of iron oxide nanoparticles made using Rhamnus Triquetra leaf extract. Mater. Res. Express 2020, 6, 1250e7. [Google Scholar] [CrossRef]
- Abdullah, J.A.A.; Eddine, L.S.; Abderrhmane, B.; Alonso-González, M.; Guerrero, A.; Romero, A. Green synthesis and characterization of iron oxide nanoparticles by pheonix dactylifera leaf extract and evaluation of their antioxidant activity. Sustain. Chem. Pharm. 2020, 17, 100280. [Google Scholar] [CrossRef]
- Moran-Palacio, E.F.; Zamora-Álvarez, L.A.; Stephens-Camacho, N.A.; Yáñez-Farías, G.A.; Virgen-Ortiz, A.; Martínez-Cruz, O.; Rosas-Rodríguez, J.A. Antioxidant capacity, radical scavenging kinetics and phenolic profile of methanol extracts of wild plants of Southern Sonora, Mexico. Trop. J. Pharm. Res. 2014, 13, 1487–1493. [Google Scholar] [CrossRef] [Green Version]
- Omelyanchik, A.; Kamzin, A.; Valiullin, A.; Semenov, V.; Vereshchagin, S.; Volochaev, M.; Dubrovskiy, A.; Sviridova, T.; Kozenkov, I.; Dolan, E. Iron oxide nanoparticles synthesized by a glycine-modified coprecipitation method: Structure and magnetic properties. Colloids Surf. A Physicochem. Eng. Asp. 2022, 647, 129090. [Google Scholar] [CrossRef]
- Patterson, A. The Scherrer formula for X-ray particle size determination. Phys. Rev. 1939, 56, 978. [Google Scholar] [CrossRef]
- Joshi, S.; Garg, V.; Kataria, N.; Kadirvelu, K. Applications of Fe3O4@ AC nanoparticles for dye removal from simulated wastewater. Chemosphere 2019, 236, 124280. [Google Scholar] [CrossRef]
- Ayub, A.; Raza, Z.A.; Majeed, M.I.; Tariq, M.R.; Irfan, A. Development of sustainable magnetic chitosan biosorbent beads for kinetic remediation of arsenic contaminated water. Int. J. Biol. Macromol. 2020, 163, 603–617. [Google Scholar] [CrossRef] [PubMed]
- Ho, Y.-S.; McKay, G. Pseudo-second order model for sorption processes. Process Biochem. 1999, 34, 451–465. [Google Scholar] [CrossRef]
- Boukhalfa, N.; Boutahala, M.; Djebri, N.; Idris, A. Kinetics, thermodynamics, equilibrium isotherms, and reusability studies of cationic dye adsorption by magnetic alginate/oxidized multiwalled carbon nanotubes composites. Int. J. Biol. Macromol. 2019, 123, 539–548. [Google Scholar] [CrossRef]
- Prasad, A.R.; Joseph, A. Synthesis, characterization and investigation of methyl orange dye removal from aqueous solutions using waterborne poly vinyl pyrrolidone (PVP) stabilized poly aniline (PANI) core–shell nanoparticles. RSC Adv. 2017, 7, 20960–20968. [Google Scholar] [CrossRef] [Green Version]
- Vasantharaj, S.; Sathiyavimal, S.; Senthilkumar, P.; LewisOscar, F.; Pugazhendhi, A. Biosynthesis of iron oxide nanoparticles using leaf extract of Ruellia tuberosa: Antimicrobial properties and their applications in photocatalytic degradation. J. Photochem. Photobiol. B Biol. 2019, 192, 74–82. [Google Scholar] [CrossRef]
- Cornell, R.M.; Schwertmann, U. The Iron Oxides: Structure, Properties, Reactions, Occurrences, and Uses; Wiley-VCH: Weinheim, Germany, 2003; Volume 664. [Google Scholar]
- Jaiswal, V. Culture and ethnobotany of Jaintia tribal community of Meghalaya, Northeast India-A mini review. Indian J. Tradit. Knowl. 2010, 9, 38–44. [Google Scholar]
- Yazid, N.A.; Joon, Y.C. Co-precipitation synthesis of magnetic nanoparticles for efficient removal of heavy metal from synthetic wastewater. In AIP Conference Proceedings; AIP Publishing LLC: Long Island, NY, USA, 2019; p. 020019. [Google Scholar]
- Gossuin, Y.; Gillis, P.; Hocq, A.; Vuong, Q.L.; Roch, A. Magnetic resonance relaxation properties of superparamagnetic particles. Wiley Interdiscip. Rev. Nanomed. Nanobiotechnol. 2009, 1, 299–310. [Google Scholar] [CrossRef]
- Maity, D.; Kale, S.; Kaul-Ghanekar, R.; Xue, J.-M.; Ding, J. Studies of magnetite nanoparticles synthesized by thermal decomposition of iron (III) acetylacetonate in tri (ethylene glycol). J. Magn. Magn. Mater. 2009, 321, 3093–3098. [Google Scholar] [CrossRef]
- Ai, Q.; Yuan, Z.; Huang, R.; Yang, C.; Jiang, G.; Xiong, J.; Huang, Z.; Yuan, S. One-pot co-precipitation synthesis of Fe3O4 nanoparticles embedded in 3D carbonaceous matrix as anode for lithium ion batteries. J. Mater. Sci. 2019, 54, 4212–4224. [Google Scholar] [CrossRef]
- Finck, N.; Radulescu, L.; Schild, D.; Rothmeier, M.; Huber, F.; Lützenkirchen, J.; Rabung, T.; Heberling, F.; Schlegel, M.; Dideriksen, K. XAS signatures of Am (III) adsorbed onto magnetite and maghemite. J. Phys. Conf. Ser. 2016, 712, 012085. [Google Scholar] [CrossRef] [Green Version]
- Maldonado-Camargo, L.; Unni, M.; Rinaldi, C. Magnetic characterization of iron oxide nanoparticles for biomedical applications. In Biomedical Nanotechnology; Springer: Berlin/Heidelberg, Germany, 2017; pp. 47–71. [Google Scholar]
- Ganesan, V.; Lahiri, B.; Louis, C.; Philip, J.; Damodaran, S.P. Size-controlled synthesis of superparamagnetic magnetite nanoclusters for heat generation in an alternating magnetic field. J. Mol. Liq. 2019, 281, 315–323. [Google Scholar] [CrossRef]
- Ibarra, J.; Encinas, D.; Blanco, M.; Barbosa, S.; Taboada, P.; Juárez, J.; Valdez, M.A. Co-encapsulation of magnetic nanoparticles and cisplatin within biocompatible polymers as multifunctional nanoplatforms: Synthesis, characterization, and in vitro assays. Mater. Res. Express 2018, 5, 015023. [Google Scholar] [CrossRef]
- Elizondo-Villarreal, N.; Verástegui-Domínguez, L.; Rodríguez-Batista, R.; Gándara-Martínez, E.; Alcorta-García, A.; Martínez-Delgado, D.; Rodríguez-Castellanos, E.A.; Vázquez-Rodríguez, F.; Gómez-Rodríguez, C. Green Synthesis of Magnetic Nanoparticles of Iron Oxide Using Aqueous Extracts of Lemon Peel Waste and Its Application in Anti-Corrosive Coatings. Materials 2022, 15, 8328. [Google Scholar] [CrossRef]
- Chesnel, K.; Trevino, M.; Cai, Y.; Hancock, J.; Smith, S.; Harrison, R. Particle size effects on the magnetic behaviour of 5 to 11 nm Fe3O4 nanoparticles coated with oleic acid. In Journal of Physics: Conference Series; IOP Publishing: Bristol, UK, 2014; p. 012004. [Google Scholar]
- Kobylinska, N.; Klymchuk, D.; Khaynakova, O.; Duplij, V.; Matvieieva, N. Morphology-Controlled Green Synthesis of Magnetic Nanoparticles Using Extracts of ‘Hairy’Roots: Environmental Application and Toxicity Evaluation. Nanomaterials 2022, 12, 4231. [Google Scholar] [CrossRef]
- Thakur, P.; Kumar, V. Kinetics and thermodynamic studies for removal of methylene blue dye by biosynthesize copper oxide nanoparticles and its antibacterial activity. J. Environ. Health Sci. Eng. 2019, 17, 367–376. [Google Scholar]
- Jain, A.; Wadhawan, S.; Mehta, S. Biogenic synthesis of non-toxic iron oxide NPs via Syzygium aromaticum for the removal of methylene blue. Environ. Nanotechnol. Monit. Manag. 2021, 16, 100464. [Google Scholar] [CrossRef]
- Sadare, O.O.; Ayeni, A.O.; Daramola, M.O. Evaluation of adsorption and kinetics of neem leaf powder (Azadirachta indica) as a bio-sorbent for desulfurization of dibenzothiophene (DBT) from synthetic diesel. J. Saudi Chem. Soc. 2022, 26, 101433. [Google Scholar] [CrossRef]
- Majd, M.M.; Kordzadeh-Kermani, V.; Ghalandari, V.; Askari, A.; Sillanpää, M. Adsorption isotherm models: A comprehensive and systematic review (2010−2020). Sci. Total Environ. 2021, 812, 151334. [Google Scholar] [CrossRef] [PubMed]
- Muthukumaran, C.; Sivakumar, V.M.; Thirumarimurugan, M. Adsorption isotherms and kinetic studies of crystal violet dye removal from aqueous solution using surfactant modified magnetic nanoadsorbent. J. Taiwan Inst. Chem. Eng. 2016, 63, 354–362. [Google Scholar] [CrossRef]
- Zhou, Y.-T.; Nie, H.-L.; Branford-White, C.; He, Z.-Y.; Zhu, L.-M. Removal of Cu2+ from aqueous solution by chitosan-coated magnetic nanoparticles modified with α-ketoglutaric acid. J. Colloid Interface Sci. 2009, 330, 29–37. [Google Scholar] [CrossRef] [PubMed]
- Anah, L.; Astrini, N. Isotherm adsorption studies of Ni (II) ion removal from aqueous solutions by modified carboxymethyl cellulose hydrogel. IOP Conf. Ser. Earth Environ. Sci. 2018, 160, 012017. [Google Scholar] [CrossRef]
- Rajabi, H.R.; Arjmand, H.; Hoseini, S.J.; Nasrabadi, H. Surface modified magnetic nanoparticles as efficient and green sorbents: Synthesis, characterization, and application for the removal of anionic dye. J. Magn. Magn. Mater. 2015, 394, 7–13. [Google Scholar] [CrossRef]
- Sharma, A.; Mangla, D.; Choudhry, A.; Sajid, M.; Chaudhry, S.A. Facile synthesis, physico-chemical studies of Ocimum sanctum magnetic nanocomposite and its adsorptive application against Methylene blue. J. Mol. Liq. 2022, 362, 119752. [Google Scholar] [CrossRef]
- Khairy, G.M.; Hesham, A.M.; Jahin, H.E.S.; El-Korashy, S.A.; Awad, Y.M. Green synthesis of a novel eco-friendly hydrochar from Pomegranate peels loaded with iron nanoparticles for the removal of copper ions and methylene blue from aqueous solutions. J. Mol. Liq. 2022, 368, 120722. [Google Scholar] [CrossRef]
- Zenebe, A.; Yimer, A.M.; Kuzhunellil, S.; Demissie, H. Green synthesis of magnetic nanocomposite by Cordia Africana (CA) leave extract for the treatment of Methylene blue contaminated water. Chem. Eng. J. Adv. 2021, 8, 100193. [Google Scholar] [CrossRef]
- Sahu, N.; Rawat, S.; Singh, J.; Karri, R.R.; Lee, S.; Choi, J.-S.; Koduru, J.R. Process optimization and modeling of methylene blue adsorption using zero-valent iron nanoparticles synthesized from sweet lime pulp. Appl. Sci. 2019, 9, 5112. [Google Scholar] [CrossRef] [Green Version]
- Abdelfatah, A.M.; Fawzy, M.; Eltaweil, A.S.; El-Khouly, M.E. Green synthesis of nano-zero-valent iron using ricinus communis seeds extract: Characterization and application in the treatment of methylene blue-polluted water. ACS Omega 2021, 6, 25397–25411. [Google Scholar] [CrossRef]
- Wang, H.; Jia, S.; Wang, H.; Li, B.; Liu, W.; Li, N.; Qiao, J.; Li, C.-Z. A novel-green adsorbent based on betaine-modified magnetic nanoparticles for removal of methyl blue. Sci. Bull. 2017, 62, 319–325. [Google Scholar] [CrossRef] [PubMed] [Green Version]
- Rathi, B.S.; Kumar, P.S. Application of adsorption process for effective removal of emerging contaminants from water and wastewater. Environ. Pollut. 2021, 280, 116995. [Google Scholar] [CrossRef] [PubMed]


| Test | Metabolite | Result |
|---|---|---|
| Fehling | Reducing sugars | − |
| Lugol | Starch | − |
| Espuma | Saponins | + |
| Mayer | Alkaloids | + |
| Dragendorff | Alkaloids | − |
| Wagner | Alkaloids | + |
| Hager | Alkaloids | + |
| Baljet | Sesquiterpenlactones | − |
| Salkowski | Terpenes | − |
| Lieberman–Bourchard | Sterols | − |
| Shinoda | Flavonoids | − |
| H2SO4 | Flavonoids | + |
| FeCl3 | Phenols | + |
| Keller–Killani | Glycosides—Cardiac | + |
| Proteins | Proteins | − |
| Langmuir | Freundlich | ||||
|---|---|---|---|---|---|
| qmax (mg/g) | KL (L/mg) | R2 | kf (mg/g) (L/mg) | 1/n | R2 |
| 54.56 | 0.35 | 0.96 | 13.78 | 0.78 | 0.95 |
| Adsorbents | qmax (mg g−1) | Reference |
|---|---|---|
| Ocimum sanctum–Fe3O4 hybrid magnetic nanocomposite | 23.80 | [51] |
| Fe3O4 loaded into hydrochar | 278.1 | [52] |
| Magnetic natrolite-incorporated nanocomposites | 30 | [53] |
| ZeroValent iron NP (using sweet lime pulp) | 14.9 | [54] |
| Ricinus Communis–ZeroValent iron NP | 64.9 | [55] |
| Fe3O4–Zanthoxylum armatum NP | 10.47 | [10] |
| Betaine-modified magnetic NP | 135.69 | [56] |
| Fe3O4–Vallesia glabra | 54.56 | This study |
| First-Order Rate Constant K1 (min−1) (10−3) | Equilibrium Adsorption Capacity (qe) (mg g−1) | R2 | Second-order Rate Constant K2 (mg g−1 min−1) (10−3) | Equilibrium Adsorption Capacity (qe2) (mg g−1) | R2 | |
|---|---|---|---|---|---|---|
| Absorbent Dose (g) | ||||||
| 0.002 | 1.19 | 24.04 | 0.96 | 6.1 | 909.5 | 0.99 |
| 0.004 | 1.26 | 9.87 | 0.95 | 21.5 | 312.6 | 0.99 |
| 0.005 | 1.55 | 8.75 | 0.87 | 34.2 | 241.3 | 0.99 |
| 0.01 | 1.83 | 2.15 | 0.93 | 175 | 80.3 | 0.99 |
Disclaimer/Publisher’s Note: The statements, opinions and data contained in all publications are solely those of the individual author(s) and contributor(s) and not of MDPI and/or the editor(s). MDPI and/or the editor(s) disclaim responsibility for any injury to people or property resulting from any ideas, methods, instructions or products referred to in the content. |
© 2023 by the authors. Licensee MDPI, Basel, Switzerland. This article is an open access article distributed under the terms and conditions of the Creative Commons Attribution (CC BY) license (https://creativecommons.org/licenses/by/4.0/).
Share and Cite
Medina-Zazueta, L.; Miranda-Castro, F.C.; Romo-Garcia, F.; Martínez-Gil, M.; Esparza-Ponce, H.E.; Encinas-Basurto, D.; Ibarra, J. Development of Sustainable Magnetic Biosorbent Using Aqueous Leaf Extract of Vallesia glabra for Methylene Blue Removal from Wastewater. Sustainability 2023, 15, 4586. https://doi.org/10.3390/su15054586
Medina-Zazueta L, Miranda-Castro FC, Romo-Garcia F, Martínez-Gil M, Esparza-Ponce HE, Encinas-Basurto D, Ibarra J. Development of Sustainable Magnetic Biosorbent Using Aqueous Leaf Extract of Vallesia glabra for Methylene Blue Removal from Wastewater. Sustainability. 2023; 15(5):4586. https://doi.org/10.3390/su15054586
Chicago/Turabian StyleMedina-Zazueta, Luis, F. C. Miranda-Castro, F. Romo-Garcia, M. Martínez-Gil, H. E. Esparza-Ponce, D. Encinas-Basurto, and Jaime Ibarra. 2023. "Development of Sustainable Magnetic Biosorbent Using Aqueous Leaf Extract of Vallesia glabra for Methylene Blue Removal from Wastewater" Sustainability 15, no. 5: 4586. https://doi.org/10.3390/su15054586