Article

Wind Effects on Dome Structures and Evaluation of CFD Simulations through Wind Tunnel Testing

1
Shanghai Typhoon Institute of China Meteorological Administration, Shanghai 200030, China
2
Department of Bridge Engineering, Tongji University, Shanghai 200092, China
3
Department of Civil, Architectural and Environmental Engineering, Missouri University of Science and Technology, Rolla, MO 65409, USA
4
Department of Civil and Environmental Engineering, Florida International University, Miami, FL 33174, USA
*
Author to whom correspondence should be addressed.
Sustainability 2023, 15(5), 4635; https://doi.org/10.3390/su15054635
Submission received: 24 January 2023 / Revised: 24 February 2023 / Accepted: 2 March 2023 / Published: 5 March 2023

Abstract

:
In the study, a series of wind tunnel tests were conducted to investigate wind effects acting on dome structures (1/60 scale) induced by straight-line winds at a Reynolds number in the order of 106. Computational Fluid Dynamics (CFD) simulations were performed as well, including a Large Eddy Simulation (LES) and Reynolds-Averaged Navier–Stokes (RANS) simulation, and their performances were validated by a comparison with the wind tunnel testing data. It is concluded that wind loads generally increase with upstream wind velocities, and they are reduced over suburban terrain due to ground friction. The maximum positive pressure normally occurs near the base of the dome on the windward side caused by the stagnation area and divergence of streamlines. The minimum suction pressure occurs at the apex of the dome because of the blockage of the dome and convergence of streamlines. Suction force is the most significant among all wind loads, and special attention should be paid to the roof design for proper wind resistance. Numerical simulations also indicate that LES results match better with the wind tunnel testing in terms of the distribution pattern of the mean pressure coefficient on the dome surface and total suction force. The mean and root-mean-square errors of the meridian pressure coefficient associated with the LES are about 60% less than those associated with RANS results, and the error of suction force is about 40–70% less. Moreover, the LES is more accurate in predicting the location of boundary layer separation and reproducing the complex flow field behind the dome, and is superior in simulating vortex structures around the dome to further understand the unsteadiness and dynamics in the flow field.

1. Introduction

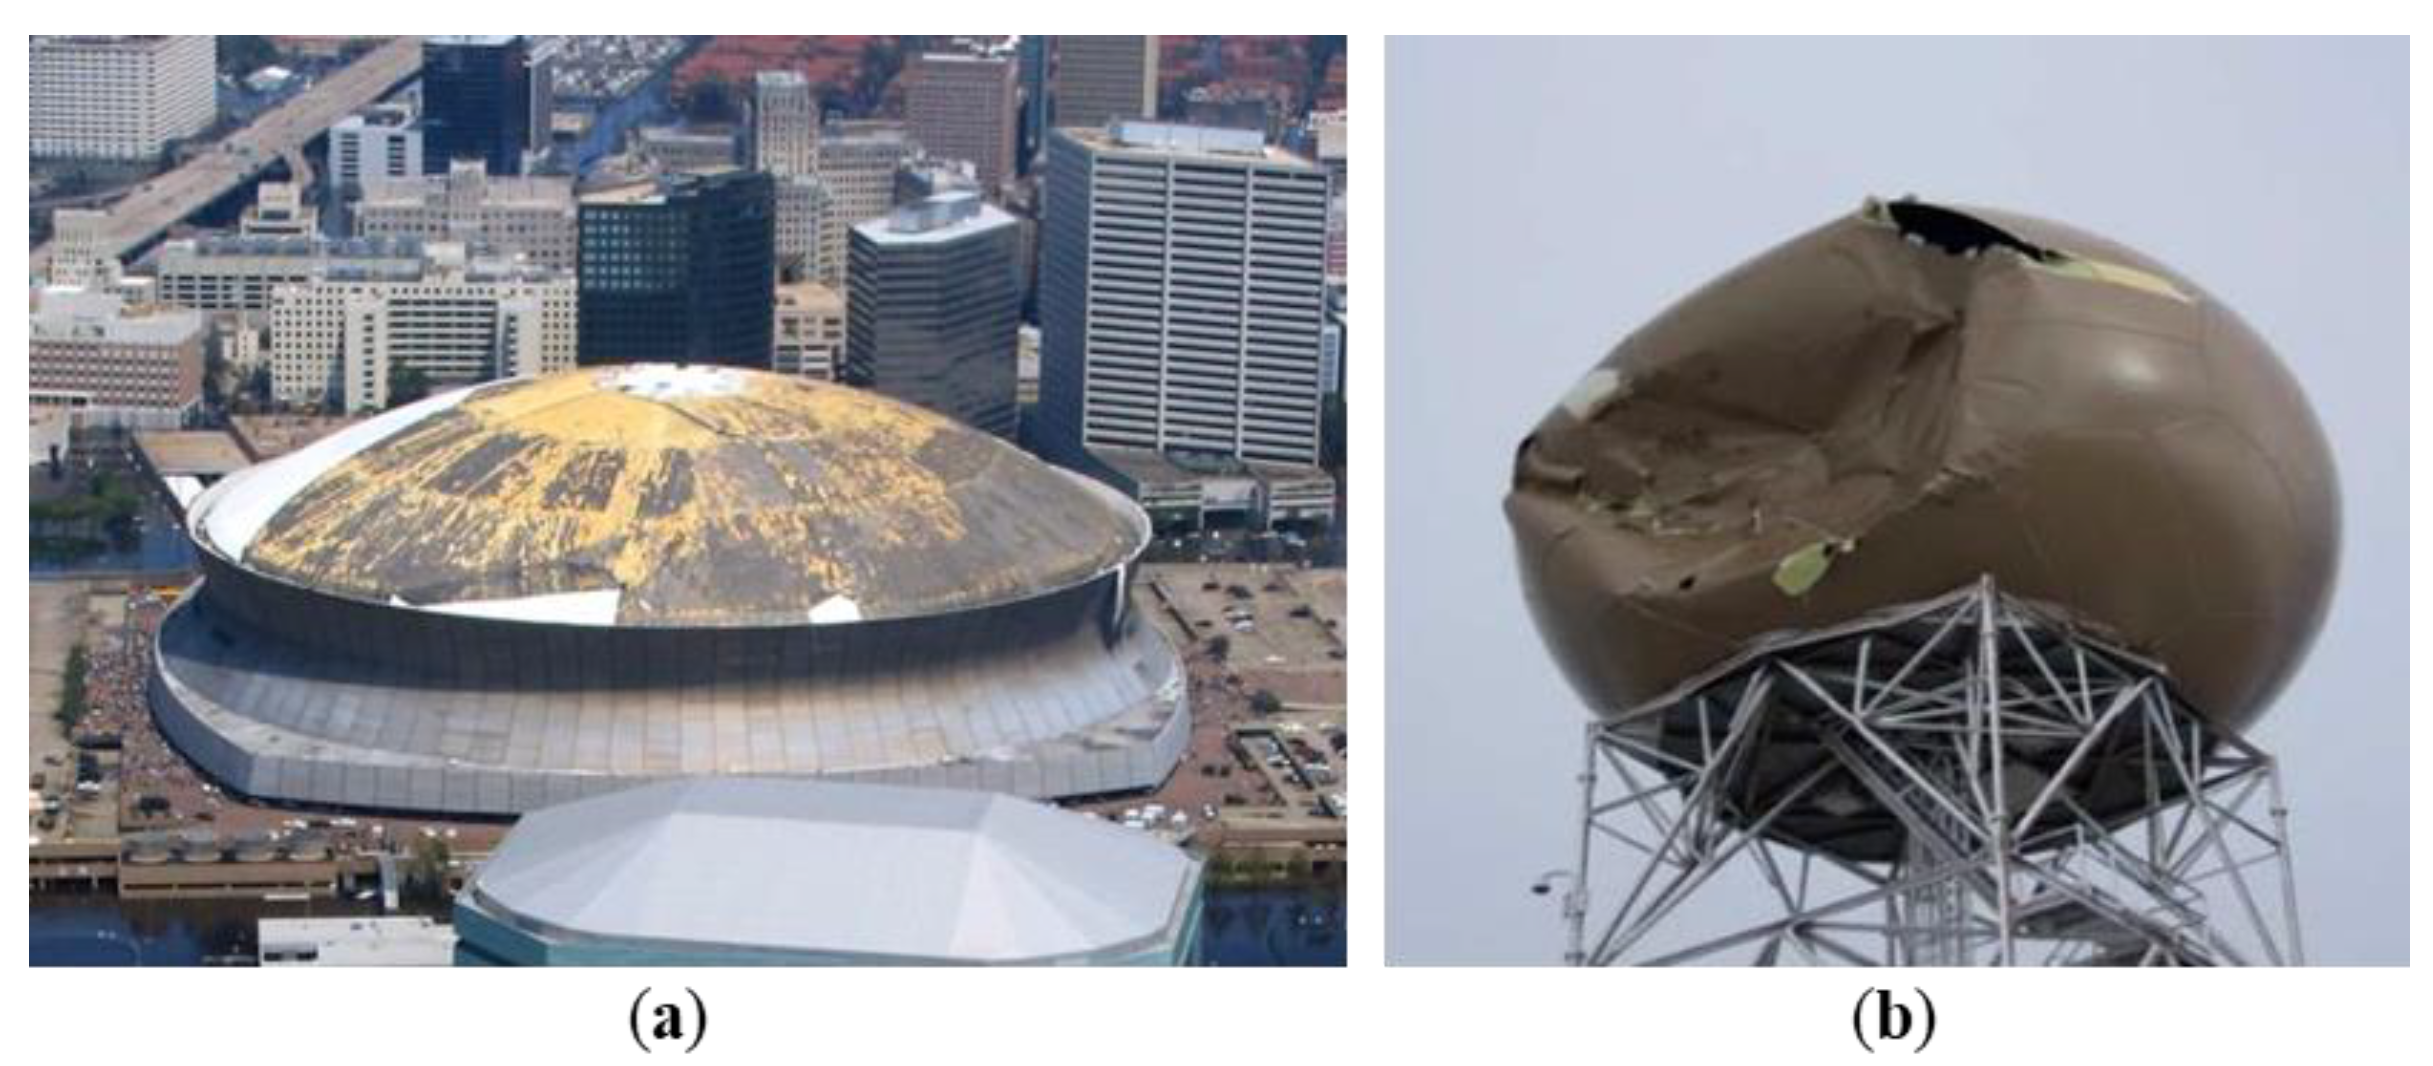
Spherical domes are commonly used as long-span space structures for public assembly venues, such as conference centers, concert halls, arenas, etc., since such a structure is at a distinct advantage due to high space usage and economic benefits. An example of a spherical building shown in Figure 1 is the Avicii Arena in Stockholm, Sweden. Its diameter is 110 m, and its inner height is 85 m. Winds can generate large loads on dome structures because of their large outer surface area, as well as severe vibrations because of their long-span and lightweight roofs. In fact, dome structures have suffered significant damage, and even total collapse, during past strong wind events. For example, the New Orleans Superdome suffered severe damage including the loss of its roof during Hurricane Katrina in 2005 (Figure 2a). The Reno/Virginia peak dome collapsed due to strong wind gusts in Western Nevada in 2008 (Figure 2b). Therefore, the wind resistance design of dome structures for structural failure elimination and safety assurance is necessary, and the aerodynamic behavior of dome structures and wind-induced loads need to be well understood.
Wind tunnel tests were first conducted to explore mean [1,2] and fluctuating [3,4] wind pressures acting on dome structures. The impact of the Reynolds number ( R e ) on smooth hemispherical domes was investigated, and the pressure at the dome apex monotonically increased with increasing R e in the range of 3 × 10 4 to 8 × 10 4 [2]. However, for rough models, the pressure at the dome apex first increased and then decreased, and a maximum value was reached near the critical R e of 5.7 × 10 4 [5]. The study of surface roughness effects on pressure distributions indicated that a smaller suction was induced at the dome apex and a larger suction in the wake region when the dome surface was rougher [6]. Cheng and Fu (2010) tested hemispherical domes with R e ranging from 5.3 × 10 4 to 2.0 × 10 6 , and concluded that the pressure distribution became R e independent when it fell within 1.0 2.0 × 10 5 [7]. Aerodynamic loads on a semi-circular cylinder under various gust frequencies were studied, and a theoretical model was proposed to fit experimental results [8]. Wind tunnel tests of dome structures with various height-to-span ratios and opening ratios were conducted to investigate wind pressures on retractable dome roofs [9,10]. Mean pressure coefficients increased with the increase of the height-to-span ratio. Additionally, as the opening ratio increased, suction pressure coefficients at the outmost interior of open dome roofs increased. A series of measurements were carried out for an array of three domes, and the peak suction was observed approximately at the apex of the first dome and the maximum positive pressure was observed on the windward side of the third dome [11].
Computational Fluid Dynamics (CFD) simulations are also employed to study aerodynamic behaviors of dome structures, which provide more details to understand flow characteristics regarding boundary layer separation. Turbulent flows are governed by the well-known Navier–Stokes (N–S) equations, which describe every detail of the turbulent flow field from the largest to the smallest length and time scales. Three types of numerical approaches are applied to analyze turbulent flows, i.e., the direct numerical simulation (DNS), large eddy simulation (LES), and Reynolds averaged Navier–Stokes (RANS) simulation. The DNS directly solves N–S equations and resolves all scales of motion, and therefore, fine grid resolution down to the Kolmogorov scale is required. For example, the total number of grid points is estimated to be 10 13 for a three-dimensional simulation of a turbulent flow with a Reynolds number of 10 6 [12]. Due to the high computational demand of the DNS, its application to wind engineering is difficult and limited, especially for high Reynolds number problems. To reduce computational demand, the LES is developed to only resolve large scales of motion while smaller scales are removed from the flow variables by filtering the original N–S equations in the physical space. Smaller scales are then analyzed by subgrid-scale models, such as the Smagorinsky–Lily model [13], the wall-adapting local eddy-viscosity (WALE) model [14], and the dynamic Smagorinsky–Lilly model [15,16].
In the RANS simulation, N–S equations are averaged over all scales of motion, and therefore, the turbulent flow is described by statistical parameters, e.g., mean velocity. The effects of turbulent fluctuations on the averaged flow are represented by additional terms obtained in the averaging process, which are called Reynolds stresses prescribed by turbulence models. Turbulence models are categorized according to the number of required transport equations. For a one-equation model, there is only one transport equation, and the Spalart–Allmaras (SA) model [17] is commonly used. The SA model shows the reasonably robust and time efficient capability to solve mildly separated flows. Additionally, it uses less memory and converges easily. For the two-equation model, there are two transport equations. The standard k-ε [18] and standard k-ω models [19] are commonly deployed. Turbulent kinetic energy is described by k, and the dissipation rate of k is described by ε and ω. Due to the fact that k at the impinging region is overestimated by the standard k-ε model when the airflow passes over an isolated obstacle [12], the realizable k-ε model [20] and renormalization group (RNG) k-ε model [21] are developed. The standard k-ω model is sensitive to inlet boundary conditions, and then the shear stress transport (SST) k-ω model [22,23,24] is developed, which predicts boundary layer separation and reattachment more accurately.
The LES and RANS simulations with the RNG k-ε turbulence model were applied to study velocity profiles in the wake of a dome [25,26]. The RNG k-ε model performed worse in simulating flow characteristics in the wake of the dome, and the LES showed better agreement with measurements. The LES was also applied to simulate mean pressures acting on a dome structure, which matched fairly well with experimental results [27]. Locations of boundary layer separation were predicted through the LES utilizing different subgrid-scale models, consisting of the Smagorinsky–Lily model, the WALE model, and the dynamic Smagorinsky–Lily model [28]. Since very fine grids were used in the LES, only minor deviations among different subgrid-scale models were observed. Wind pressures on scallop domes with a parabolic form of grooving were studied based on CFD simulations, and equations for surface pressure distribution were developed considering different height-to-span ratios [29]. Intensive CFD studies were conducted for dome structures to explain the capability of the CFD technique for determining appropriate design wind data [30]. It was concluded that pressure coefficients on the windward side and apex of the dome agreed well with corresponding Euro Code values, while pressure coefficients on the leeward side were different from all code standards. Wind loads acting on fifteen traditional domes were simulated by the CFD approach, and wind loads, especially suction force, were significantly affected by the shape of the dome [31].
The literature reviewed indicates that the DNS is able to provide every detail of the turbulent flow, but it is difficult to implement in flows of practical interest because of high computational demand. In comparison to the RANS simulation, the main properties of turbulent flows can generally be obtained by the LES with higher accuracy, but at a cost of higher memory usage and CPU time [32,33,34]. The accurate calculation of turbulent flow properties affects the reproduction of the flow structure of the wind field and hence, the accuracy of the wind pressure distribution on the dome surface. Considering respective advantages of the LES and RANS simulations, both of them are adopted in the current study. In the RANS simulation, the SA and SST k-ω turbulence models are selected because better prediction of boundary layer separation and reattachment can be achieved. Moreover, they can obtain relatively accurate results while reserving computational efficiency and good convergence. The LES is also employed because it is time-dependent and can reproduce turbulence with much higher accuracy. For wind engineering applications, it is common practice to compare most of the CFD simulation results to wind tunnel testing to validate their accuracy on the prediction of wind pressure distribution on the dome surface. Therefore, the wind tunnel testing of a dome structure was first performed in the NSF Natural Hazards Engineering Research Infrastructure (NHERI) Wall of Wind Experimental Facility (WOW EF) at Florida International University (FIU), and then it was employed as a benchmark to evaluate the RANS and LES simulations. The structure of the paper is as follows. First, the dome geometry and WOW EF are described, and the experimental setup is outlined. Second, experimental results are analyzed and discussed. Third, the LES and RANS simulations are applied to numerically simulate the wind tunnel testing, and then their performances are evaluated. Finally, conclusions are drawn.

2. Experimental Setup

This section consists of four parts. First, the geometry of the dome structure is described. Then, the WOW EF at FIU is briefly introduced. The experimental setup in the WOW EF is then followed. Finally, all testing cases are explained.

2.1. Dome Geometry

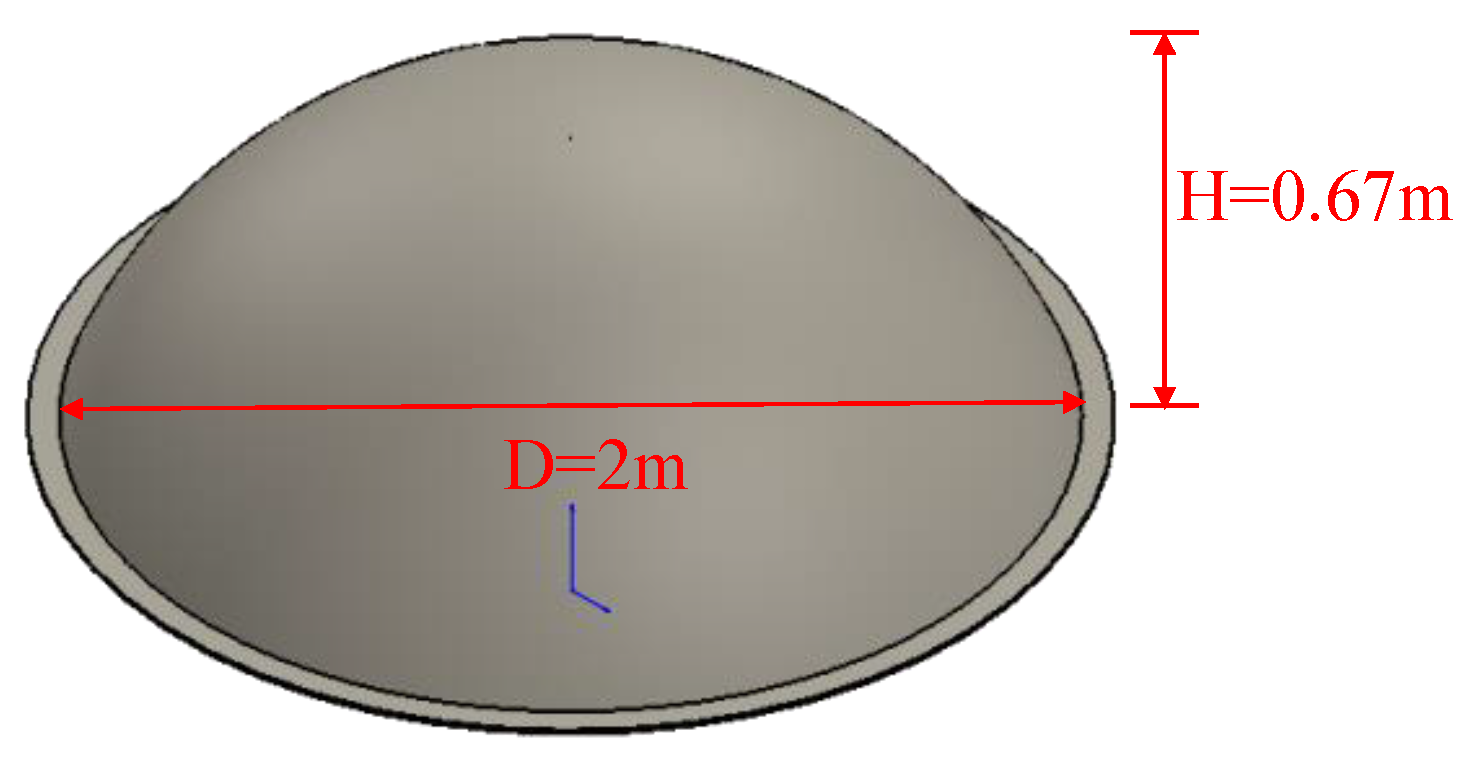
The apex height and base diameter of the prototype dome structure are 40 m and 120 m, respectively. A model scale of 1:60 is selected, and therefore, the scaled dome model has an apex height of H = 0.67 m and a base diameter of D = 2.0 m (Figure 3). The dome model is constructed with a smooth shell whose thickness is 9.0 mm. The blockage ratio, which is defined as the ratio of the projected area of the dome model and the test section of the WOW EF, is 0.7%. It is worth mentioning that the model scale of current testing is relatively large compared to previous studies; for example, the base diameters of the tested domes from other studies are mainly smaller than 1.0 m [1,2,3,4,5]. Such large-scale wind tunnel testing may improve the correspondence between wind tunnel testing results and actual pressure distribution on the prototype structure.

2.2. Introduction of WOW EF

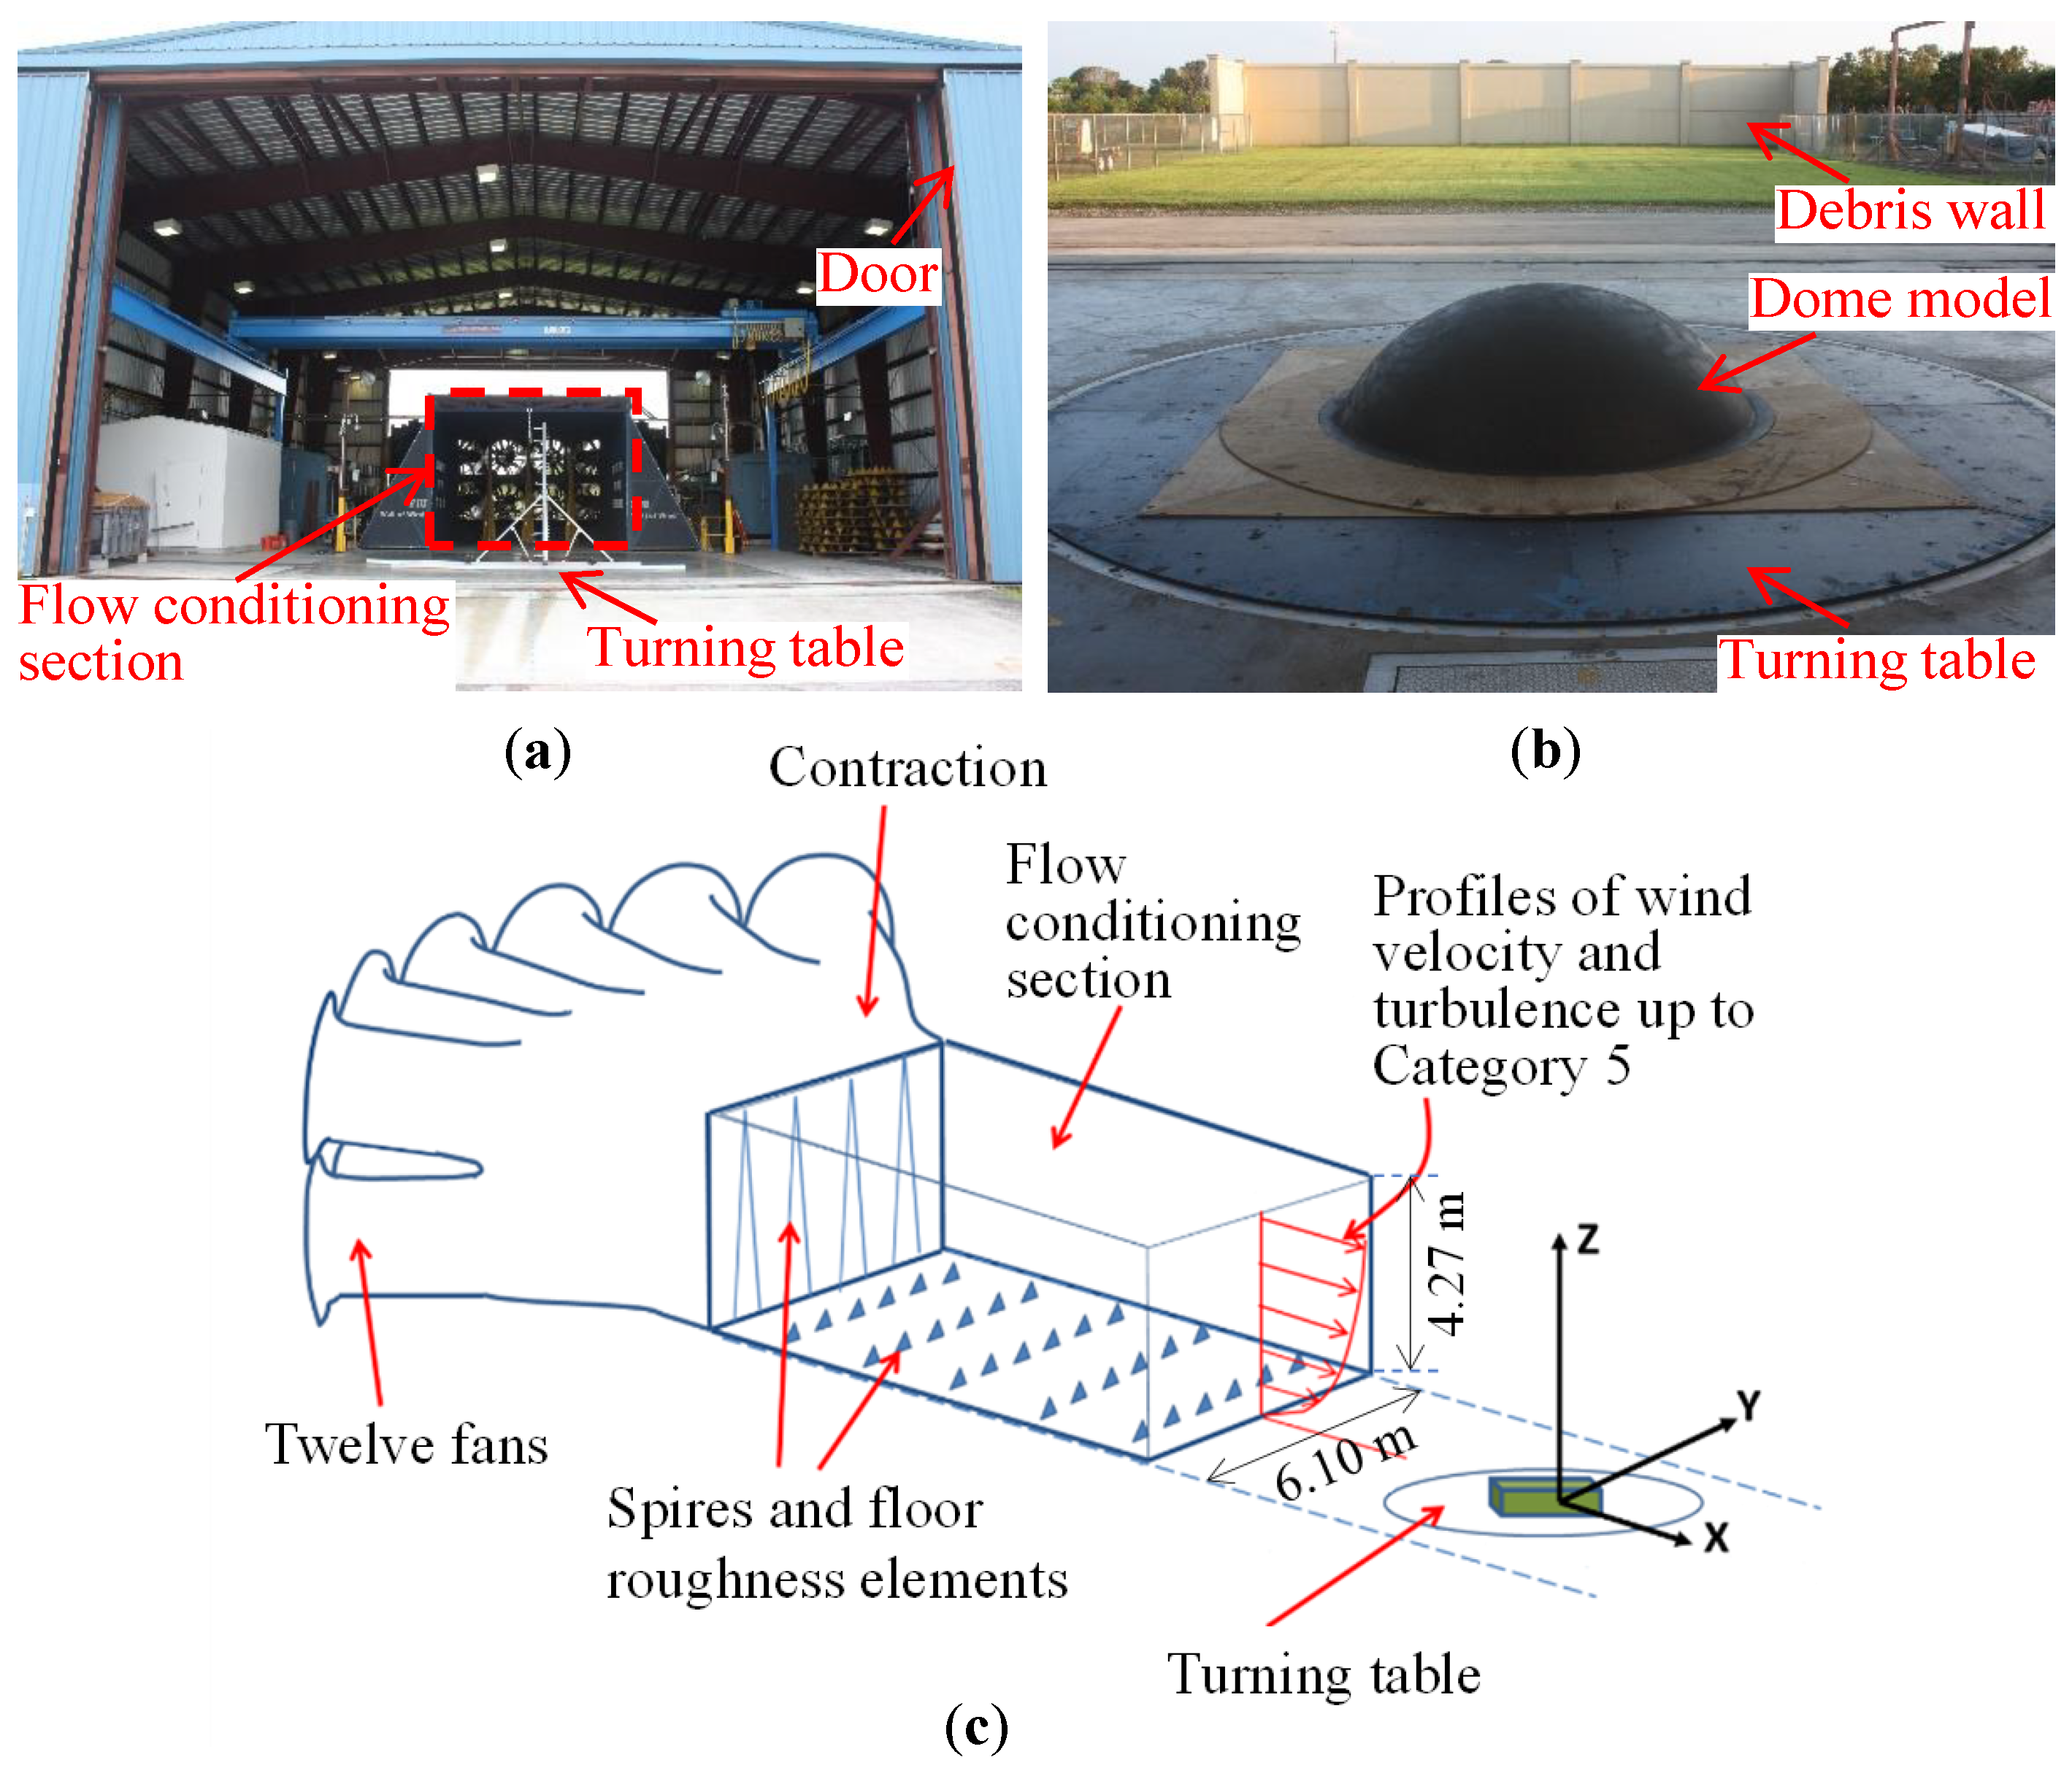
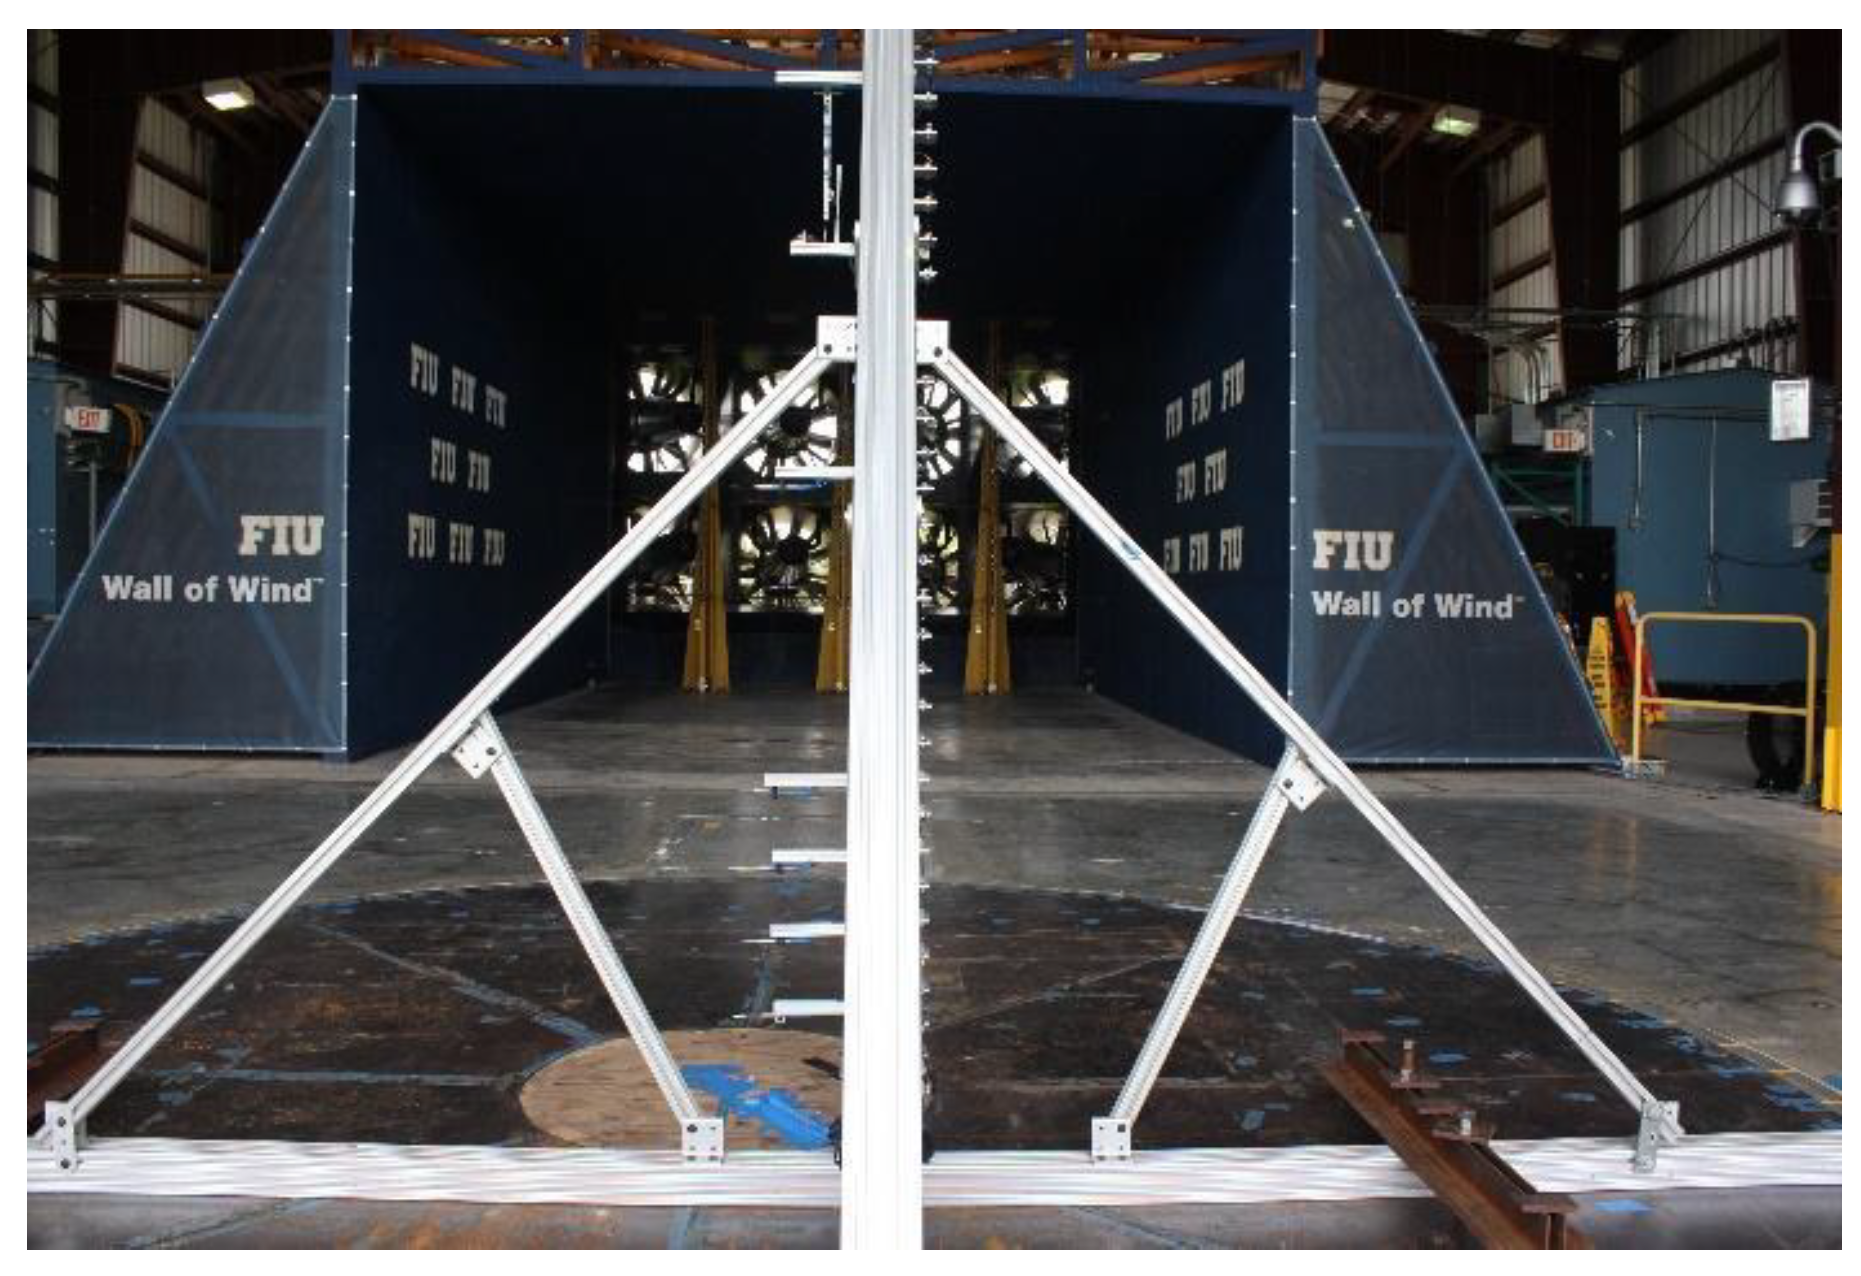
Figure 4 presents the WOW EF, which is a large wind tunnel with an open test section. As shown in Figure 4a, it is housed in a 30.5 m × 24.4 m × 10.7 m building with a gate of 15.24 m × 9.14 m. Wind-driven rain testing is allowed, and up to Category 5 wind speeds of 70.2 m/s can be generated by twelve fans at the South end. A small single-story building can be sufficiently immersed in the generated wind field, and thus, small structures can be tested at full scale to failure. The airflow travels through the flow conditioning section of 6.10 m × 4.27 m (Figure 4c), consisting of floor roughness elements and/or spires, to achieve target boundary layer characteristics and turbulence. A distance of 6.1 m away from the flow conditioning section is the turning table, whose diameter is 4.9 m. The debris wall, which is used to stop wind-borne debris, is located 60 m to the North of the turning table center (Figure 4b).

2.3. Experimental Setup

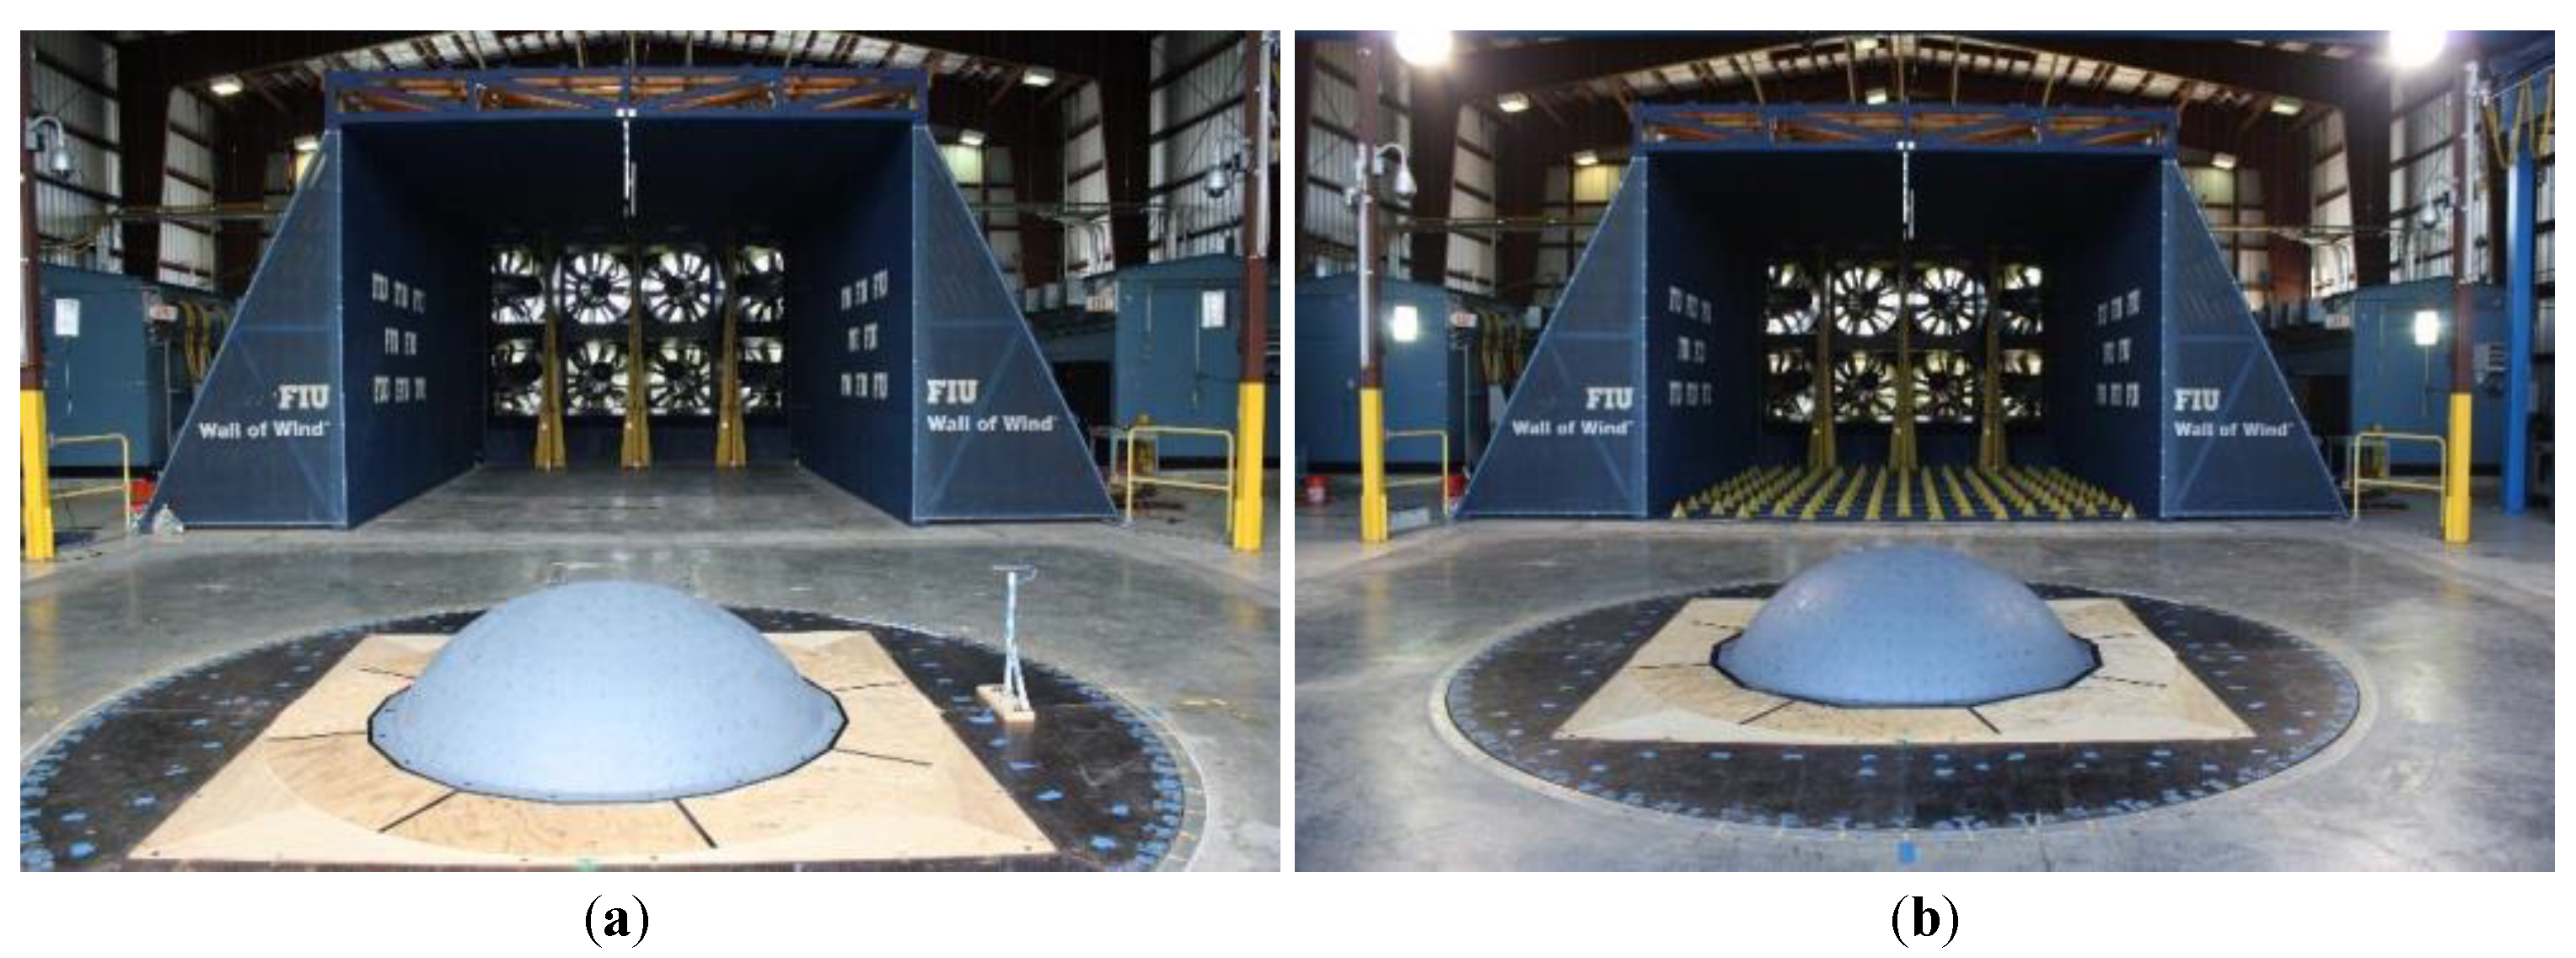
The coordinate system origin is defined at the turning table center where the dome model is located (Figure 5). When the northern part of the dome model sits in the North, the angle ( θ ) of the turning table is defined as 0°. When the turning table rotates clockwise, the positive angle ( + θ ) is defined. Both open and suburban terrain configurations are considered for the wind tunnel testing (Figure 6). Spires are used to generate open terrain configuration (Figure 6a), and both spires and surface roughness elements are used to generate suburban terrain configuration (Figure 6b).
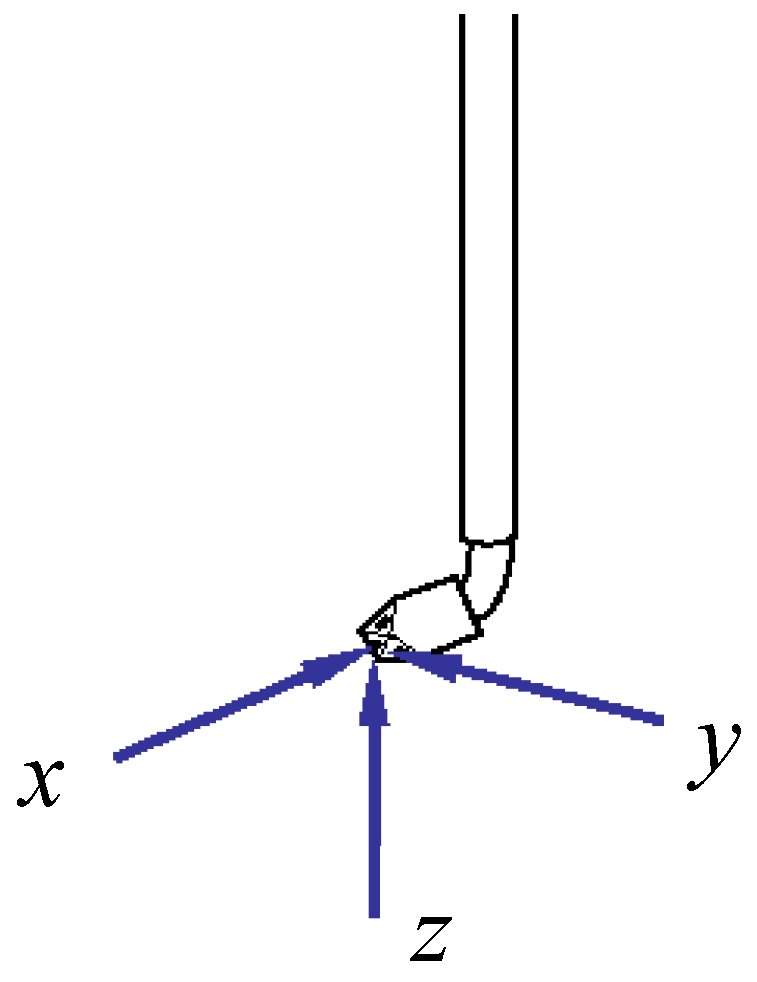
The Cobra Probe manufactured by Turbulent Flow Instrumentation is used to measure the flow field at a frequency of 2500 Hz. It is a four-hole pressure probe, and resolves three components of velocity and local static pressure in real-time. The local coordinate system of the Cobra Probe is illustrated in Figure 7, which is used to calculate velocity components of each probe.
The Cobra Probes are installed at different heights of 16.5 cm, 33.3 cm, 66.7 cm, and 133.4 cm to measure wind velocity profiles at the turning table center (X = 0 and Y = 0). In this case, the dome is removed from the wind tunnel (Figure 8), and the measurement is only made for open terrain configuration.
Figure 9 presents the arrangement of 384 pressure taps on the dome model, which are used to measure the surface pressure of the dome model. A small region in the positive Y direction is not covered, because of the availability of pressure taps. Scanivalve ZOC33 electronic pressure scanners are deployed for data collection at frequencies of 520 Hz. An amount of 64 piezoresistive pressure sensors with a range of ±0.254 m H 2 O are incorporated in each ZOC33 module, which are connected to pressure taps with PVC-105-16 tubing. The PVC tubing is 0.3 m long on the side of the tap hole, and 0.6 m long on the side of the sensor. A piece of steel tubing is used to connect the two PVC tubing pieces.

2.4. Testing Cases

Three different cases for the wind tunnel testing were conducted (Table 1). In Case 1, open terrain configuration is considered for the wind field and the dome is removed. In Cases 2–3, the dome is placed in the wind tunnel. The open terrain is employed in Case 2, while the suburban terrain is employed in Case 3. Within each case, three different levels of velocity are generated, i.e., 24 m/s (Level I), 34 m/s (Level II), and 44 m/s (Level III) at the height of 0.167 m (corresponding to 10 m in full scale).

3. Experimental Results and Discussion

3.1. Mean Velocity Profile

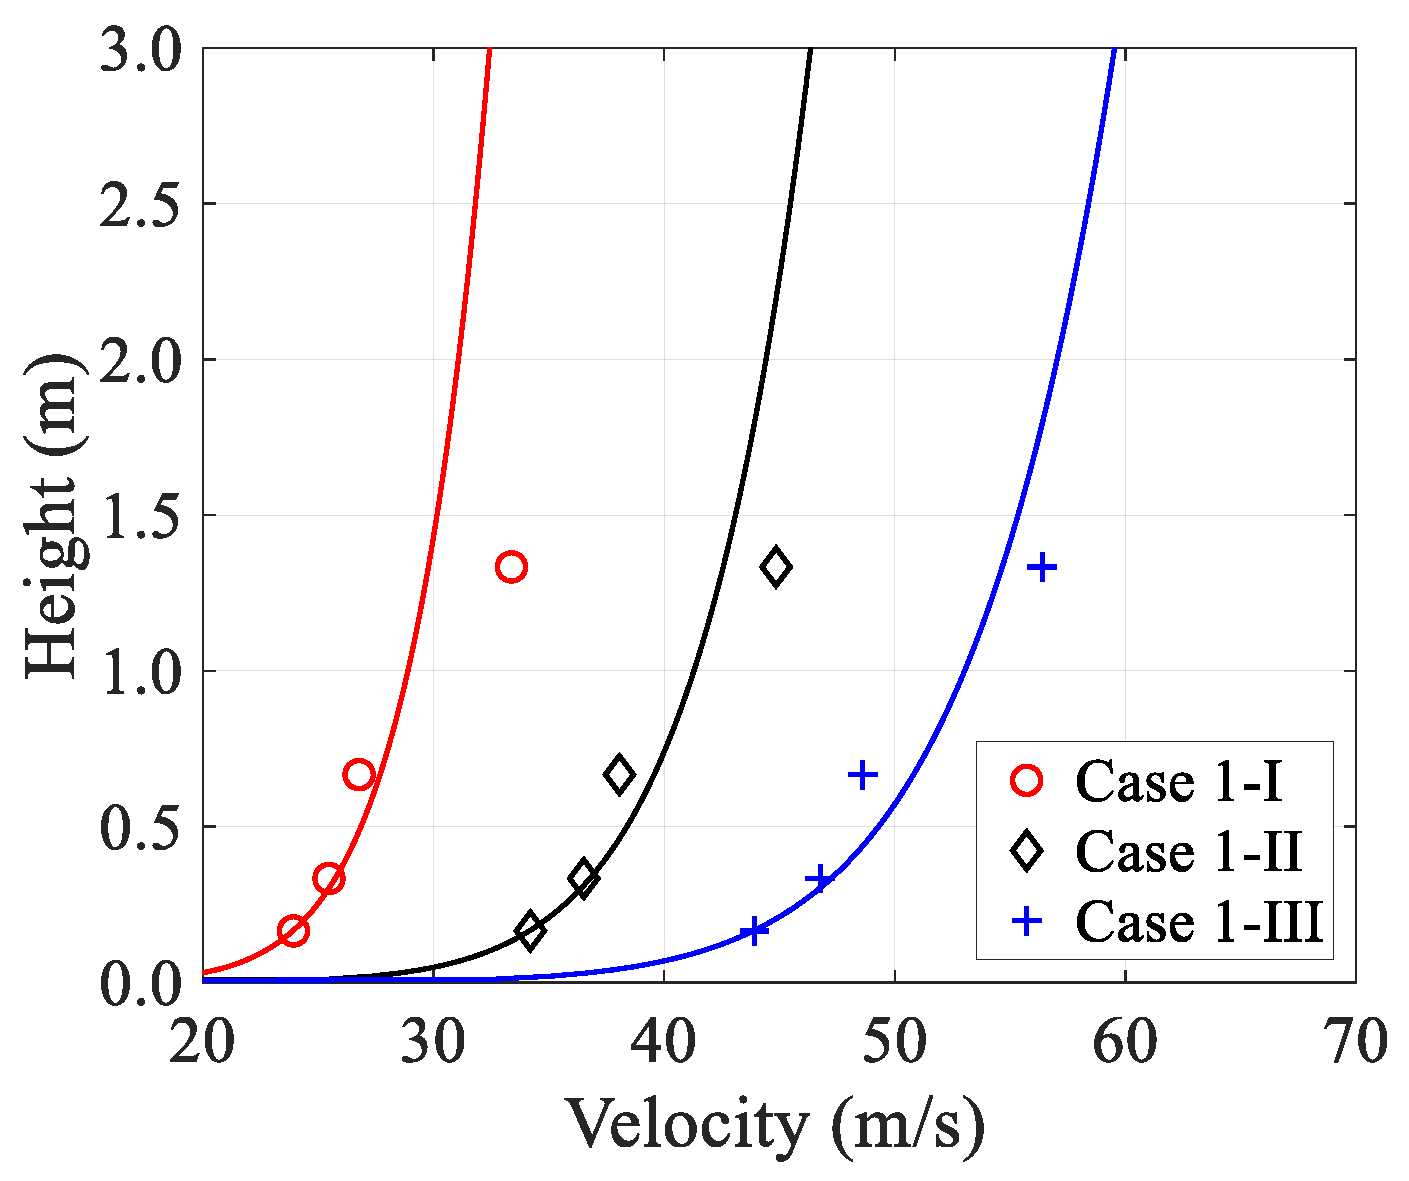
Profiles of mean wind velocity measured over the open terrain without the dome (Case 1) are depicted in Figure 10. Three different levels of velocity are generated, which are specified by the wind speed at the height of 0.167 m, 24 m/s (Level I), 34 m/s (Level II), and 44 m/s (Level III). To reduce measurement uncertainties, the first and last 10 s of each velocity time history are removed, and then the mean wind velocity is determined based on the middle range of the record. As the elevation increases, the mean velocity increases. The power law is used to fit mean velocity profiles, and the applied exponent is 9.5 for the Open terrain (Surface Roughness C) based on ASCE 7–16 [35]. The coefficients of determination (R2) of the power law fit for velocity Level I, Level II, and Level III are 0.75, 0.88, and 0.91, respectively. The mean velocity profile at Level III agrees with the power law the best.

3.2. Turbulence Intensity and Integral Length Scale

Turbulence of the airflow is characterized by a scale expressed as a percentage, that is, turbulence intensity (TI). It is defined as the ratio of root-mean-square of the fluctuating wind velocity to the mean velocity, according to the measured velocity time series (Equation (1)).
I = u U u = 1 3 ( u X 2 + u Y 2 + u Z 2 ) U = U X 2 + U Y 2 + U Z 2
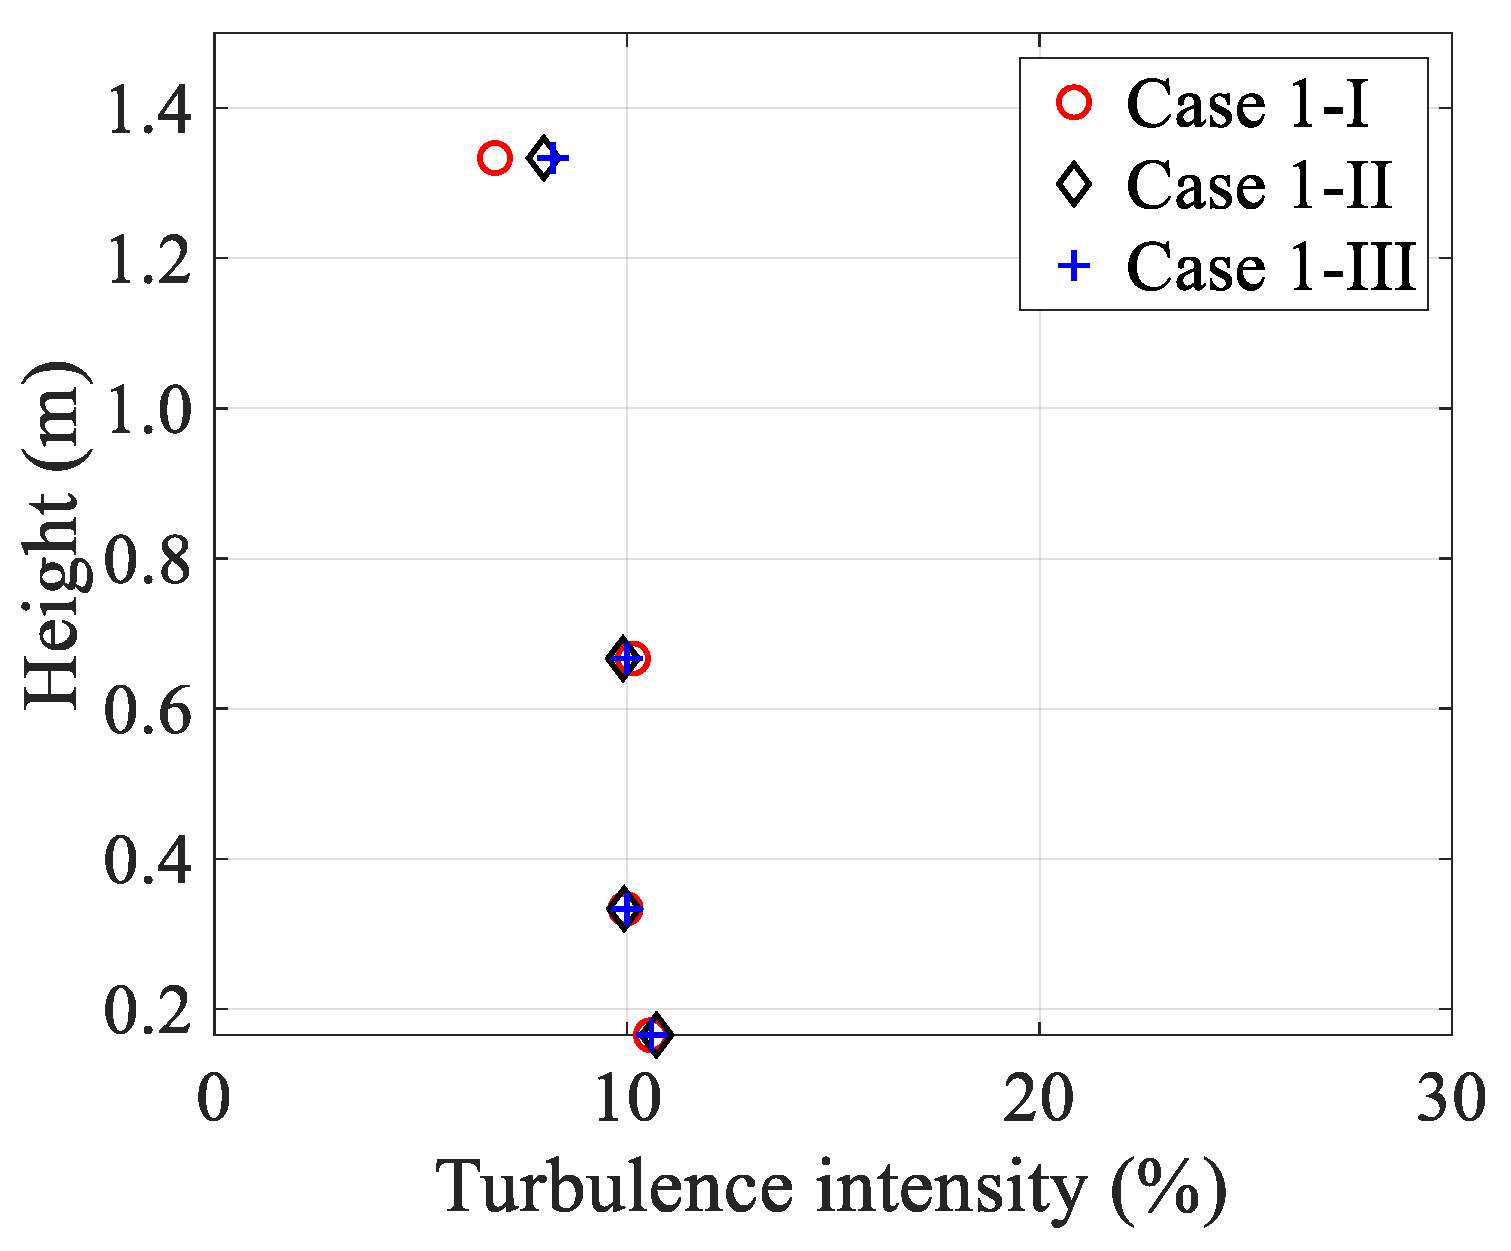
where u is the root-mean-square of the fluctuating components of the measured velocity; U is the mean wind velocity over the same time period; three velocity components are indicated by subscripts X, Y, and Z. Figure 11 shows the TI for Case 1 over the open terrain, based on Equation (1). The TI slightly decreases with the increasing height. In general, they are all around 10% at different heights.
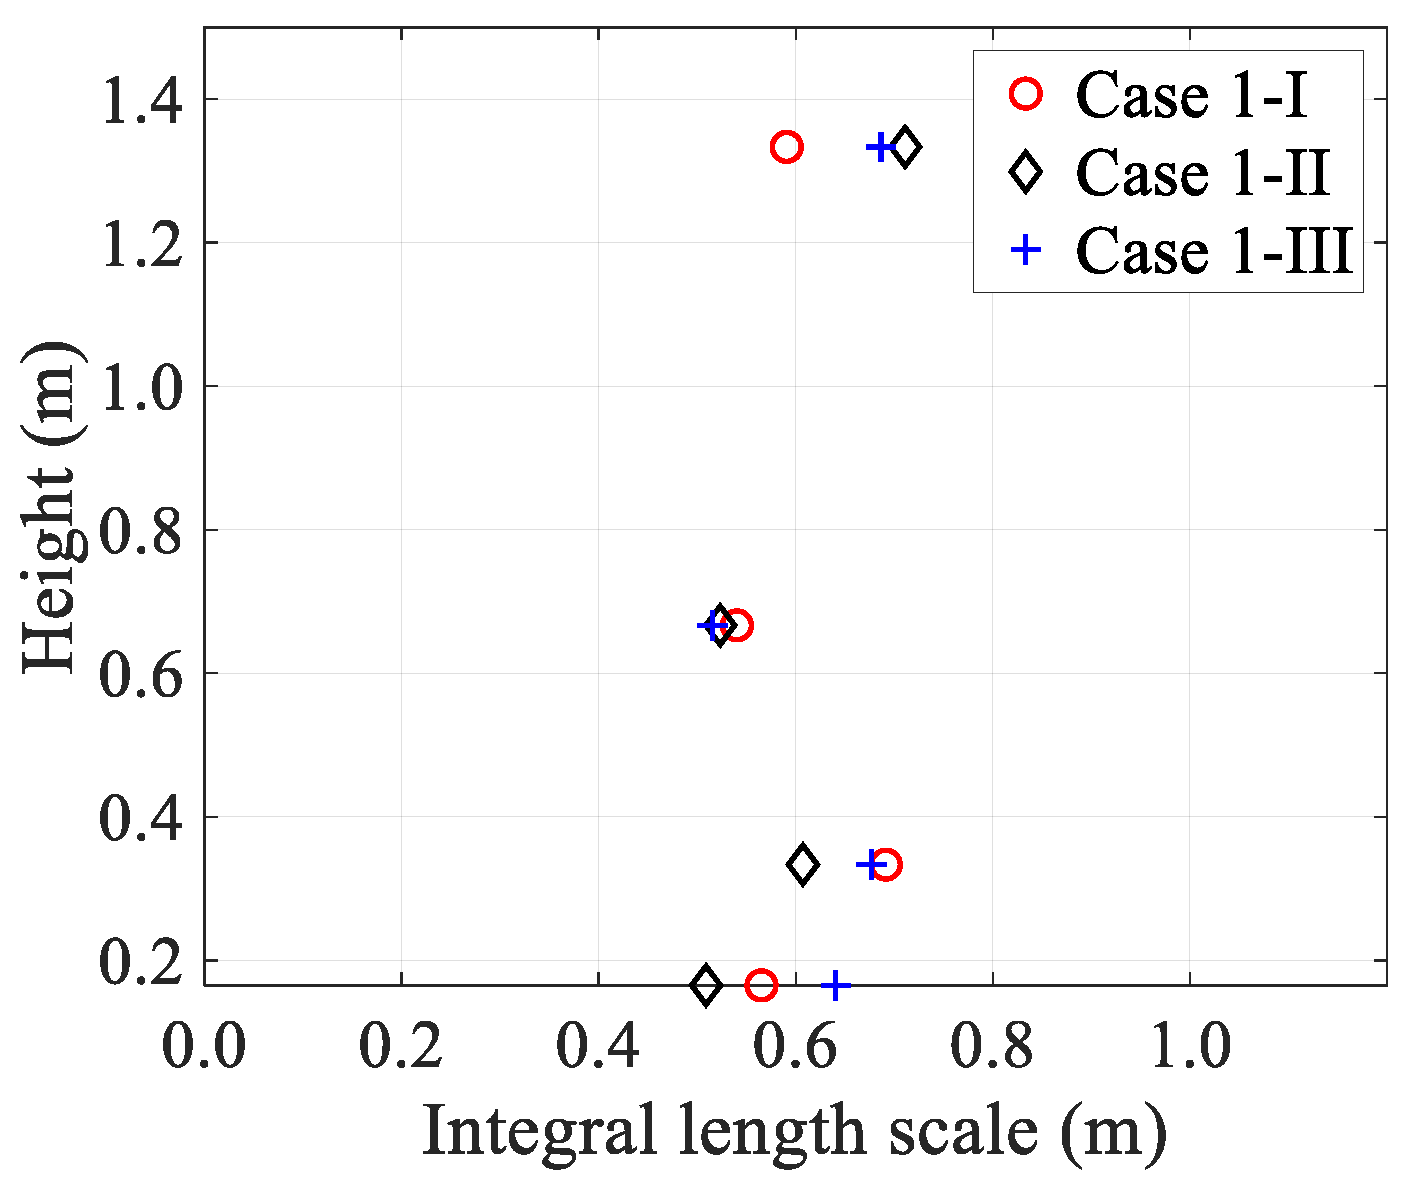
The integral length scale of turbulence is a measure of the average size of turbulent eddies. There is a total of nine length scales, representing three dimensions of the eddies associated with the longitudinal, transverse, and vertical components of the fluctuating velocity [36]. For example, L X u indicates the average longitudinal size of the eddy related to the longitudinal velocity fluctuations, as defined in Equation (2) based on Taylor’s hypothesis and the assumption that the flow disturbance travels with the velocity U X [37]. The calculated L X u is presented in Figure 12, which ranges from 0.5 m to 0.7 m. L X u is more randomly distributed, since no obvious tendency is found along height or among different cases.
L X u = U X u X 2 0 R ( τ ) d τ
where R ( τ ) is the autocovariance function of the longitudinal velocity fluctuations.

3.3. Power Spectral Density

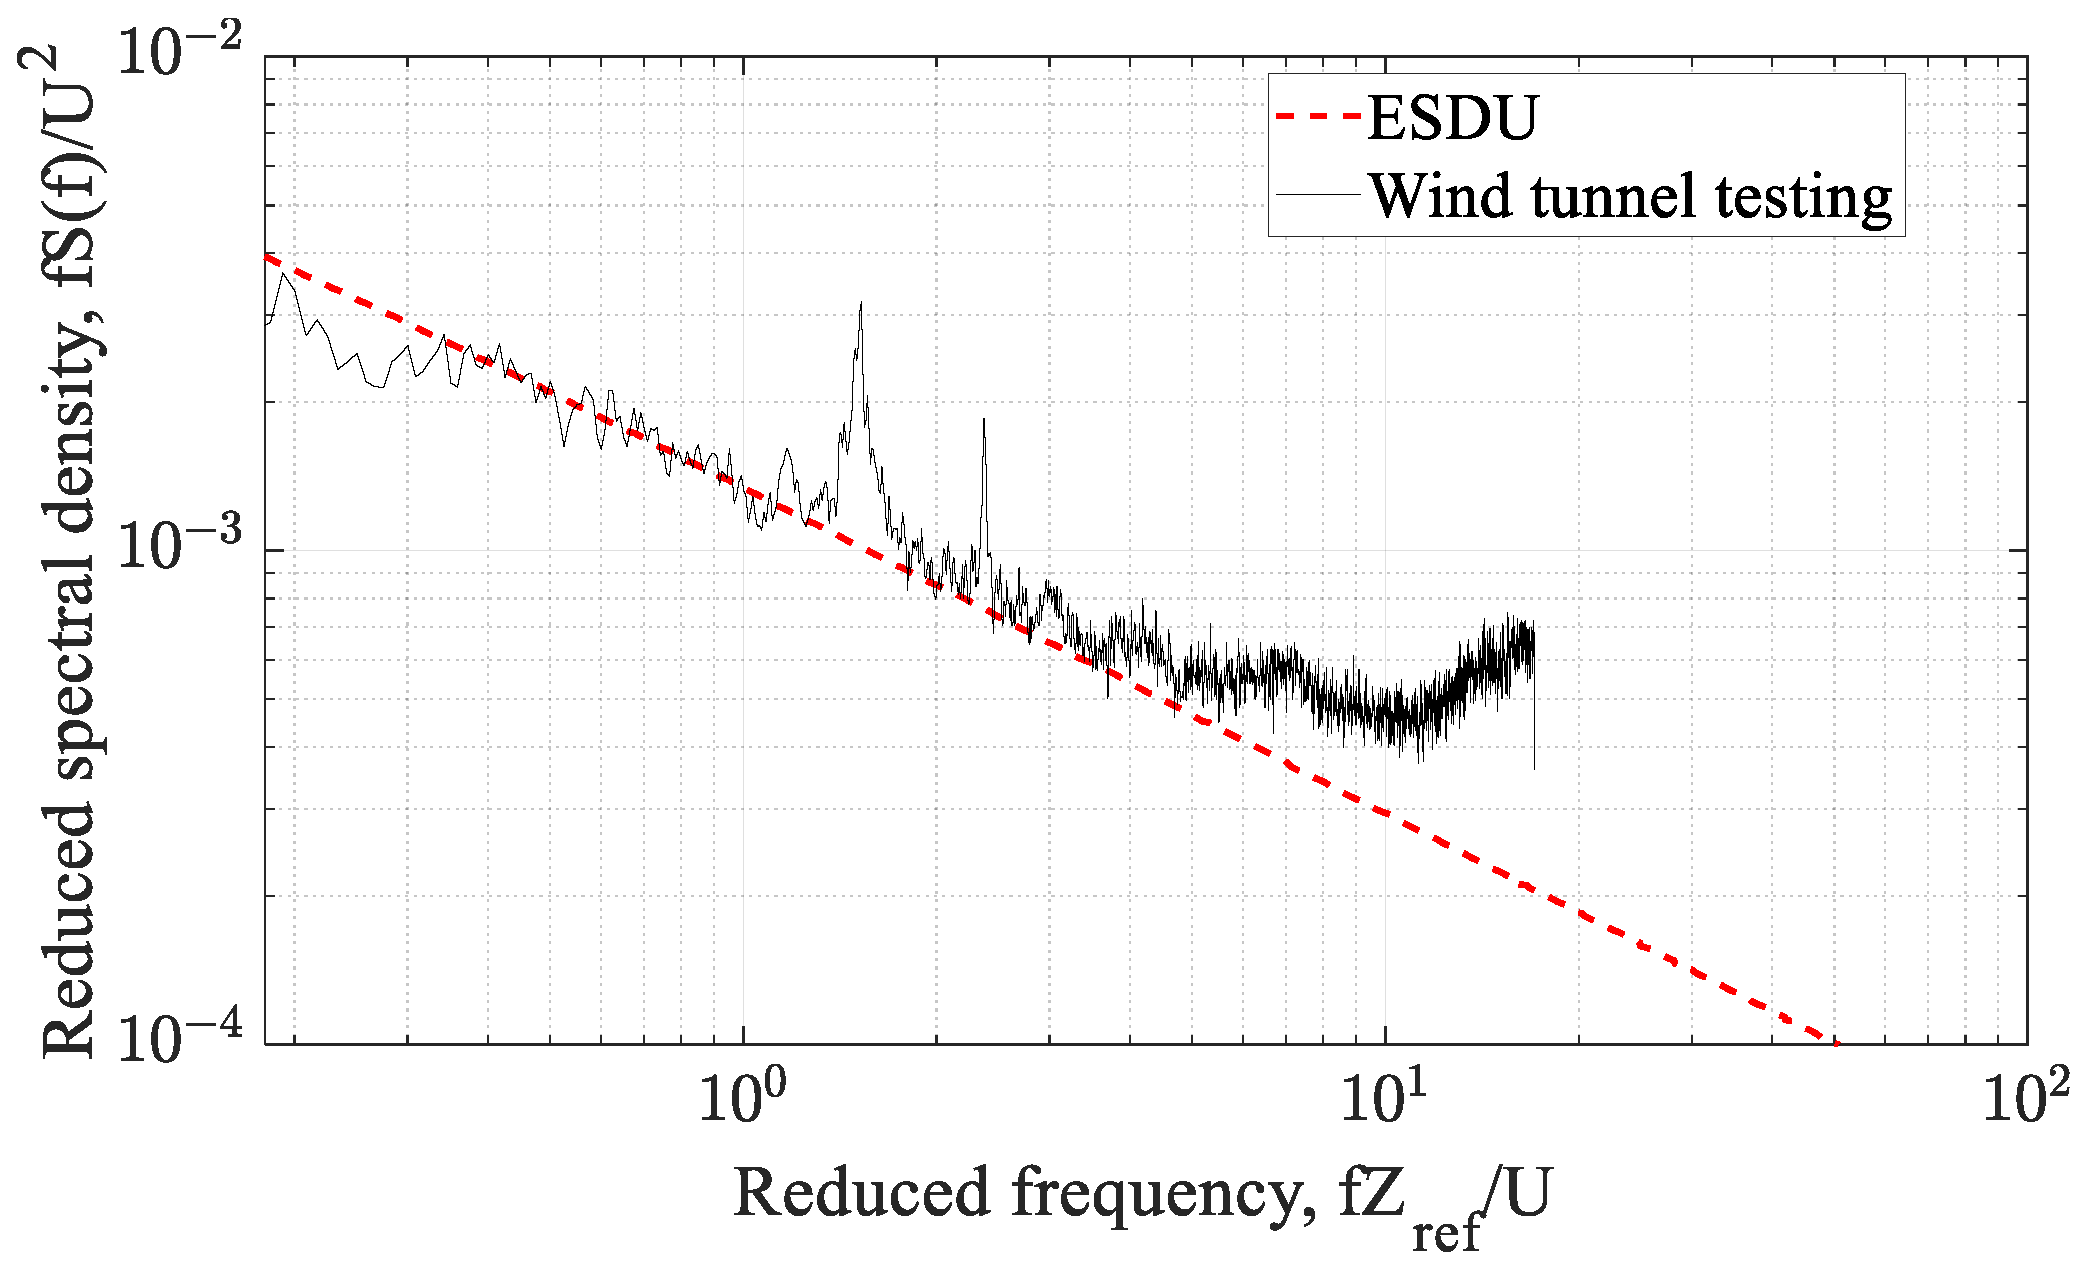
Figure 13 presents the power spectral density (PSD) of velocity in the along-wind direction at a height of 0.67 m (dome apex) for Case 1-III over the open terrain. The measured PSD agrees fairly well with the ESDU spectrum, except at around 10 Hz where the experimental data are higher.

3.4. Reynolds Number

The Reynolds number is the ratio of inertial to viscous forces, which is defined as
R e = ρ V H μ
where ρ is the density of air (1.16 kg/m3), and it is determined based on the air temperature (30 °C), humidity (65%), and atmospheric pressure (101 kPa) at the time of the test; H is the apex height of the dome (0.67 m); V is the reference mean velocity at H (27 m/s, 38 m/s, and 49 m/s from Case 1 over the open terrain for respective velocity level); μ is dynamic viscosity of air when the air temperature is 30 °C (1.86 × 10⁻⁵ N·s/m2). Based on Equation (3), the Reynolds numbers for three levels of velocity in Case 1 without the dome model are determined as 1.13 × 10⁶, 1.59 × 10⁶, and 2.05 × 10⁶, respectively.

3.5. Mean Pressure Coefficient on the Center Meridian of the Model

The dimensionless number, the pressure coefficient ( C P ), is used to describe the relative wind pressure acting on the dome model. It is normalized by the dynamic pressure at the apex of the dome as:
C P i = P i P r e f 1 2 ρ V 2
where P i P r e f is measured by the Scanivalve instrumentation, indicating the pressure difference between the local and reference pressure P r e f ; V is the reference mean velocity, which is the same as in Equation (3). In cases 2–3, the V from each wind speed level is used to calculate the pressure coefficient under the associated case, i.e., 27 m/s is used for wind speed level I, 38 m/s for wind speed level II, and 49 m/s for wind speed level III.
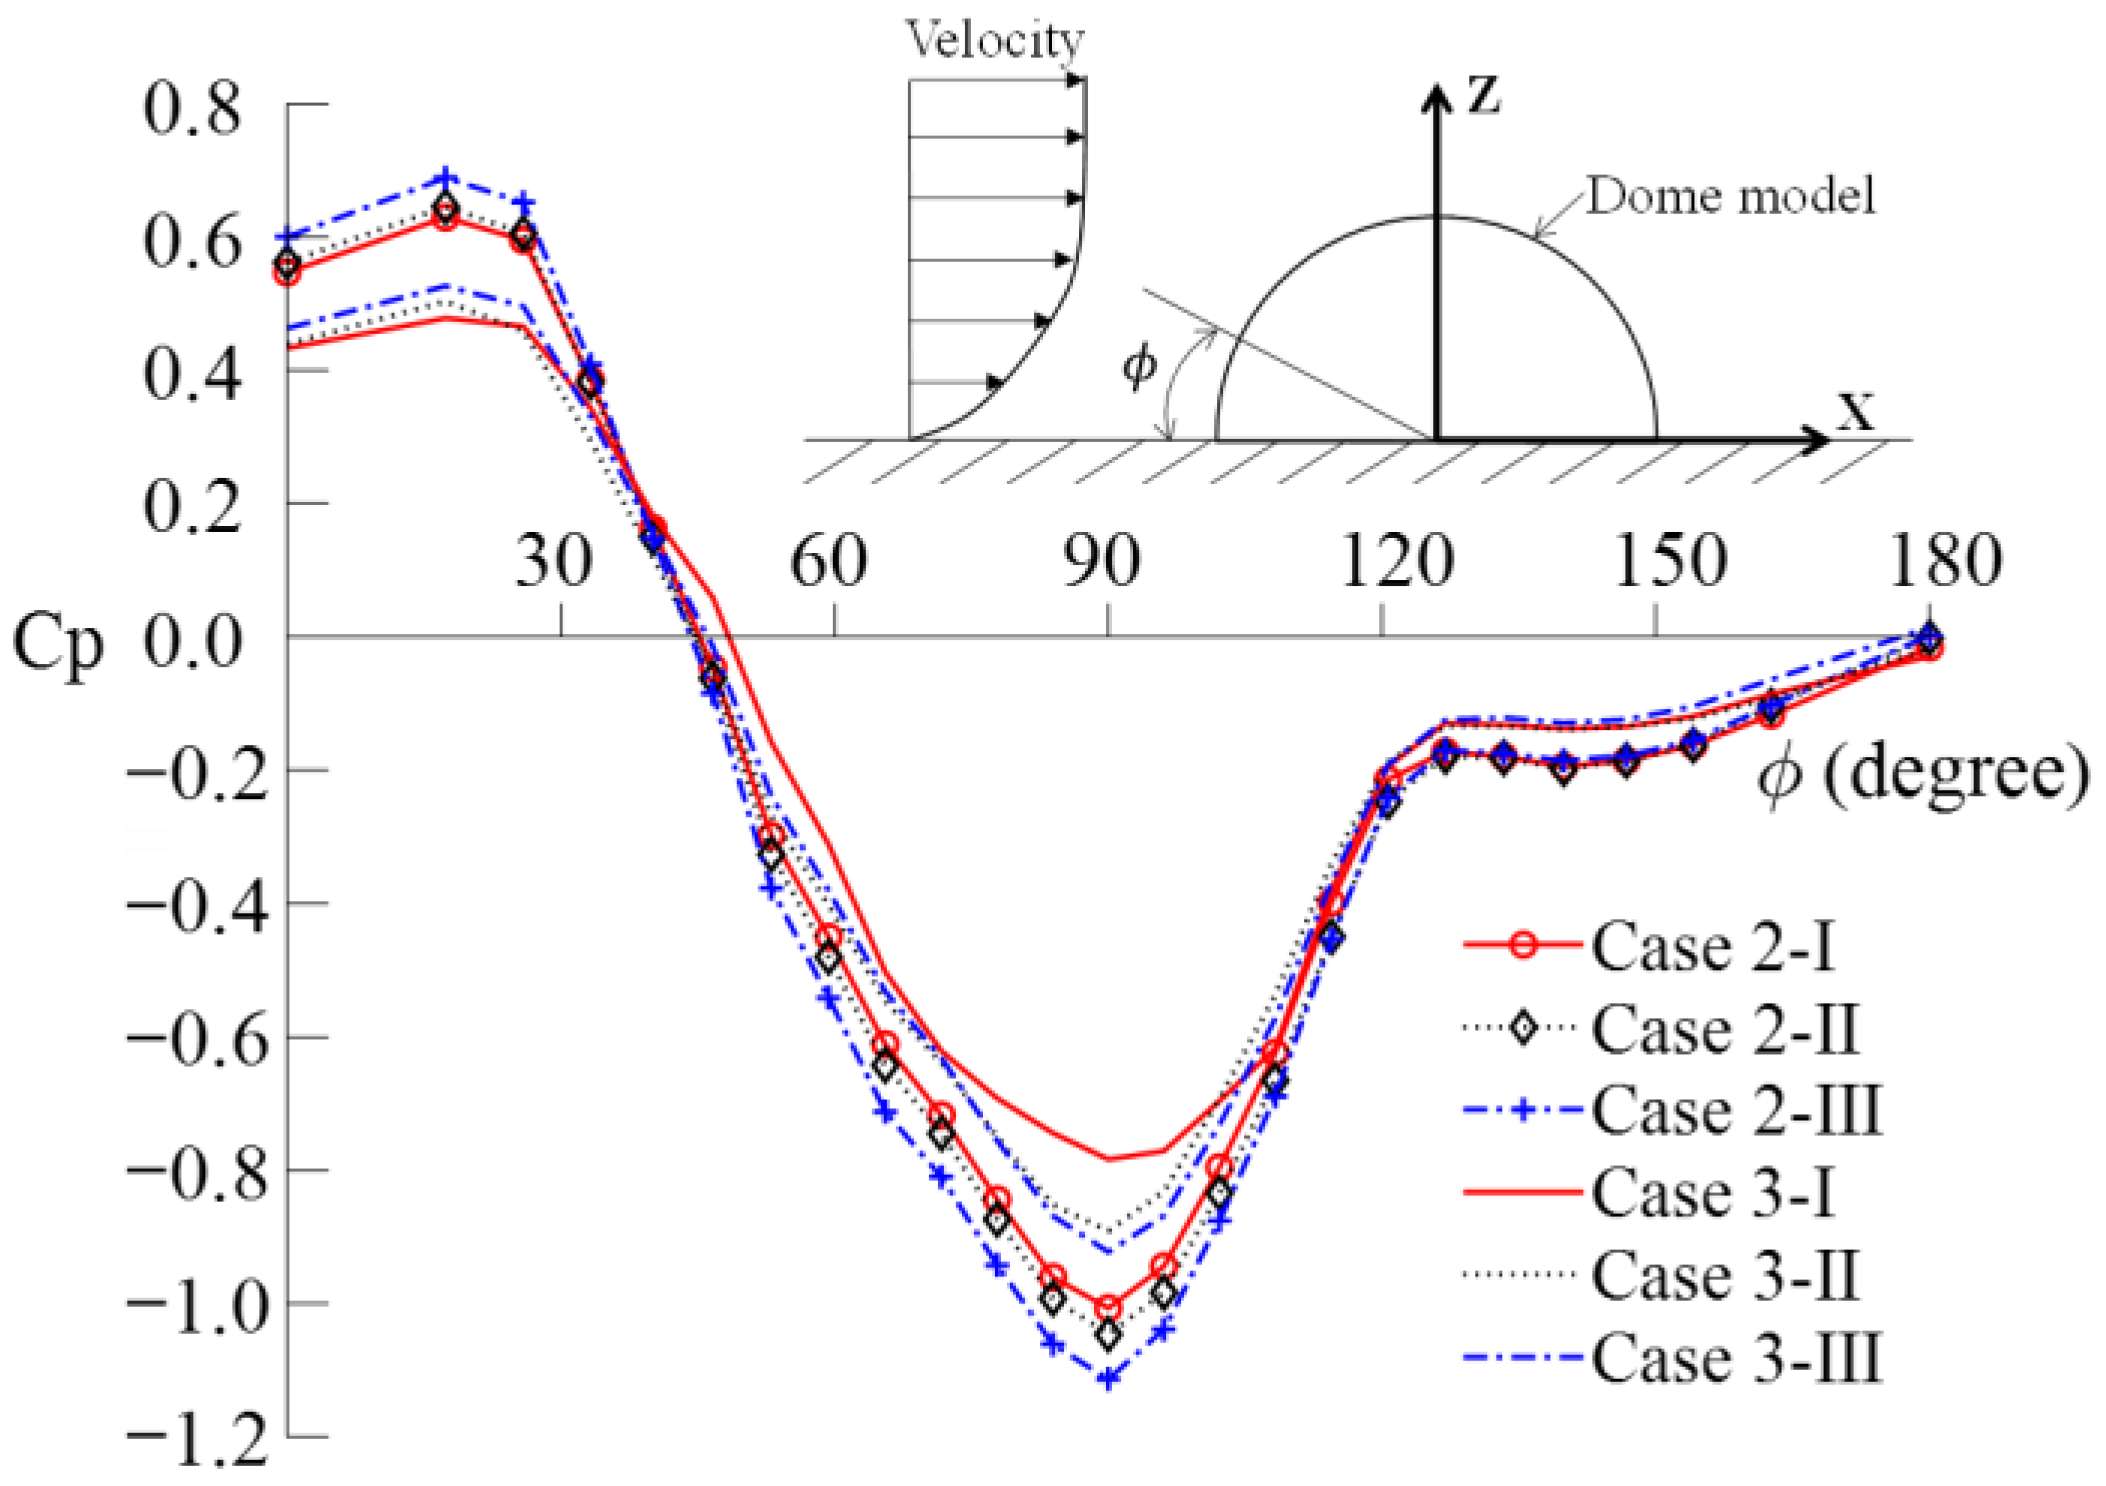
Mean pressure coefficients ( C P ) on the center meridian of the dome model are presented in Figure 14. For all Cases, the profiles are of a similar shape, which are consistent with other reported studies [1,2,5,7]. The maximum pressure occurs at an elevation of about 20 degrees, and the minimum pressure appears at around 90 degrees. At around 45 degrees, the positive pressure changes to negative pressure. In addition, the pressure coefficient generally increases with inflow wind velocity, and the magnitude of the pressure coefficient over the suburban terrain is lower than that over the open terrain.
The results associated with Case 2-III are further compared to other studies with similar Reynolds numbers using smooth hemispheres in boundary layer flows [1,7]. Figure 15 indicates that the general trends among different studies are similar. A minor difference is found regarding the peak values of positive and negative pressure. At around 120 degrees, the curve of the present study is relatively different from the other two studies, implying that the pressure distribution on the leeward side of the dome may be different. This is probably due to different ratios of the model height to the diameter, which is 0.335 in the present study and is 0.5 for the other two studies.

3.6. Wind Pressure Distribution on Dome Surface

3.6.1. Open Terrain

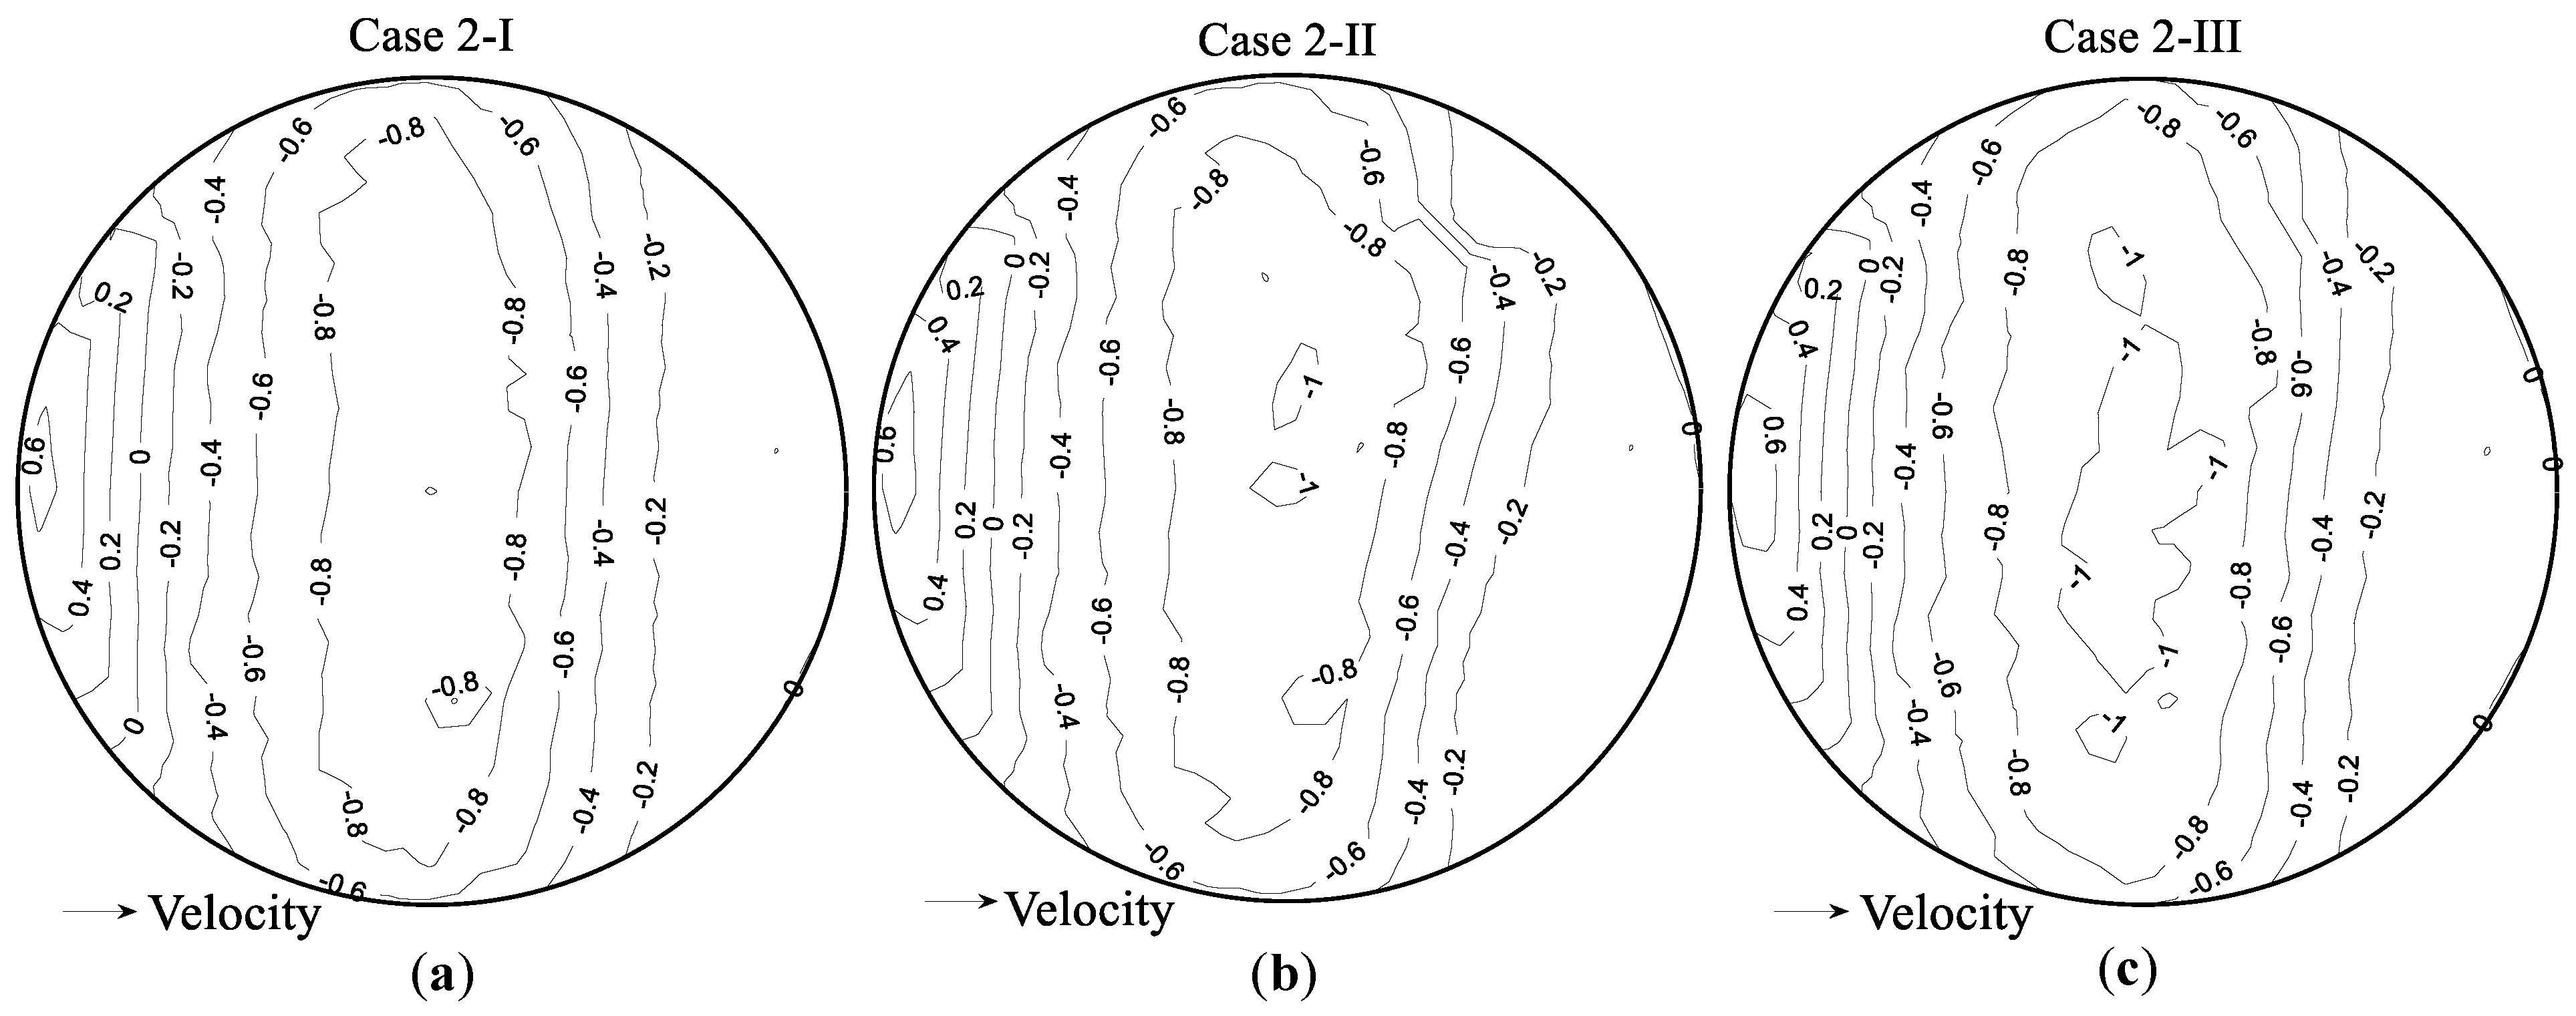
Figure 16 shows the wind pressure distribution on the dome surface over the open terrain. For each velocity level, the wind velocity ramps from 0% to the target wind velocity, and then keeps constant for 60 s. The mean pressure coefficient is calculated according to time averaging of the middle 40 s (10–50 s) from the last 60 s dataset, in order to reduce measurement uncertainties. As illustrated in Figure 9, a small top region of the dome surface in the positive Y direction is not covered by pressure taps, and the associated wind pressure distribution is unknown. To tackle this problem, the wind pressure of the unmeasured region is mapped from the corresponding region in the negative Y direction. Figure 16 indicates that the patterns of pressure coefficients are similar for all three velocity levels. Positive pressure occurs on the windward side and negative (suction) pressure occurs at the dome apex and on the leeward side. The maximum positive pressure coefficient occurs near the base of the dome, which is around 0.6. Negative pressure decreases when moving from the base of the dome to the apex of the dome, and the minimum negative pressure coefficient occurs over the apex of the dome, which is around −1.0. Then, negative pressure increases towards the leeward edge, and the negative pressure coefficient near the base of the dome on the leeward side is around −0.2. Among the three velocity levels, the area enclosed by the isoline of 0.6 near the base increases with the increase of wind speed. For the area enclosed by the isoline of −1.0, only a small area appears for Case 2-I, a slightly larger area for Case 2-II, and a very large area for Case 2-III. This indicates that when the wind speed increases, the larger region of the dome surface is exposed to extreme negative or suction wind pressure, implying that the dome withstands greater wind forces.

3.6.2. Suburban Terrain

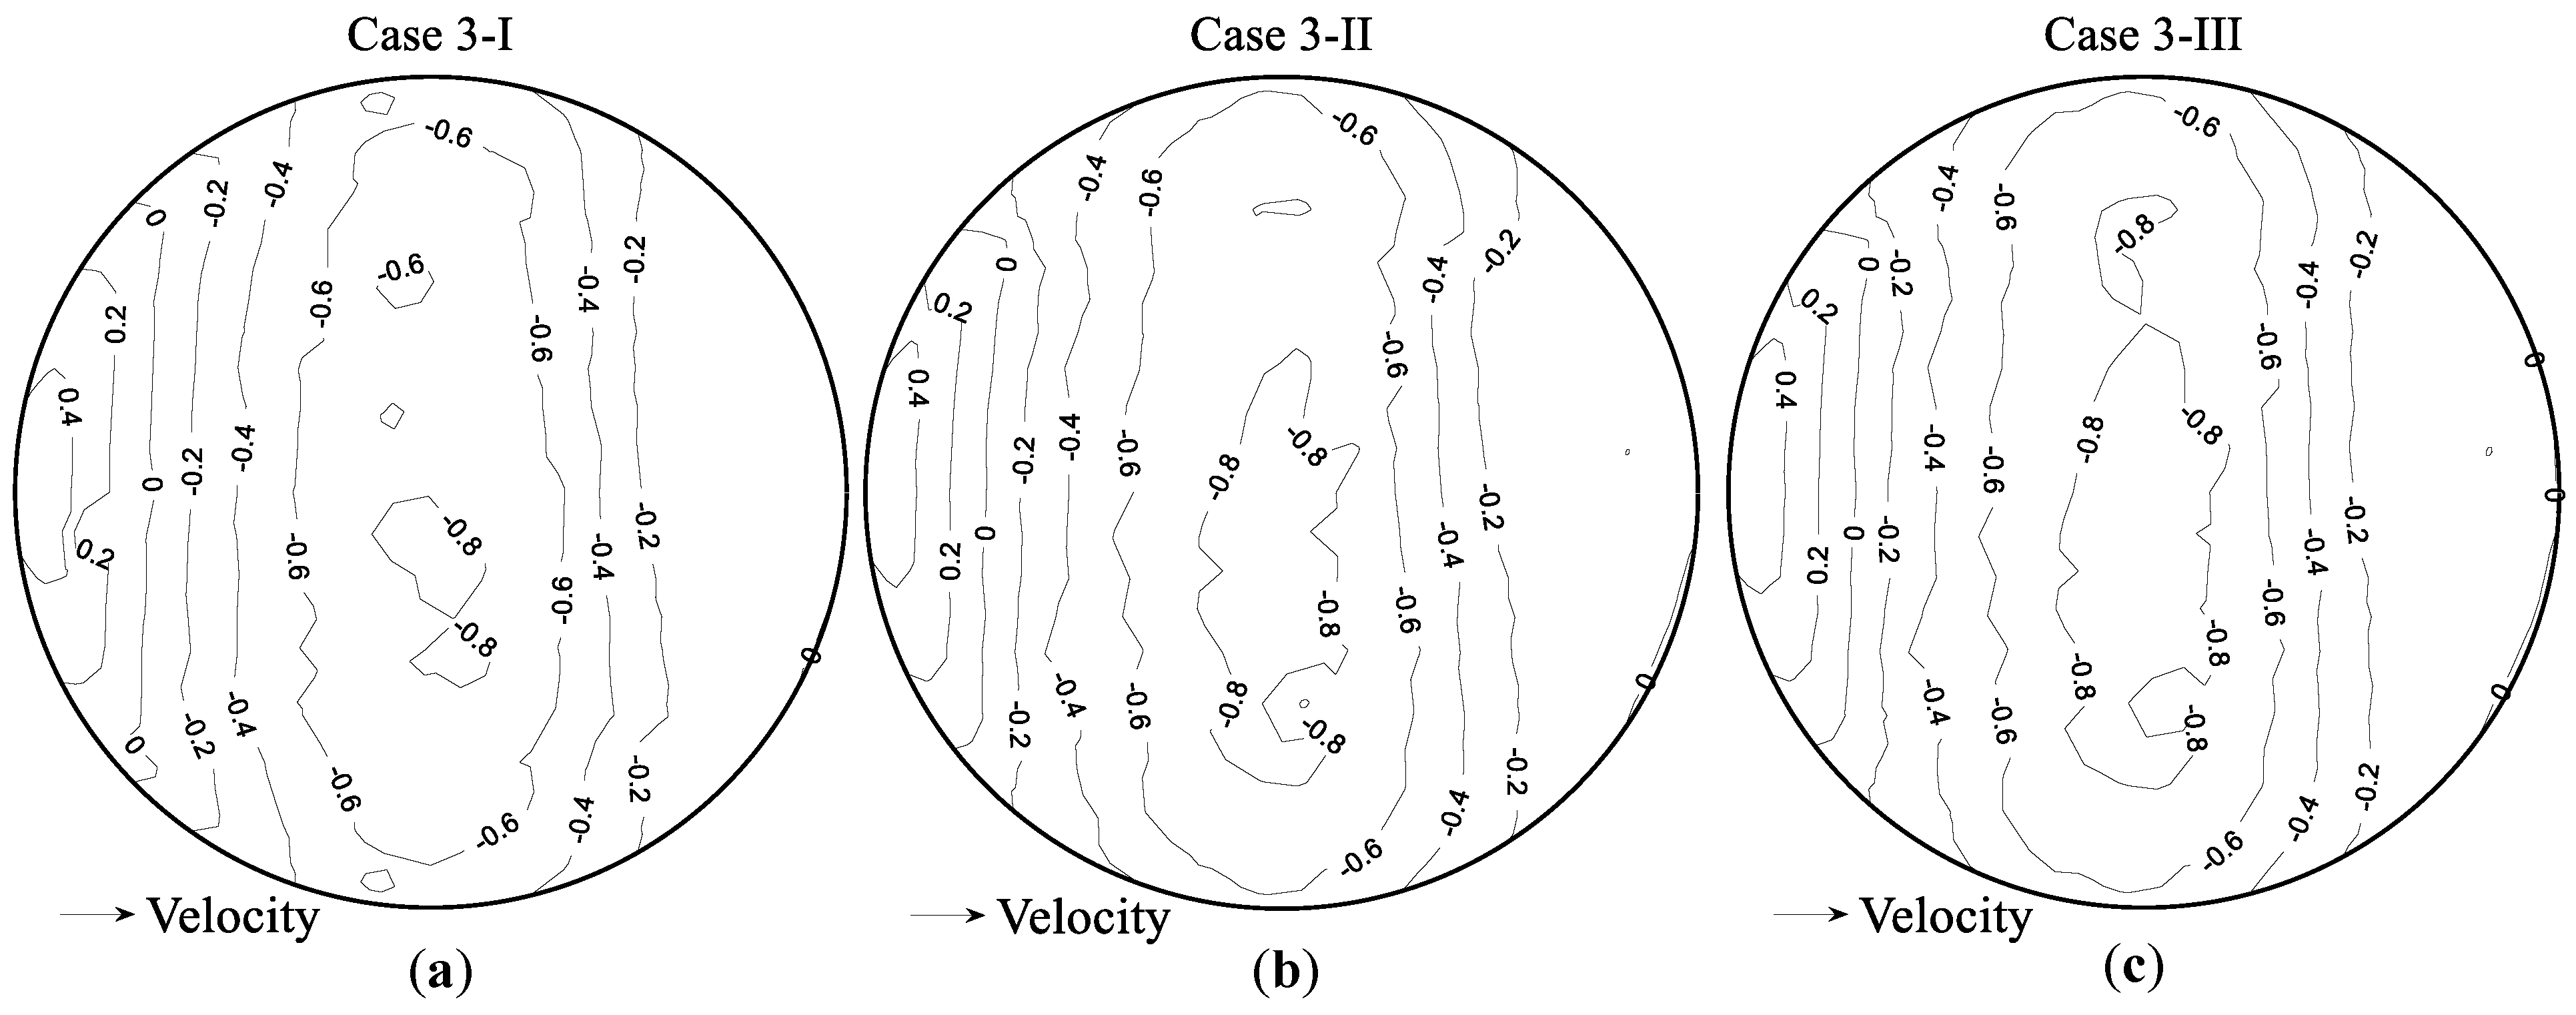
Figure 17 presents the wind pressure distribution over the suburban terrain. The same strategies of wind tunnel testing and data processing are used for the suburban terrain as those for the open terrain. Compared to Figure 16, a similar pattern of wind pressure distribution is found for the two different terrains. However, lower absolute values of both positive and negative pressure coefficients are encountered for the suburban terrain. This is probably caused by higher surface roughness resulting from the suburban terrain.

3.7. Force and Moment Coefficient

All forces and moments exerted onto the dome are calculated based on the integration of the surface pressure. Table 2 lists calculated forces and moments for both terrains. The most significant wind load is suction force ( F Z ). Because the dome and wind pressure distribution on the dome surface are symmetric, the overturning moment M X , the rotational moment M Z , and the drag force F Y are very small, which can be neglected. In terms of F X and M Y , they generally increase when the wind velocity increases.
Force and moment coefficients are also compared, which are normalized by the dynamic pressure as defined in Equation (5). Table 3 lists the calculated force and moment coefficients. The suction force coefficient is also the largest among all coefficients. However, the difference of the suction force coefficient among different velocity levels is smaller because of normalization. For example, the difference of the suction force coefficient between Case 2-I and Case 2-III is around 9%, but such a difference of suction force is around 72%.
C F X = F X 1 2 ρ V 2 A ,   C M X = M X 1 2 ρ V 2 A H C F Y = F Y 1 2 ρ V 2 A ,   C M Y = M Y 1 2 ρ V 2 A H C F Z = F Z 1 2 ρ V 2 A ,   C M Z = M Z 1 2 ρ V 2 A H
where F X , F Y , and F Z are forces exerted onto the dome; M X , M Y , and M Z are moments exerted onto the dome; H is the height of the dome apex (0.67 m); A is the projected area of the dome model on a plane parallel to the cross-section of the wind tunnel ( 0.97   m 2 ); V is the reference mean velocity at the dome apex (27 m/s, 38 m/s, and 49 m/s from Case 1 for three velocity levels).

4. Numerical Simulations and Discussion of Results

In the study, the commercial code Fluent 19.2 is utilized to numerically simulate the wind tunnel test. The profile of the mean velocity measured at the turning table center without the dome model is used as the velocity input. Since the profile of the mean velocity is measured over the open terrain, only the wind tunnel test over the open terrain with maximum wind velocity is numerically simulated, that is, Case 2-III. In addition, the Reynolds numbers of the numerical simulation and the wind tunnel test are the same.

4.1. Numerical Simulations of Wind Tunnel Testing

4.1.1. Numerical Model

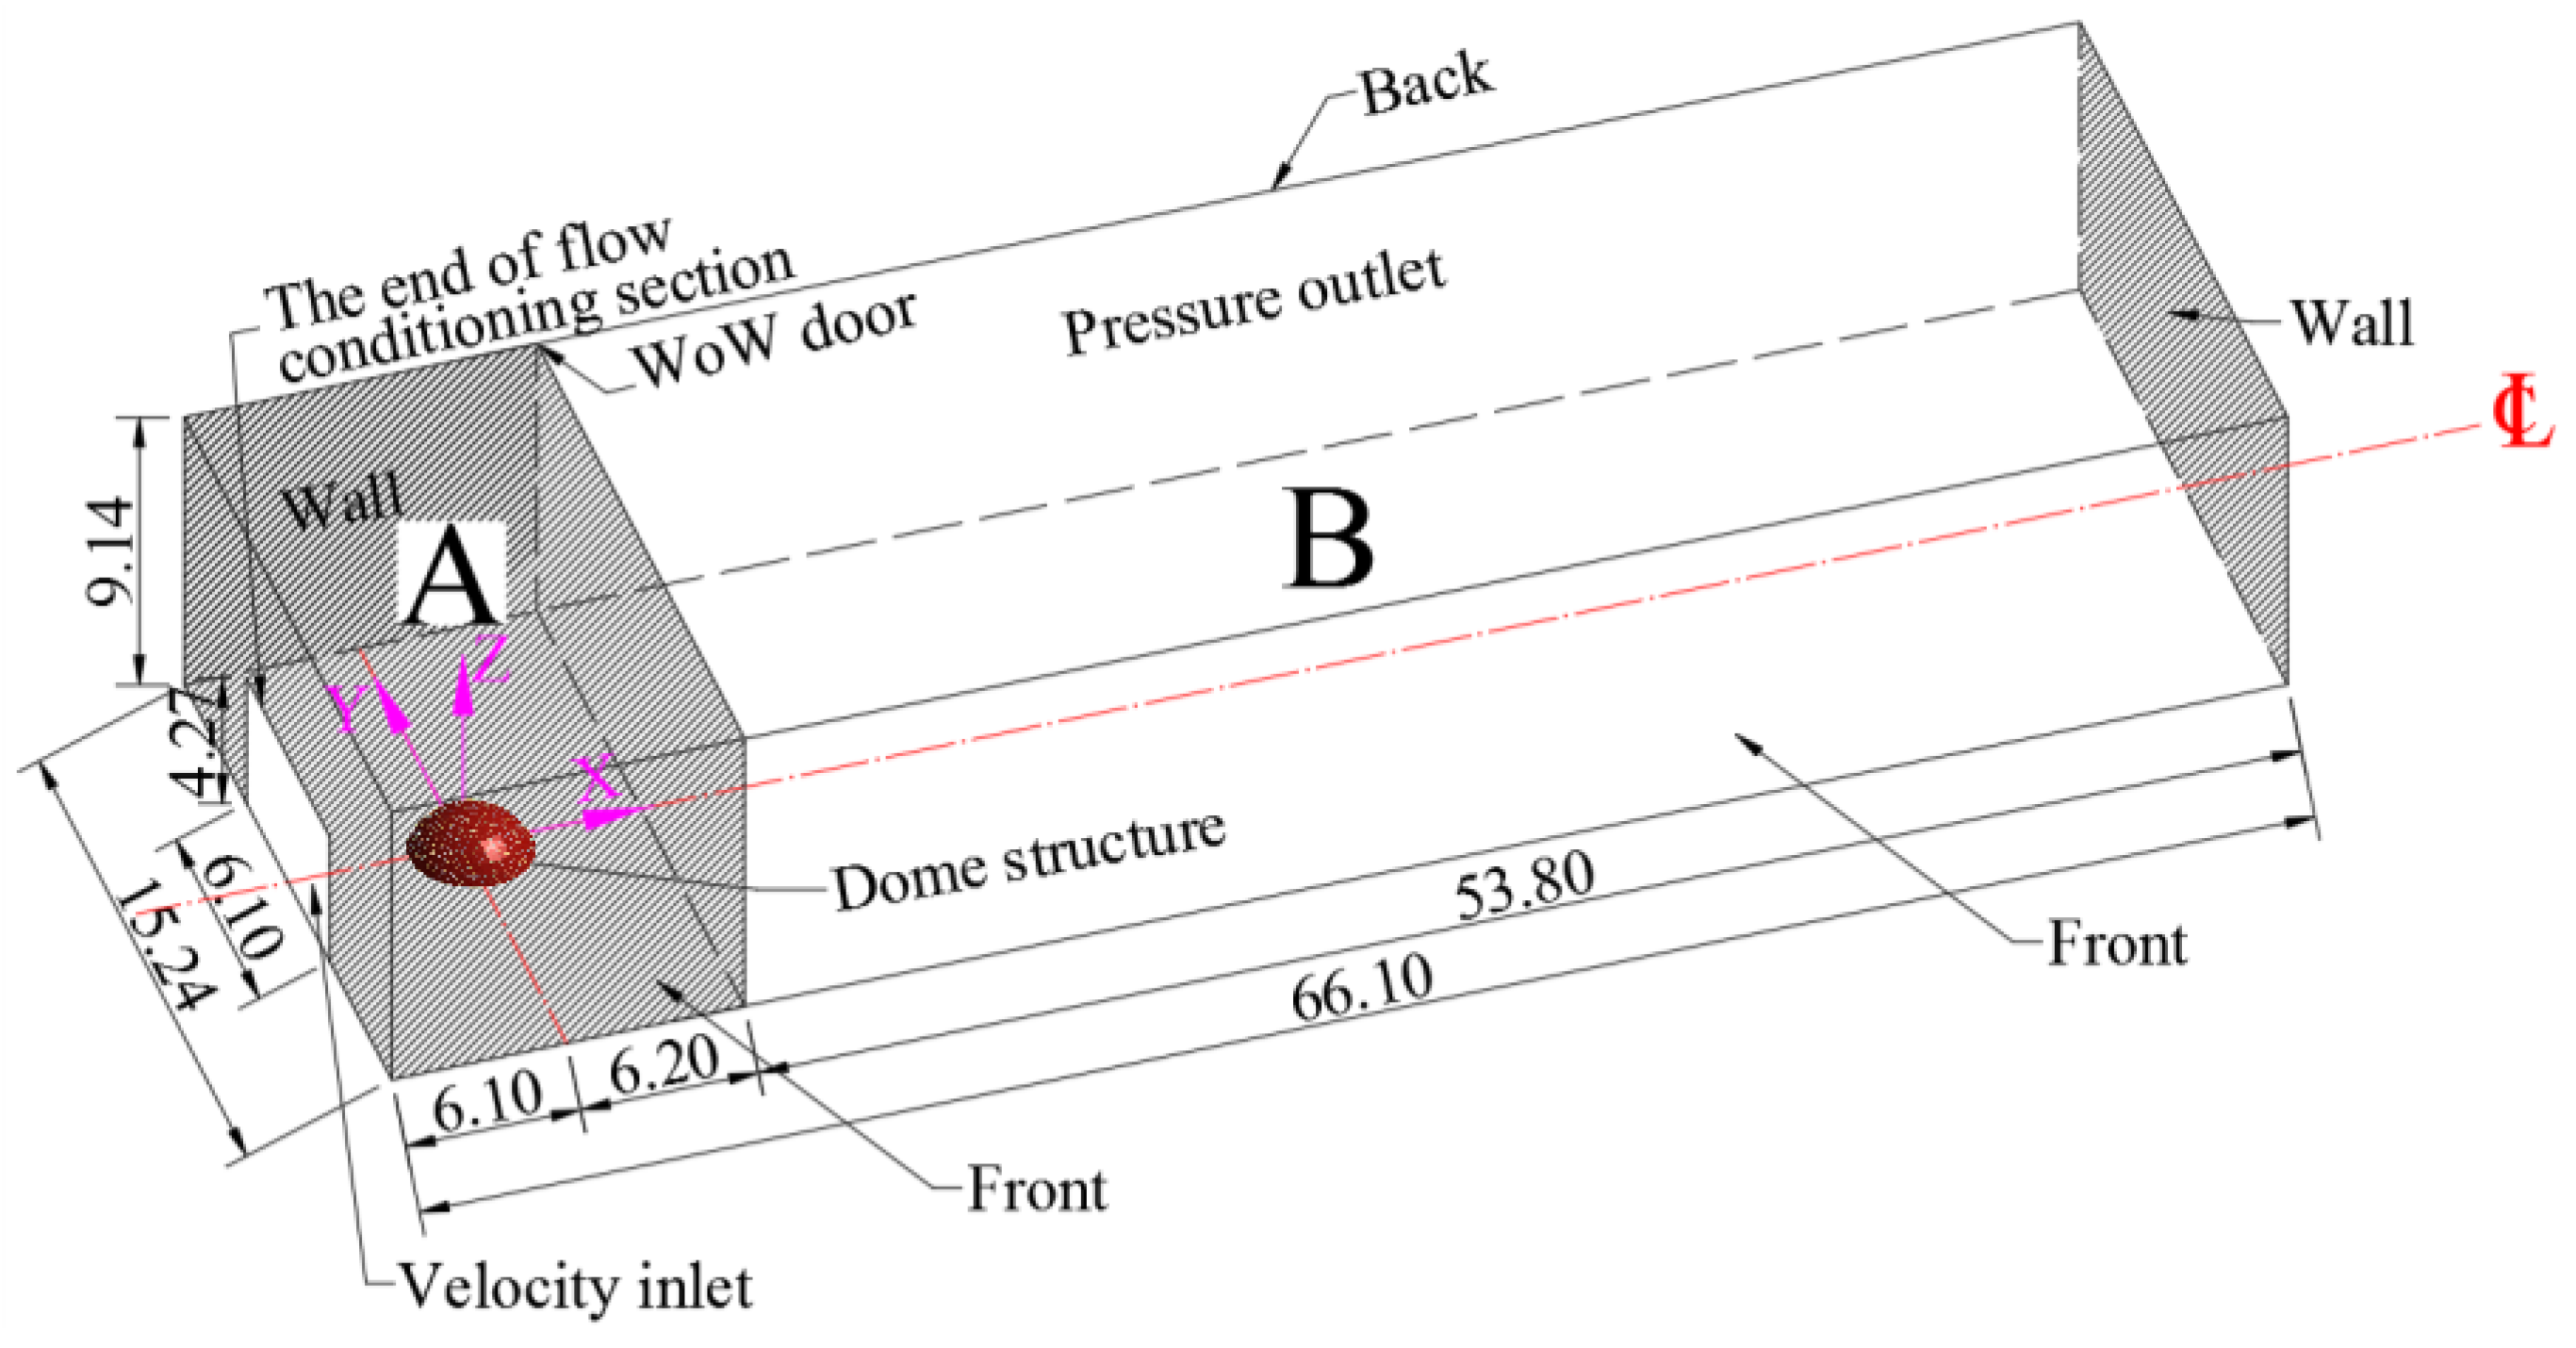
Figure 18 presents the numerical model used for CFD simulations. The wind tunnel, from the test section to the debris wall, is numerically simulated. Part A of the numerical model represents the test section from one side of the flow conditioning section to the gate. Part B represents the region of open air from the gate to the debris wall. The numerical model is 66.10 m long, 15.24 m wide, and 9.14 m high, and the dimensions are the same as those of the wind tunnel. To investigate wind loads exerted onto the dome model, it is positioned at the same location as the turning table center.
The velocity inlet is set up on the left surface of Part A, which represents the cross section of the flow conditioning section. Apart from the velocity inlet, the remaining area of the left surface is defined as the no-slip wall. The boundary conditions of the front, top, and back surfaces of Part A are also specified as the no-slip wall. Regarding the front, top, and back surfaces of Part B, the pressure outlet is specified, since these regions are open to air. The no-slip wall is also applied to the ground, the dome surface, and the debris wall. The shaded areas in Figure 18 indicate the boundary conditions of the no-slip wall, excluding the ground. To be consistent with the wind tunnel test, the turning table center, 6.1 m away from the velocity inlet, is defined as the coordinate system origin.
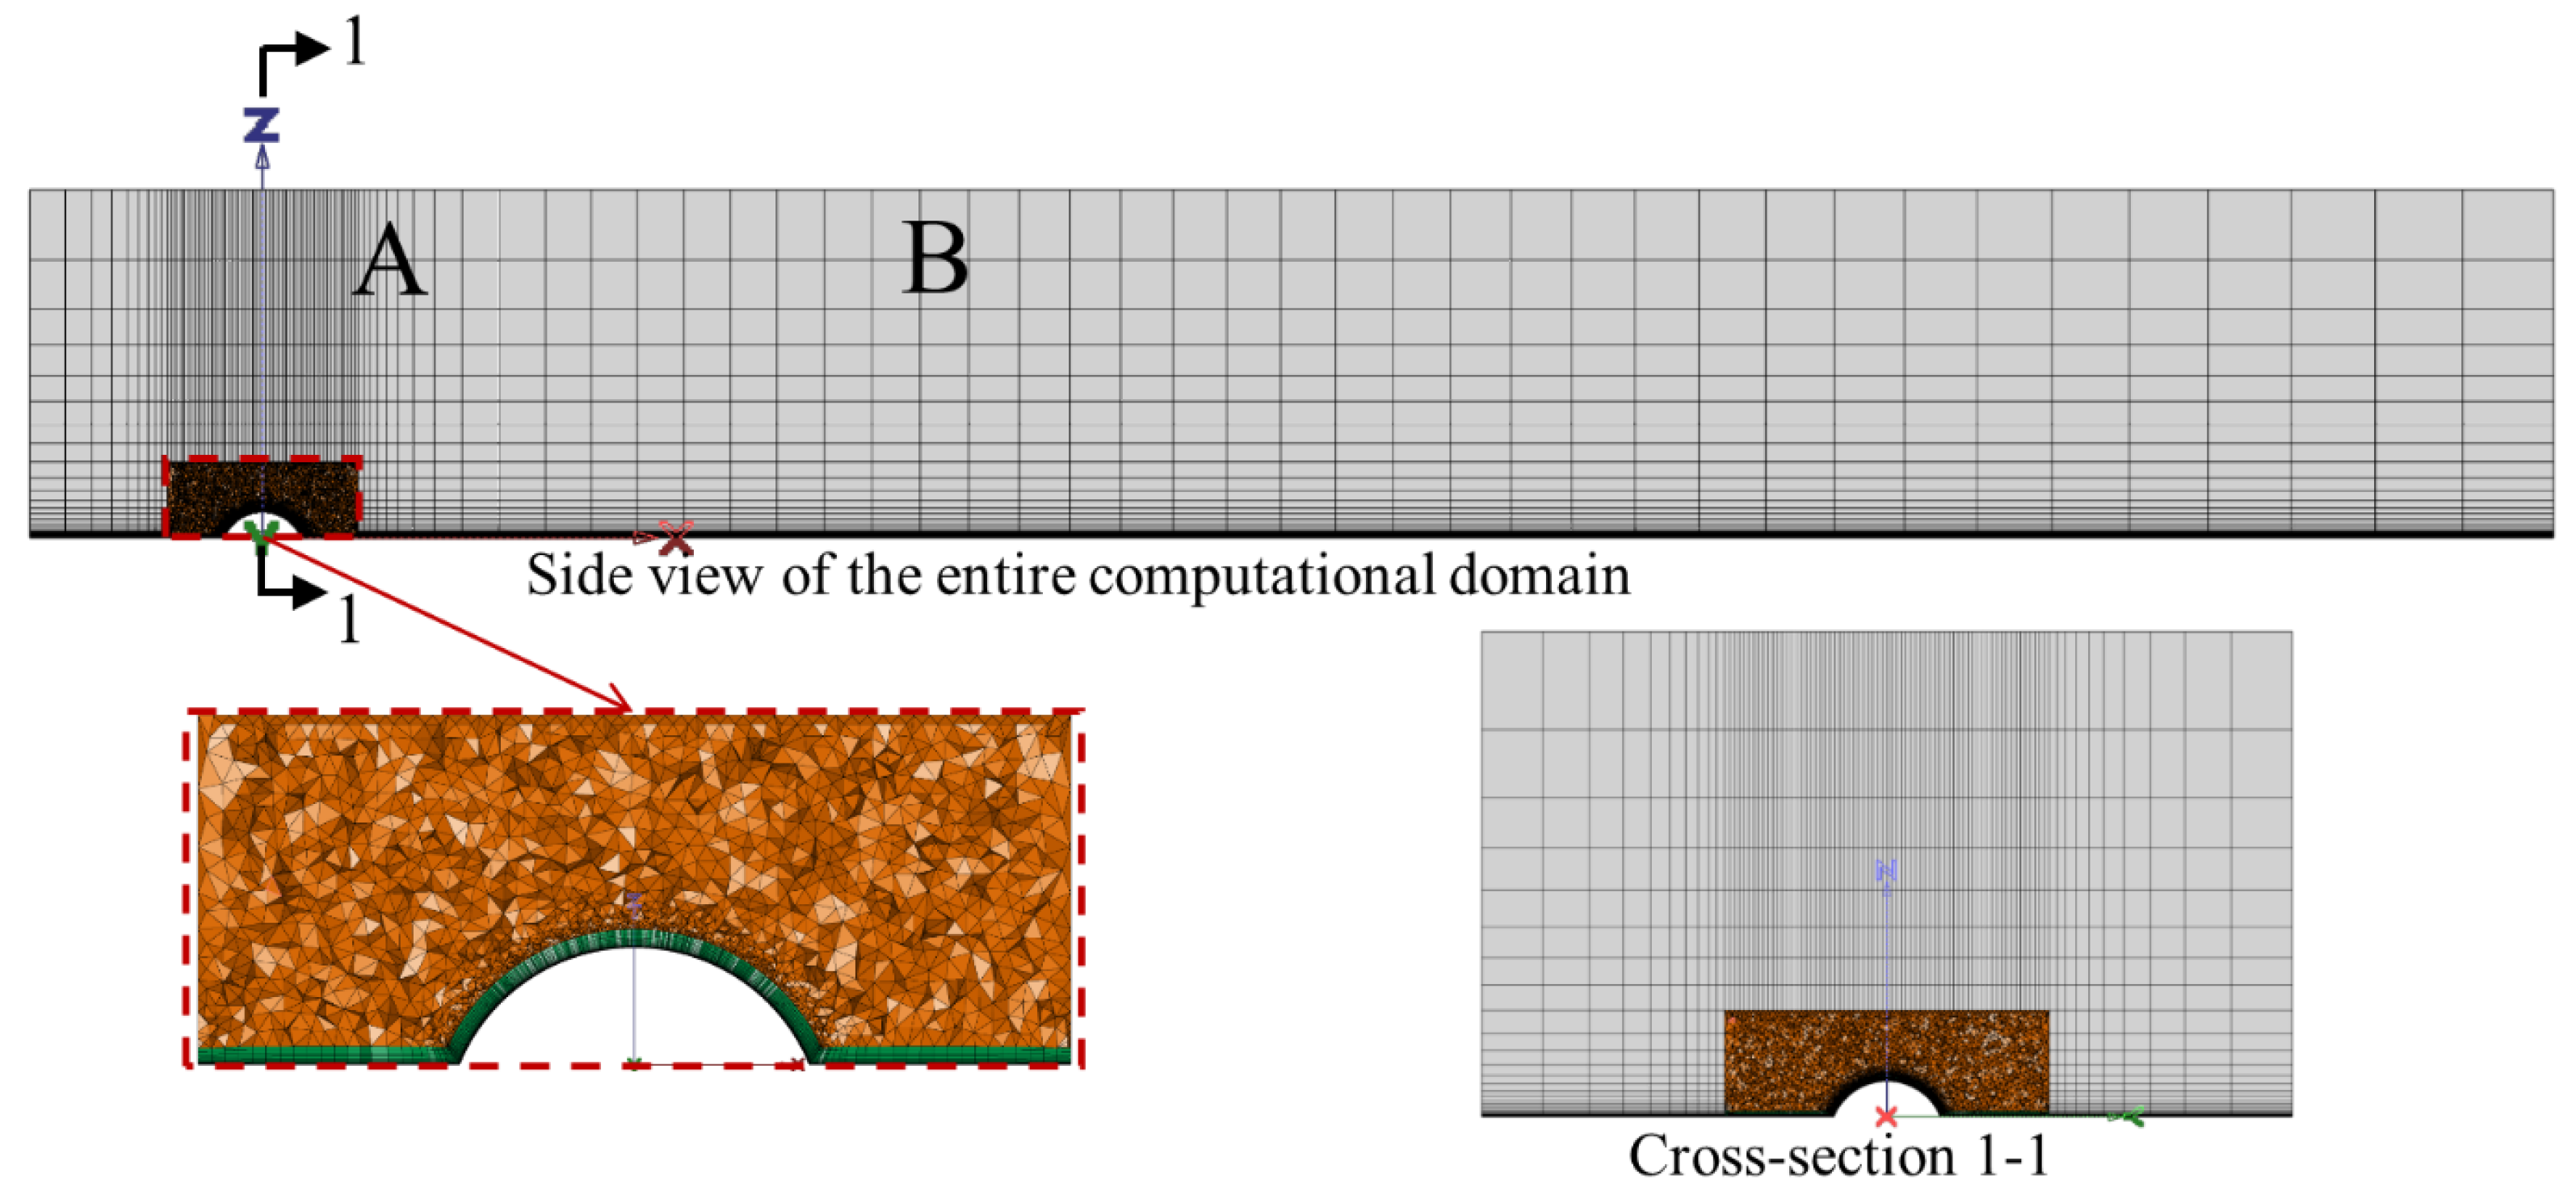
Figure 19 presents the grid arrangement of the numerical model for the RANS and a similar one is applied for the LES. Since meshing sizes affect the accuracy, stability, and computational cost of numerical simulations, mesh generation is important. In all cases, the numerical model is discretized into structured mesh, except the block containing the dome where unstructured mesh is used. To accurately calculate velocity gradients in the boundary layer, the inflation grid technique is utilized for the lowest layers near the ground and dome surface. Due to the inherent difference between the RANS and LES, different meshing sizes are applied. According to Section 3.2, the integral length scale for the turbulent flow is around 0.6 m. Moreover, the Kolmogorov scale [38] is estimated from Equation (6) as in the order of 10−5 m. In reference to both length scales, the grid independence study is performed to find the optical meshing sizes for the RANS and LES. Consequently, the minimum size of the cells for the RANS and LES are 0.3 m and 0.001 m, respectively. The wall Y+ values for the RANS and LES are 140 and 15, respectively. The total numbers of the generated cells for the RANS and LES are 0.43 million and 3.12 million, respectively.
η = ( ν 3 ε ) 1 / 4
where ν is the kinematic viscosity, which is defined as the ratio of the dynamic viscosity of air ( μ ) over the density of air ( ρ ); ε is the rate of dissipation, which is scaled as U 3 / L ( U is the mean velocity and L is the integral length scale).

4.1.2. Determination of Velocity Input

The measured mean velocity shown in Figure 10 is used to determine the velocity input at the flow inlet. Velocity measurements were made over the open terrain without the dome, and they were measured at the turning table center. The regression technique is applied to the along-wind velocity from Case 1-III. The applied regression equation is given in Equation (7), which is based on the power law [36].
V ¯ ( z ) = V ¯ ( z r e f ) × ( z z r e f ) 1 / α
where z is the height (m); z r e f is the reference height of 0.167 m, corresponding to 10 m in full scale; V ¯ ( z r e f ) is the reference mean velocity at z r e f , that is, 44 m/s at 0.167 m in the along-wind direction; α is the power law exponent, which is related to surface roughness and can be back calculated by the regression technique.
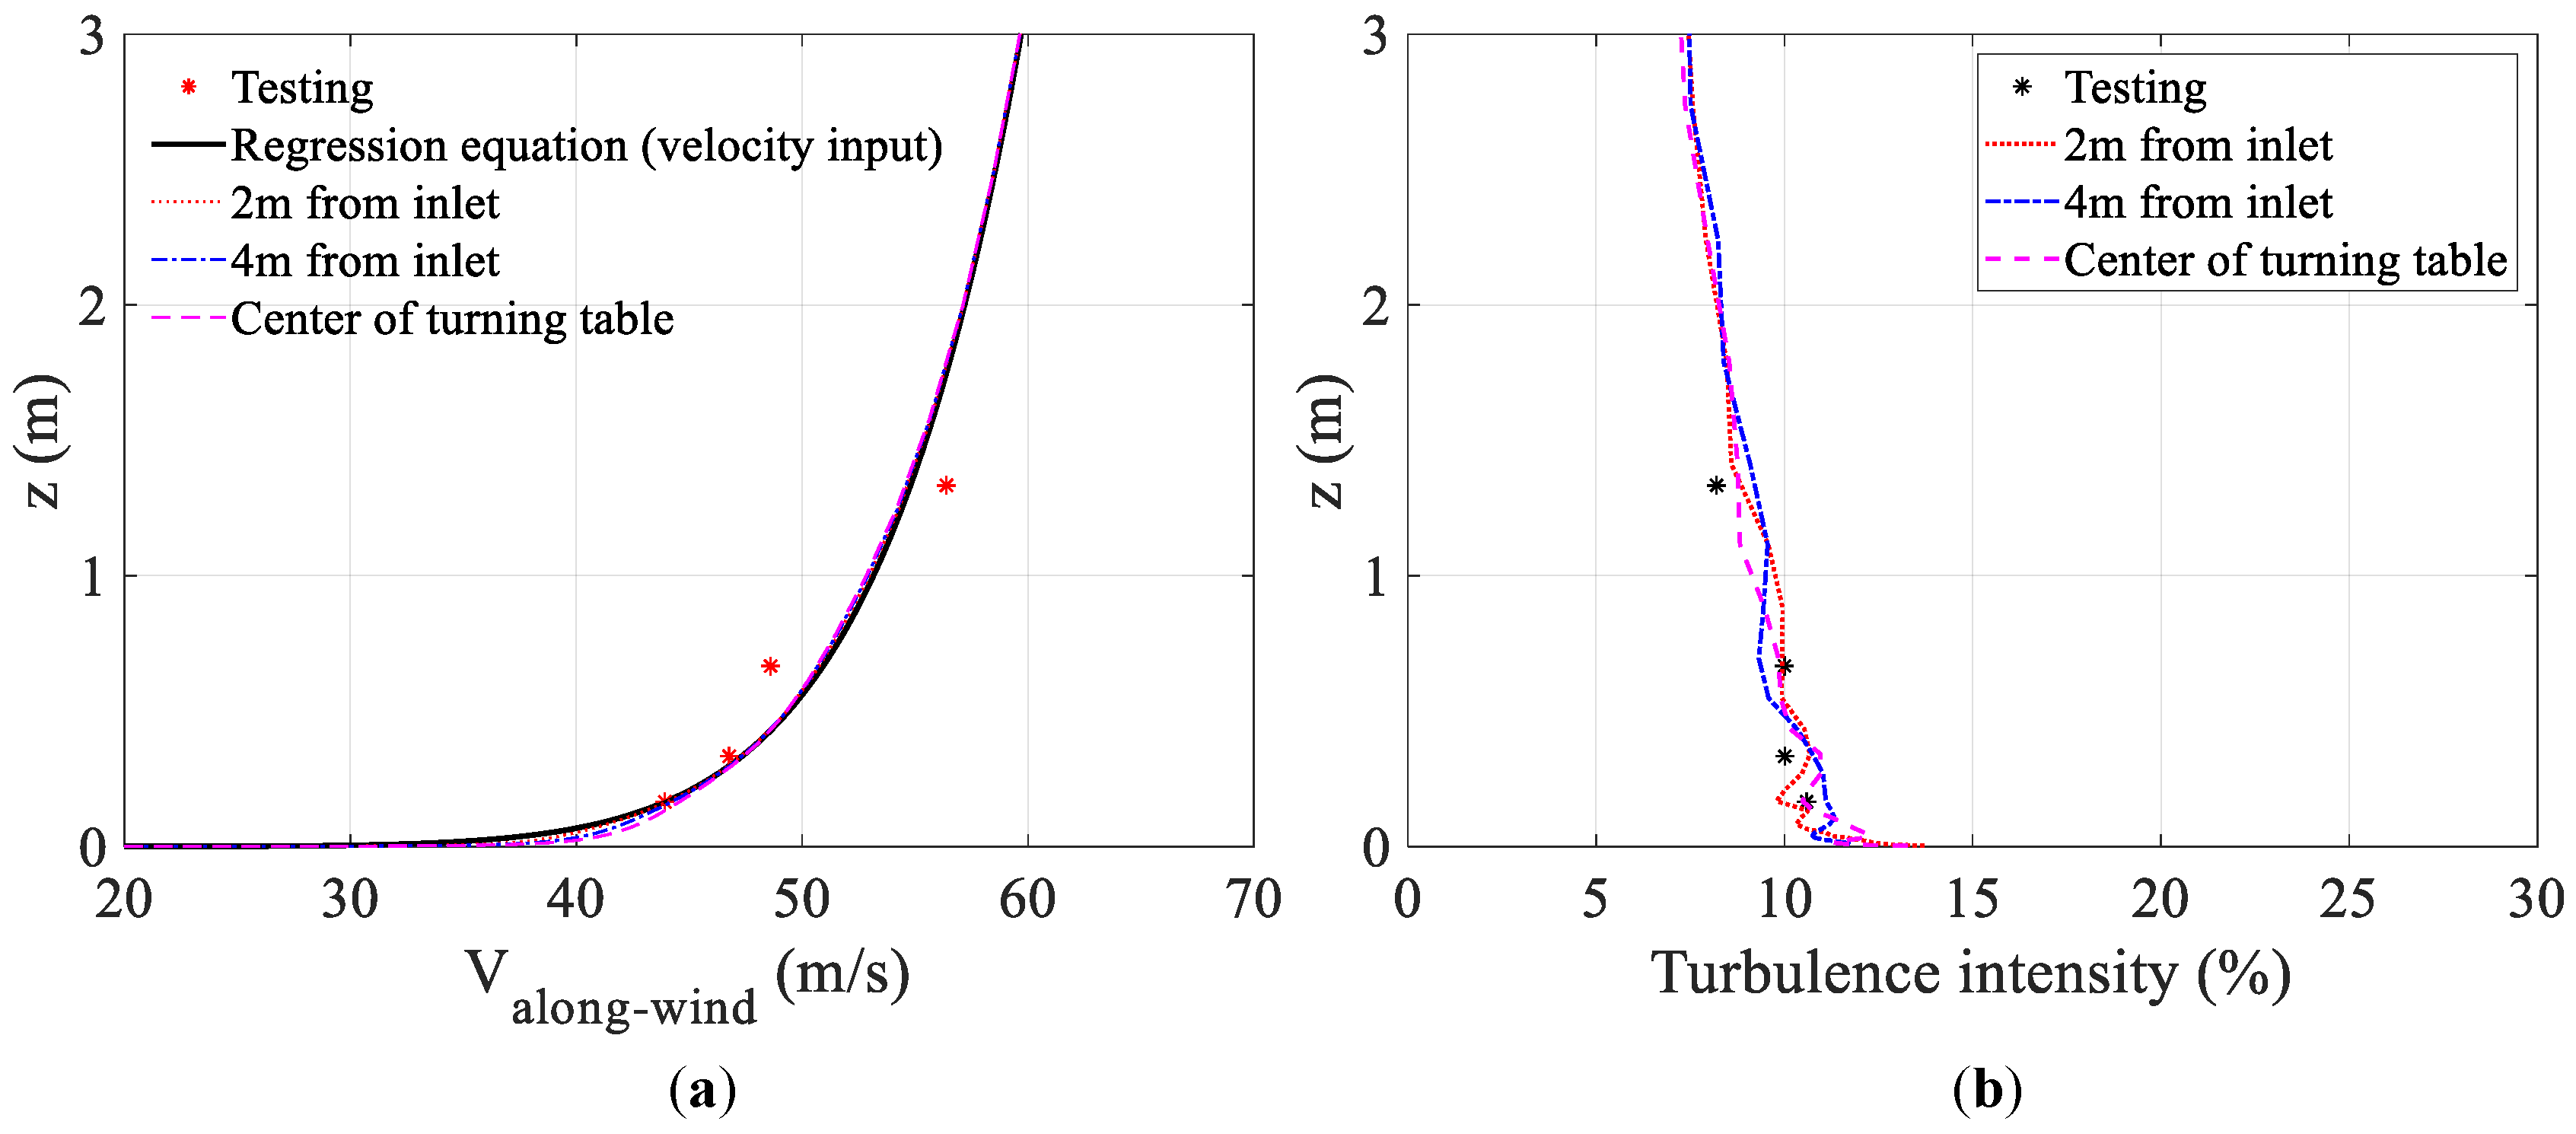
Equation (8) gives the determined regression equation, and α is determined as 9.47. The associated R2 of the curve fitting is 0.9. Figure 20a shows the comparison between the regression equation and experimental results. In this study, the mean velocity measured at the turning table center is assumed to be the same as that measured at the end of the flow conditioning section (Figure 4). On top of this, Equation (8) is applied at the velocity inlet in CFD simulations. To demonstrate this assumption, numerical simulations are performed when the dome model is removed from the numerical model, and the obtained results are also presented in Figure 20a. Velocity profiles extracted at 2 m from the inlet, 4 m from the inlet, and the center of the turning table are nearly the same as the velocity input, with the maximum mean error of 2.0 m/s and the minimum R2 of 0.94, which are reasonable and acceptable. Profiles of TI at different locations (2 m from the inlet, 4 m from the inlet, and the turning table center) are also compared to experimental results in Figure 20b, where stronger fluctuations are encountered than velocity profiles. In general, the TI decreases as the height increases. Below the height of 1.5 m, numerically simulated TIs are close to experimental results, with the maximum mean error of 0.6%. It implies that similar levels of turbulence are achieved in CFD simulations compared with the wind tunnel testing.
V a l o n g w i n d = 44 × ( z 0.167 ) 1 / 9.47

4.1.3. CFD Simulation Setup

Both the RANS and LES approaches are applied to analyze the turbulent flows. The RANS simulation provides time-averaged solutions to the N–S equations, which are presented in Equation (9).
u i t + u j u i x j = 1 ρ p x i + ν 2 u i x j x j + ( u i u j ) x j u i x i = 0
where ρ is the air density; t is time; ν is the kinematic viscosity; u i and u j are time-averaged components of the instantaneous velocity, i   = 1, 2, and 3, and j = 1, 2, and 3;   x i and x j are the Cartesian coordinates in three dimensions; p is time-averaged pressure. The term u i u j on the right hand of the equation is known as the Reynolds stresses, which arises in the averaging process and represents the effects of turbulence. Reynolds stresses require additional modelling to close the RANS equations. The SA and SST k-ω models are employed in the current study. They are all based on the Boussinesq hypothesis that relates the Reynolds stresses to the mean velocity gradients. The SA model only needs one additional transport equation that represents turbulent viscosity. The SST k-ω model involves two additional transport equations for turbulence kinetic energy k and the specific dissipation rate ω, and turbulent viscosity is calculated as a function of k and ω.
In the LES, large scales of motion are directly resolved, while the smaller scales are ignored by filtering the N–S equations. The governing equations for the LES are:
u ¯ i t + u ¯ i u ¯ j x j = 1 ρ p ¯ x i + ν 2 u ¯ i x j x j + τ ¯ i j x j ;   τ ¯ i j = u ¯ i u ¯ j u i u j ¯ u ¯ i x i = 0
where u ¯ i and u ¯ j are filtered velocities; p ¯ is filtered pressure. τ ¯ i j is referred to as the subgrid-scale stresses, which are unknown and require additional modelling. The Smagorinsky–Lilly model is selected as the subgrid-scale model in the current study. The Smagorinsky constant C s ranges from 0.1 to 0.23, and 0.1 is used here.
For the RANS simulations, a steady RANS is performed instead of an unsteady RANS (URANS). The URANS requires a high spatial resolution, and it is recommended to directly use the LES or hybrid URAN/LES, especially for atmospheric boundary layers with relatively high turbulence [39,40]. Moreover, the URANS only simulates statistics and does not simulate turbulence. Since the LES is applied in the current study, the URANS is not considered here. In the RANS simulations, the coupled solver combined with the pseudo transient mechanism is selected, and the second order discretization scheme is used for momentum and continuity equations. In the LES, the semi-implicit method for the pressure linked equation-consistent (SIMPLEC) as a segregated solver is used. The bounded central differencing discretization scheme is used for momentum equations, second order discretization is used for pressure, and the bounded second order implicit for transient formulation is used. The time step of the LES is 0.0001 s. Such a small-time step is used to accurately capture sufficient information from the simulation and to achieve the converged solution. Residuals of velocity, continuity, and other parameters are monitored to decide the convergence of the solution, together with quantitative variables such as peak values of wind pressure and forces. The tolerance of the residual is 0.0001, and all residuals dropping below the tolerance are a sign of convergence. Moreover, all target quantitative variables are monitored to reach relatively stable conditions for the achievement of the converged solution.

4.2. Discussion of Results

4.2.1. Mean Pressure Coefficient

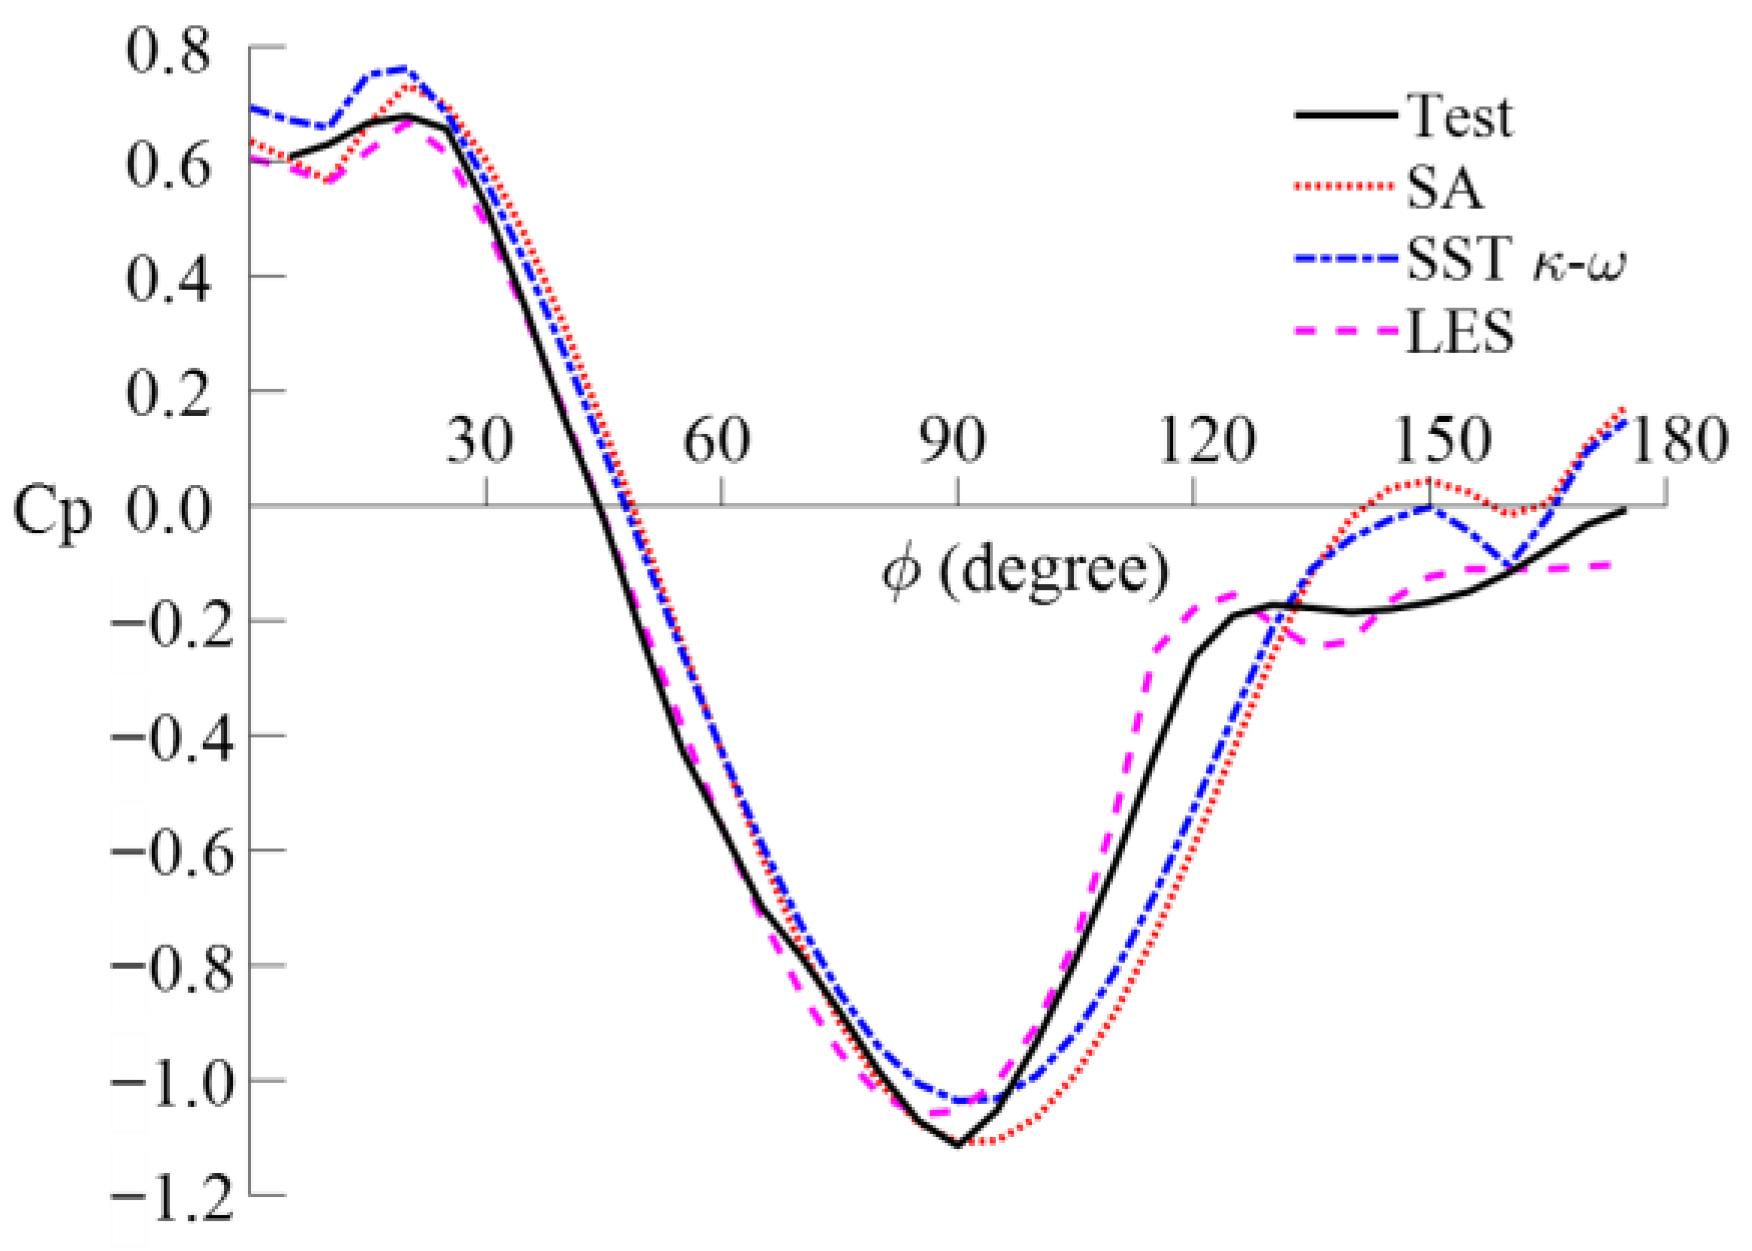
The distributions of the mean pressure coefficients on the center meridian of the dome for the three cases associated with the SA model, SST k-ω model, and the LES are presented in Figure 21. The minimum pressure occurs at an elevation of about 90 degrees, and the maximum pressure occurs at around 20 degrees. The general trends of numerical results along the meridian agree with the testing data. However, the LES result reaches the minimum pressure slightly earlier than reaching the meridian angle of 90 degrees, while for the RANS results, later than 90 degrees. The distribution of pressure coefficients along the meridian for the RANS results shifts slightly to the right of the testing data, exhibiting a discrepancy between the RANS results and the testing data. At around 120 degrees, the negative pressure gradually changes to a stable condition, and the LES result indicates a similar tendency. However, a relatively larger difference exists between the RANS results and the testing data. It is possible that the RANS simulation performs worse than the LES in simulating boundary layer separation and reattachment on the leeward side. The mean error and root-mean-square error are used to quantify the disagreement between numerical and testing results. Mean errors associated with the SA, SST k-ω model, and the LES are 0.12, 0.10, and 0.04, respectively, while the root-mean-square errors are 0.15, 0.12, and 0.05, respectively. Overall, errors associated with the LES are much smaller than the RANS results regarding the distribution of the pressure coefficient along the center meridian.
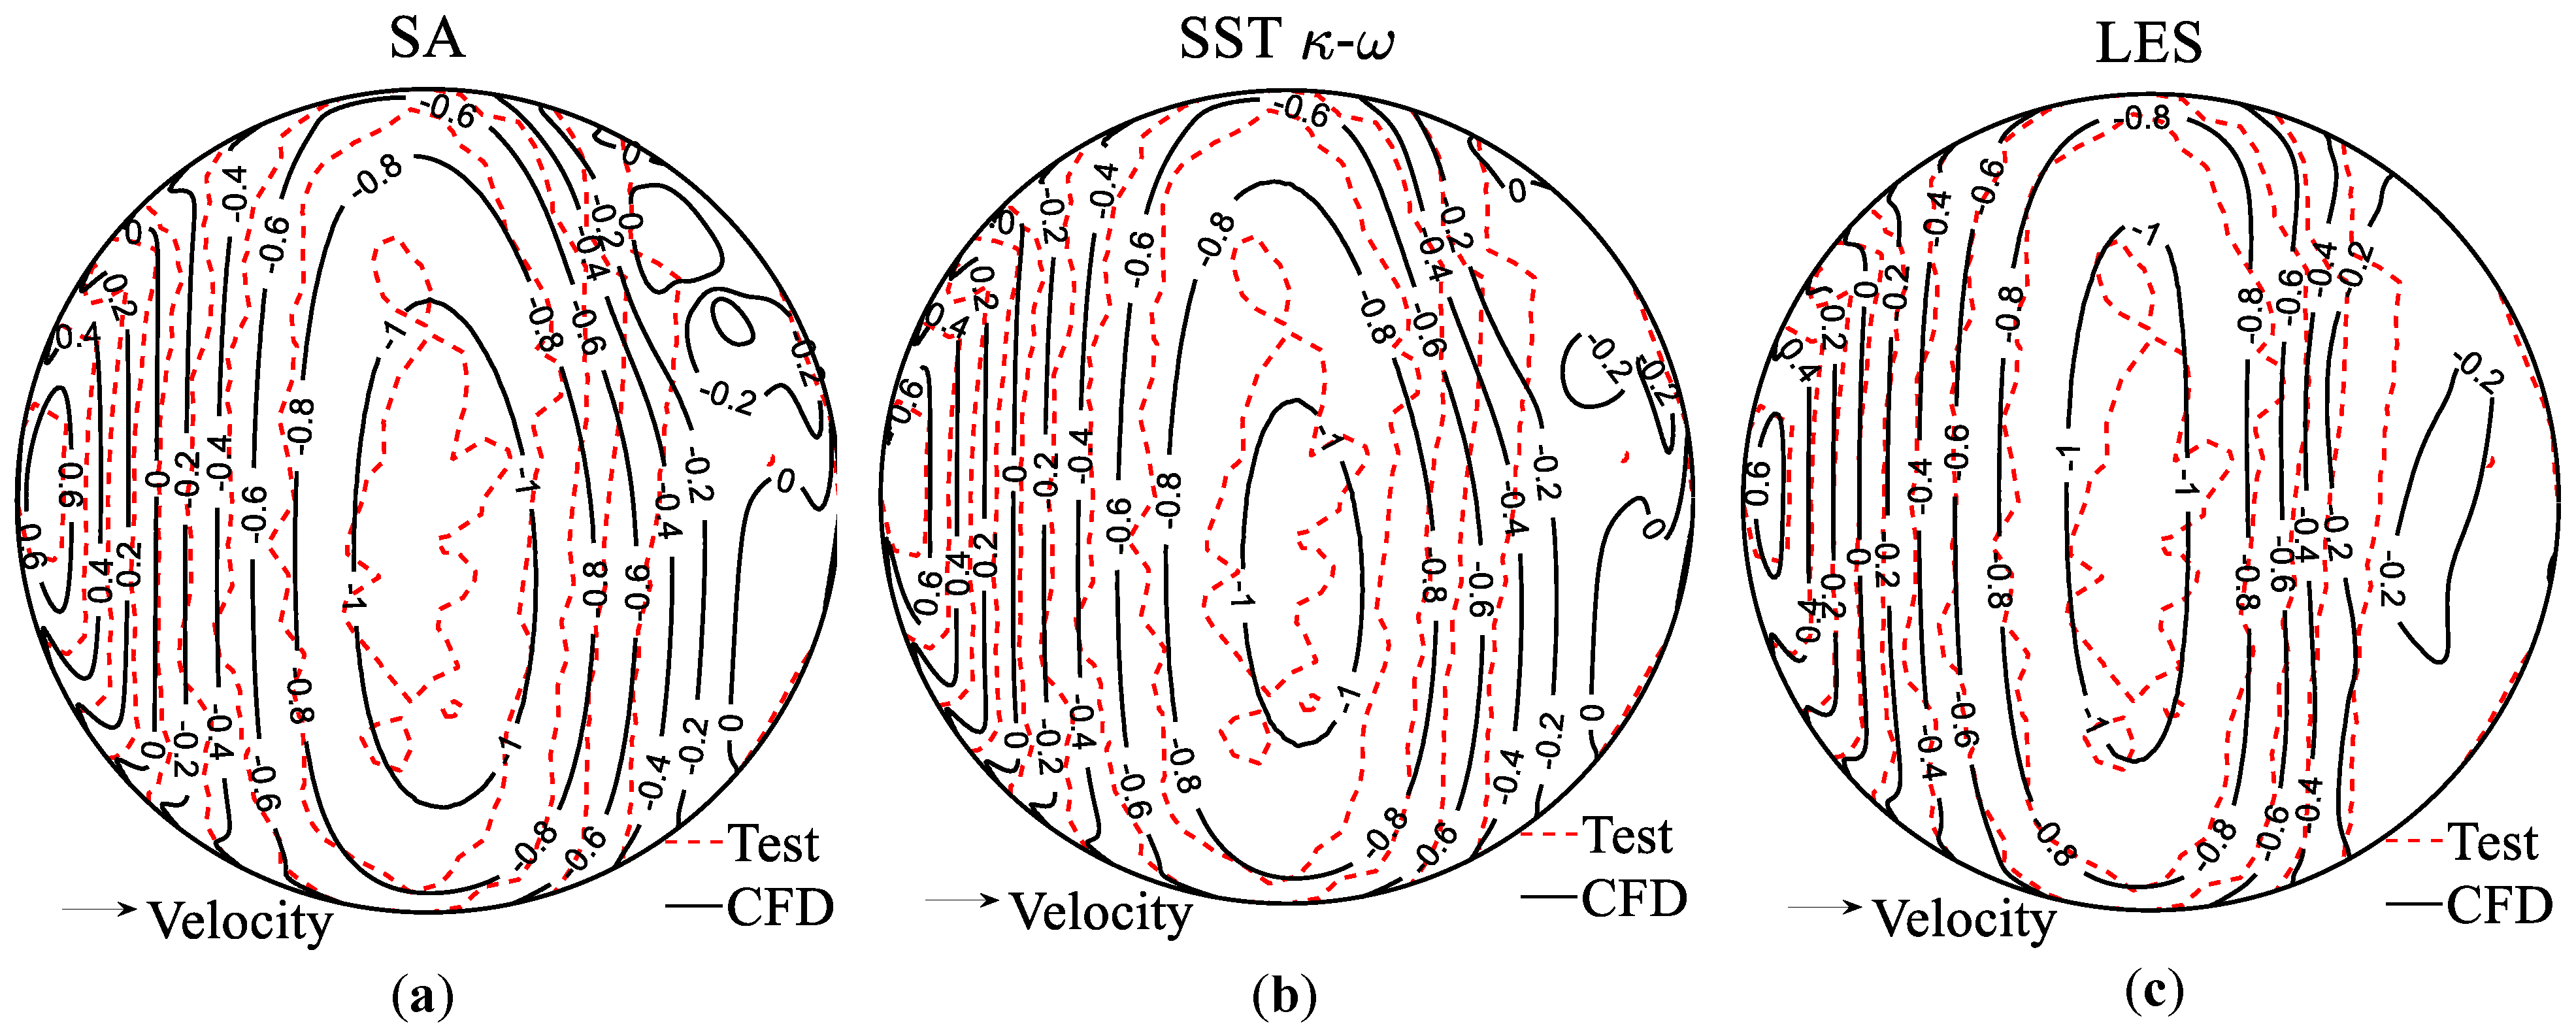
The distributions of the mean pressure coefficient from the CFD simulations are shown in Figure 22. The overall patterns from all cases could match with the wind tunnel testing, that is, the wind pressure is positive near the base of the dome on the windward side, negative pressure is observed on the leeward side, and the highest intensity of negative pressure occurs at the apex of the dome. The isolines of numerical results are smoother than the experimental results, which is probably caused by finer grids for data processing and certain idealization of numerical simulations. Among the three cases, the isolines from the LES results agree with the wind tunnel testing the best, and only minor discrepancies are found near the base of the dome on the leeward side. For the results associated with the SA and SST k-ω models, the isolines of positive pressure seem to shift to the right of those from the experimental results, and a relatively large difference is observed for the isolines at the dome apex and on the leeward side. The numerically simulated forces and moments are compared to the experimental results as listed in Table 4. As stated in Section 3.7, M X ,   M Z , and F Y are small enough to be neglected due to the symmetry of the dome structure and wind loads. Therefore, only F Z , F X , and M Y are compared. Errors of F Z associated with the RANS simulations range from 2% to 4%, and errors of F X and M Y range from 9.3% to 17.2%. Errors of the LES results are much smaller than the RANS results, that is, the error of F Z is 1.1%, and errors of F X and M Y are 6.6% and 5.2%, respectively.

4.2.2. Time Averaged Streamlines

Time averaged streamlines on the vertical X–Z plane where Y = 0, on the horizontal X–Y plane where Z = 0.01 m near the ground (Z/D = 1/200), and on the horizontal X–Y plane where Z = 0.167 m (Z/D = 1/12) are presented in Figure 23, Figure 24 and Figure 25. From Figure 23, the airflow on the windward side splits at the stagnation point, and a horseshoe vortex forms in front of the dome due to the collision between the airflow below the stagnation point and the dome. Additionally, the horseshoe wraps around the dome and extends to the downstream region near the ground as observed in Figure 24. Taking Figure 22 into account, the occurrence of the maximum pressure on the windward side is related to the stagnation area and divergence of streamlines. Above the stagnation point, the blockage of the dome model causes the convergence of streamlines, and then the airflow accelerates around the dome apex. Meanwhile, negative pressure occurs and reaches its peak value at the apex of the dome (Figure 22). This can be explained by the mass continuity and Bernoulli theorems. On the leeward side, boundary layer separation and another recirculation region behind the dome are formed, and then the airflow decelerates. The associated area is affected by negative pressure. The above findings are consistent with the observations reported by [26,41].
Based on qualitative comparisons, the streamlines obtained from the three numerical simulations associated with the SA, SST k-ω model, and the LES indicate similar flow patterns. The horseshoe vortex in front of the dome, boundary layer separation, and airflow reattachment behind the dome are all observed for each numerical simulation. However, some discrepancies still exist among them. In terms of the formation of the horseshoe vortex in front of the dome, the LES result indicates a wider region of the horseshoe vortex in front of the dome according to Figure 23 and Figure 24, and the horseshoe vortex extends to a wider area in the downstream direction than the RANS results. For the boundary layer separation over the dome (Figure 23), the LES results occur earlier than the two RANS simulations. The separation point associated with the LES is located closer to the dome apex. The contour plots of velocity in the downstream direction (X velocity) are drawn in Figure 26, and the velocity is restricted to around 0 m/s to locate the separation point. From Figure 26, the separation points over the dome associated with the RANS simulations are located at 163–164 degrees, while the separation point determined from the LES is located at 123 degrees. Fu et al. (2015) proposed that the location of separation can be indicated by the pressure gradient plot from the wind tunnel testing [27]. According to the method, the separation point from the wind tunnel testing is estimated at about 127.5 degrees, which is slightly downstream of the LES result. This phenomenon is consistent with the numerical simulations conducted by [27]. For the RANS simulations (163–164 degrees), the separation occurs much later than the testing (127.5 degrees). This may explain the larger discrepancy of the pressure coefficient after 120 degrees along the center meridian between the RANS results and testing data in Figure 21. As stated by [26,41], the boundary layer separation on the two sides of the dome forms two opposite rotating vortices. Figure 24 shows that boundary layer separations are reproduced for all numerical simulations. However, only the LES exhibits the two opposite rotating vortices. Even at the upper plane (Figure 25), rotating vortices are still invisible for the RANS simulations, while these vortices become stronger and extend more in the wake for the LES. In summary, the simulated time averaged streamlines in Figure 23, Figure 24 and Figure 25 associated with the LES match better with other reported studies [26,27,41], and its back calculated point of boundary layer separation is closest to that estimated from the wind tunnel testing.

4.2.3. Instantaneous Turbulence Structure

The instantaneous turbulence structures around the dome associated with the LES and SST k-ω model are depicted in Figure 27 based on the Q criterion [42]. Q is derived as the second invariant of the velocity gradient tensor, which defines vortices as areas where the vorticity magnitude is greater than the magnitude of the rate of strain. Positive values of Q indicate the existence of a vortex where vorticity dominates. The iso-surface of the Q criterion presented in Figure 27 is colored by the mean pressure coefficients. From Figure 27a, on the windward side of the dome, the boundary layer vorticity forms because of the ground friction. Then, the accumulation of the boundary layer vorticity and the collision between the flow below the stagnation point and the dome leads to the appearance of horseshoe vortices, which wrap around the dome and contribute to the trailing vorticity in the wake region. On the leeward side of the dome, boundary layer separation occurs and causes the formation of small-scale vortices, which then merge with each other and develop into larger-scale strip vortices and finally disappear in the far wake region. The presented turbulence structure is similar to the experimental observation of a dome with a Reynolds number of 1.6 × 10³ reported by [41]. Figure 27b depicts the turbulence structure associated with the SST k-ω model, and it is clear that the RANS simulations cannot provide such unsteady information.

5. Conclusions

In the study, wind effects acting on dome structures are investigated based on large-scale (1/60) wind tunnel testing and CFD simulations. In the wind tunnel testing, both open and suburban terrain configurations are considered, and three velocity levels are applied to the dome model. Based on the experimental results, the following summary can be made. The magnitude of the mean pressure coefficient generally increases with the inflow wind velocity and hence, increasing wind forces, and the magnitude of the pressure coefficient for the suburban terrain is lower than that for the open terrain. The maximum pressure coefficient occurs at an elevation of about 20 degrees, and the minimum pressure coefficient appears at around 90 degrees. Suction force is the most significant among all wind-induced loads, which may damage the roof or even lift the roof up, and therefore, special attention should be paid to wind resistance design.
The LES and RANS simulations with the Spalart–Allmaras model and SST k-ω model are performed and their performances are validated against the wind tunnel testing. The following conclusions can be drawn based on the numerical results. In terms of the mean pressure coefficients on the center meridian and the overall wind pressure distribution on the dome surface, the mean and root-mean-square errors associated with the LES are much smaller than the RANS. Regarding time averaged flow patterns, although both the RANS and LES can capture the horseshoe vortex, boundary layer separation, and reattachment behind the dome, the LES is able to predict the location of the boundary layer separation more accurately and regenerate stronger and more detailed vortices in the wake region. Moreover, more details of the instantaneous turbulence structure around the dome model can be provided by the LES, while this cannot be achieved by the RANS simulations.

Author Contributions

Conceptualization, T.L.; Data curation, T.L. and G.Y.; Formal analysis, T.L.; Funding acquisition, T.L., G.Y., A.C. and I.Z.; Investigation, T.L., Y.Z., and R.H.; Methodology, T.L.; Resources, G.Y., A.C. and I.Z.; Software, T.L.; Supervision, G.Y.; Validation, T.L. and H.Q.; Visualization, T.L. and H.Q.; Writing—original draft, T.L. and H.Q.; Writing—review & editing, Y.Z., G.Y., A.C. and I.Z. All authors have read and agreed to the published version of the manuscript.

Funding

This research was funded by the National Natural Science Foundation of China, grant numbers 42005144, U2142206, 52008316; National Science Foundation, grant numbers 1455709, 2037899; China Postdoctoral Science Foundation, grant number 2020M681443; Shanghai Post-doctoral Excellence Program, grant number 2020518.

Institutional Review Board Statement

Not applicable.

Informed Consent Statement

Not applicable.

Data Availability Statement

The data presented in this study are available on request from the corresponding author.

Acknowledgments

We are grateful to the NSF-funded NHERI WOW EF for performing the experiments. We also thank Deqian Zheng for helping with the CFD simulations.

Conflicts of Interest

The authors declare no conflict of interest.

References

  1. Maher, F.J. Wind loads on basic dome shapes. J. Struct. Div. 1965, 91, 219–228. [Google Scholar] [CrossRef]
  2. Taniguchi, S.; Sakamoto, H.; Kiya, M.; Arie, M. Time-averaged aerodynamic forces acting on a hemisphere immersed in a turbulent boundary. J. Wind Eng. Ind. Aerod. 1982, 9, 257–273. [Google Scholar] [CrossRef]
  3. Taylor, T.J. Wind pressures on a hemispherical dome. J. Wind Eng. Ind. Aerod. 1992, 40, 199–213. [Google Scholar] [CrossRef]
  4. Ogawa, T.; Nakayama, M.; Murayama, S.; Sasaki, Y. Characteristics of wind pressures on basic structures with curved surfaces and their response in turbulent flow. J. Wind Eng. Ind. Aerod. 1991, 38, 427–438. [Google Scholar] [CrossRef]
  5. Savory, E.; Toy, N. Hemisphere and hemisphere-cylinders in turbulent boundary layers. J. Wind Eng. Ind. Aerod. 1986, 23, 345–364. [Google Scholar] [CrossRef]
  6. Letchford, C.W.; Sarkar, P.P. Mean and fluctuating wind loads on rough and smooth parabolic domes. J. Wind Eng. Ind. Aerod. 2000, 88, 101–117. [Google Scholar] [CrossRef]
  7. Cheng, C.M.; Fu, C.L. Characteristic of wind loads on a hemispherical dome in smooth flow and turbulent boundary layer flow. J. Wind Eng. Ind. Aerod. 2010, 98, 328–344. [Google Scholar] [CrossRef]
  8. Chevula, S.; Sanz-Andres, A.; Franchini, S. Aerodynamic external pressure loads on a semi-circular bluff body under wind gusts. J. Fluid Struct. 2015, 54, 947–957. [Google Scholar] [CrossRef]
  9. Kim, Y.C.; Yoon, S.W.; Cheon, D.J.; Song, J.Y. Characteristics of wind pressures on retractable dome roofs and external peak pressure coefficients for cladding design. J. Wind Eng. Ind. Aerod. 2019, 188, 294–307. [Google Scholar] [CrossRef]
  10. Lee, J.H.; Kim, Y.C.; Cheon, D.J.; Yoon, S.W. Wind pressure characteristics of elliptical retractable dome roofs. J. Asian Archit. Build. 2022, 21, 1561–1577. [Google Scholar] [CrossRef]
  11. Tavakol, M.M.; Yaghoubi, M.; Ahmadi, G. Experimental and numerical analysis of airflow around a building model with an array of domes. J. Build. Eng. 2021, 34, 101901. [Google Scholar] [CrossRef]
  12. Murakami, S. Overview of turbulence models applied in CWE–1997. J. Wind Eng. Ind. Aerod. 1998, 74–76, 1–24. [Google Scholar] [CrossRef]
  13. Smagorinsky, J. General circulation experiments with the primitive equations: I. The basic experiment. Mon. Weather Rev. 1963, 91, 99–164. [Google Scholar] [CrossRef]
  14. Nicoud, F.; Ducros, F. Subgrid-scale stress modelling based on the square of the velocity gradient tensor. Flow Turbul. Combust. 1999, 62, 183–200. [Google Scholar] [CrossRef]
  15. Germano, M.; Piomelli, U.; Moin, P.; Cabot, W.H. A dynamic subgrid-scale eddy viscosity model. Phys. Fluids A-Fluid 1991, 3, 1760. [Google Scholar] [CrossRef] [Green Version]
  16. Lilly, D.K. A proposed modification of the Germano subgrid-scale closure method. Phys. Fluids A-Fluid 1992, 4, 633–635. [Google Scholar] [CrossRef]
  17. Spalart, P.; Allmaras, S. A one-equation turbulence model for aerodynamic flows. Rech. Aerospatiale 1994, 1, 5–21. [Google Scholar] [CrossRef]
  18. Launder, B.E.; Spalding, D.B. Lectures in Mathematical Models of Turbulence; Academic Press: London, UK, 1972. [Google Scholar]
  19. Wilcox, D.C. Turbulence Modeling for CFD; DCW Industries: La Canada Flintridge, CA, USA, 1998. [Google Scholar]
  20. Shih, T.H.; Liou, W.W.; Shabbir, A.; Yang, Z.; Zhu, J. A new k-ϵ eddy viscosity model for high reynolds number turbulent flows. Comput. Fluids 1995, 24, 227–338. [Google Scholar] [CrossRef]
  21. Yakhot, V.S.; Orszag, S.A.; Thangam, S.; Gatski, T.B.; Speziale, C.G. Development of turbulence models for shear flows by a double expansion technique. Phys. Fluids A-Fluid 1992, 4, 1510. [Google Scholar] [CrossRef] [Green Version]
  22. Menter, F.R. Two-equation eddy-viscosity turbulence models for engineering applications. AIAA J. 1994, 32, 1598–1605. [Google Scholar] [CrossRef] [Green Version]
  23. Menter, F.R. Eddy viscosity transport equations and their relation to the k-ε model. J. Fluid Eng. 1997, 119, 876–884. [Google Scholar] [CrossRef]
  24. Menter, F.R.; Kuntz, M.; Langtry, R. Ten years of industrial experience with the SST turbulence model. Turbul. Heat Mass Transf. 2003, 4, 625–632. [Google Scholar]
  25. Tavakol, M.M.; Yaghoubi, M.; Motlagh, M.M. Air flow aerodynamic on a wall-mounted hemisphere for various turbulent boundary layers. Exp. Therm. Fluid Sci. 2010, 34, 538–553. [Google Scholar] [CrossRef]
  26. Tavakol, M.M.; Abouali, O.; Yaghoubi, M. Large eddy simulation of turbulent flow around a wall mounted hemisphere. Appl. Math Model 2015, 39, 3596–3618. [Google Scholar] [CrossRef]
  27. Fu, C.L.; Cheng, C.M.; Lo, Y.L.; Cheng, D.Q. LES simulation of hemispherical dome’s aerodynamic characteristics in smooth and turbulence boundary layer flows. J. Wind Eng. Ind. Aerod. 2015, 144, 53–61. [Google Scholar] [CrossRef]
  28. Wood, J.N.; De Nayer, G.; Schmidt, S.; Breuer, M. Experimental investigation and large-eddy simulation of the turbulent flow past a smooth and rigid hemisphere. Flow Turbul. Combust. 2016, 97, 79–119. [Google Scholar] [CrossRef] [Green Version]
  29. Sadeghi, H.; Heristchian, M.; Aziminejad, A.; Nooshin, H. Wind effect on grooved and scallop domes. Eng. Struct. 2017, 148, 436–450. [Google Scholar] [CrossRef]
  30. Fouad, N.S.; Mahmoud, G.H.; Nasr, N.E. Comparative study of international codes wind loads and CFD results for low rise buildings. Alex. Eng. J. 2018, 57, 3623–3639. [Google Scholar] [CrossRef]
  31. Khosrowjerdi, S.; Sarkardeh, H.; Kioumarsi, M. Effect of wind load on different heritage dome buildings. Eur. Phys. J. Plus 2021, 136, 1180. [Google Scholar] [CrossRef]
  32. Franke, J.; Hirsch, C.; Jensen, A.G.; Krüs, H.W.; Schatzmann, M.; Westbury, P.S.; Miles, S.D.; Wisse, J.A.; Wright, N.G. Recommendations on the use of CFD in predicting pedestrian wind environment. In COST Action C14 “Impact of Wind and Storms on City Life and Built Environment”; Von Karman Institute: Rhode-Saint-Genese, Belgium, 2004. [Google Scholar]
  33. Murakami, S. Setting the scene: CFD and symposium overview. Wind Struct. 2002, 5, 83–88. [Google Scholar] [CrossRef]
  34. Tominaga, Y.; Stathopoulos, T. Numerical simulation of dispersion around an isolated cubic building: Model evaluation of RANS and LES. Build. Environ. 2010, 45, 2231–2239. [Google Scholar] [CrossRef] [Green Version]
  35. American Society of Civil Engineers. Minimum Design Loads and Associated Criteria for Buildings and Other Structures; ASCE/SEI 7–16; American Society of Civil Engineers: Reston, VA, USA, 2016. [Google Scholar] [CrossRef]
  36. Simiu, E.; Scanlan, R.H. Wind Effects on Structures: Fundamentals and Applications to Design, 3rd ed.; John Wiley and Sons, Inc.: New York, NY, USA, 1986. [Google Scholar]
  37. Kaimal, J.C.; Finigan, J.J. Atmospheric Boundary Layer Flows: Their Structure and Measurement; Oxford University Press: Oxford, UK, 1994. [Google Scholar]
  38. Pope, S.B. Turbulent Flows; Cambridge University Press: Cambridge, UK, 2000; pp. 182–263. [Google Scholar]
  39. Blocken, B. Computational Fluid Dynamics for urban physics: Importance, scales, possibilities, limitations and ten tips and tricks towards accurate and reliable simulations. Build. Environ. 2015, 91, 219–245. [Google Scholar] [CrossRef] [Green Version]
  40. Franke, J.; Hellsten, A.; Schlünzen, H.; Carissimo, B. Best practice guideline for the CFD simulation of flows in the urban environment. In Proceedings of the 11th Conference on Harmonisation within Atmospheric Dispersion Modelling for Regulatory Purposes, Cambridge, UK, 2–5 July 2007. [Google Scholar]
  41. Savory, E.; Toy, N. The separated shear layers associated with hemispherical bodies in turbulent boundary layers. J. Wind Eng. Ind. Aerod. 1988, 28, 291–300. [Google Scholar] [CrossRef]
  42. Hunt, J.C.; Wray, A.A.; Moin, P. Eddies, streams, and convergence zones in turbulent flows. In Proceedings of the 1988 Summer Program. Center for Turbulence Research, Buffalo, NY, USA, 20–22 November 1988. [Google Scholar]
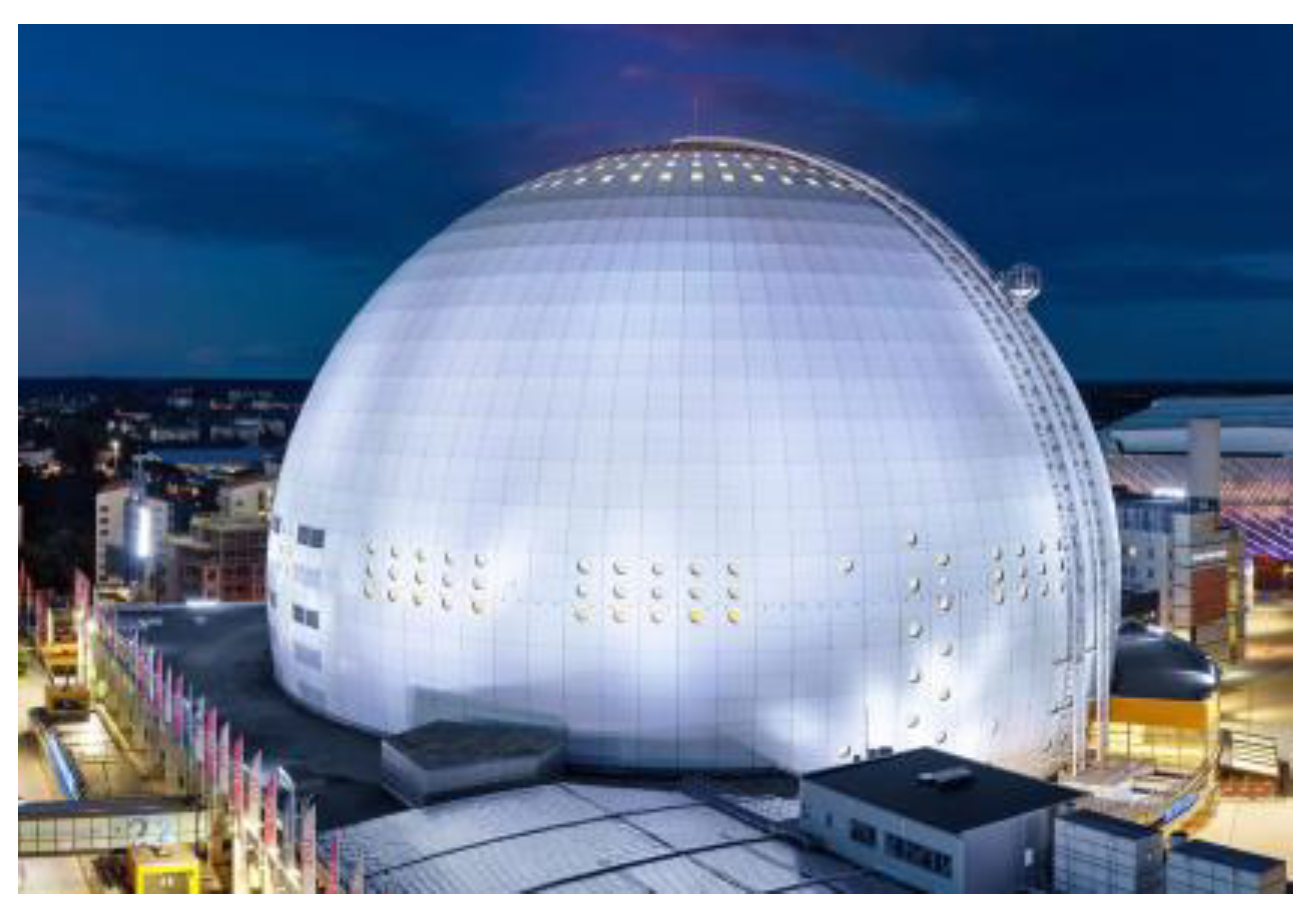
Figure 1. Avicii Arena in Stockholm, Sweden (by Stockholm Live).
Sustainability 15 04635 g001
Figure 2. (a) The New Orleans Superdome badly damaged during Hurricane Katrina (by Trahan Architects/Asm Global); (b) The Reno/Virginia peak dome collapsed due to strong wind gusting (by NWS Reno, Nevada).
Sustainability 15 04635 g002
Figure 3. The dome model for wind tunnel testing.
Sustainability 15 04635 g003
Figure 4. The WOW EF: (a) Flow management system and test section; (b) The model placed on top of the turning table; (c) Schematic diagram of the WOW EF.
Sustainability 15 04635 g004
Figure 5. Center and orientation of: (a) The turning table; (b) The dome model.
Sustainability 15 04635 g005
Figure 6. (a) Open terrain configuration with spires; (b) Suburban terrain configuration with both spires and surface roughness elements.
Sustainability 15 04635 g006
Figure 7. The coordinate system of the Cobra Probe.
Sustainability 15 04635 g007
Figure 8. Instrumentation for profiles of wind velocity.
Sustainability 15 04635 g008
Figure 9. Pressure taps installed on the dome model.
Sustainability 15 04635 g009
Figure 10. Profiles of mean along-wind velocity for open terrain without the dome (Case 1).
Sustainability 15 04635 g010
Figure 11. Turbulence intensity (TI) along height over open terrain (Case 1).
Sustainability 15 04635 g011
Figure 12. Integral length scale along height over open terrain (Case 1).
Sustainability 15 04635 g012
Figure 13. Power spectral density (PSD) of velocity in the along-wind direction at a height of 0.67 m (dome apex) over open terrain (Case 1-III).
Sustainability 15 04635 g013
Figure 14. Comparison of pressure coefficient ( C P ) on the center meridian of the dome model.
Sustainability 15 04635 g014
Figure 15. Comparison of pressure coefficient ( C P ) on the center meridian of the dome model with other studies [1,7].
Sustainability 15 04635 g015
Figure 16. Contour plots of pressure coefficients over open terrain: (a) Case 2-I; (b) Case 2-II; (c) Case 2-III.
Sustainability 15 04635 g016
Figure 17. Contour plots of pressure coefficients over suburban terrain: (a) Case 3-I; (b) Case 3-II; (c) Case 3-III.
Sustainability 15 04635 g017
Figure 18. Numerical model of CFD simulations (unit: m).
Sustainability 15 04635 g018
Figure 19. Grid arrangement of the numerical model for RANS (A and B represent Part A and B in Figure 18; X and Z represent axes of local coordinate system).
Sustainability 15 04635 g019
Figure 20. Comparisons of: (a) Velocity profiles; (b) Turbulence intensity profiles.
Sustainability 15 04635 g020
Figure 21. Comparison of pressure coefficients on the center meridian of the dome model between numerical simulations and the wind tunnel testing.
Sustainability 15 04635 g021
Figure 22. Comparisons of wind pressure distribution between numerical simulations and experimental results: (a) SA; (b) SST k-ω; (c) LES.
Sustainability 15 04635 g022
Figure 23. Streamlines on the vertical X–Z plane where Y = 0: (a) SA; (b) SST k-ω; (c) LES.
Sustainability 15 04635 g023
Figure 24. Streamlines on the horizontal X–Y plane where Z = 0.01 m (Z/D = 1/200): (a) SA; (b) SST k-ω; (c) LES.
Sustainability 15 04635 g024
Figure 25. Streamlines on the horizontal X–Y plane where Z = 0.167 m (Z/D = 1/12): (a) SA; (b) SST k-ω; (c) LES.
Sustainability 15 04635 g025
Figure 26. Identification of boundary layer separation point: (a) SA; (b) SST k-ω; (c) LES.
Sustainability 15 04635 g026
Figure 27. Iso-surfaces of Q criterion (Q = 2000) colored by mean pressure coefficients: (a) LES; (b) SST k-ω.
Sustainability 15 04635 g027
Table 1. Cases for the wind tunnel testing.
Case 1Case 2Case 3
Dome model present?NoYesYes
Terrain configurationOpenOpenSuburban
Wind speed levelIIIIIIIIIIIIIIIIII
Table 2. Force and moment.
Open TerrainSuburban Terrain
Case 2-ICase 2-IICase 2-IIICase 3-ICase 3-IICase 3-III
F X (N)45.974.1136.359.776.4127.4
F Y (N)−2.616.51.1−9.6−19.6−23.5
F Z (N)597.21188.42151.8479.21056.01764.8
M X (N·m)−1.16.90.4−4.0−8.2−9.8
M Y (N·m)−19.1−31.0−57.0−24.9−31.9−53.2
M Z (N·m)−0.02−0.03−0.08−0.03−0.05−0.08
Table 3. Force coefficient and moment coefficient.
Open TerrainSuburban Terrain
Case 2-ICase 2-IICase 2-IIICase 3-ICase 3-IICase 3-III
C F X 0.110.090.100.150.090.09
C F Y −0.010.020.00−0.02−0.02−0.02
C F Z 1.461.461.591.171.301.31
C M X 0.000.010.00−0.01−0.02−0.01
C M Y −0.07−0.06−0.06−0.09−0.06−0.06
C M Z 0.000.000.000.000.000.00
Table 4. Comparisons of forces and moments between numerical and experimental results.
TestingSAError (%)SST k-ωError (%)LESError (%)
F X (N)136.3123.79.3114.316.1145.26.6
F Z (N)2151.82192.01.92065.04.02128.01.1
M Y (N·m)−57−51.110.4−47.217.2−60.05.2
Disclaimer/Publisher’s Note: The statements, opinions and data contained in all publications are solely those of the individual author(s) and contributor(s) and not of MDPI and/or the editor(s). MDPI and/or the editor(s) disclaim responsibility for any injury to people or property resulting from any ideas, methods, instructions or products referred to in the content.