Article

Preparation of Red Iron by Magnetization Roasting-Hydrothermal Method Using Ultra-Low-Grade Limonite

1
Dongying Key Laboratory of Salt Tolerance Mechanism and Application of Halophytes, Dongying Institute, Shandong Normal University, No. 2 Kangyang Road, Dongying 257000, China
2
Institute for Carbon Neutrality, Shandong Normal University, Jinan 250014, China
3
College of Chemistry, Chemical Engineering and Materials Science, Shandong Normal University, Jinan 250014, China
4
Key Lab of Plant Stress Research, College of Life Sciences, Shandong Normal University, Jinan 250014, China
5
National & Local Joint Engineering Research Center of Biomass Resource Utilization, Nankai University, Jinnan District, Tianjin 300350, China
*
Authors to whom correspondence should be addressed.
Sustainability 2023, 15(6), 4708; https://doi.org/10.3390/su15064708
Submission received: 4 February 2023 / Revised: 27 February 2023 / Accepted: 1 March 2023 / Published: 7 March 2023

Abstract

:
Iron is one of the most important strategic materials in national production, and the demand for iron ore is huge in the world. High quality iron ore reserves have been almost exhausted, and it is necessary to develop a technology that utilizes low-grade iron ore. Limonite is a representative low-grade iron ore due to its complex mineral and elemental composition. In this paper, the union process was employed to separate the iron elements in low-grade limonite. Firstly, a rough iron concentrate was obtained under 1.0 T of magnetic field intensity and −0.074 mm > 94.84% of grinding fineness; then, the rough iron concentrate was magnetization roasted under a temperature of 700 °C, 60 min of retention time, 3 wt% of biochar consumption, and 0.15 T of magnetic field intensity. The grade of iron concentrate was 59.57% and the recovery of iron was 90.72%. Finally, the red iron pigment was produced via a high temperature hydrothermal method in order to increase the additional value of this ultra-low-grade limonite. The optimal parameters were 10.0 g/L of solution acidity, a 200 °C reaction temperature, 5 h of reaction time, and a 6:1 solid-to-liquid ratio. The reaction mechanism was also discussed.

1. Introduction

Iron is a widely distributed element in the earth’s crust, constituting up to 4.75% [1]. The raw ores in the earth’s crust that are used for industrial ironmaking include hematite, magnetite, and siderite [2]. With high-quality iron ores having been almost exhausted [3,4], processing methods for low-grade iron ores should be developed and utilized.
Limonite is a representative low-grade iron ore that possesses the oxides and hydroxides of amorphous iron; it is primarily composed of goethite (α-FeOOH), acicular hydrogoethite (α-FeOOH·nH2O), varying amounts of lepidocrocite (γ-FeOOH), and hydrolepidocrocite (γ-FeOOH·nH2O) [5,6]. Limonite is generally earthy, colloidal (kidney-shaped, stalactite, etc.), amorphous, or cryptocrystalline, and often develops in hematite–goethite fissures and geodes, filled with metasomatism and cementation [7,8]. Except for in low-grade iron, limonite features large differences in its chemical composition and moisture content, and it is easy to overgrind, which causes argillization [9]. Currently, the treatments used for limonite mainly include washing, gravity separation, magnetic separation, gravity–magnetic separations, flotation, high-intensity magnetic separation–direct flotation, and high-intensity magnetic separation–reverse flotation, etc. [10,11,12]. Among these, the magnetization roasting–magnetic separation process is the most efficient technology. Commonly, magnetization roasting technology is applied to iron ores with weak magnetic properties (hematite, limonite, etc.), and these weak magnetic iron ores react with the reducing agents (coal, biochar, etc.) to change into strong magnetic magnetite under certain temperature and atmospheric conditions; meanwhile there is no significant change in the magnetism of the gangue connected with these iron-bearing minerals. Hence, the generated magnetite could be separated using low-intensity magnetic separation technology [13,14]. Coal is the common reducing agent for magnetization roasting, but excessive sulfur emission from coal causes serious environmental pollution [15]. Biochar, with an extremely low sulfur concentration, is an environmentally friendly reducing agent [16]; however, few studies reporting on the application of biochar in magnetization roasting have been published. In addition, the consumption of biochar would not cause the extra CO2 emission. Therefore, it is interesting to use biochar as the reducing agent in the magnetization roasting process.
The generated magnetite is the raw material of red iron pigments, which are widely applied in architectural coatings, cosmetics, and the art and painting industries because of their water insolubility, nontoxicity, wide chromatogram, low cost, and high concealing power [17,18]. However, a method that combines pyro- and hydro-metallurgical processes is the common production process for red iron; meanwhile, the final product always has an unsatisfactory purity, and produces harmful flue gases (SO2). Conversely, the high-temperature hydrothermal method is an efficient and environmentally friendly technology that is able to prepare pure red iron during its short technological process without the emission of SO2 flue gas [19].
Hence, the research object of this study was ultra-low-grade limonite, and thus the elemental and mineral compositions of this raw ore were analyzed. Then, high-intensity magnetic separation was employed to separate the iron-containing minerals. The magnetization roasting–grinding classification–weak magnetic separation method was selected, and the parameters, including roasting temperature, roasting time, reducing agent amount, and grinding fineness, were explored. Next, the red iron was produced via the high-temperature hydrothermal method, and the reaction parameters were explored, including solution acidity, reaction temperature, reaction time, and the solid–liquid ratio. Finally, the reaction mechanism of this high-temperature hydrothermal process was also discussed.

2. Materials and Methods

2.1. Reagents and Materials

The raw ore was collected from Sichuan province, China. Carboxymethylcellulose sodium (CMC, AR) was used as the adhesive in the magnetization roasting experiment. Biochar preparation was detailed in our past studies [19], and corn straw was used as the raw material for the biochar preparation. The corn straw was collected from an agricultural area in Ninghe District, Tianjin, China. It was washed with deionized water and dried in air. Subsequently, the biomass was ground and passed through a 0.5 mm mesh sieve, which was converted to biochar via slow anaerobic pyrolysis at 600 °C for 2.0 h at a heating rate of 4.0 °C/min under a continual N2 flow. The samples prepared at different temperatures were named B600.

2.2. Experimental Methods

2.2.1. Grinding Fineness

High-intensity magnetic separation is directly influenced by the fineness of raw ore, and a suitable fineness results in the high grade and recovery of the concentrate. Meanwhile, the extremely fine particles can cause argillization, resulting in the loss of iron components. The experimental parameters of the grinding fineness were as follows: 1.0 kg of sample was selected each time, and it was ground in a XMB-Φ200 × 240 rod mill. The fineness was controlled by changing the grinding time, and the best fineness was determined based on the grade and recovery of the iron element in the concentrate under high-intensity magnetic separation.

2.2.2. High-Intensity Magnetic Separation

The raw ore was an ultra-low-grade limonite, and continuing directly with the process of magnetization roasting without any pre-treatment would cause a serious waste of energy and reducing agent. Thus, high-intensity magnetic separation was employed to roughly separate the iron-bearing minerals in raw ore. The experimental parameters were as follows: 1.0 kg of ground sample was selected each time, and the magnetic separation was executed in a Slon 100 periodic pulsating high-gradient magnetic separator. The grade and the recovery of the rough iron concentrate were controlled by changing the magnetic field intensity.

2.2.3. Magnetization Roasting

During this section, the rough iron concentrate was mixed with biochar in a certain proportion, and the adhesive (CMC) and water were also added to this mixture with the mass ratios of 0.3% and 15%. Then, the mixed sample was manually rubbed into pellets with a diameter of 10–15 mm and dried in the air at a low temperature. The orthogonal method was used to design the experimental scheme for the magnetization roasting, and the primary experiment parameters were explored, including the roasting temperature (600–900 °C, 100 °C interval), roasting time (30–60 min, 10 min interval), and the reducing agent dosage (3–10%). This experiment was executed in a SK-G12123K-610 tube furnace under the reaction atmosphere of nitrogen (flow rate: 100 mL/min). After completion, the pellets subjected to magnetization roasting were quickly transferred into cold water for quenching.

2.2.4. Weak Magnetic Separation

The magnetization roasting pellets were milled, and the magnetite in the sample was separated in the XCGS-Φ50 magnetic separator tube with a weak magnetic field intensity. The beneficiation efficiency η was defined and expressed in Formula (1), the recovery of iron ε was expressed in Formula (2), and the yield of iron γ was expressed in Formula (3):
η = ϵ γ 100 γ · β α β m a x α
ε = m c × c c m r × c r × 100 %
γ = m c × c c m r × 100 %
where ε was the recovery of iron in the concentrate (%), γ was the yield of iron in the concentrate (%), β was the grade of iron in the iron concentrate, βmax was the theoretical iron grade of magnetite, α was the grade of iron in the magnetization roasting sample, mr was the mass of raw ore, mc was the mass of iron concentrate, cr was the grade of iron in the raw ore, and cc was the grade of iron in the iron concentrate.

2.2.5. Red Iron Preparation

The preparation of red iron was executed in a YZPR-250 stainless steel high-pressure reactor. The experimental parameters were as follows: 10.0 g of iron concentrate was selected each time, sulfuric acid aqueous solutions with different concentrations were added according to a certain solid-to-liquid ratio, the reactor was purified with N2 and screwed tightly, and the stirring speed was set to 500 r/min at the set temperature for a period of time. After completion, the reactor was quickly cooled, and the solid–liquid separation was implemented and washed three times with sulfuric acid aqueous solution with pH = 2. Finally, red iron was dried in a vacuum oven at a low temperature.

2.3. Characterizations

XRD analyses were performed using an X-ray Diffractometer (X’Pert PRO, PANalytical, Almelo, The Netherlands) with a Cu-Kα (λ = 0.15418 nm) radiation source. A continuous scan mode was used to collect the 2θ scan XRD data. Element concentrations of the raw material were measured by Elemental Analyzer (Euro EA3000, Leeman, WI, USA). The morphology analysis of the red iron sample was determined by scanning electron microscopy (SEM) (UItra55, Carl Zeiss Irts Corp., Oberkochen, Germany), and chemical components analyses were performed using Energy Dispersive Spectroscopy. X-ray fluorescence (XRF) analysis was performed using the energy dispersive X-ray fluorescence (ED-XRF) spectrometer from Axios, equipped with a Rhodium X-ray tube and an X-Flash SDD detector. Then, 0.3 g of dry sample and 4 g of KBr were placed inside a pellet box and were compacted using a hydraulic press for 1 min at a pressure of 3 × 10³ kg.

3. Results and Discussions

3.1. Physicochemical Properties of Raw Material

3.1.1. Raw Ore

The X-ray diffraction (XRD) pattern (Figure 1) shows that the mineral component in the raw ore was complex and that the primary minerals were quartz (pdf = No. 46-1045), muscovite (pdf = No. 21-0993), ferrihydrite (pdf = No. 29-0712), and lepidocrocite (pdf = No. 44-1415). The semiquantitative analysis (XRF, Table 1) result of the raw ore showed that the raw ore had a complex elemental composition, and that the primarily elements were Si, Al, Mg, K, Ti, and Fe. In addition, the accurate grade of iron was 9.63% in the raw ore, measured by the chemical titration. Hence, these results demonstrated that this raw ore was attributable to the ultra-low-grade limonite.

3.1.2. Biochar

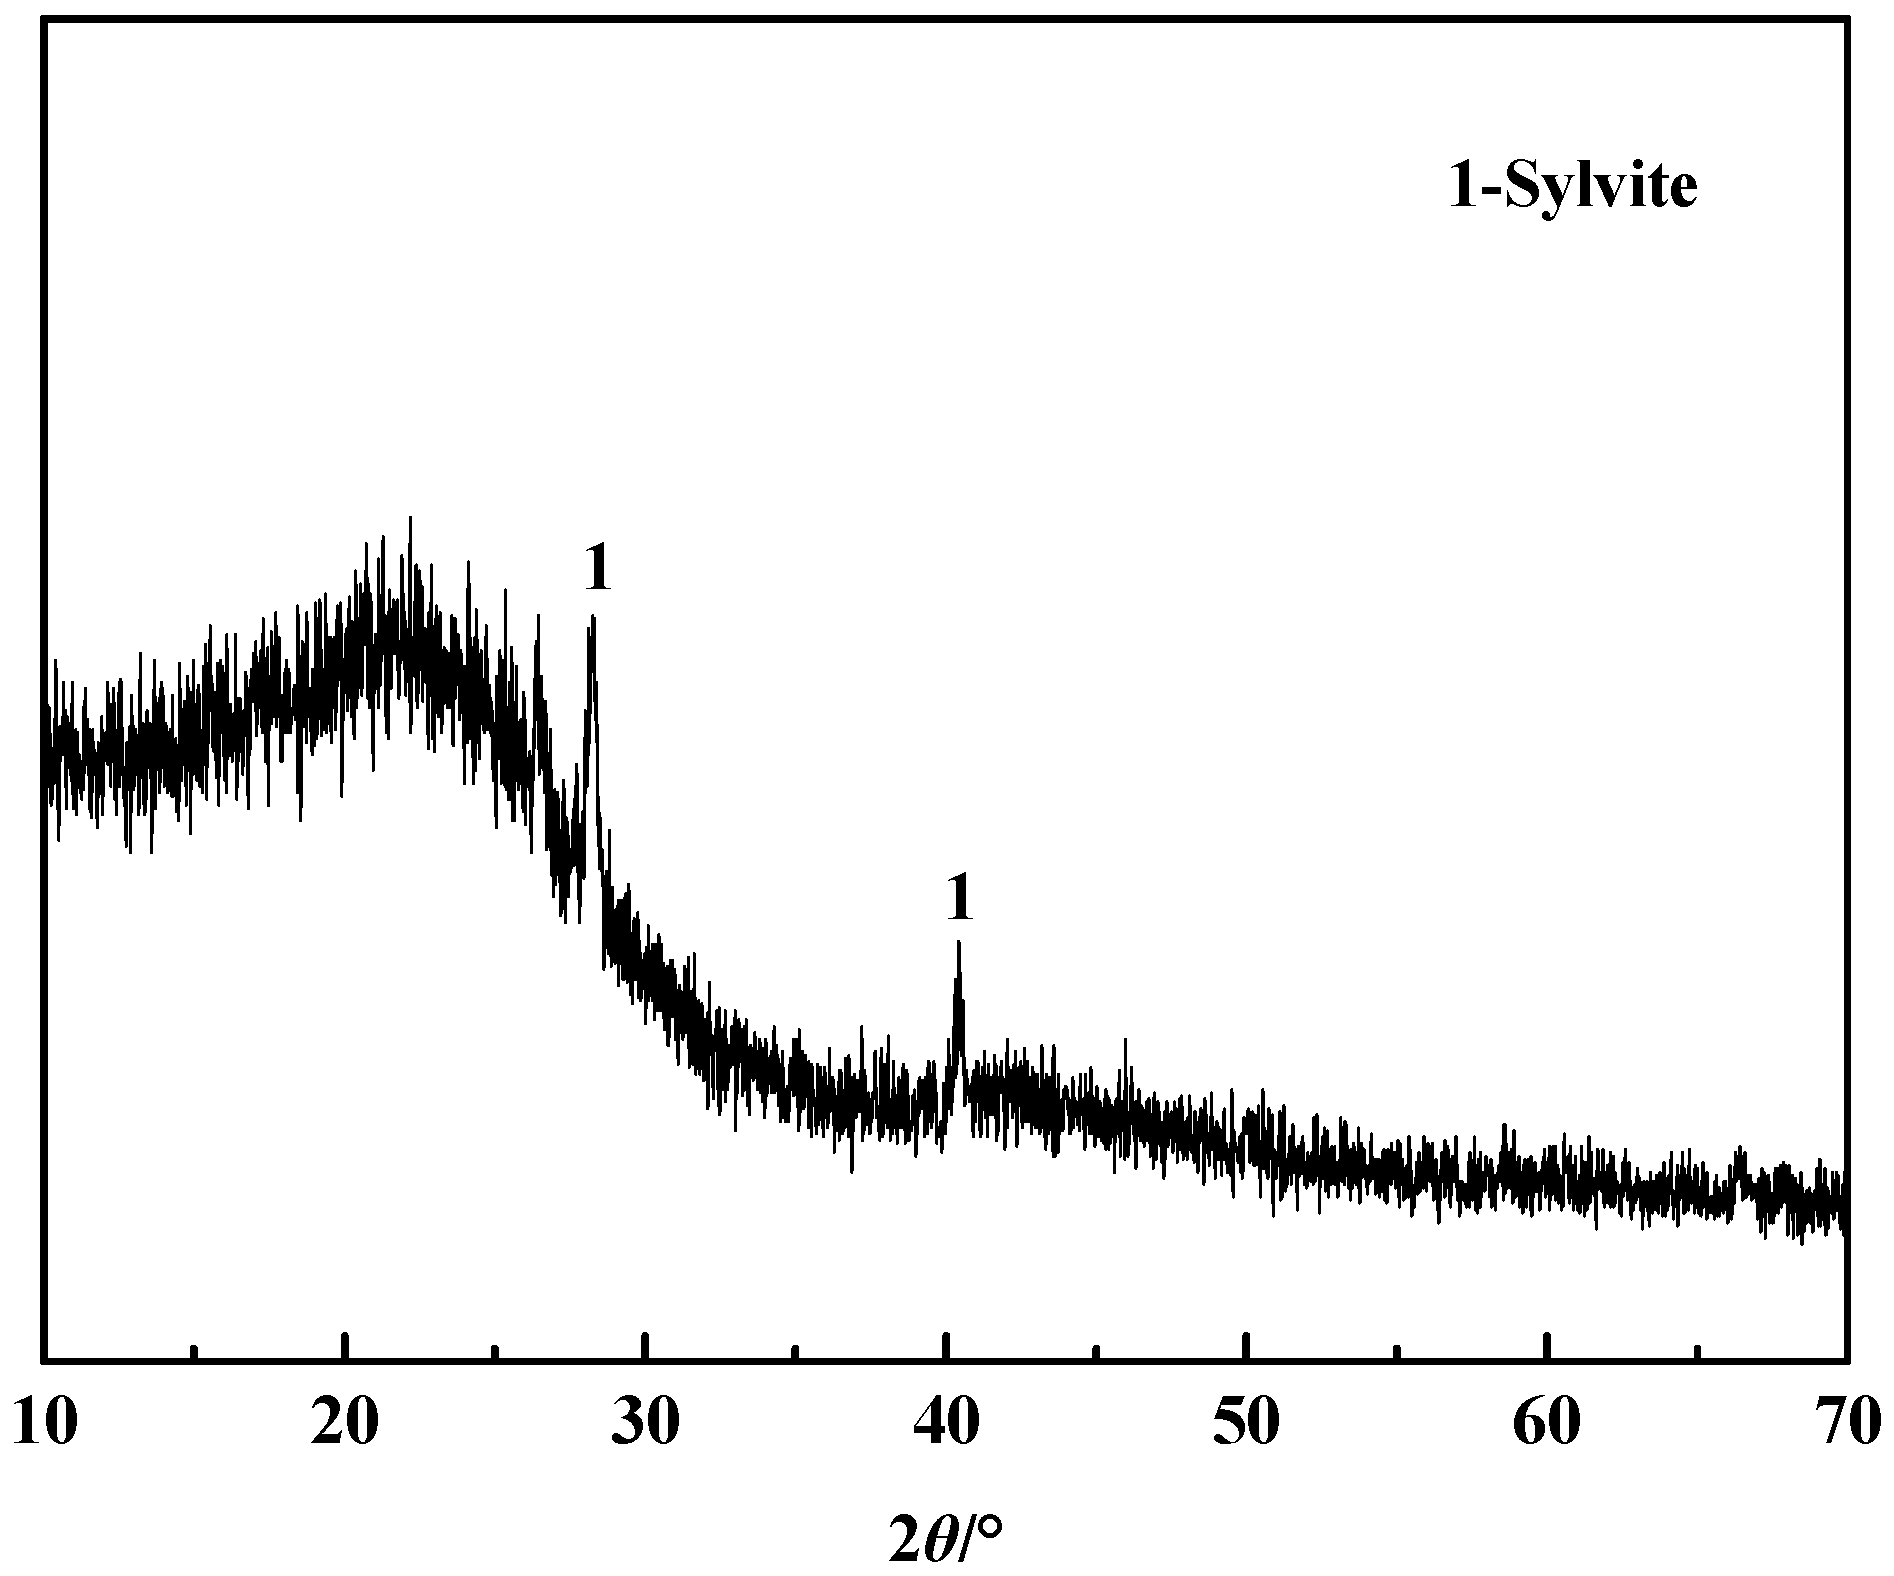
The basic physicochemical properties of the biochar sample are summarized in Table 2, and the XRD spectrum of the biochar sample is illustrated in Figure 2. As shown in Table 2, (i) the concentration of C element in biochar sample was 77.19%, which would be beneficial to the magnetization roasting of limonite; (ii) there was no S element in the biochar sample. As shown in Figure 2, the XRD spectrum of the biochar sample shows that, (i) the broad diffraction peak from 2θ = 15–25° was attributed to the aliphatic chain, suggesting that cellulose and hemicellulose in the biomass were low [20]; (ii) the diffraction peaks near 2θ = 28.5°and 40.6° were all ascribed to sylvite (pdf = No. 41-1476). This good-quality biochar was a good reducing agent and was similar to the traditional coal.

3.2. Grinding Fineness

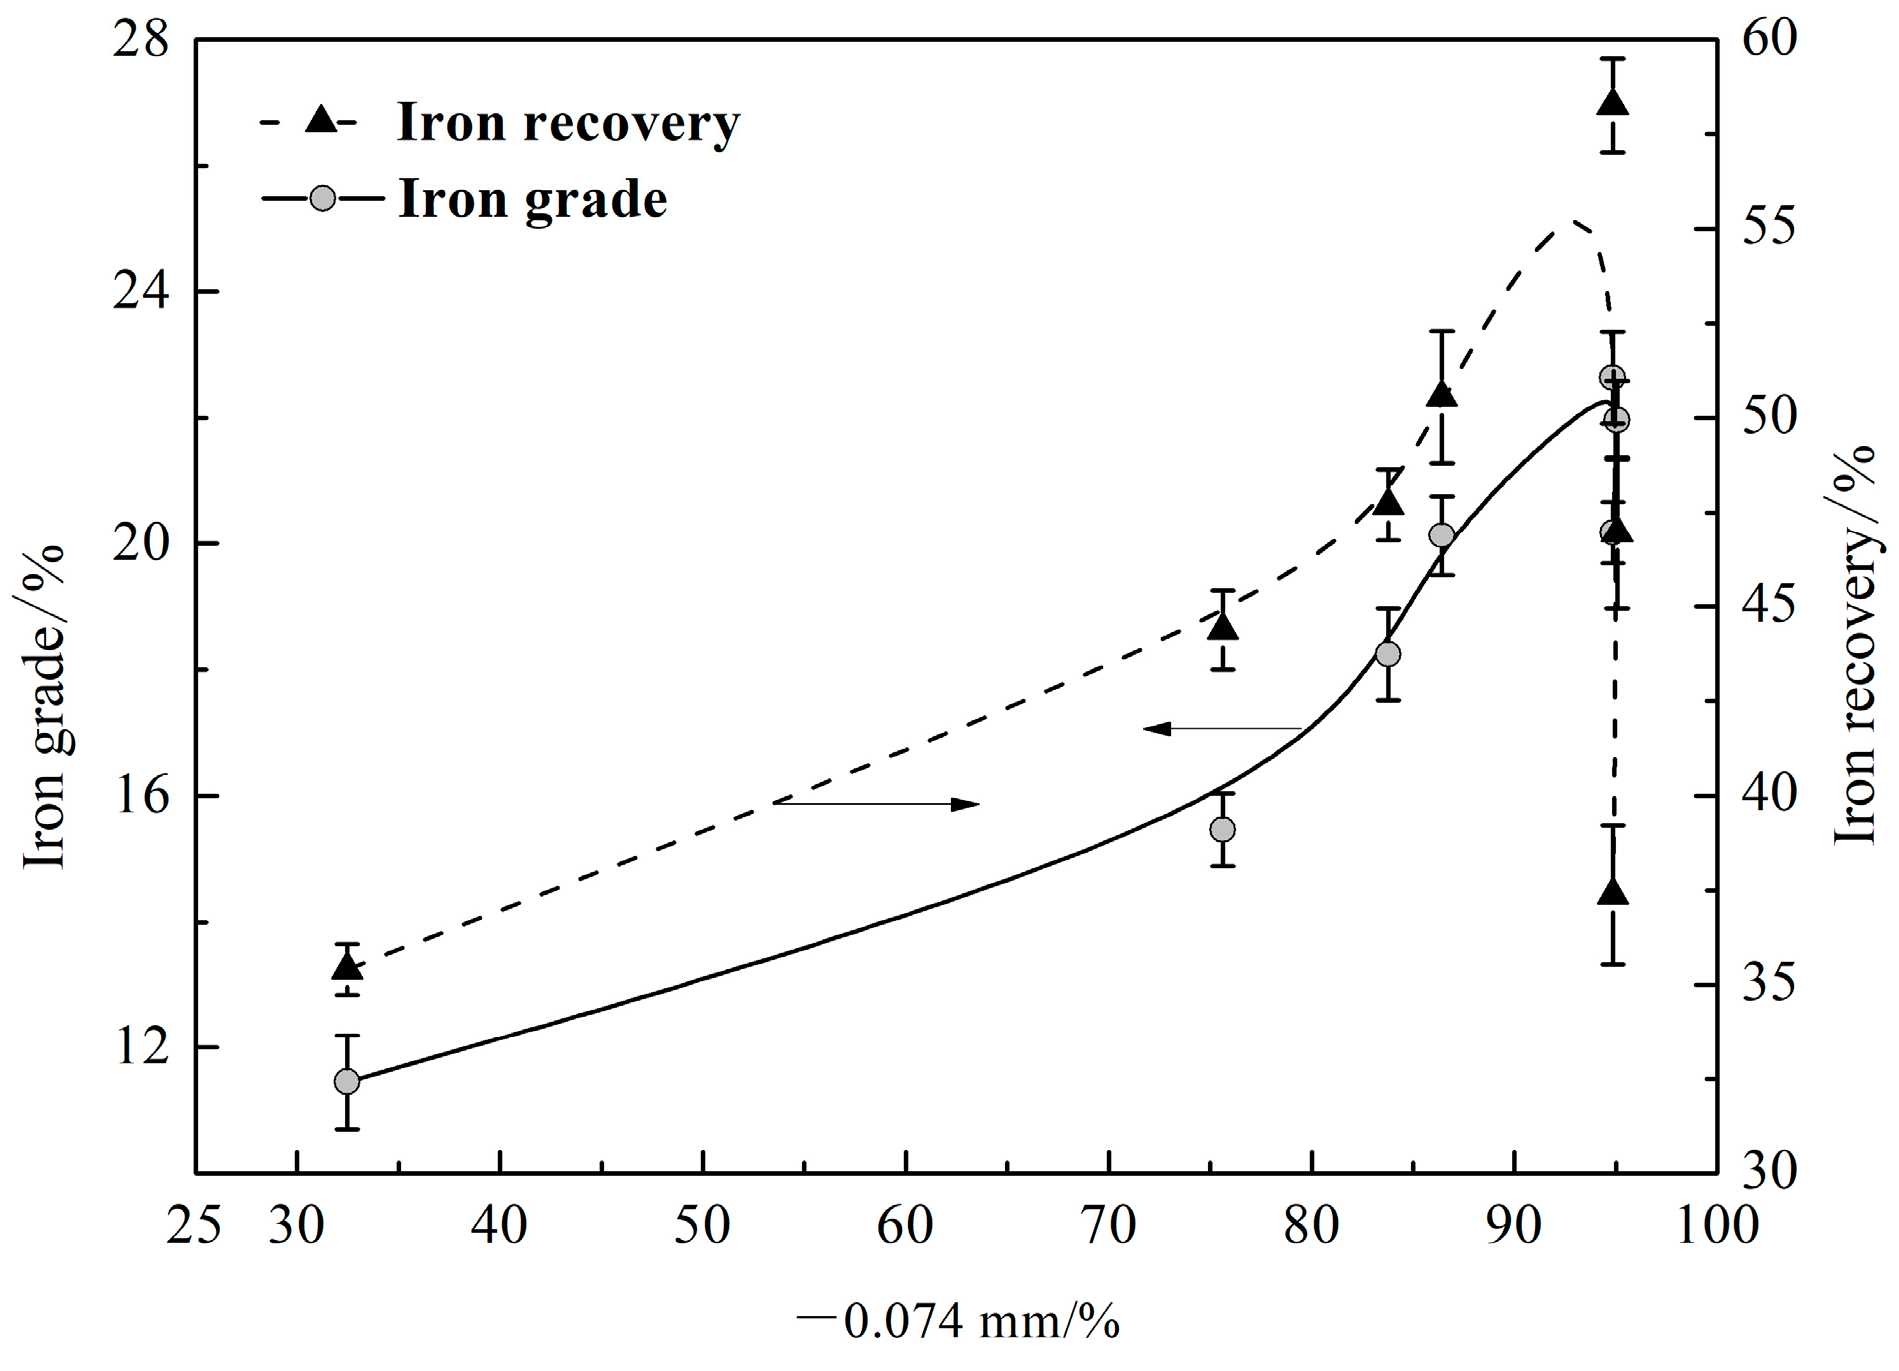
The technological process and curve of grinding fineness are shown in Figure 3, and the effect of particle size on magnetic separation is shown in Figure 4. Figure 3 shows that, (i) the percentage of particles that had sizes less than 0.074 mm increased with an increasing grinding time; (ii) approximately 94.84% of raw ore exhibited a particle size less than 0.074 mm after grinding for 90 min; (iii) when the grinding time exceeded 90 min, there was no change in the content of particles whose sizes were less than 0.074 mm. Figure 4 suggests that, (i) as the content of the particles with a size less than 0.074 mm increased, the grade of iron in the rough iron concentrate increased with the increasing recovery of iron; (ii) when the content of the particle size was less than 0.074 mm, accounting for approximately 94.84%, the grade of iron in the rough iron concentrate was 22.64%, with a recovery of 58.25%; (iii) when the particle size was too small, both the grade and the recovery of iron in the rough iron concentrate decreased; this was caused the argillization of raw ore. Hence, the suitable grinding time was selected as 90 min.

3.3. High-Intensity Magnetic Separation

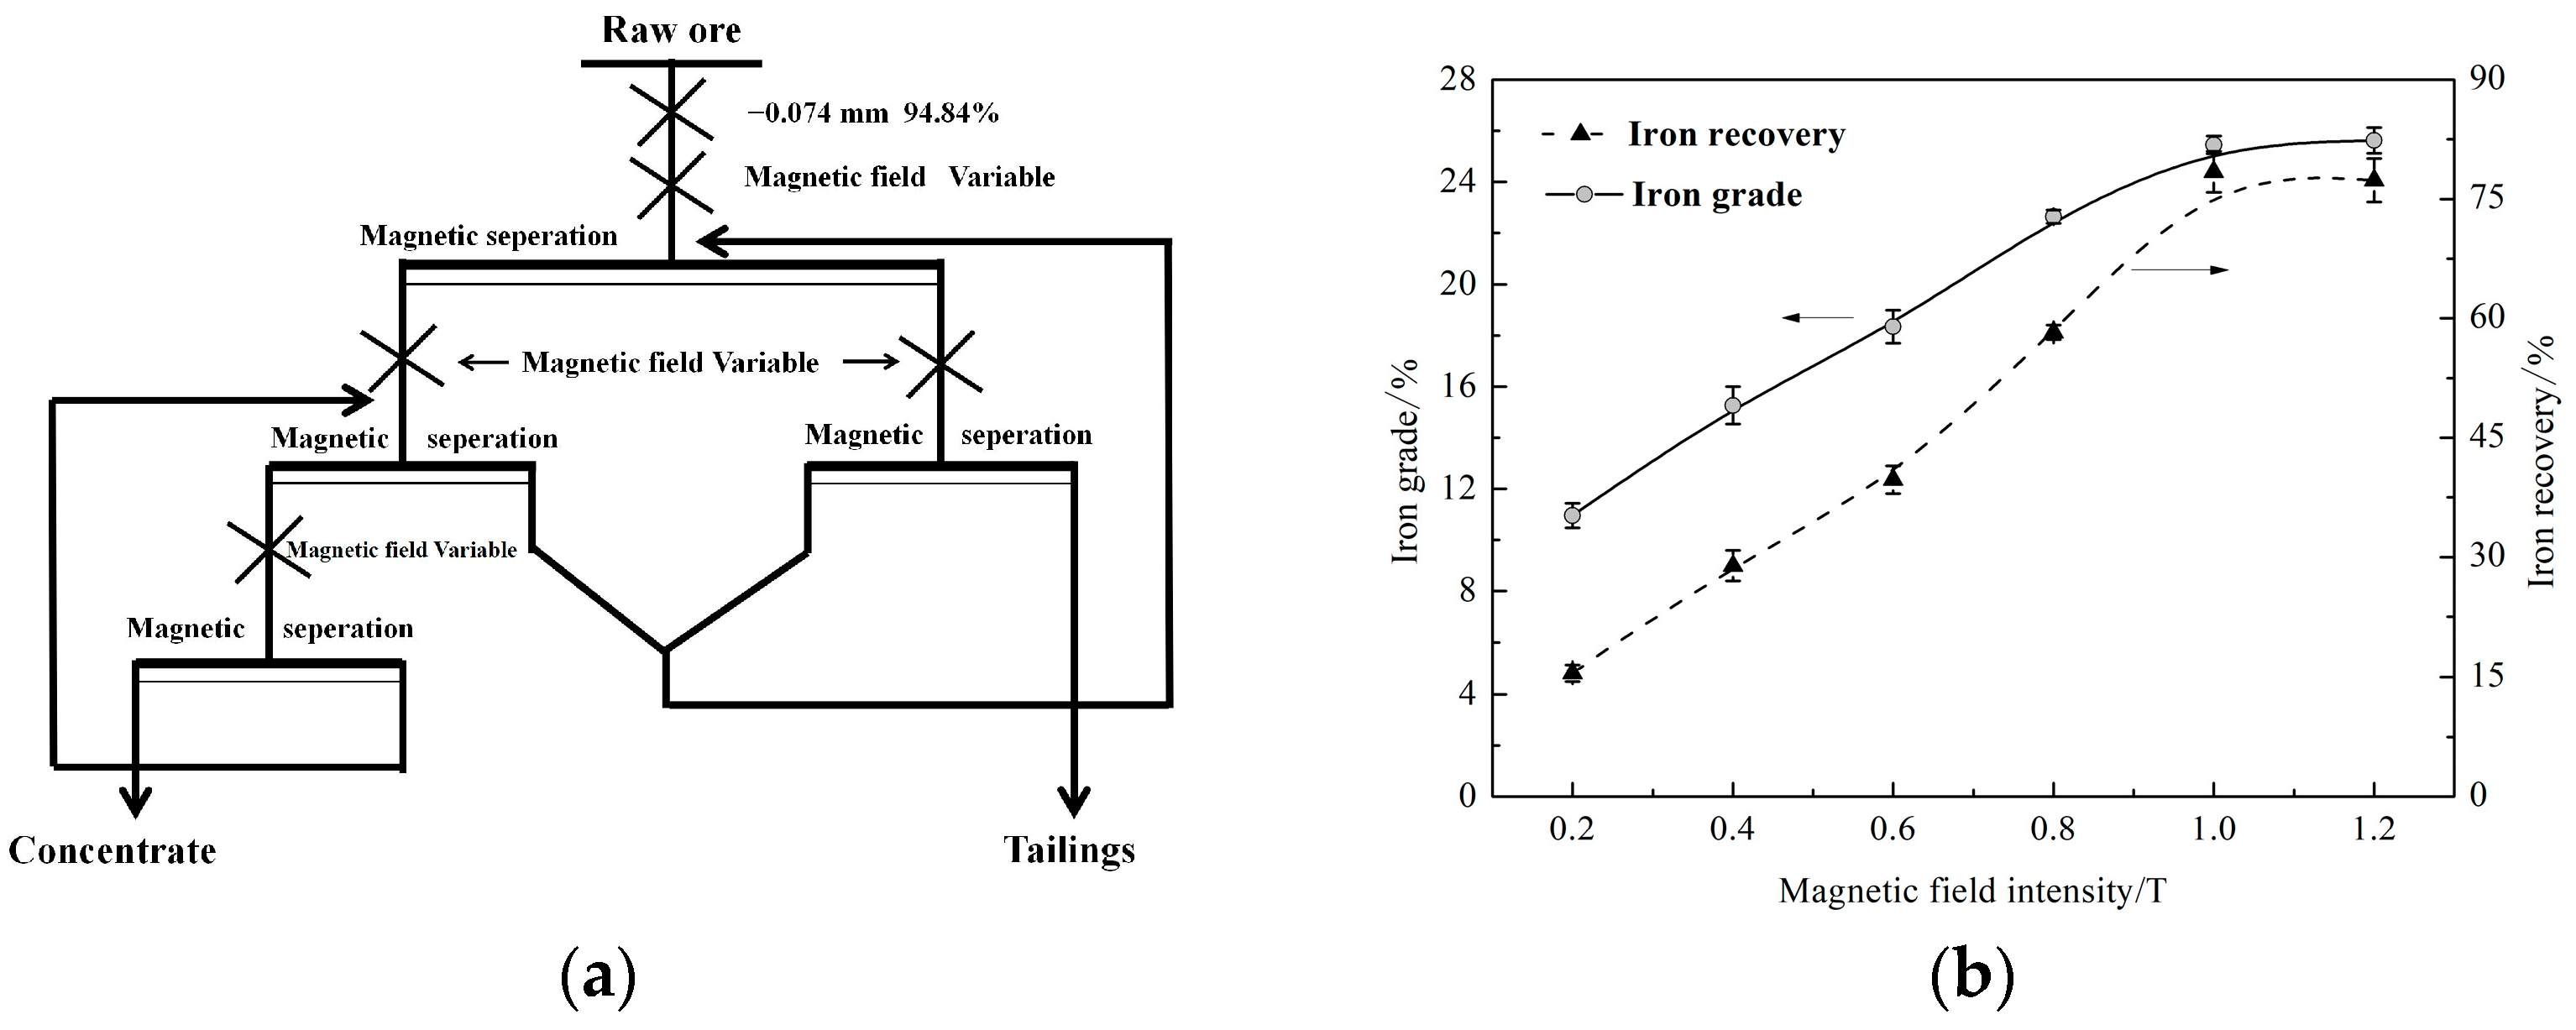
The technological process and curve of high-intensity magnetic separation are shown in Figure 5. The results show that, (i) the grade and recovery of iron in rough iron concentrate increased with the increasing magnetic field intensity; (ii) when the magnetic field intensity was 1.0 T, the grade and recovery of iron in rough iron concentrate was 25.45% with a recovery of 78.42%; (iii) when the magnetic field intensity increased to 1.2 T, there was no obvious change in both the grade and the recovery of the iron concentrate. Hence, the suitable magnetic field intensity was selected as 1.0 T.

3.4. Magnetization Roasting-Weak Magnetic Separation

3.4.1. Orthogonal Test

In this section, the effects of roasting temperature, roasting time, and biochar dosage on the magnetization roasting–weak magnetic separation method are explored. Table 3, Table 4 and Table 5 present the values of each factor at different levels, the results of the orthogonal test, and the results of the range analysis, respectively. The results of the range analysis suggest that the sequences of these three factors that influenced the beneficiation efficiency were in the order of time > temperature > coal consumption. The appropriate parameters were as follows: a roasting temperature of 700 °C, 60 min of roasting time, and 3 wt% of biochar dosage.

3.4.2. Optimization Verification

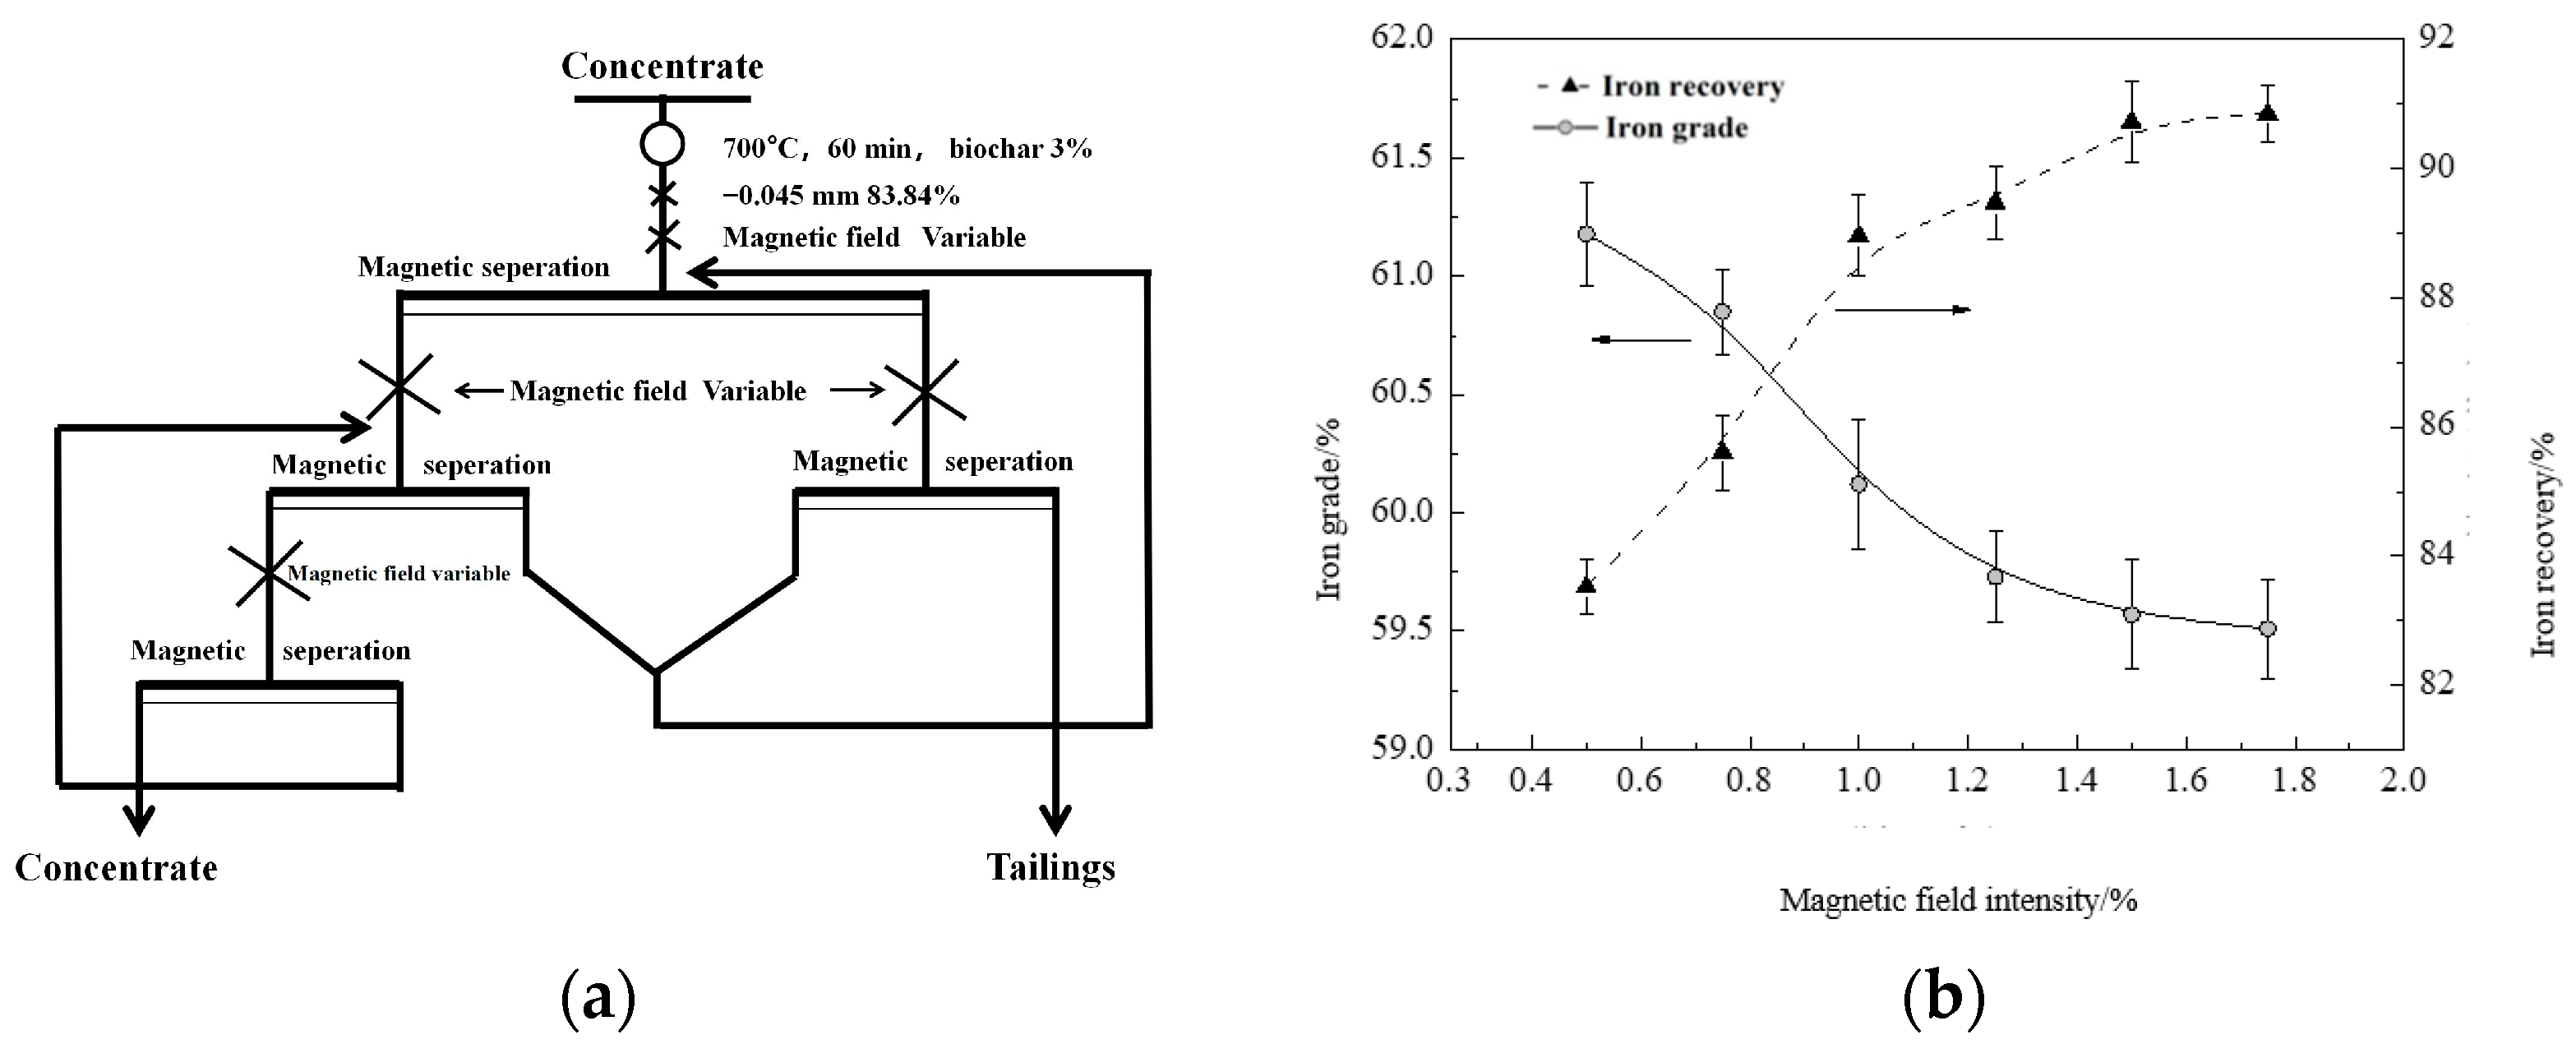
According to the results of the orthogonal test, the optimization verification test was executed and the results are shown in Table 6. Compared with the results of the orthogonal test, the results of the optimization verification test show that the grade and recovery of iron in rough iron concentrate was higher, while the grade of iron was still low. This may be caused by the non-monomer dissociation of magnetite. Therefore, the grinding fineness was determined, and the results are shown in Figure 6. The results indicate that, (i) with the increasing content of particles with a size less than 0.045 mm, the grade and the recovery of iron in rough iron concentrate increased; (ii) when the content of particles with a size less than 0.045 mm was 83.84%, there was no obvious relationship between the grinding time and particle size. Additionally, the intensity of the magnetic field had a greater impact on the recovery of magnetite. Thus, the effect of a weak magnetic field intensity on the grade and recovery of iron was explored, and the results are shown in Figure 7. The results indicate that, (i) the grade of iron decreased, while the recovery of iron increased with the increasing intensity of the weak magnetic field; and (ii) when the intensity of the weak magnetic field was higher than 0.15 T, there was no obvious change in both the grade and the recovery of iron. Therefore, the optimum intensity of the weak magnetic field was 0.15 T.

3.5. Preparation of Red Iron

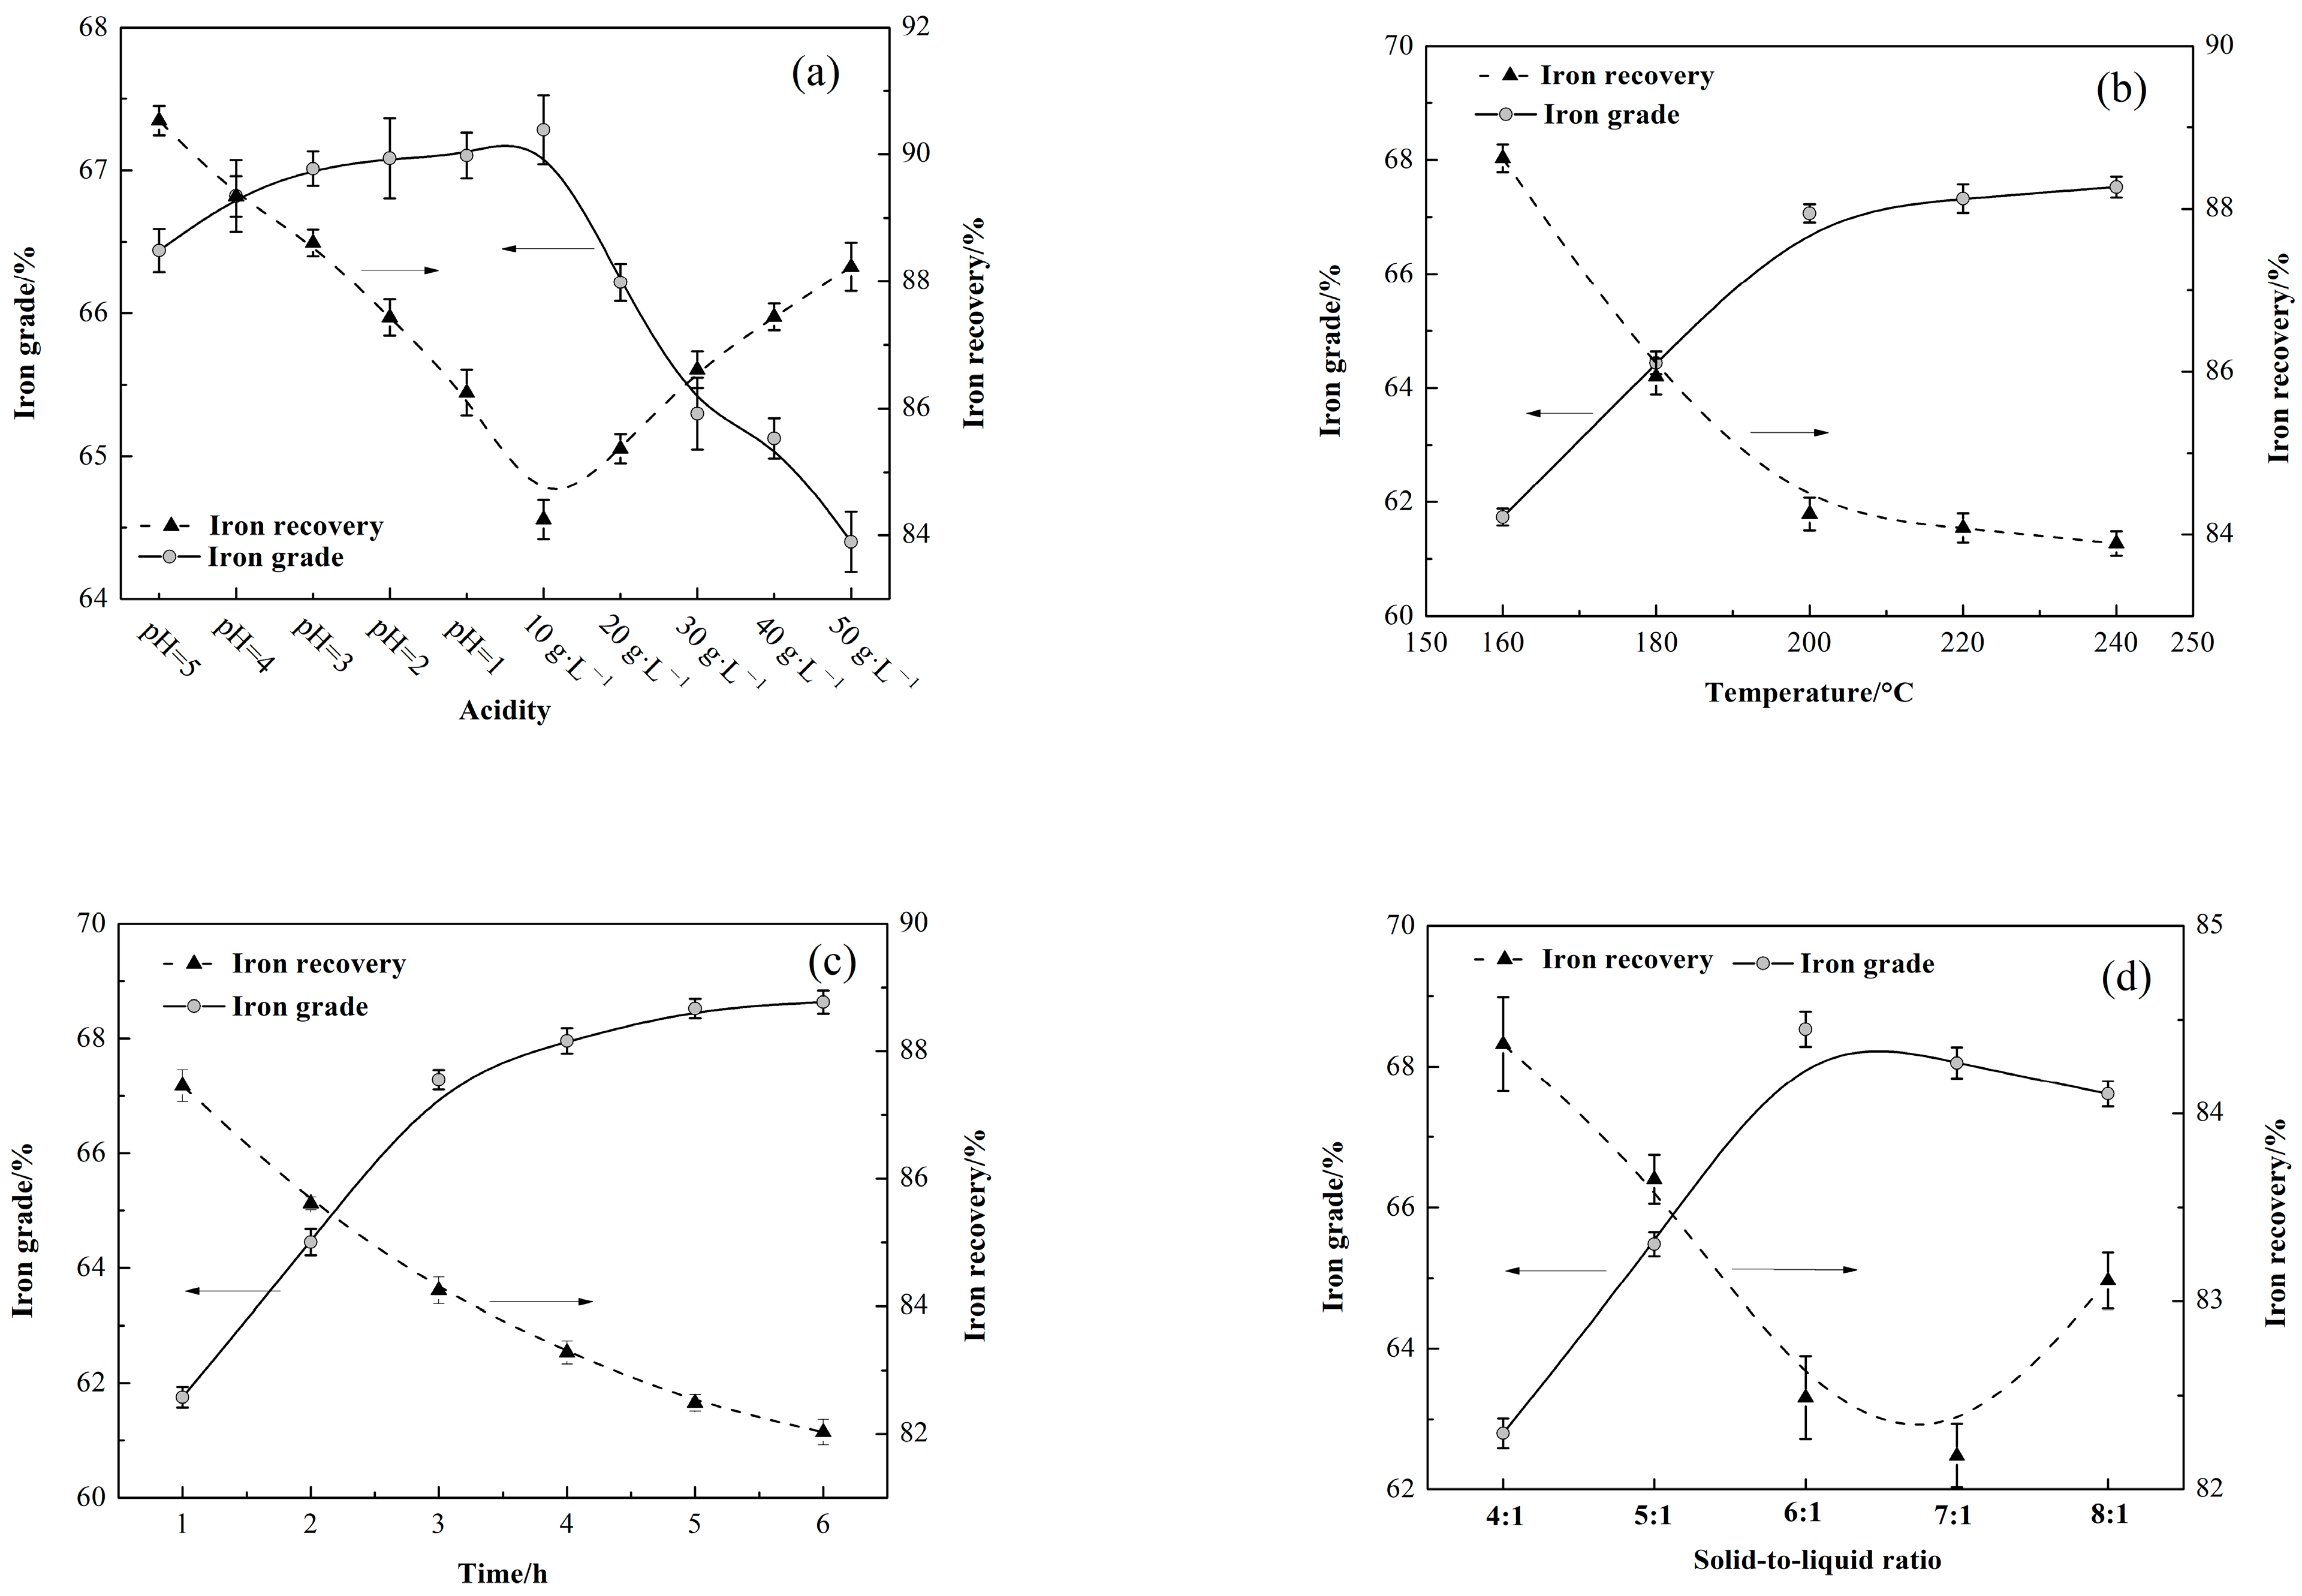
The solution acidity is an important parameter in the preparation of red iron. Sulfuric acid aqueous solution was selected as the acidity regulator, and the results are shown in Figure 8a. The results suggest that the grade of iron in red iron increased slowly and then decreased significantly with the increasing solution acidity; meanwhile, the recovery decreased, which the high concentration of sulfuric acid dissolve to generate iron oxide. Hence, the suitable solution acidity was 10.0 g·L−1. The effect of the reaction temperature on the grade and the recovery of iron in red iron products was studied, and the results are shown in Figure 8b. The results indicate that, (i) when the reaction temperature increased from 160 °C to 240 °C, the grade of iron in red iron product increased rapidly and then changed little, while the recovery of iron decreased; and (ii) when the reaction temperature was 200 °C, the grade of iron was 67.06% and the recovery was 84.25%. Hence, the reaction temperature was selected as 200 °C. The effect of the reaction time on the grade and the recovery of iron in red iron product was studied, and the results are shown in Figure 8c. The results suggest that when the reaction time increased, the grade of iron in red iron increased rapidly and then changed little, while the recovery decreased. When the reaction time was 5 h, the grade of iron was 68.52%, and the recovery was 82.49%. The effect of the solid-to-liquid ratio on the grade and the recovery of iron in red iron product was also studied, and the results are shown in Figure 8d. The results suggest that when the solid-to-liquid ratio increased, the grade of iron in red iron product increased and then changed little. When the solid-to-liquid ratio was 6:1, the grade of iron in red iron product was 68.53% and the recovery was 82.49%. Hence, the preferable solid-to-liquid ratio in the reaction was 6:1. However, the pressure of the process at 200 °C was not observed during the process.

3.6. Reaction Mechanism

The possible stability region of the impurities in rough iron concentrate is shown in Figure 9. Under the optimal solid-to-liquid ratio, the impurities in the magnetizing roasted sample changed from the stable region to the unstable region with the increasing solution acidity. When the solution acidity was higher than pH = 1, the impurities (such as ferroaluminum) were decomposed. With the acidity of the reaction system increasing continually, S components were released from the undissolved substances (such as ferric subsulfate) and dissolved in the reaction system in the form of sulfate radical, decreasing the concentration of S in red iron. Meanwhile, when the acidity of the reaction system was too high, the stability of red iron decreased firstly and then dissolved. Hence, the acidity of the reaction system should not be too high. Under the suitable acidity and solid-to-liquid ratio, the reaction temperature has a significant effect on S removal of red iron product. With the increase in the reaction temperature, the thermodynamically stable region of the stable phases increased, while that of the metastable phases (e.g., ferric subsulfate, ferroaluminum) decreased, resulting in a decrease in the stability. Then, these metastable phases dissolved and S components entered into the reaction system in the form of a sulfate radical. Meanwhile, the ferric ion in these metastable phases generated Fe2O3, and the relevant chemical equations are as follows. Hence, the quality of the red iron improved.

3.7. Quality Inspection

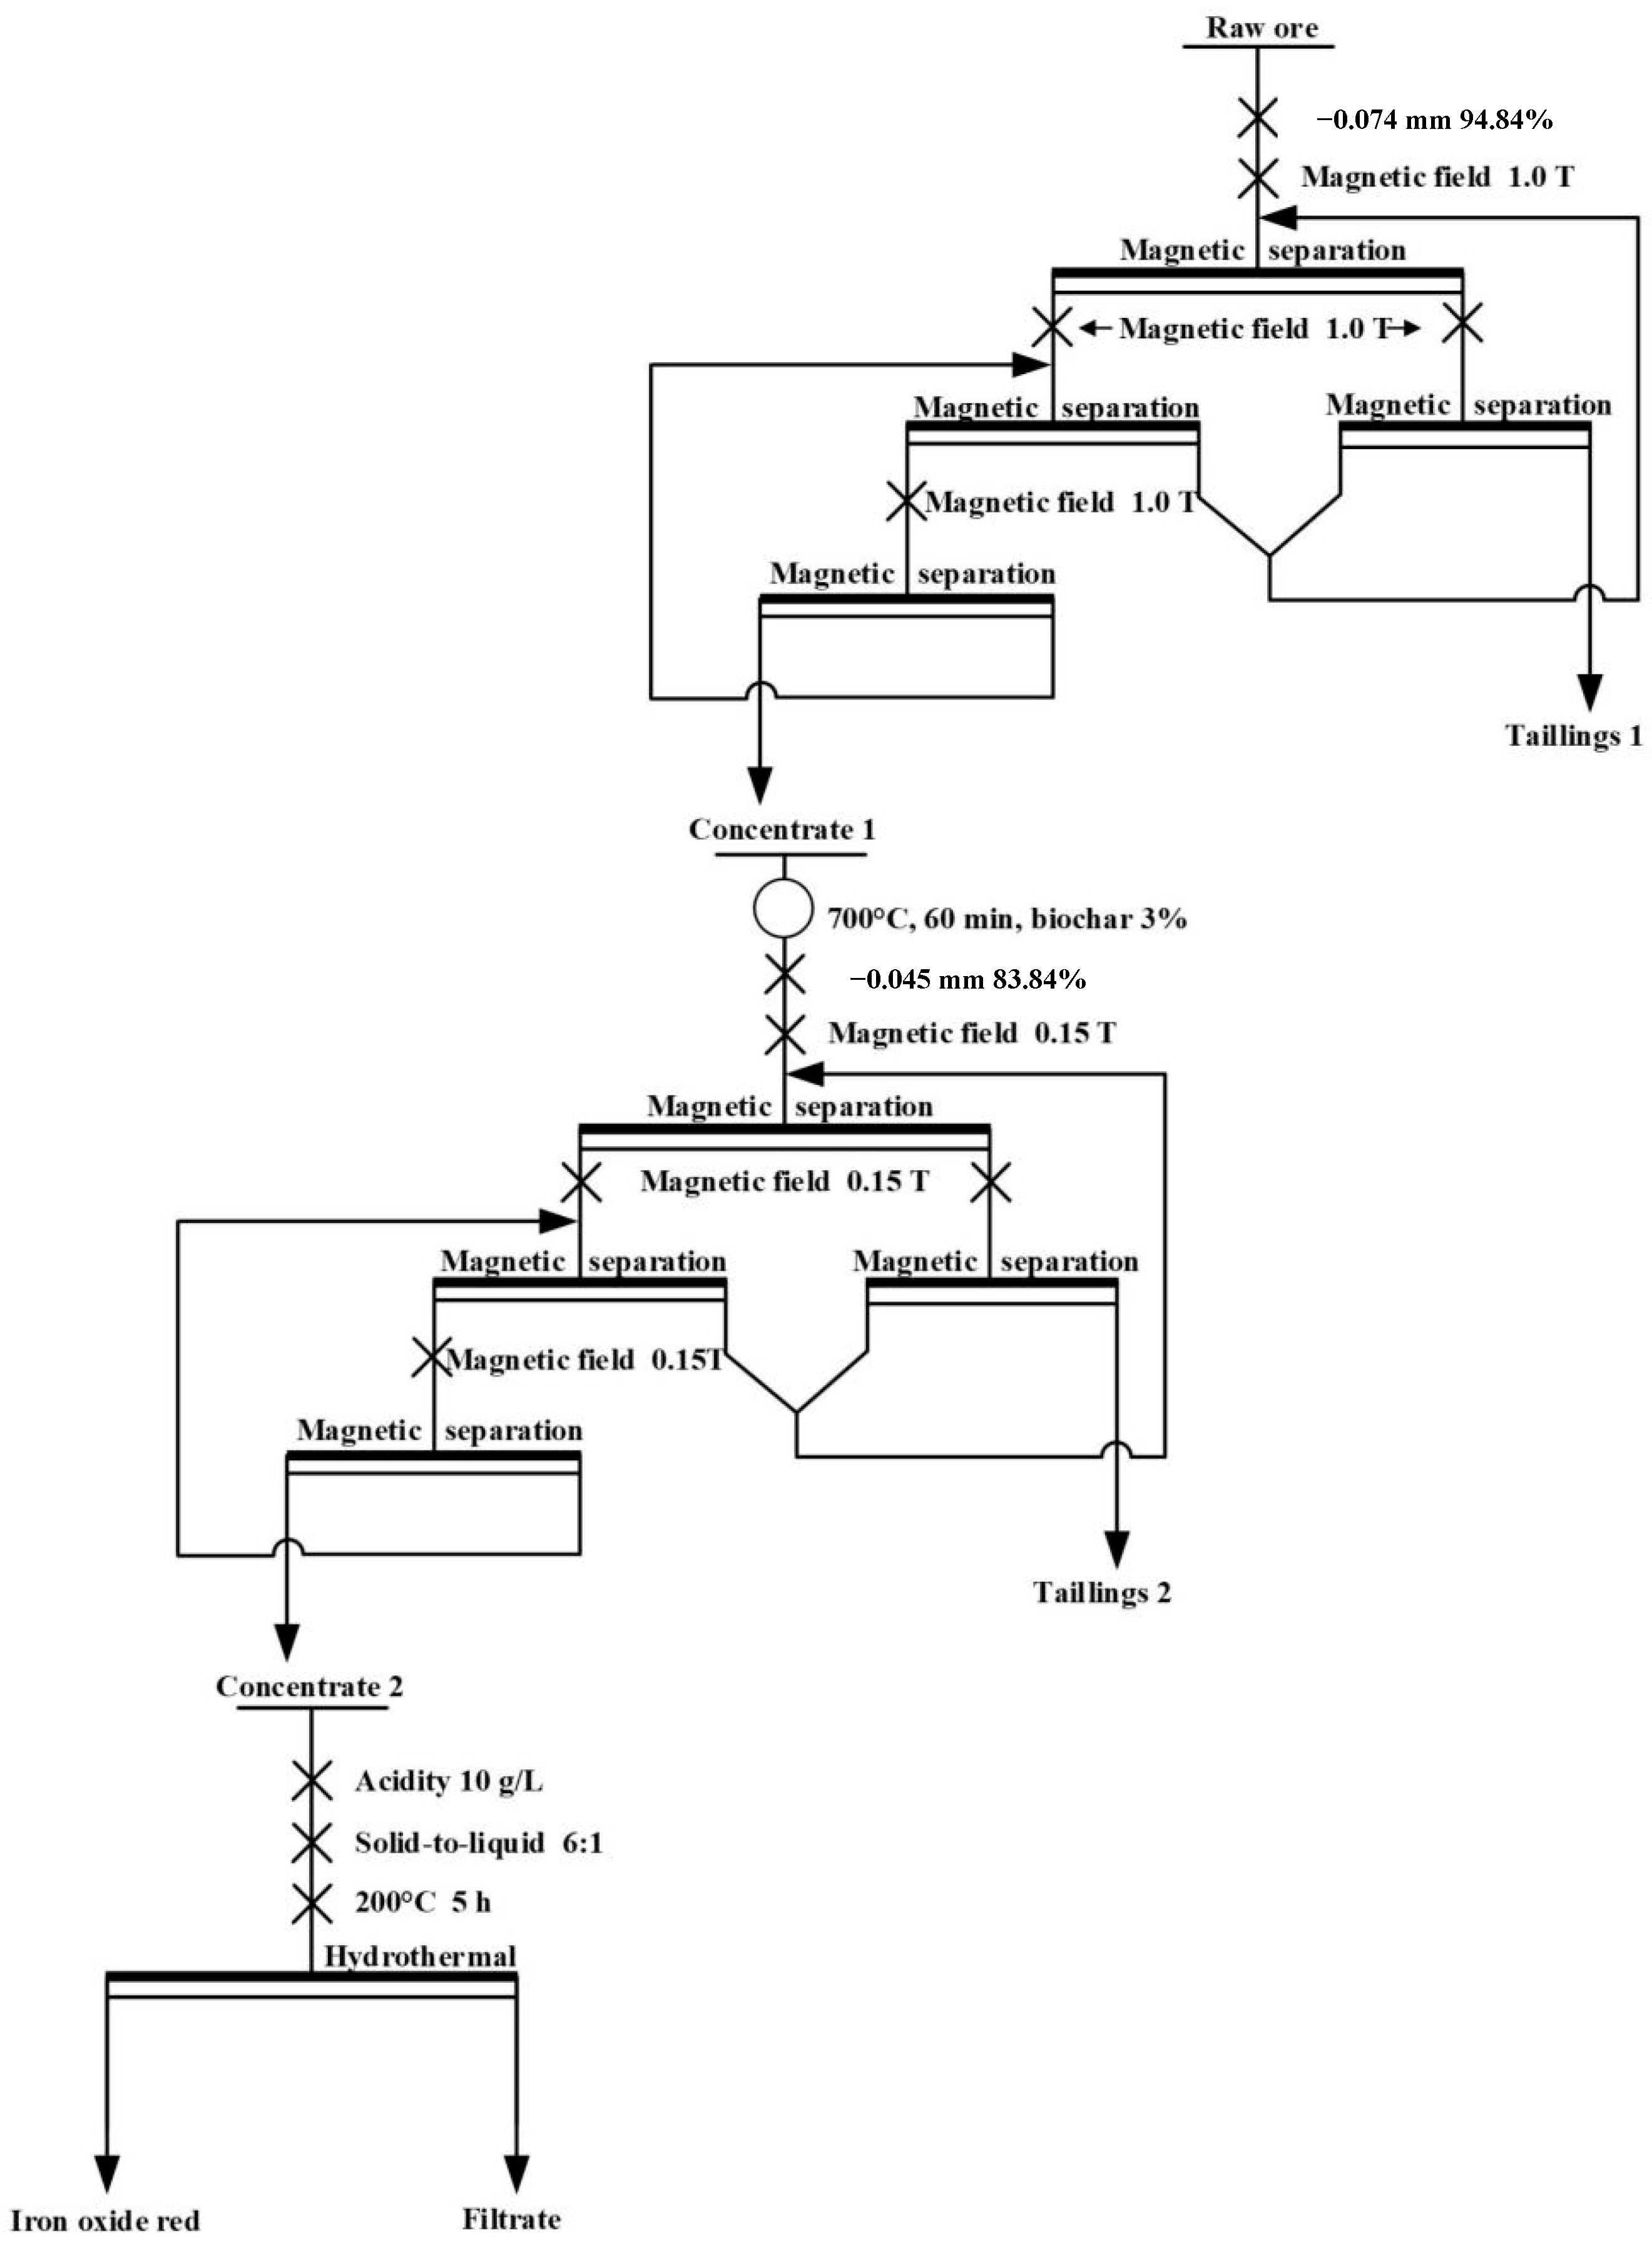
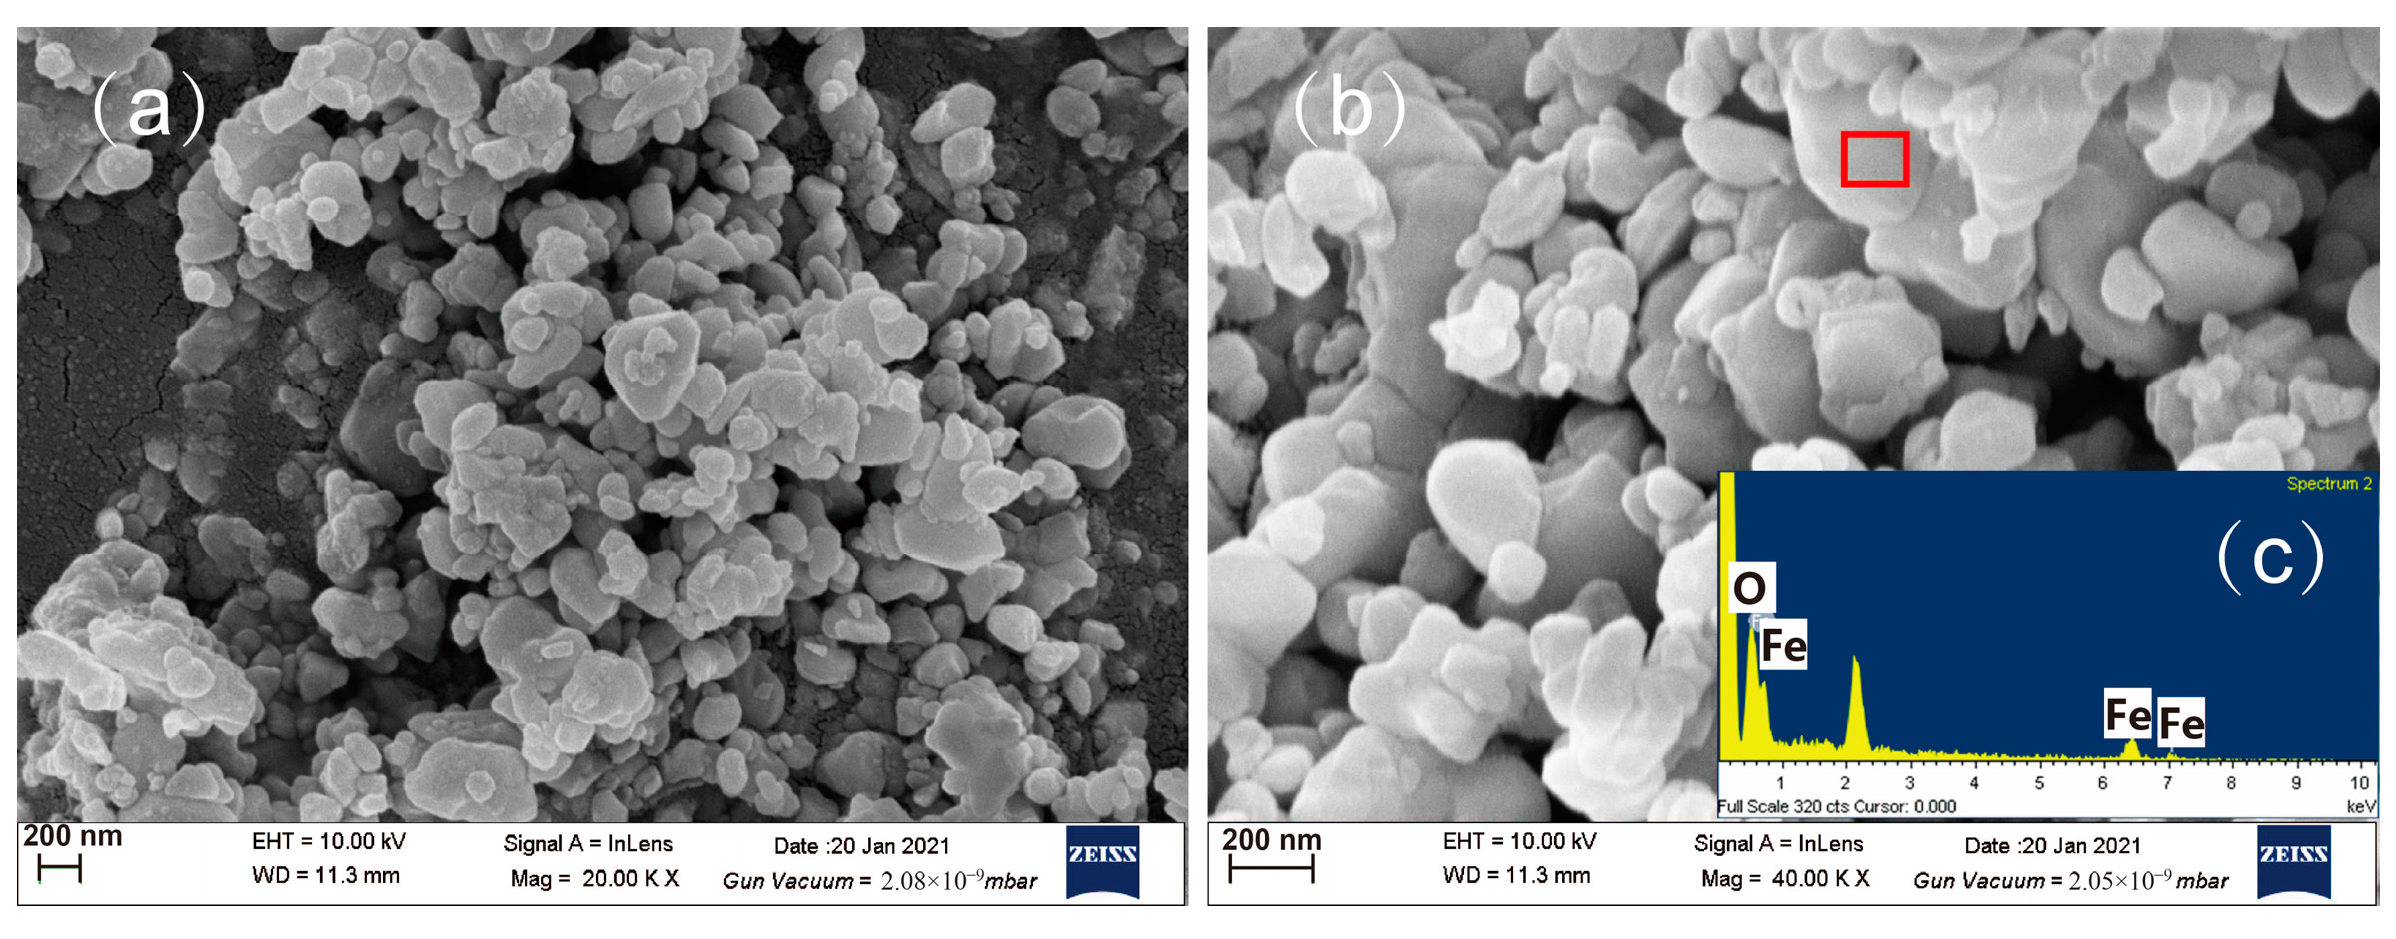
Based on the above results, the schematic flow of red iron preparation from ultra-low-grade limonite is presented in Figure 10. According to the process flow, the optimal parameters for the preparation of red iron from rough iron concentrate are described as follows: the solution acidity was 10.0 g·L−1, the reaction temperature was 200 °C, the reaction time was 5 h, the solid-to-liquid ratio was 6:1, and the stirring speed was 500 rpm. Then, the phase analysis, morphology analysis, and quality inspection of this red iron product was carried out. The XRD pattern (Figure 11) shows that the primary mineral in the red iron product was iron oxide (Fe2O3, pdf: 33-0664), without other obvious impurities. According to the microscopic morphology analysis (Figure 12), the red iron mainly comprised irregular particles with a relatively uniform particle size distribution and an average size of approximately 15–35 μm. The EDS analysis results reveal that the red iron product was primarily composed of Fe and O. Six indicators were selected to detect the quality of the red iron, including color, iron oxide content, water-soluble substance content, water-soluble chloride, and sulfate content of red iron oxide products. This red iron product was red with up to 97.24% the iron oxide content; the mass fraction of chloride, sulfate, and water-soluble matter in this red iron product was 1.8 × 10⁻⁴, 1.32%, and 0.23%, respectively; the sieve residue (<45 μm) of this iron red product accounted for 0.051%; and the volatile matter at 105 °C accounted for only 0.83%. Hence, the quality of this red iron product was high.

4. Conclusions

The ultra-low-grade limonite was composed of complex minerals and elemental compositions, and the grade of the iron was only 9.63%. The iron components in the raw ore were recovered via the combined processes of high-intensity magnetic separation –magnetization roasting–weak magnetic separation; the grade of the rough iron concentrate was 59.57% and the recovery of iron was 90.72%. Then, the red iron product was prepared via a high-temperature hydrothermal method using rough iron concentrate as the raw material, and the quality of the red iron was good. The conversion of limonite into red iron pigment provides a comprehensive utilization idea for ultra-low-grade iron ore.

Author Contributions

Conceptualization, S.Z. and P.J.; methodology, S.Z. and P.J.; software, G.X. and F.L.; validation, G.X., F.L., S.Z. and P.J.; formal analysis, S.Z.; investigation, G.X. and F.L.; resources, S.Z. and P.J.; data curation, S.Z. and P.J.; writing—original draft preparation, G.X. and S.Z.; writing—review and editing, P.J.; visualization, G.X. and S.Z.; supervision, S.Z. and P.J.; project administration, S.Z. and P.J.; funding acquisition, S.Z. All authors have read and agreed to the published version of the manuscript.

Funding

This research was funded by [Shandong Provincial Natural Science Foundation] grant number [ZR2021QB216], [Doctoral Foundation of Southwest University of Science and Technology] grant number [21zx7131]. The APC was funded by [Shandong Provincial Natural Science Foundation].

Institutional Review Board Statement

Not applicable.

Informed Consent Statement

Not applicable.

Data Availability Statement

The data presented in this study are available on request from the corresponding authors.

Acknowledgments

The authors appreciate the financial support, and thank the editor and reviewers for their beneficial suggestions and comments.

Conflicts of Interest

The authors declare no conflict of interest.

References

  1. Tang, M. Composition of the Earth’s Crust. Encyclopedia of Geology, 2nd ed.; Elsevier Ltd.: Amsterdam, The Netherlands, 2021; pp. 178–186. [Google Scholar]
  2. Ma, K.; Deng, J.; Wang, G.; Zhou, Q.; Xu, J. Utilization and impacts of hydrogen in the ironmaking processes: A review from lab-scale basics to industrial practices. Int. J. Hydrog. Energy 2021, 46, 26646–26664. [Google Scholar] [CrossRef]
  3. Song, Y.; Wang, N.; Yu, A. Temporal and spatial evolution of global iron ore supply-demand and trade structure. Resour. Policy 2019, 64, 101506. [Google Scholar] [CrossRef]
  4. Ma, W.; Zhu, X.; Wang, M. Forecasting iron ore import and consumption of China using grey model optimized by particle swarm optimization algorithm. Resour. Policy 2013, 38, 613–620. [Google Scholar] [CrossRef]
  5. Sun, Y.; Zhu, X.; Han, Y.; Li, Y.; Gao, P. Iron recovery from refractory limonite ore using suspension magnetization roasting: A pilot-scale study. J. Clean. Prod. 2020, 261, 121221. [Google Scholar] [CrossRef]
  6. Liu, C.; Deng, J.; Ni, C.; Wang, D.; Xue, K.; Xu, L.; Zhang, X. Reverse froth flotation separation of limonite and quartz with cationic gemini surfactant. Miner. Eng. 2022, 177, 107391. [Google Scholar] [CrossRef]
  7. O’Connor, F.; Cheung, W.H.; Valix, M. Reduction roasting of limonite ores: Effect of dehydroxylation. Int. J. Min. Sci. Technol. 2006, 80, 88–99. [Google Scholar] [CrossRef]
  8. Wu, F.; Cao, Z.; Wang, S.; Zhong, H. Novel and green metallurgical technique of comprehensive utilization of refractory limonite ores. J. Clean. Prod. 2018, 171, 831–843. [Google Scholar] [CrossRef]
  9. Zhang, K.; Ge, Y.; Guo, W.; Li, N.; Wang, Z.; Luo, H.; Hu, Q.; Li, B.; Wu, W.; Shang, S. Phase transition and magnetic properties of low-grade limonite during reductive roasting. Vacuum 2019, 167, 163–174. [Google Scholar] [CrossRef]
  10. Song, S.; Lu, S.; Lopez-Valdivieso, A. Magnetic separation of hematite and limonite fines as hydrophobic flocs from iron ores. Miner. Eng. 2002, 15, 415–422. [Google Scholar] [CrossRef]
  11. Zhou, X.; Zhu, D.; Pan, J.; Luo, Y.; Liu, X. Upgrading of High-Aluminum Hematite-Limonite Ore by High Temperature Reduction-Wet Magnetic Separation Process. Metals 2016, 6, 57. [Google Scholar] [CrossRef] [Green Version]
  12. Çetintaş, S.; Yildiz, U.; Bingöl, D. A novel reagent-assisted mechanochemical method for nickel recovery from lateritic ore. J. Clean. Prod. 2018, 199, 616–632. [Google Scholar] [CrossRef]
  13. Yuan, S.; Zhou, W.; Han, Y.; Li, Y. Individual enrichment of manganese and iron from complex refractory ferromanganese ore by suspension magnetization roasting and magnetic separation. Powder Technol. 2020, 373, 689–701. [Google Scholar] [CrossRef]
  14. Cao, Y.; Sun, Y.; Gao, P.; Han, Y.; Li, Y. Mechanism for suspension magnetization roasting of iron ore using straw-type biomass reductant. Int. J. Min. Sci. Technol. 2021, 31, 1075–1083. [Google Scholar] [CrossRef]
  15. Li, Y.; Sun, T.; Zou, A.; Xu, C. Effect of coal levels during direct reduction roasting of high phosphorus oolitic hematite ore in a tunnel kiln. Int. J. Min. Sci. Technol. 2012, 22, 323–328. [Google Scholar] [CrossRef]
  16. Zhang, S.; Zhang, H.; Liu, F.; Yang, F.; Zhou, S.; Zheng, K.; Chu, C.; Liu, L.; Ju, M. Effective removal of Cr(vi) from aqueous solution by biochar supported manganese sulfide. RSC Adv. 2019, 9, 31333–31342. [Google Scholar] [CrossRef] [PubMed] [Green Version]
  17. Chen, Z.; Wang, X.; Ge, Q.; Guo, G. Iron oxide red wastewater treatment and recycling of iron-containing sludge. J. Clean. Prod. 2015, 87, 558–566. [Google Scholar] [CrossRef]
  18. Mi, R.; Pan, G.; Li, Y. Distinguishing between new and old mortars in recycled aggregate concrete under carbonation using iron oxide red. Constr. Build. Mater. 2019, 222, 601–609. [Google Scholar] [CrossRef]
  19. Yang, X.; Zhang, S.; Liu, L.; Ju, M. Study on the long-term effects of DOM on the adsorption of BPS by biochar. Chemosphere 2020, 242, 125165. [Google Scholar] [CrossRef] [PubMed]
  20. Chen, J.; Yu, X.; Li, C.; Tang, X.; Sun, Y. Removal of tetracycline via the synergistic effect of biochar adsorption and enhanced activation of persulfate. Chem. Eng. J. 2020, 382, 122916. [Google Scholar] [CrossRef]
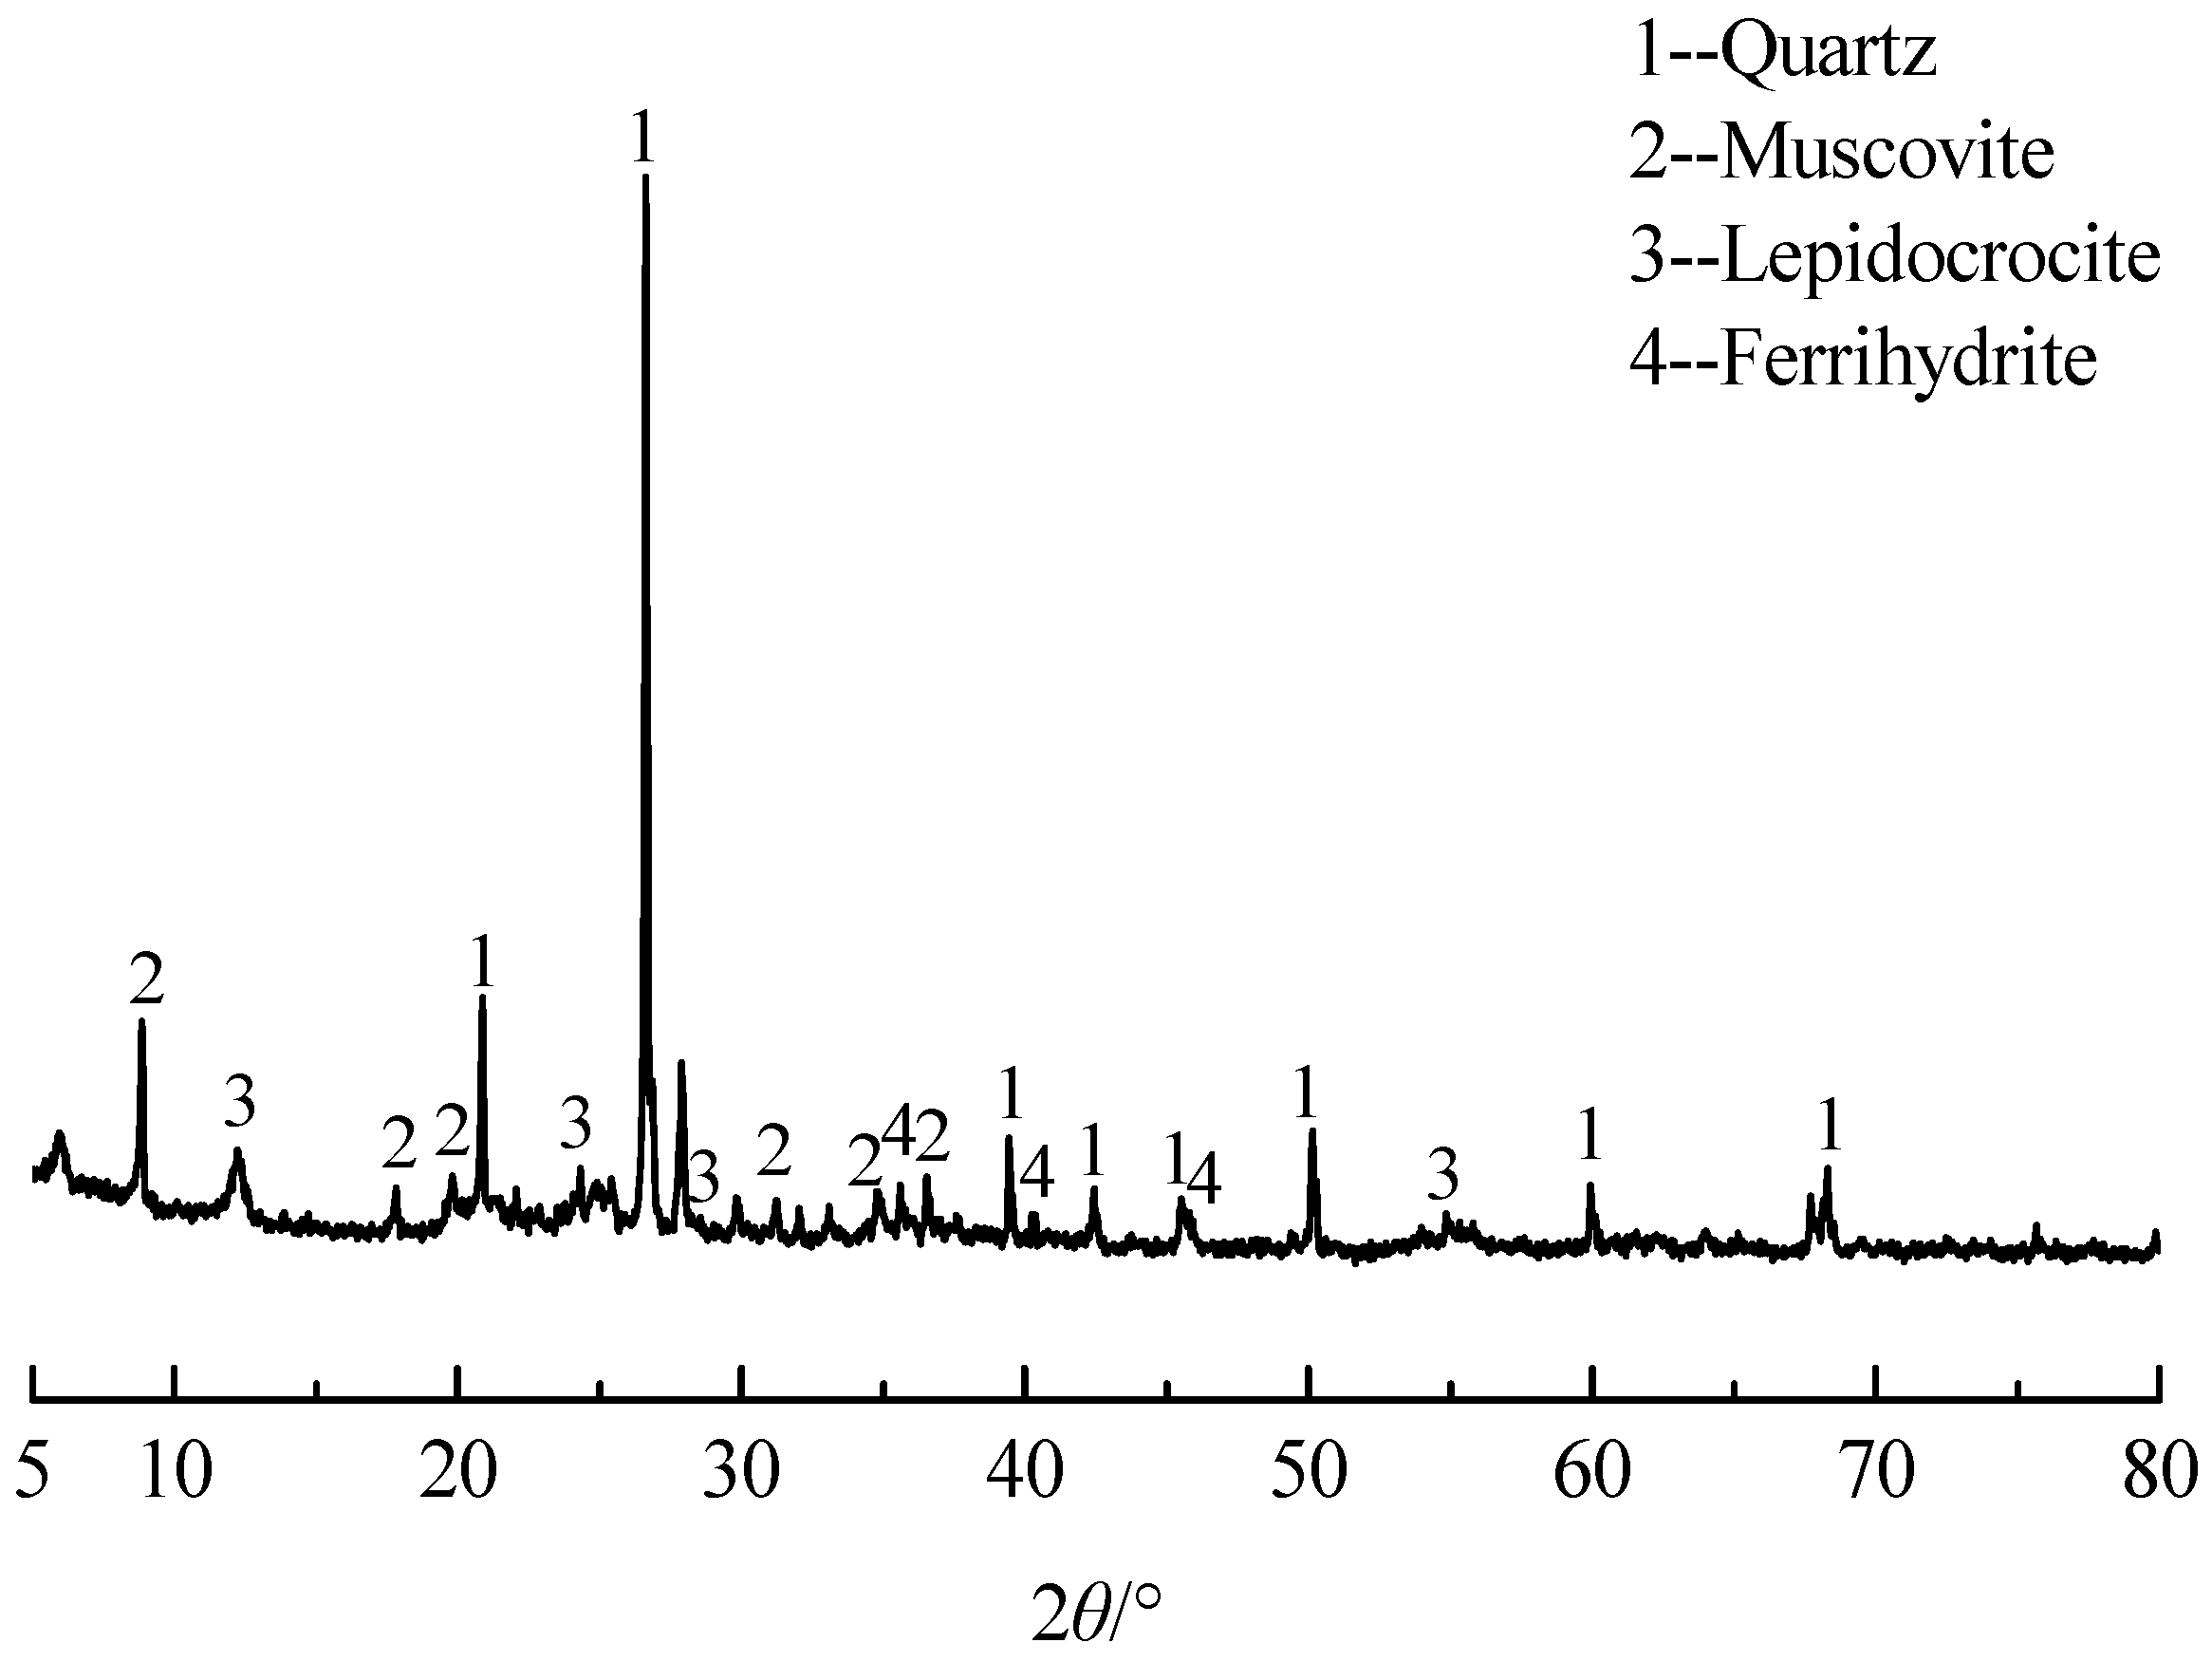
Figure 1. X-ray diffraction (XRD) pattern of limonite.
Sustainability 15 04708 g001
Figure 2. XRD spectrum of biochar sample.
Sustainability 15 04708 g002
Figure 3. Flow chart (a) and results (b) of grinding fineness.
Sustainability 15 04708 g003
Figure 4. Effect of particle size on magnetic separation.
Sustainability 15 04708 g004
Figure 5. Flow chart (a) and results (b) of high-intensity magnetic separation.
Sustainability 15 04708 g005
Figure 6. Grinding fineness flow chart (a) and results (b) of the magnetizing roasted sample.
Sustainability 15 04708 g006
Figure 7. Effect of the magnetic field intensity on magnetic separation ((a) flow chat, (b) results).
Sustainability 15 04708 g007
Figure 8. Effect of reaction parameters on the grade and recovery of iron in red iron ((a) solution acidity, experiment parameter: 10.0 g of iron concentrate was weighed each time, and the temperature was set to 220 °C, the reaction time to 3 h, the solid-to-liquid ratio to 1:6, and the stirring speed to 500 r/min; (b) reaction temperature, experiment parameter: 10.0 g of iron concentrate was weighed each time, and the solution acidity was set to 10.0 g·L−1, the reaction time to 3 h, the solid-to-liquid ratio to 1:6, and the stirring speed to 500 r/min; (c) reaction time, experiment parameter: 10 g of iron ore was weighed each time, and the solution acidity was set to 10 g·L−1, the solid-to-liquid ratio to 6:1, the reaction temperature to 200 °C, and the stirring speed to 500 r/min; (d) solid-to-liquid ratio, experiment parameter: 10 g of iron concentrate was weighed each time, and the solution acidity was set to 10.0 g·L−1, the reaction temperature to 200 °C, the reaction time to 5 h, and the stirring speed to 500 r/min).
Sustainability 15 04708 g008
Figure 9. Stability region of impurities in iron concentrate.
Sustainability 15 04708 g009
Figure 10. Flow chart of red iron preparation by ultra-low-grade limonite.
Sustainability 15 04708 g010
Figure 11. X-ray diffraction pattern of red iron.
Sustainability 15 04708 g011
Figure 12. Morphological analysis of red iron ((a) 20,000×; (b) 50,000×, red box: EDS region; (c) EDS).
Sustainability 15 04708 g012
Table 1. XRF result of limonite.
ElementsSiO2Al2O3Fe2O3K2OMgOTiO2
Content53.5424.489.483.011.771.43
Table 2. Basic physicochemical properties of biochar sample.
SampleElements (%)Ash (%)H/CO/C(O + N)/C
NCHO
B6000.8677.193.147.8111.000.490.080.09
SampleYield (%)pHSSA/(m2·g−1)PV/(cm3·g−1)CEC/(cmol·kg−1)
B60032.4110.61136.130.172110.62
Table 3. Effect of the factors at different levels on the magnetization roasting–weak magnetic separation method.
LevelRoasting Temperature/°CRoasting Time/MinAddition Amount of Reducing Agent/wt%
1600303
2700405
3800508
49006010
Table 4. The results of orthogonal test on the magnetization roasting–weak magnetic separation method.
Test No.Level of FactorsFe
Recovery/%
Fe
Grade/%
Efficiency/%
Roasting Temperature/°CRoasting Time/MinAddition amount of Reducing Agent/%
160030359.9958.1631.86
260040552.5058.2226.76
360050872.6956.0638.61
4600601077.4055.5841.70
570030572.0856.3438.55
670040376.9351.3134.53
7700501059.7358.1831.71
870060878.4351.8736.53
980030886.9041.0323.75
10800401077.9949.4132.25
1180050371.3756.7438.57
1280060585.0846.0731.55
13900301055.9060.3831.47
1490040853.7265.8935.83
1590050554.6960.8131.06
1690060355.6865.5137.06
Table 5. The results of range analysis on the magnetization roasting–weak magnetic separation method.
FactorAverage Beneficiation Efficiency at Each LevelRangeComparatively Excellent Level
Level 1Level 2Level 3Level 4
Temperature34.7135.3331.5333.863.802
Time31.4132.3234.9936.715.304
Biochar35.5131.9633.6834.283.551
Table 6. Optimization verification test results.
Product NameYield/%Fe Grade/%Fe Recovery Rate/%
Rough concentrate40.6355.8789.19
Tailings59.374.3610.81
Ore feeding100.0025.45100.00
Disclaimer/Publisher’s Note: The statements, opinions and data contained in all publications are solely those of the individual author(s) and contributor(s) and not of MDPI and/or the editor(s). MDPI and/or the editor(s) disclaim responsibility for any injury to people or property resulting from any ideas, methods, instructions or products referred to in the content.