1. Introduction
The use of fresh groundwater in regions with rapid population growth commonly produces conflicts between public water supply, and agricultural and environmental stakeholders [
1]. In addition, freshwater pumping from coastal aquifers can induce saltwater intrusion and impact wetland areas, causing an unsustainable consumption of water resources. Therefore, the desalination of saline water from deep aquifers with treatment by reverse osmosis (RO) is an increasingly used water-supply solution in Florida and many other states within the United States, where there are abundant supplies of brackish groundwater [
2]. The U. S. Geological Survey defines brackish water to have a total dissolved solids (TDS) concentration ranging from 1000 to 10,000 mg/L [
2].
A key issue in the use of brackish water for desalination with the RO process is sustaining the raw water supply source that is coupled with the treatment process. As aquifers containing brackish water are pumped, the water quality is rarely constant and there is a common trend to observe increases in the salinity of the groundwater over time. The issue of sustainability in the use of brackish water aquifers with changing salinity has been evaluated by Missimer et al. [
3]. They concluded that, despite the trends of increasing salinity, the water supply source is not being depleted, but instead, the cost of treatment increases in time based on the requirement to change the primary treatment process which increases the operating pressure that causes greater energy consumption. They point out that the only other alternate water supply source at the sites desalting brackish water is often tidal seawater, which would require much higher energy consumption and a generally higher cost to the consumer.
Successful design and operation of brackish water reverse osmosis (BWRO) desalination facilities are, collectively, an integrated engineering systems design issue requiring detailed understanding of both the water treatment process and the groundwater hydrology of the source aquifer [
4]. An important challenge is that the TDS of the feedwater pumped from an aquifer system must remain within the treatment capability of the reverse osmosis process design [
4].
BWRO membranes are designed to treat specific ranges in TDS concentrations. Some membranes function most efficiently in the range of 1000 to 3000 mg/L, whereas others produce freshwater from feedwaters with TDS concentrations ranging from 3000 to 6000 mg/L [
5]. Once the feedwater TDS concentration exceeds 10,000 mg/L, the membranes required to treat the water will likely be a seawater membrane, requiring higher feed pressure that results in higher energy use [
6], higher chemical costs [
7,
8,
9], lower conversion rates [
5], and an overall higher treatment cost to produce potable water [
10]. BWRO costs do not significantly increase until the feedwater TDS increases to above 6000 mg/L, based on recent research [
11]. However, if the TDS concentration of the feedwater rises above the maximum concentration that the installed membrane can treat, the facility can fail or require expensive retrofitting [
12].
To avoid facility failure or expensive retrofitting, there are two possible engineering approaches to the problem. The first is to conduct a more detailed aquifer characterization, including solute transport modeling of the source aquifer to predict future changes in the feedwater TDS concentration, and then engineering the process design based on the upper envelope of the model prediction [
4,
13]. The success of this approach is based on the quality of the groundwater model developed to evaluate the site, which, in turn, is based to a high degree on the voracity of the hydrogeologic data collected during aquifer characterization [
4,
13]. The second approach is to use a very conservative process design that specifies a membrane capable of treating a much higher TDS concentration compared to that initially measured in the production wells. This approach does incur some greater costs for pumps (higher pressure and perhaps de-staged) and chemical feed systems that may not be necessary during the early operational stages of the plant. However, this approach may also be risky in that, if the aquifer system produces a rapid change in water quality, a major retrofit could become necessary.
The coordination of the engineering design and the hydrogeological investigations and modeling tends to give a more reliable result, based on several documented case studies [
14,
15,
16,
17]. Groundwater modeling produces two benefits for the system design, including a hydraulic analysis that assesses the water level (pressure) drawdown in the proposed wellfield, which is used for optimizing well spacing and yields, and the solute transport aspect, which predicts the changes in water quality (TDS or dissolved chloride) with time [
4]. The groundwater model developed to evaluate the site-specific conditions needs to match the life expectancy of the BWRO facility, with a common range of 20 to 30 years based on the facility design criteria and the conceptual model of the feedwater source aquifer [
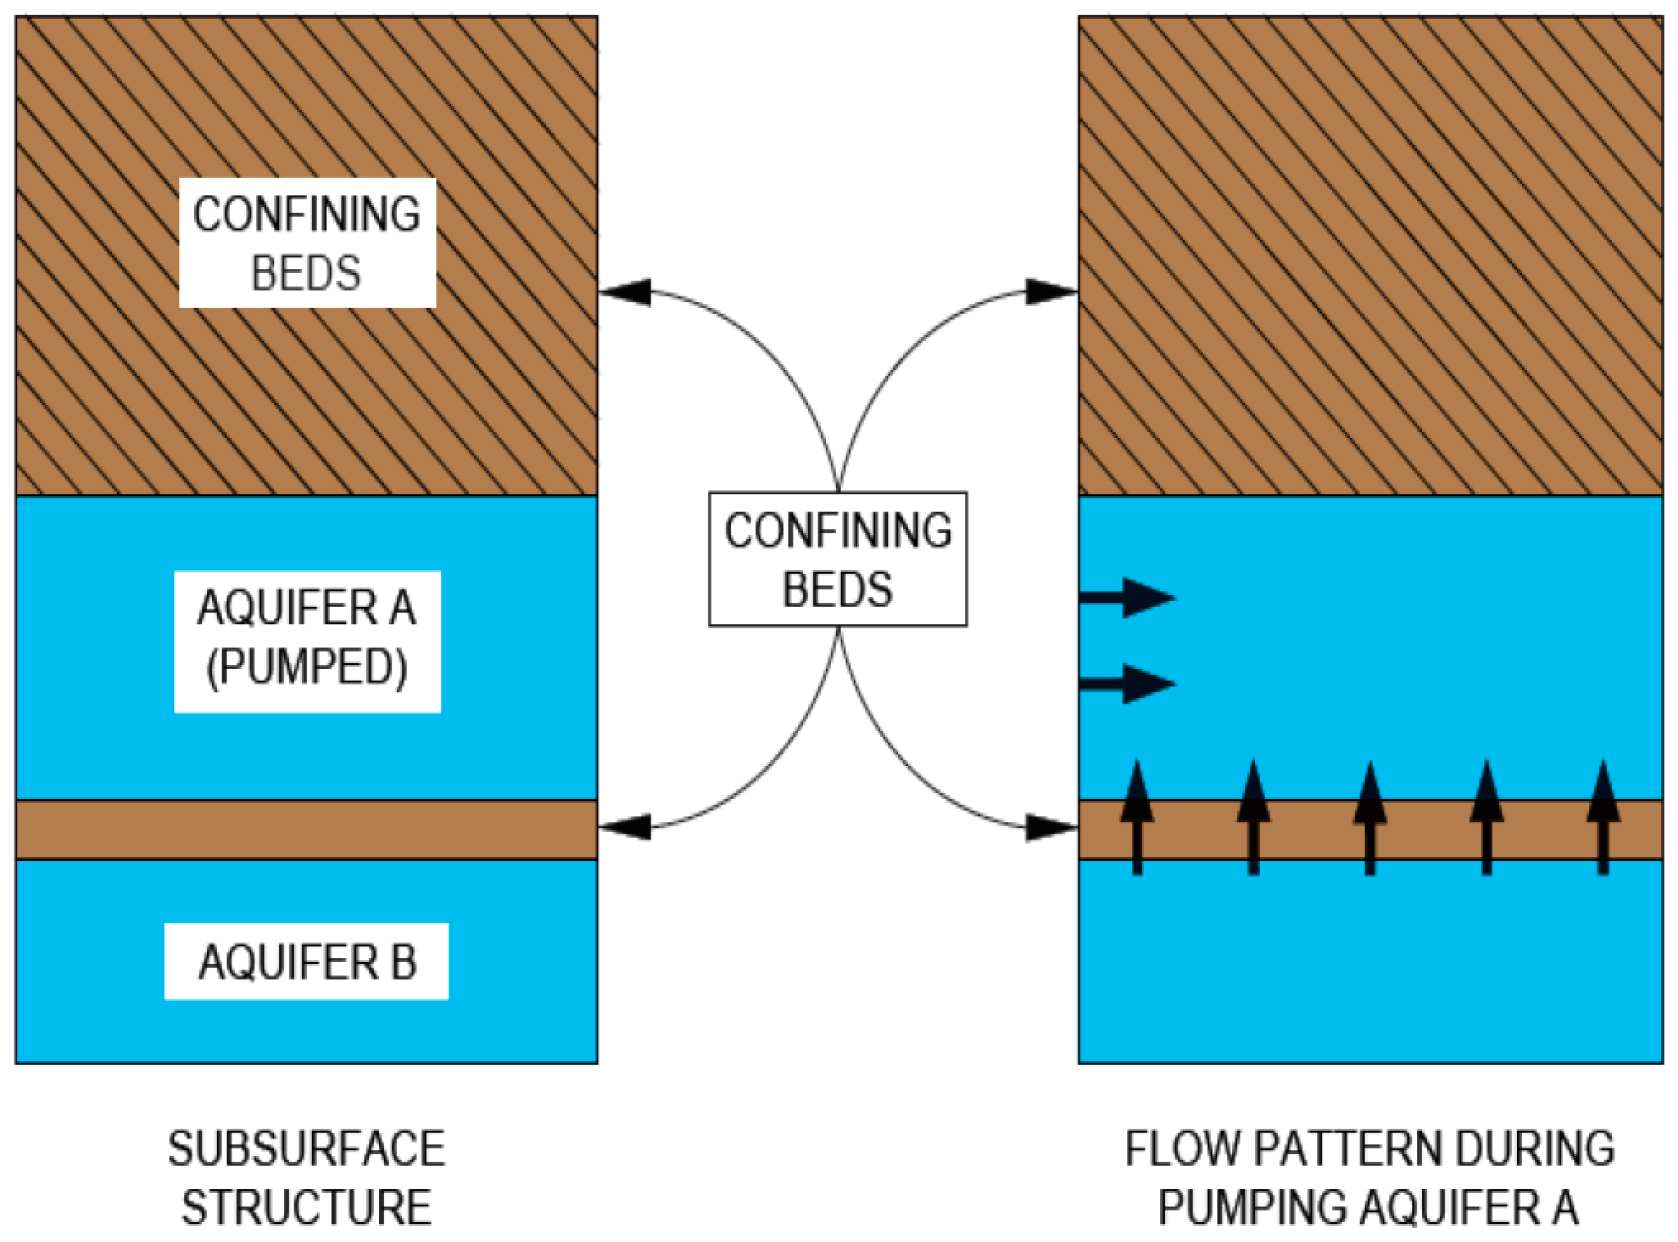
13]. The most common conceptual solute transport model used in southern Florida shows that the changes in water quality are caused by the upward movement of higher salinity water during pumping, which is controlled to a large extent by the pumping-induced drawdown in the source aquifer and the leakance of the lower confining unit [
18] (
Figure 1).
The objective of this research is to document the correlation between the source aquifer solutetransport model prediction and the actual water quality data collected from the operating BWRO facility in the city of Hialeah, Florida (USA). This is an audit of a long-term model prediction and the real operating data, which has rarely been performed and published. It is very important to document case histories, in order to improve approaches to long-term groundwater solutetransport modeling and to assess the sustainability of the BWRO design in relationship to the aquifer behavior during pumping.
2. Background
2.1. Site Location and Background
The city of Hialeah is located in Miami-Dade County, Florida (
Figure 2). For decades, the public water supply for all of Miami-Dade County, Florida was obtained by pumping groundwater from the Biscayne Aquifer, which is one of most productive freshwater aquifers in the world [
19,
20]. However, since this aquifer is heavily developed for water supply and has a very high transmissivity, it is subject to saltwater intrusion, which limits the sustainable yield of the aquifer [
21,
22]. Therefore, alternative water supplies are being developed to mitigate impacts to the unconfined freshwater aquifer system and to produce a more robust, multi-source water supply for Miami-Dade County [
23].
2.2. Hydrogeology of the Upper Part of the Floridan Aquifer System
The source of the brackish water required to supply the BWRO plant is the Upper Floridan aquifer, which is the uppermost aquifer in the Floridan Aquifer System [
19]. The Upper Floridan aquifer is 152 to 183 m (500 to 600 ft) thick along the coast of Miami-Dade County [
24]. The dissolved chloride concentration in the Upper Florida aquifer ranges from about 1500 to 3000 mg/L and trends to higher values in the southern part of the county [
24].
The site-specific geology from land surface to the Middle Confining Unit of the Floridan Aquifer System is shown in
Figure 3. The Upper Floridan aquifer occurs in the carbonate rocks of the lowermost section of the Hawthorn Group (Arcadia Formation), a thin section of the Suwannee Limestone, and the upper part of the Avon Park Formation. It is apparent from the geology that the aquifer is extremely well-confined at the top by 92 m (300 ft) of very low permeability sediments within the Hawthorn Group (
Figure 3). At the base of the aquifer, it is confined by lower permeability rocks within the Avon Park Formation. The degree of confinement above the top of the aquifer is believed to be much higher compared to the lower confinement. During aquifer pumping, the aquifer behaves as a leaky or semiconfined system, with water rising from the bottom upwards through the basal confining unit, as illustrated in
Figure 1.
To determine the aquifer hydraulic coefficients, an aquifer pumping test was conducted for about 4.8 days. Drawdown was measured in the test production well and three monitoring wells constructed at distances of 28, 223, and 386 m (93, 730, and 1265 ft) from the test production well. Based on a variety of analytical techniques, the calculated transmissivity at the site ranged from 522 to 604 m
2/d (5500 to 6500 ft
2/d), the storativity was 5 × 10
−4, and the leakance values were calculated to range from 1.5 × 10
−4 to 4.1 × 10
−4 d
−1 [
19]. The values for leakance are critical in the analysis because the pumping rate, well spacing, and leakance are the principal controls over pumping-induced, long-term changes in water quality [
4,
13].
Since the test production well and the monitoring wells were drilled using the reverse air rotary method, water quality data were collected with depth to assess the variation. As illustrated in
Figure 4, the dissolved chloride concentration was relatively constant, at nearly 1200 mg/L between 335 and 396 m (1100 and 1300 ft) below surface and increasing from 1200 to nearly 2200 mg/L from 396 to 534 m (1300 to 1750 ft) below surface.
2.3. Groundwater Modeling to Assess Future Changes in Feedwater Quality
A solute transport model was developed using the SEAWAT code, which simulated density-dependent fluid movement and solute transport [
25,
26]. The SEAWAT code couples the groundwater flow model code MODFLOW [
27] with the MT3DMS model [
28]. The conceptual model used is similar to that shown in
Figure 1.
Since several large-scale solutetransport models had previously been constructed for this region, these models were utilized to establish the aquifer boundary conditions for the local model used in the city of Hialeah wellfield evaluation. The Phase II Lower East Coast model, developed by Golder Associates [
29] for the South Florida Water Management District, was used to assess the boundary conditions. This is a 14-layer model that was calibrated to regional potentiometric surface maps. The local model was centered in the regional model using the telescopic mesh method [
30,
31]. The local model was calibrated using a transient method tied to the water levels measured during the aquifer test. Additional aquifer performance test data were added to the grid before calibration.
The first step in the groundwater modeling process was to run a groundwater flow model using MODFLOW to assess the drawdowns in the wellfield and optimize the spacing of the production wells. The withdrawals were assumed to be taken from 12 primary wells and 2 backup wells (not shown) (
Figure 5). The prediction simulations were run for 30 years. The wellfield pumping rate was 50,492 m
3/d (13.33 MGD) for the first 6 years, 64,395 m
3/d (10 MGD) for the next 10 years, and 88,371 m
3/d (23.33 MGD) for the last 12 years. The simulated drawdowns for model layer 3 (approximately 3330 to 454 m below surface) are shown in
Figure 6. Note that the maximum drawdown in the production wells in the center of the wellfield is about 24 m (80 ft).
During the development of the local model from the regional model, the hydraulic parameters were translated from the regional model and preserved in the local model. After the local model was created, the aquifer properties, including the top and bottom layer elevations, and the hydraulic parameters, including the hydraulic conductivity and specific storativity, were revised locally based on the field data collected for this study. In the original model, the bottom of the Upper Floridan aquifer is located at approximately −409 m (−1341 ft) NGVD-29, while the field geologic data indicate that the bottom of the Upper Floridan aquifer is located at approximately −448 (−1470 ft) NGVD-29. The model layer thickness was changed to reflect this difference.
The local model was updated with the water quality data collected during the field program. A constant TDS concentration of 3500 mg/L (equivalent to a dissolved chloride concentration of about 1645 mg/L) was applied to the Upper Floridan aquifer in the vicinity of the proposed wellfield, based on the field data. The TDS concentration assigned to the confining unit (MCU or model layer 6) was 4750 mg/L (dissolved chloride of about 2138 mg/L), which was obtained from the regional model and verified by the field data.
A 30-year model simulation was run using dissolved chloride concentration, because chloride is a non-reactive solute and would require no additional corrections for the removal or reaction of various ions in the water moving through the confining units. A detailed sensitivity analysis was performed for the simulation to create an envelope of error for the 30-year operations period. The final model prediction is shown in
Figure 7. It is observed that the error in prediction increases over time, with the upper side of the envelope deviating further away from the base run compared to the lower range value. The base run lies closer to the low range than the high range. The high range is always recommended for use in the process design, with a caveat that unexpected issues can occur when models are conducted for this long period. Any solute transport model prediction using the conceptual model as shown in
Figure 1 assumes that the changes in water quality originate from more saline water leaking upward into the production zone from below. Any variations in water quality within the production aquifer caused by anthropogenic sources of higher salinity water, such as unplugged test wells or old, unplugged oil test wells, cannot be predicted. Other natural issues such as unmapped faults or open karst features also cannot be predicted, but have a low likelihood of occurring. In addition, no consideration is given to the horizontal intrusion of higher salinity water, based on regional data that shows that the anticipated capture zone of the production wells is not far enough seaward to induce high salinity water movement.
2.4. Design of the Brackish Water Treatment Facility and Water Quality Treatment Limitations
The full design capacity of the BWRO water treatment plant is 64,394 m
3/d (17 MGD), with the first phase being 37,879 m
3/d (10 MGD) [
19]. The design conversion rate for the facility is 75% for the first phase. Therefore, the first phase (6 years) will require 50,492 m
3/d (13.33 MGD) of feedwater. At full capacity, in 10 years, the conversion rate is expected to decline to about 73% based on the increase in TDS concentration. Therefore, the required feedwater volume will be 88,371 m
3/d (23.33 MGD).
The process design for the maximum TDS that can be treated by the membranes was set at 10,000 mg/L, or a dissolved chloride concentration of about 4700 mg/L. The upper end prediction of the solute transport modeling indicates a maximum dissolved chloride concentration of about 6400 mg/L. If the feedwater TDS would rise above this number, the plant would require a major retrofit that would likely include new membranes, pumps with a higher pressure rating, and a reduced conversion rate. A reduced conversion rate would likely necessitate the addition of more production wells. Additional production wells might also be needed to reduce the average salinity of the feedwater. The reason to perform pre-design solute transport modeling is to avoid this issue during the operational lifetime of the facility. Should any retrofitting be required, it would likely occur during a membrane replacement cycle, which is commonly 5 to 7 years.
5. Discussion
5.1. Projected Changes in Water Quality Based on the Regression Equations Developed from the Monitoring Data
The actual data collected from the wellfield are summarized in
Table 2 and
Table 3. The changes in the dissolved chloride concentration measured varied significantly between the production wells. The pumping rate in the first year of operation averaged close to 22,000 m
3/d, and in the 9th year averaged about 33,000 m
3/d. The average annual change in the dissolved chloride was 116.67 mg/L for the nine years of operation. The linear regression equations, as approximations, were used to make projections for 5, 10, 20, and 40 years beyond the operational period, as shown in
Table 2. It should be noted that these projections are based on current pumping rates, which are only 37% of the ultimate wellfield capacity. Based on the water supply plan, the projected chloride concentration at higher future pumping rates could increase these values between two and three times.
The R
2 values shown in
Figure 8 show a wide variation, with three values well-correlated, ranging from 0.7922 to 0.8687, with one value with a medium correlated at 0.5299, and two values with rather low correlations at 0.3235 and 0.1675. The variation of these values is likely caused by the method of wellfield operation, as some wells were pumped for longer times than other wells. Additionally, there is some analytical error in the analysis of the chloride concentration in the laboratory. Despite some low R
2 values, all of the regression analyses have very small
p-values; therefore, all are statistically significant.
The varibility in the dissolved chloride values across the wellfield is likely caused by variations in the leakance of the lower confining unit. This issue in further explored in
Section 5.3.
5.2. Comparison of the Groundwater Solute-Transport Model Results versus the Actual Measured Changes in Water Quality
A comparison of the actual wellfield data to the past solute transport model projections is shown in
Table 3. The measured changes in the dissolved chloride concentrations in the 9th year of operations, at 37% of the full capacity of the wellfield, were already about 27% above the high range for the full wellfield capacity in the 10th year of operation. The solute transport model significantly under-predicted the changes in salinity at the wellfield site. While a long-term aquifer performance test was conducted on the site to obtain accurate values of transmissivity and leakance, there appears to be some feature onsite that has enhanced the upward movement of higher salinity water at a rate above that controlled by the measured leakance (see
Section 5.3 for an explanation). No evidence was found that the increase in salinity was impacted by the horizontal movement of higher salinity water within the Upper Floridan aquifer.
5.3. Conceptual Model of the Water Quality Changes
The conceptual model used in creating the solute transport model at the city of Hialeah wellfield has been used successfully in numerous other long-term projections of water quality changes for BWRO system design in Florida [
4,
12,
14,
15,
16,
17]. However, one system, the Collier County South wellfield, showed an over-prediction of salinity that required a modification of the standard model to add a downward component of freshwater [
32]. The city of Clearwater facility has had extreme increases in the salinity of the feedwater, despite the creation of a pre-design solute transport model [
12]. In this case, the area was riddled with open karst features (sinkholes) that made the development of an accurate solutetransport model virtually impossible [
12]. Very high rates of feedwater salinity increases have been reported for other BWRO wellfields in Florida, including the North Collier County site [
4], North Lee County, the city of Hollywood, and the Lake Region facility in western Palm Beach County.
Based on the comparison of the city of Hialeah monitoring data to the original solute-transport model predictions, the original conceptual model does not accurately predict the observed changes, as shown in
Table 3 Therefore, the aquifer system at the site must have a different conceptual model compared to the original model presented in
Figure 1.
There are two possible explanations for this aquifer behavior. First, the dolostones constituting the lower confinement between the Upper Floridan aquifer and the underlying aquifer may be fractured, thereby enhancing the leakance value in parts of the wellfield above those measured onsite. Second, there may be karst features that allow the upward movement of higher salinity water within the aquifer system.
The fracturing of the dolostones is the favored explanation for the enhanced upward movement of higher salinity water under pumping conditions. Missimer and Maliva [
33] described a tectonic event in the Middle to Late Miocene that placed southern Florida under compressive stress and caused some thin-skinned folding and fracturing of highly competent carbonate rocks, such as the dolostone units that provide confinement beneath the between aquifers within the Floridan Aquifer System. The fractures within the dolostones are likely to be partially annealed, and under a non-pumping condition allow only the minor upward movement of higher salinity water. Under an enhanced hydraulic gradient from pumping, greater upward movement of more saline water would occur, which could explain the 37% variation of the dissolved chloride concentration within the wellfield.
It is quite unlikely that open karst conduits could explain the enhanced upward leakance. It is more likely that karst conduits within the Eocene to Early Miocene carbonate units, if present, are filled with mud that occurs within the upper confining unit. Therefore, the karst features would have a lower hydraulic conductivity compared to the carbonate rocks forming the aquifer system, and would not influence the upward movement of higher salinity water.
A proposed conceptual model for the Upper Floridan aquifer in the wellfield is shown in
Figure 9. The key deviation from the original conceptual model is the enhanced leakance that allows for greater quantities of higher salinity water to enter certain wells within the wellfield (e.g., those showing the highest rates of the dissolved chloride concentration increase). The data from the wellfield suggest that the pattern of fracturing is non-uniform, and may or may not occur near and impact various wells within the wellfield. The slow, low-rate upward migration of more saline water is occurring throughout most of the wellfield areas (as indicated by the initial modeling results), but more rapid migration is occurring near fracture zones (
Figure 9).
5.4. Assessment of the Impacts of Water Quality Changes on the Future of the Plant Operation
The BWRO process design was made to have a maximum TDS of the feedwater at 10,000 mg/L for a maximum pumping rate of 88,371 m
3/d (23.33 MGD). The design of the process included an estimated recovery of 73%. The life expectancy of the plant was designed to be 30 years. During the solute transport modeling, the relationship between the TDS and dissolved chloride was to be that dissolved chloride was 47% of the TDS. A detailed study of the TDS/chloride relationship in Cape Coral Florida determined that the equation TDS (mg/L) = 1.5934 × (Cl (mg/L) + 479 was a more accurate means of estimating TDS from chloride concentration [
14]. This equation implies that a dissolved chloride concentration of 5975 mg/L would produce a TDS concentration of 10,000 mg/L. Therefore, the design capacity of the BWRO plant would be exceeded when the dissolved chloride occurred between 4700 and 5975 mg/L, depending on which ratio is correct at this site.
The measured data and the linear regression of the current pumping rate of 33,362 m3/d (8.8 MGD) show that the BWRO process would be sufficient to allow the operation of the facility to the 30-year operational life expectancy, or 21 years from August 2022. However, if the plant was operated at its full capacity of 88,371 m3/d (23.33 MGD), the rate of the dissolved chloride increase could rise to 2.6 times faster than at the current rate.
If the plant output were to be increased slowly to the maximum capacity over 5 years, the BWRO plant would likely have to be retrofitted with a new process (seawater RO membranes) by the end of that period, as the 10,000 mg/L design concentration would be exceeded. This would require high-pressure pumps to be installed, with the ability to increase pressure to 69 bar (1000 psi). In the early years, after the 10,000 mg/L TDS is exceeded, the pumps could be de-staged to run at lower, more economic pressures. The overall plant conversion rate would reduce from a 73% rate in the next several years to 50%, as the TDS approaches 35,000 mg/L in future years. That would require the full 69 bar (1000 psi) pumping pressure to achieve operational efficiency. To produce a product capacity of 75,758 m3/d (20 MGD) based on a feedwater TDS of 35,000 mg/L, the wellfield capacity would have to be increased to 151,515 m3/d (40 MGD). This would require at least 14 new production wells and a near doubling of the desalination plant footprint. In addition, two new injection wells would be required, as the concentration would double.
Salinity in the southwestern corner of the wellfield (wells 2 and 3) has been more stable. The average salinity of the feedwater might be reduced by the construction of additional production wells in that direction.
Based on the discovery of the enhanced rate of leakance, the wellfield should be re-modeled using the actual well data for calibration, and some new timeframes for higher-use rates should be carefully planned. The upper limit of the new envelope of error could be used as a guideline, based on a variety of boundary conditions and pumping rates. The capital improvements required to operate the plant can be staged over many years. Improvement plans should be updated based on the observed water quality trends and overall utility needs.
5.5. The City of Hialeah Desalination Facility within the Context of Sustainability
The discovery of the higher than expected increase in the salinity change does not equate to an unsustainable situation. Within the context of the definition of sustainability, it is defined as the pursuit of maintaining the natural system in a condition that will not impact future generations. The issue of sustainability within the operation of a municipal utility also includes an economic factor.
The feedwater quality at the city of Hialeah wellfield will become more saline over a limited period, ultimately necessitating the need to change the process from brackish water membrane treatment to a seawater membrane treatment. The system will have to operate at an increasingly higher pressure as the TDS concentration increases above 10,000 mg/L. This change in process will progressively require more energy to operate the RO process and will require expensive capital costs to upgrade the overall design of the plant, wellfield, and concentrate disposal. The question arises: “Does this change in conditions caused by the pumping of the aquifer constitute a violation of the fundamental principle of sustainable groundwater use?”
First, the desalination of brackish water from the Upper Floridan aquifer was a replacement for using freshwater from the Biscayne Aquifer to prevent the development of a non-sustainable use, in that saltwater intrusion would have damaged the aquifer and environmental impacts could have impacted wetlands and perhaps other natural system habitats. Despite the rise in the cost of water treatment, the water supply in the source aquifer does become more expensive to treat, but is still a viable water supply source for future generations. So, from an environmental view, the increasing salinity does not directly impact the environment and could be defined as sustainable. The change in water salinity, however, causes an increase in the amount of electrical energy consumed to operate the facility, which can be considered as an indirect impact. If this electricity is provided by nuclear or solar power, then there will be a low impact on emissions of carbon dioxide and thus contributions to global warming [
33]. Therefore, there is a solution to sustainably operating the facility.
The economics of the facility operation merit some analysis. An analysis of an alternative water supply source for the facility would reveal that tidal seawater could be used to supply this or another seawater reverse osmosis (SWRO) desalination plant. While tidal seawater would not likely exhibit any increase in salinity, it does contain a high concentration of organic material that must be removed during the treatment process, before the water enters the primary membrane process [
34]. Although the increase in the TDS concentration of the feedwater will exceed 10,000 mg/L, it is unlikely that the TDS will ever reach a typical seawater concentration of 35,000 mg/L. Even if the feedwater did increase in TDS to 35,000 mg/L, the operation of an SWRO plant using groundwater instead of tidal seawater would cost somewhere between 10 and 25% less, based on the extensive pretreatment processes required to exclude organic material from the primary membrane process and lessen the rate of membrane biofouling [
10,
35]. In addition, there are other environmental impacts of operating an SWRO desalination plant using a tidal seawater source. The primary impact is the entrainment and impingement of marine organisms [
36]. In the case of the city of Hialeah, there would also be the cost of adding a pipeline from the coast and an onshore intake. In both cases, the environmental impacts of the concentration discharge to tidal water could be avoided by using deep well injection for disposal [
37]. Therefore, it can be concluded that, despite the increase in water treatment cost that will occur over the next 10 to 15 years, the continued use of the Upper Floridan aquifer at this location is the least costly water supply alternative and must be considered to be economically sustainable.
5.6. Suggested Future Research to Better Define a New Conceptual Model
Some easy and important tests can be done on the production wells to ascertain the origin of the higher salinity water moving into the wellfield. If the water is leaking from a greater depth below the Upper Floridan aquifer in some wells compared to others, there may be some temperature differences that could help indicate the deeper source. Perhaps the wells with the highest rate of salinity increase would have a higher water temperature than those with the lower rate. It is simple to obtain water samples from the wellheads and make accurate field temperature measurements. In addition, it would be prudent to obtain some new geophysical logs of the wells, including temperature, conductivity, and flowmeter logs.
Consideration should be given to running some borehole-to-borehole seismic logs to investigate if fractures can be detected. Some high-resolution, land-based seismic reflection surveys have been run in Miami-Dade County at other locations. It may be useful to reassess the records from some of these surveys to try to determine if any fractured zones occur in the upper 250 m of the Floridan Aquifer System, which would encompass the Upper Florida aquifer and the confining unit immediately below it.
6. Conclusions
The city of Hialeah, Florida operates a brackish water reverse osmosis (BWRO) desalination plant that currently operates at a capacity of about 33,000 m3/d and has an ultimate capacity of 88,000 m3/d. The BWRO plant can treat feed water up to a TDS concentration of 10,000 mg/L (4700 mg/L of dissolved chloride). The feed water is pumped from the Upper Florida aquifer onsite, currently using six production wells. The wellfield contains 14 permitted wells (10 installed) that will be used in the future. A solutetransport model was conducted on the production aquifer for a prediction of water quality changes over 30 years. The model was based on the onsite collection of high-quality hydrogeological data and used the original conceptual model employed for nearly all BWRO wellfields in Florida. The conceptual model predicts a slow increase in groundwater TDS based on the upwards movement of higher salinity water through the basal confining unit. The predicted change in dissolved chloride over 30 years of operation at the base run ranged from 1650 to 2000 mg/L, and at the high range, from 1650 to 3000 mg/L. Actual measured data show that at a pumping rate of 33,000 m3/d, the dissolved chloride concentration in the 10th year of operation will reach 2750 mg/L or 27.5% higher than the predicted upper range. If the plant was operated at its anticipated maximum design capacity, the feedwater quality would exceed 10,000 mg/L of TDS, which would render the plant process unable to treat the feed water within 5 to 10 years.
Based on the data and analysis, the Upper Floridan aquifer may contain an enhanced leakance value that was not detected during the aquifer performance test. The likely cause of the higher leakance rate within parts of the wellfield is the undetected fracturing of the confining dolostones underlying the Upper Florida aquifer. Therefore, a revised conceptual model must be used to accurately predict the future changes in pumping-induced water quality at this site. While the most commonly used conceptual model has been used to accurately predict the water quality changes at some other BWRO sites in Florida, in this case, the undetected enhanced vertical connection precluded the ability to accurately predict long-term water quality changes. This is a classic example of the difficulty in making long-term water quality predictions (30 years) for a complex aquifer system.
Despite the increased rate of salinity change, the water pumped from the source aquifer will still be able to be treated with freshwater by changing the treatment process from brackish water membranes to seawater membranes. This change will necessitate a major redesign of the facility and will have a higher energy consumption, resulting in a higher water treatment cost. However, a comparison to other water supply alternatives, such as using more freshwater from the Biscayne Aquifer, or developing seawater from a tidal source, the retrofit of the plant is the only truly sustainable water supply alternative. The indirect impact of the increased electric consumption on sustainability would be the use of nuclear or solar power energy sources to mitigate carbon dioxide discharge to the atmosphere.


