Article

Analysis of Changes in Vegetation Carbon Storage and Net Primary Productivity as Influenced by Land-Cover Change in Inner Mongolia, China

1
Inner Mongolia Research Institute, China University of Mining and Technology (Beijing), Ordos 017004, China
2
Urumqi Comprehensive Survey Center on Natural Resources, China Geological Survey, Urumqi 830057, China
*
Author to whom correspondence should be addressed.
Sustainability 2023, 15(6), 4735; https://doi.org/10.3390/su15064735
Submission received: 24 January 2023 / Revised: 9 February 2023 / Accepted: 6 March 2023 / Published: 7 March 2023

Abstract

:
Exploring the influence of vegetation carbon stocks over land-cover change and the relationship between land-cover change and net primary production (NPP) is of great practical importance for achieving China’s carbon neutrality target. Therefore, this paper analyses the spatio-temporal distribution of land-cover change and NPP change in Inner Mongolia from 2000 to 2020 and explores the vegetation carbon stock change caused by land-cover change, the relationship between land cover and NPP, and the relationship between land-cover change and NPP change. The results show that the main land-cover change in Inner Mongolia during 2000–2020 was the conversion from other land-cover types to grassland, with the conversion of bare land to grassland from 2000 to 2010 covering an area of 20,634.87 km2. During the period of 2000–2020, the high values of NPP were mainly located in northeastern Inner Mongolia, and the low values were mainly distributed in southwestern Inner Mongolia. The total carbon storage changes in vegetation affected by land-cover change during 2000–2010 and 2010–2020 were 10,736,986.11 t and 3,894,272.41 t. The mean values of NPP for different land covers were, in descending order, forest > cultivated land > wetland > grassland > artificial surfaces > shrubland > water bodies > bare land. Between 2000 and 2010, the change in land-cover type to water bodies was the main cause of the decrease in NPP, and the increase in NPP was mainly due to the conversion of other land-cover types to cultivated land, forest, and grassland. The implementation of appropriate conservation and management measures (e.g., the construction of forest and grass ecological protection), planting, and the protection of high-vegetation carbon storage plants and other means can improve the level of vegetation carbon sequestration and protect the ecological environment of Inner Mongolia.

1. Introduction

Vegetation net primary production (NPP) is the net amount of carbon sequestered by green plants through photosynthesis [1]. It is an important indicator of terrestrial ecosystem productivity, offsetting anthropogenic carbon emissions and maintaining carbon balance at the land surface [2,3]. Improving vegetation carbon storage is important for achieving the goal of sustainable ecosystem development [4]. Land-cover change is considered one of the main drivers of NPP change [5,6]. An in-depth assessment of the relationship between land-cover change and NPP response and of the impact of land-cover change on vegetation carbon storage is critical for achieving carbon balance in terrestrial systems owing to the vital atmospheric feedback from land systems [7].
Terrestrial ecosystems have a strong carbon sequestration capacity; the amount of carbon sequestered by vegetation varies from region to region [8,9]. Many researchers have conducted studies on this subject. For example, DeFries et al. (1999) estimated the impact of human-induced land-cover change on atmospheric carbon emissions and net primary production using a global terrestrial carbon cycle model, a satellite map of vegetation, and a global map of natural vegetation [10]. Achard et al. (2004) used the results of deforestation surveys in the humid tropics and published deforestation data in the dry tropics, applied to reference data on biomass, to develop new estimates of net carbon emissions [11]. Houghton et al. (2012) summarised 13 estimates of net carbon emissions from land use and land-cover change, including deforestation, agricultural land area change, and forest management [12]. Yang et al. (2014) explored the impact of land use and land-cover change driven by ecological restoration programmes in Xinjiang from 2001 to 2009 [13]. Lai et al. (2016) explored vegetation and soil carbon stock changes in China between 1990 and 2010 due to a combination of land-use category conversion and management [14]. Li et al. (2017) used satellite and inventory-based biomass observations to constrain historical cumulative land use and land-cover change emissions from nine DGVMs to model the new relationship between vegetation biomass and historical cumulative land use and land-cover change emissions [15]. Peng et al. (2017) quantified the global NPP response to drought and land-cover change from 2000 to 2014 [16]. Chuai et al. (2019) studied the relationship between “physical–social” integrated carbon balance and land-cover change in Nanjing City over the period of 2000–2015 [17]. Wu et al. (2019) assessed land-cover change in Kunshan City between 2006 and 2016, predicted future land cover in 2030 under three models, and quantified the spatial and temporal responses of crop production, carbon storage, habitat quality, flood regulation, and nitrogen and phosphorus retention to land-cover change [18]. Yang et al. (2020) used Hubei Province as an example and proposed a hierarchical framework integrating system dynamics, land-use modelling, and carbon stock assessment models to explore carbon storage under different scenarios between 2010–2015 and 2015–2030 [19]. Hao et al. (2021) explored the downward response between NPP and climatic factors from 2002 to 2019 [20]. Although the above studies have explored the effects of land-cover change on carbon storage or NPP, the analysis of different land-cover types and the extent to which their change affects carbon storage or NPP is not comprehensive enough. Relatively few studies have been conducted on the same study area combining both NPP and carbon storage under different land-cover types. It is worth noting that carbon storage and NPP are important for the realisation of dual-carbon schemes. Therefore, it is necessary to explore the relationship between the response of land-cover change to NPP and carbon storage under the combined influence of NPP and carbon storage and to further develop guidelines for scientific and regional land planning.
Inner Mongolia is an important energy resource base in China, with a vast territory, well-developed stratigraphy, frequent magmatic activity, good mineralization conditions, and abundant mineral resources [1]. In 2020, Inner Mongolia’s carbon emissions will reach 630 million tons, the fourth highest in China, and its carbon emissions per unit of GDP and per capita carbon emissions will be nearly four times the national average. Inner Mongolia’s carbon emissions are large, its energy supply is still in the growth phase, and it is difficult to decarbonise the thermal power sector, which makes it difficult and challenging to achieve the goal of carbon peaking and carbon neutrality. Therefore, exploring vegetation carbon storage in response to land-cover change and the potential relationship between land-cover change and NPP is scientifically relevant for accomplishing the dual carbon goal in Inner Mongolia.
This paper explores vegetation carbon storage as influenced by land-cover change and the relationship between land-cover change and NPP from 2000 to 2020 in Inner Mongolia. First, GlobeLand30 land-cover data and NPP data were used to determine land-cover change and NPP change. Second, the amount of change in vegetation carbon storage affected by land-cover change was calculated based on the land-cover change transfer matrix. Then, spatial correlation analysis was used to explore the relationships and impacts between land cover and NPP. Finally, the impacts and changes between different land-cover changes and NPP changes were further analysed.
The main innovation and contribution of this paper can be found in its exploration of the vegetation carbon stock response to land-cover change and the relationship between land-cover change and NPP in Inner Mongolia from a more comprehensive perspective. Specifically, we examine the following factors: (1) The spatial distribution of land-cover changes and NPP changes is analysed from a relatively comprehensive perspective. (2) The amount of vegetation carbon stock change influenced by land-cover change is further investigated from 2000 to 2020. (3) Spatial correlation analysis is conducted on land cover and NPP, and the effects of different land-cover types on NPP values are explored in Inner Mongolia. (4) The link between land-cover change and NPP change is further explored, and the changes in NPP values due to different land-cover changes are assessed. This study is crucial to the achievement of an optimal land spatial pattern in Inner Mongolia.

2. Materials and Methods

2.1. Study Area

Inner Mongolia is located in the north of China between 37°24′–53°23′ north latitude and 97°12′–126°04′ east longitude [21,22]. As shown in Figure 1, Inner Mongolia borders Heilongjiang, Jilin, Liaoning, and Hebei in the northeast; Shanxi, Shaanxi, and Ningxia in the south; Gansu in the southwest; and Russia and Mongolia in the north. Inner Mongolia straddles northeast, north, and northwest China. Inner Mongolia is an important energy region in China, with high energy consumption and a high proportion of industry; to a certain extent, this increases the difficulty of achieving its carbon neutrality target [5,6]. The terrain of Inner Mongolia extends diagonally from northeast to southwest and is basically a plateau-type landscape area covering plateaus, mountains, hills, plains, deserts, rivers, and lakes, and it possesses rich ecological carbon sink resources [23]. Inner Mongolia has rich ecological carbon sink resources; it has the highest in the country in terms of forest area and the second highest in the country in terms of grassland area [24,25]. Ecological carbon sinks are an effective means of achieving the carbon neutrality target. Therefore, exploring the effects of land-cover change on vegetation carbon storage and the response of land-cover change to NPP offers the possibility of addressing the double-carbon problem.

2.2. Data

Data used included GlobeLand30 land-cover maps and NPP data [26]. GlobeLand30 data are part of a global geographic information public product, available through the GlobeLand30 website (http://globeland30.org/, accessed on 11 December 2022). NPP reflects the efficiency with which plants fix and transform photosynthetic products and also determines the amount of material and energy available to heterotrophic organisms, including various animals and people [24]. NPP data were obtained through the Google Earth Engine platform [27,28,29] (https://code.earthengine.google.com/, accessed on 13 December 2022) to obtain MOD17A3H 500 m resolution data.
The release of the GlobeLand30 global land-cover data for 2020 provides a useful basis for understanding land-cover change in recent years [30,31]. GlobeLand30 land-cover data are available for 10 land-cover types [32]. The overall accuracy of the GlobeLand30 land-cover data for 2010 and 2020 is 83.50% and 85.72%, respectively, with kappa coefficients of 0.78 and 0.82 [33]. GlobeLand30 global land-cover data have a relatively high accuracy and can be used in relatively large-scale studies [34,35,36].

2.3. Methods

2.3.1. Land-Cover Change Rate and Change Transfer Matrix

The land-cover change rate is used to evaluate the change in each land-cover type over the years [37]. The calculation equation is as follows.
L C R = A b A a A a × 100 %
where A a is the area of a particular land-cover type in year a, and A b is the area of a particular land-cover type in year b.
The land-cover change transfer matrix [38,39] is a quantitative relationship based on changes in land-cover types over time in the same area, which provides a quantitative visualisation of conversion among land-cover types. In this study, the GlobeLand30 land-cover change transfer matrix was acquired using ArcGIS 10.2 software.

2.3.2. Land-Cover-Change-Influenced Vegetation Carbon Storage

We analysed land-cover change on vegetation carbon storage changes in Inner Mongolia using land-cover change and vegetation carbon storage density corresponding to land-cover types [40]. It is worth noting that the changes in soil organic carbon caused by land-cover-type changes were not considered in this study due to the long time period over which soil organic carbon changes occur [17]. The specific equation is as follows:
C i j = ( V i V j ) × A i j
where C i j represents vegetation carbon stock change due to conversion from land-cover-types i to j ; V i is the density of vegetation carbon for land-cover type i ; V j is the density of vegetation carbon for land-cover types j ; and A i j is the area converted from land-cover-types i to j .

2.3.3. Spatial Correlation Analysis

Spatial correlation analysis was carried out between NPP and land cover to calculate correlation coefficients and clarify their association. The Pearson correlation coefficient was used to measure whether the two datasets lie on top of a line and to measure the linear relationship between the fixed distance variables [41,42,43]. Sig is an abbreviation for statistical significance [44]. The value of sig is the statistical p-value, and the test of significance is based on the p-value. If the p-value is 0.01 < p < 0.05, the difference is significant, and if p < 0.01, the difference is highly significant [45]:
r = i = 1 n ( X i X ¯ ) ( Y i Y ¯ ) i = 1 n ( X i X ¯ ) 2 i = 1 n ( Y i Y ¯ ) 2
where X and Y denote samples for comparison; X ¯ and Y ¯ are the mean of the comparison samples.

3. Results

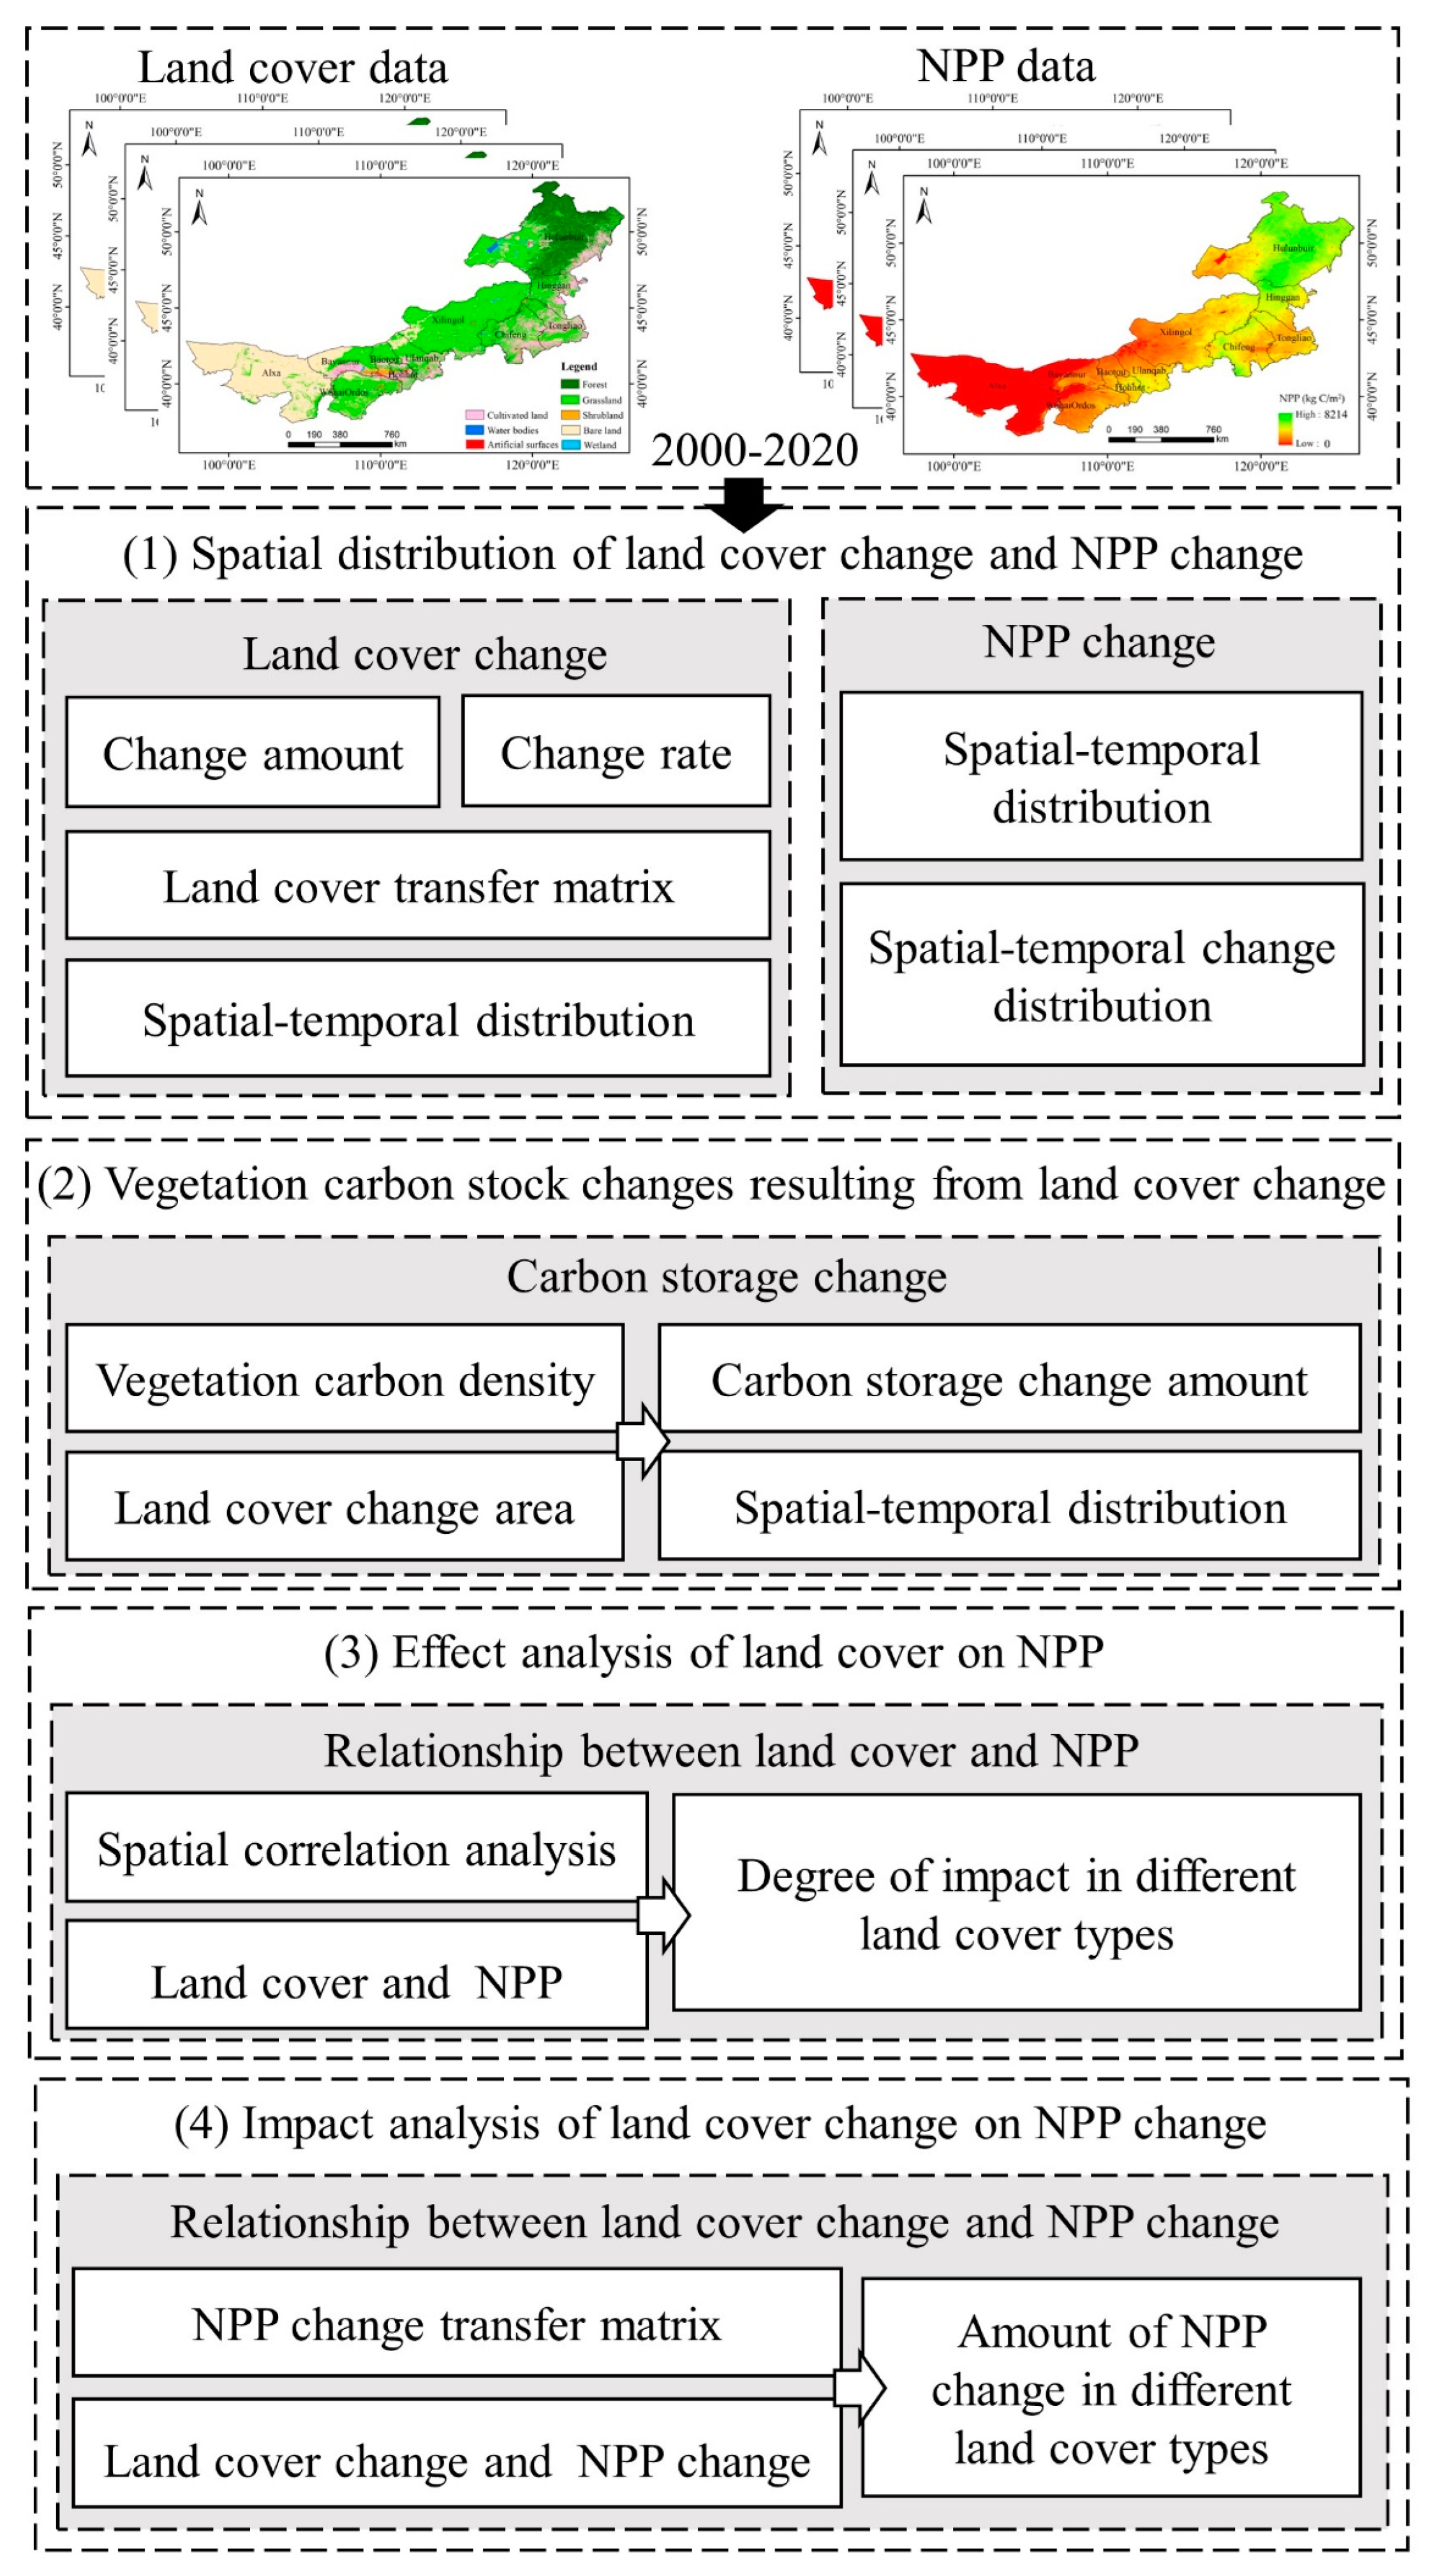
As shown in Figure 2, firstly, land-cover change and NPP change in Inner Mongolia, including the change amount, change rate, land-cover change transfer matrix, and spatial distribution, were obtained using GlobeLand30 land-cover data and NPP data from 2000 to 2020. Secondly, the changes in vegetation carbon storage affected by land-cover change were calculated by combining the vegetation carbon density of each land-cover type. Then, the correlation and influence between land-cover data and NPP data were analysed using the spatial correlation method. Finally, the changes in NPP values with different land-cover changes were explored through land-cover changes and NPP changes.

3.1. Spatial Distribution of Land-Cover Change and NPP Change

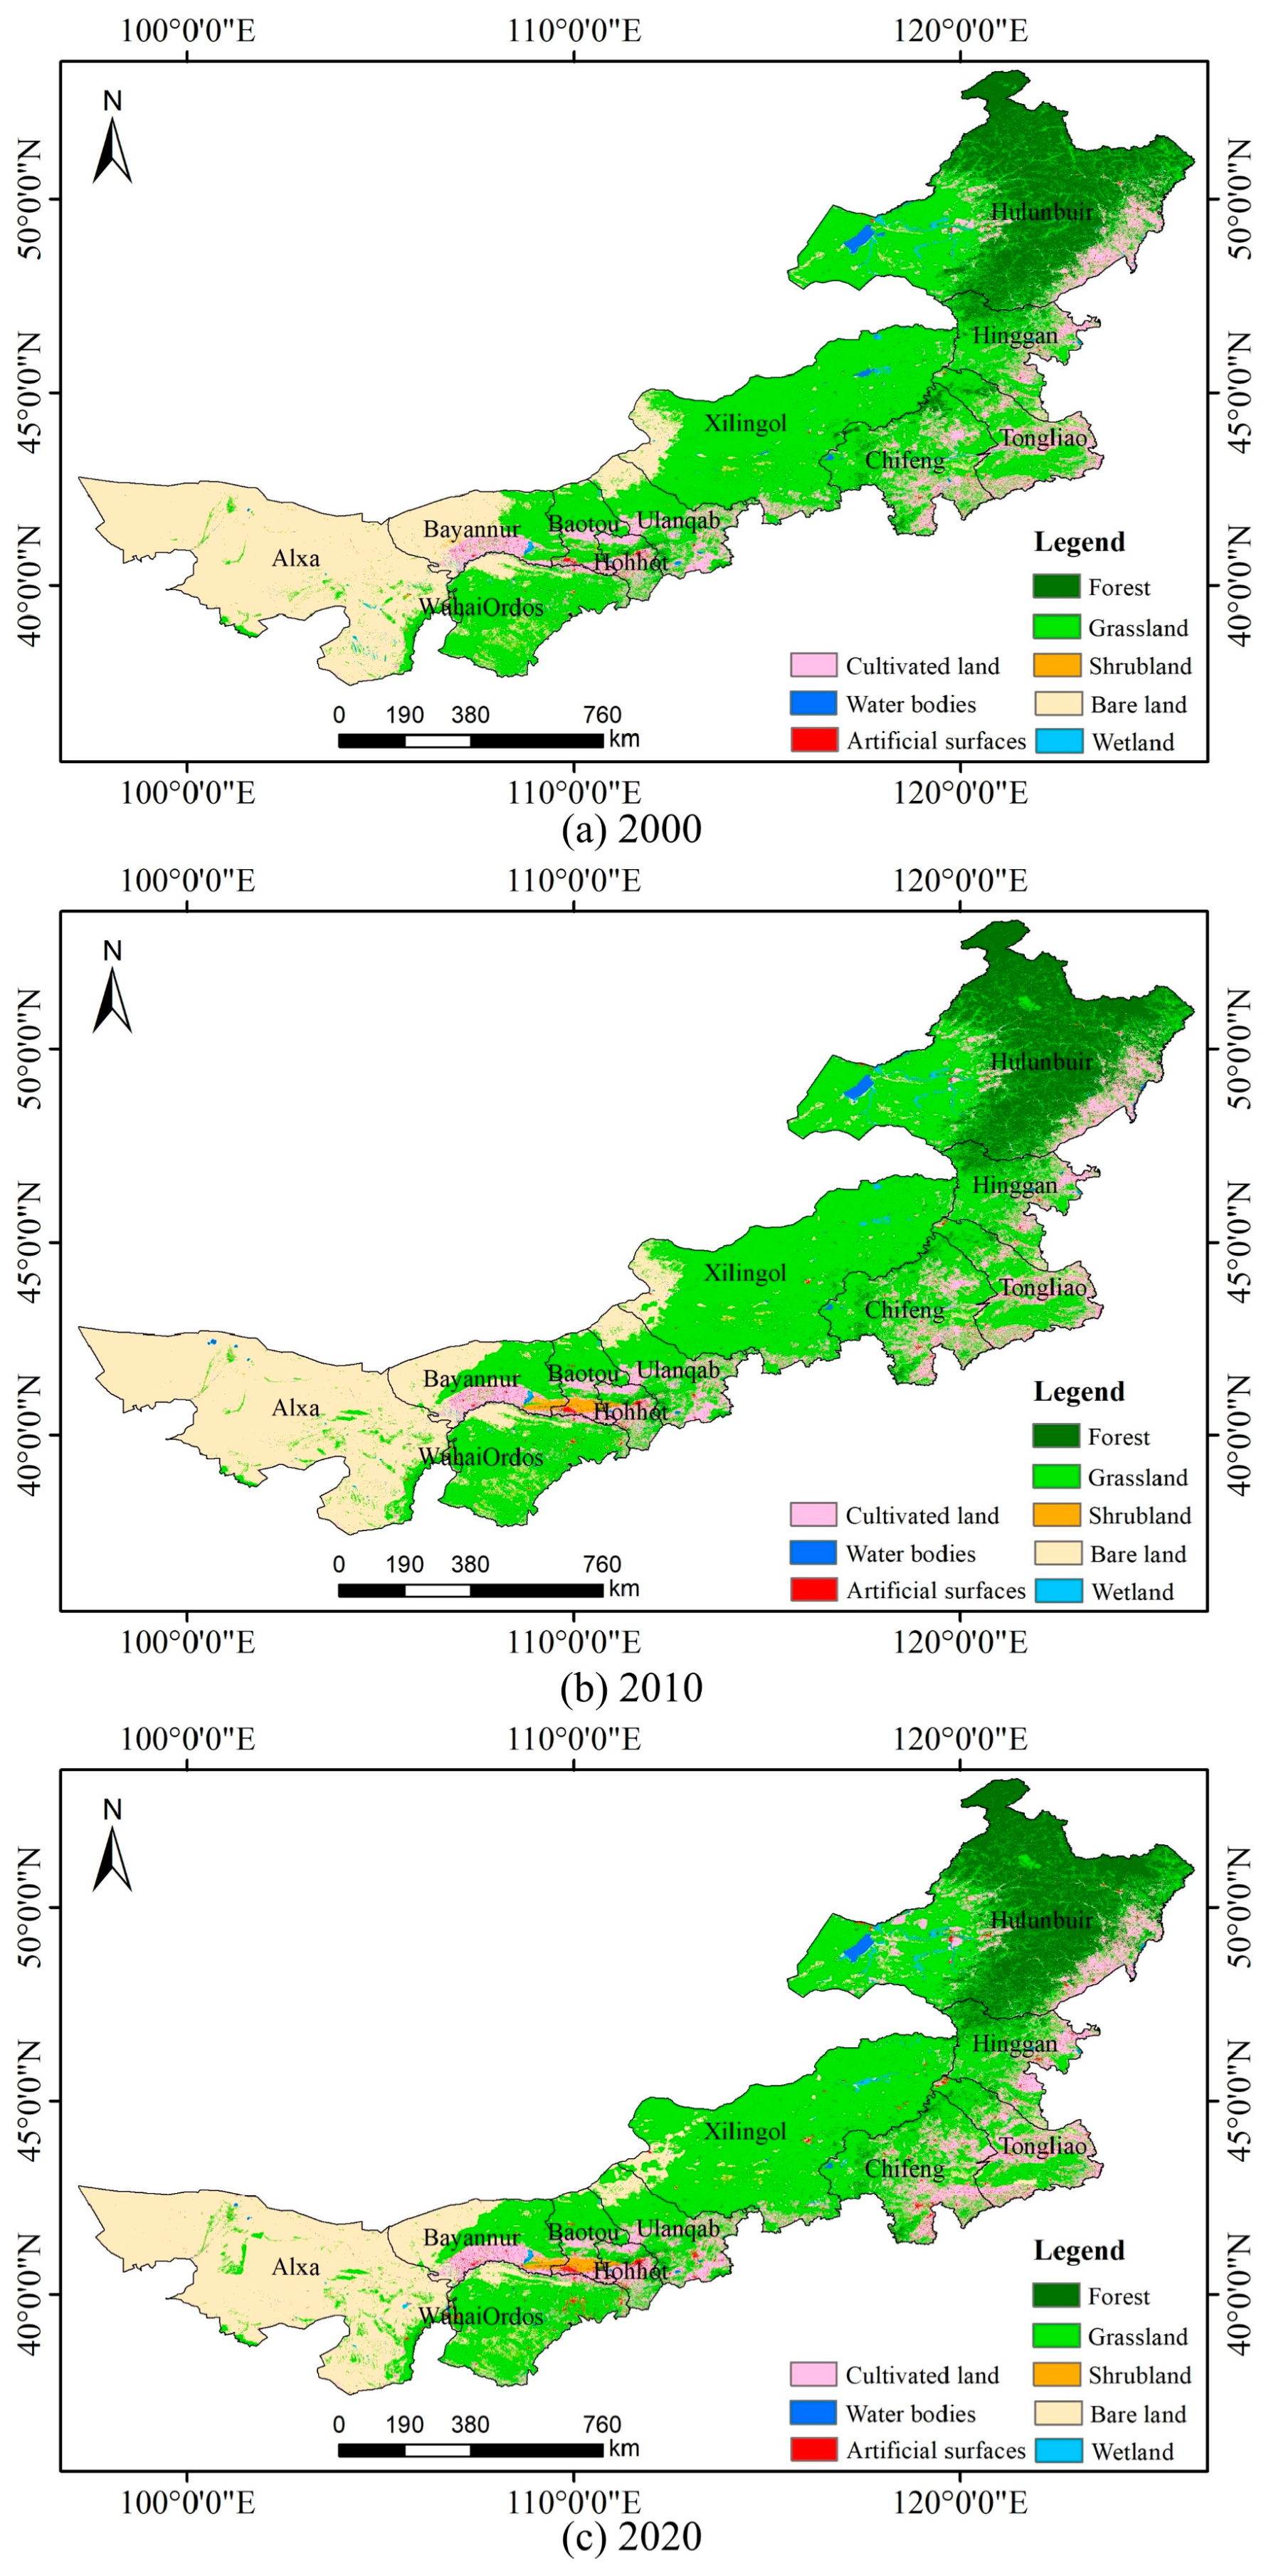
As shown in Figure 3, the southwestern part of Inner Mongolia is mainly bare land, the central part is mainly grassland, and the northeastern part is mainly forested, with a more dispersed distribution of cultivated land and less artificial surface region. There is one more obvious lake in the northeastern region. In particular, the central part of Inner Mongolia showed a marked conversion of grassland to shrubland in 2010.
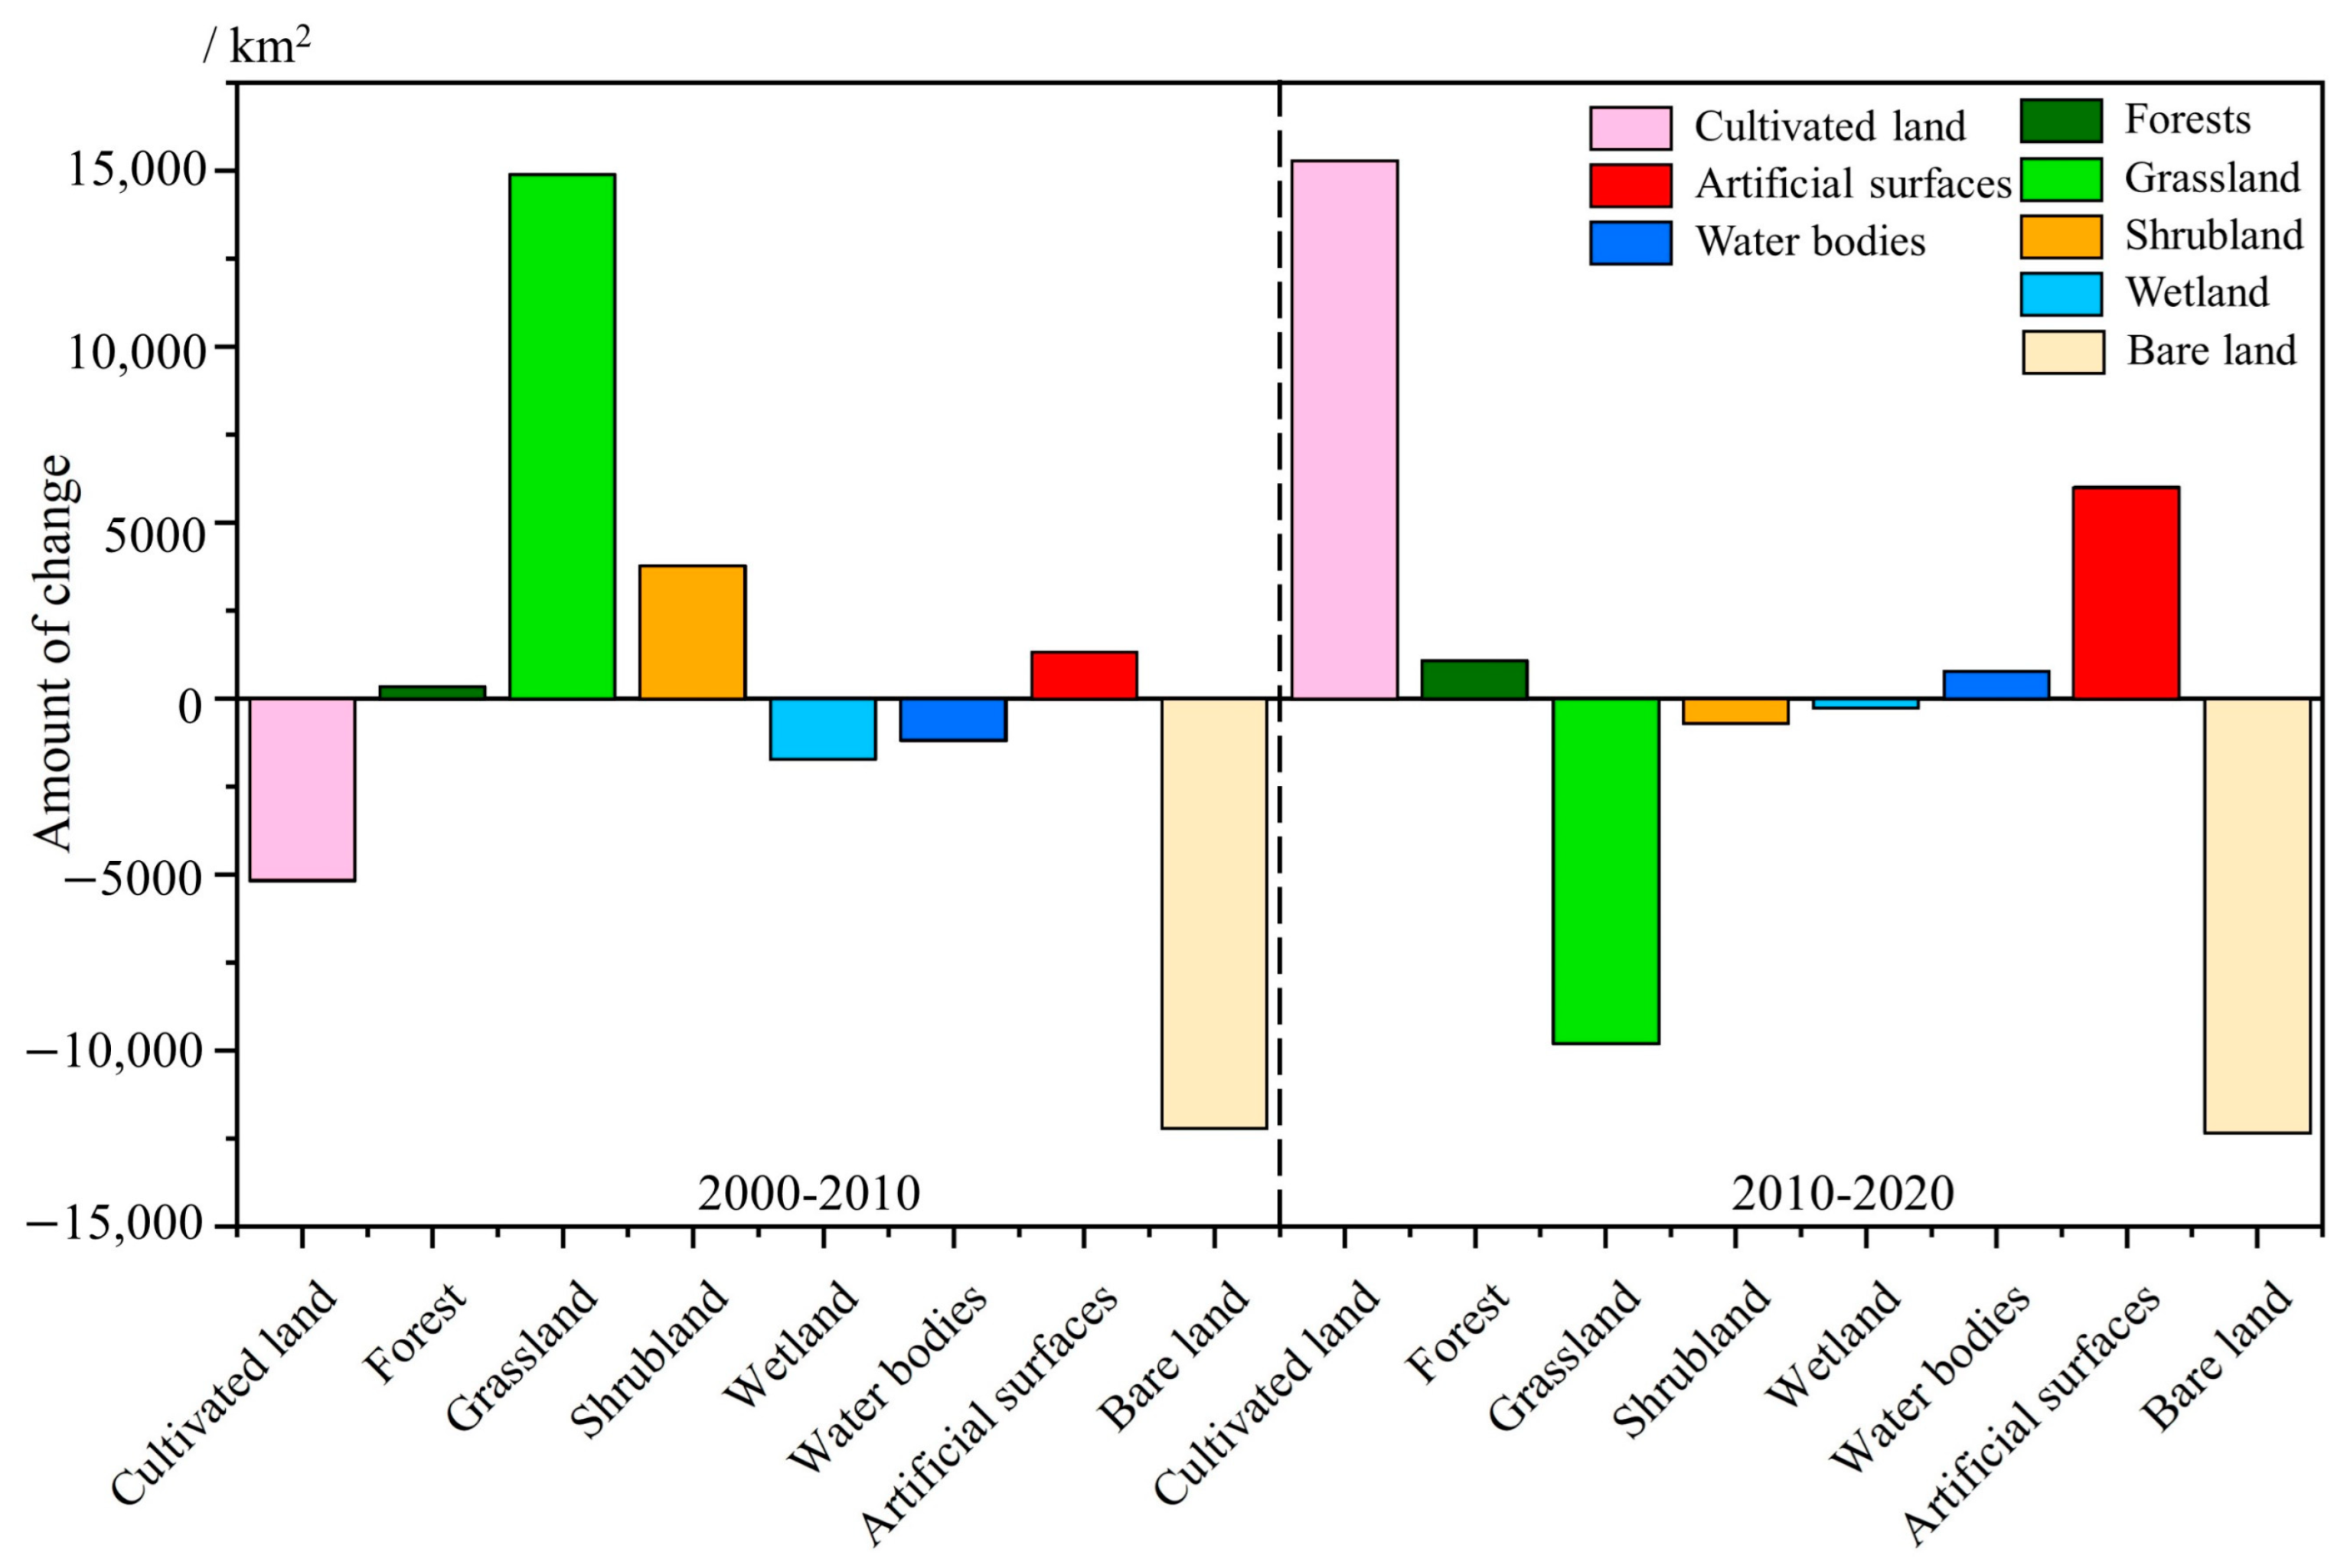
As shown in Table 1, Inner Mongolia has the largest grassland area, accounting for approximately 46–47% of the overall area, followed by bare land. As shown in Figure 4, between 2000 and 2010, the largest increase in grassland area was 14,884.64 km2; shrubland showed an increase of 3769.61 km2, a change of 65.10%; wetlands and water bodies showed a decrease of 22.26% and 18.22%, respectively; and artificial surfaces increased by 1298.63 km2, a change of 17.07%. The reduction in cultivated land was 5185.56 km2. From 2010 to 2020, grassland decreased by 9797.81 km2, and shrubland decreased by 699.42 km2. Bare land still showed a decreasing trend, decreasing by 12,316.37 km2, and water bodies trended upward, with a change rate of 14.00%. The artificial surface area increased by 6005.93 km2, or 67.42%. Cultivated land increased by 11.03%, with an area change of 15,221.71 km2.
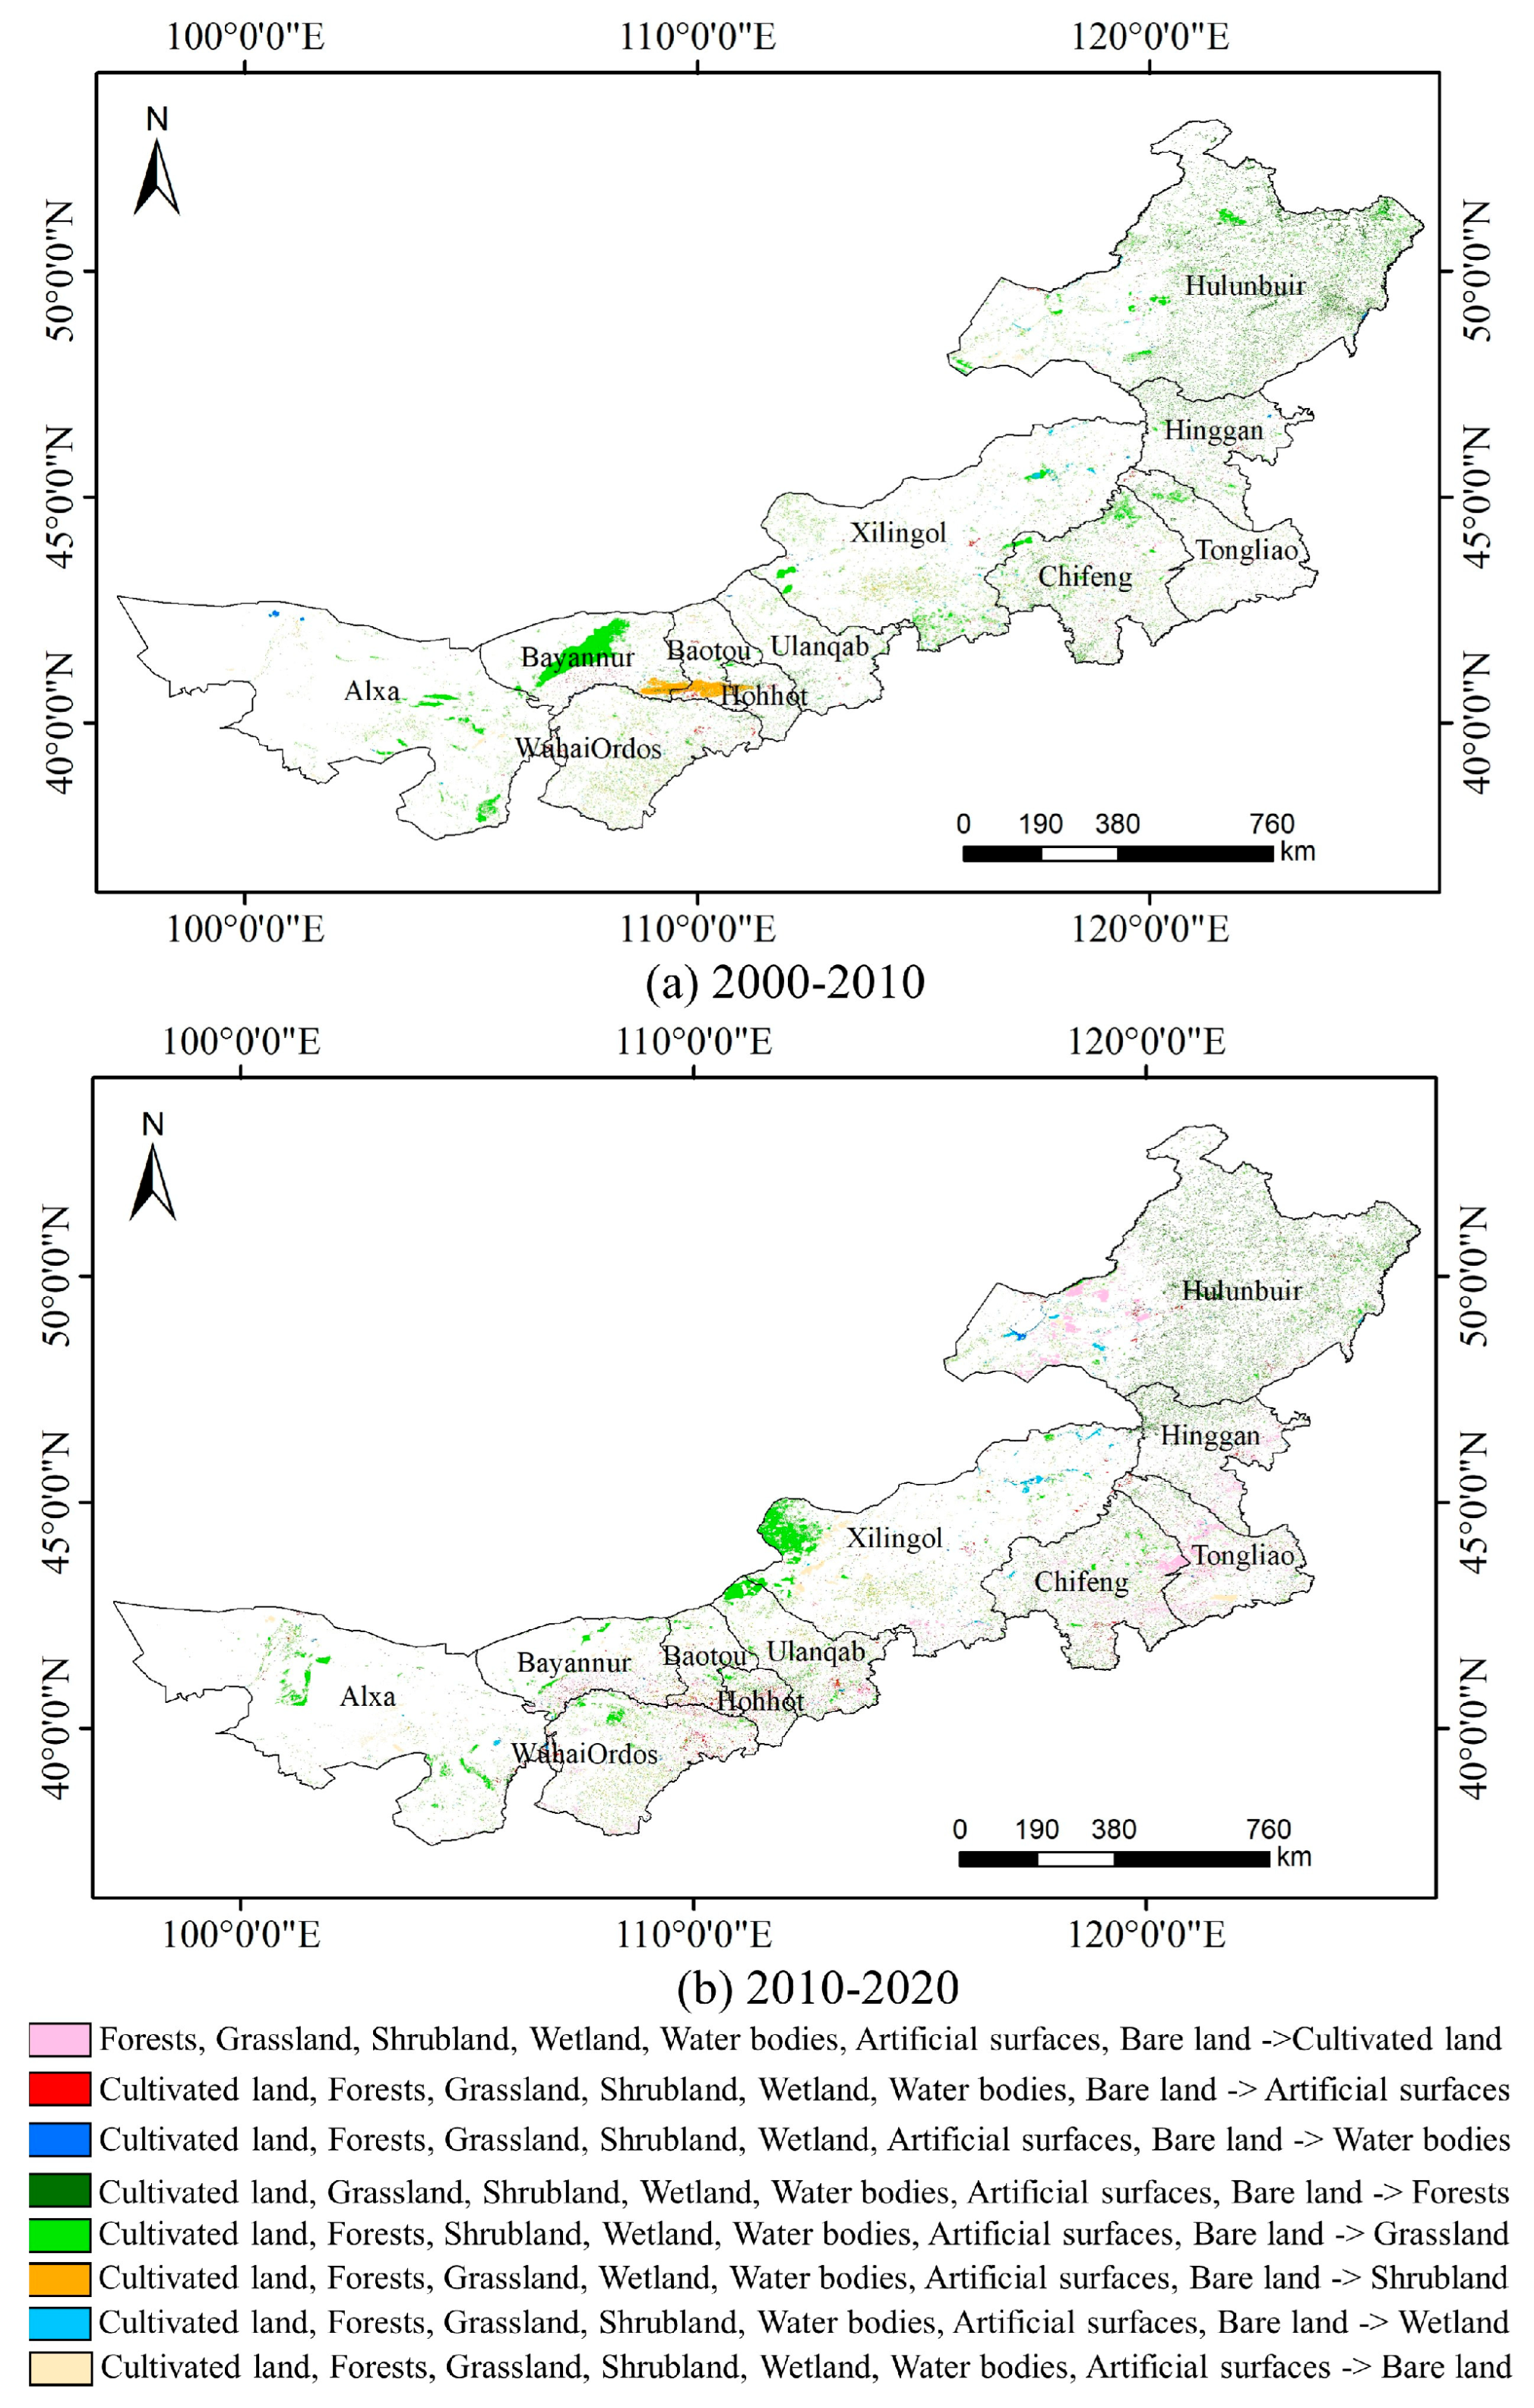
Figure 5 shows the land-cover changes in Inner Mongolia from 2000 to 2020. From 2000–2010, conversions from other land-cover types to grassland, shrubland, and forest were the main land-cover changes in Inner Mongolia, while the conversion from grassland to shrubland was mainly concentrated in Bayannur City, Baotou City, and Hohhot City. The conversion of bare land to grassland occurred mainly in Bayannur municipality and the Alxa League region. Grassland-to-forest and forest-to-grassland conversions occurred mainly in Hulunbeier City.
As shown in Table 2, the area of land-cover types converted to grassland in Inner Mongolia was higher than those converted to other types. The areas of cultivated land, forest, and bare land converted to grassland were 11,003.96 km2, 14,326.38 km2, and 20,634.87 km2, respectively. From 2010 to 2020, conversions of other land-cover types to grassland, cultivated land, artificial surface, and wetlands were the main land-cover changes in Inner Mongolia. The conversion of bare land to grassland mainly took place in Xilingrad League, Ulanqab City, and Alxa League. Grassland conversion to cultivated land mostly happened in Hulunbeier City, Chifeng City, and Tongliao City. The expansion of artificial surfaces took place mainly in Baotou City, Ordos City, Hohhot City, and Ulanqab City. Changes in wetlands and water bodies occurred mainly in the northeastern part of Xilingrad League and the western part of Hulunbeier City. The area converted from other types to grassland remained the largest, with an area of 48,575.22 km2, followed by the conversion of other types to bare land, with an area of 12,693.50 km2.
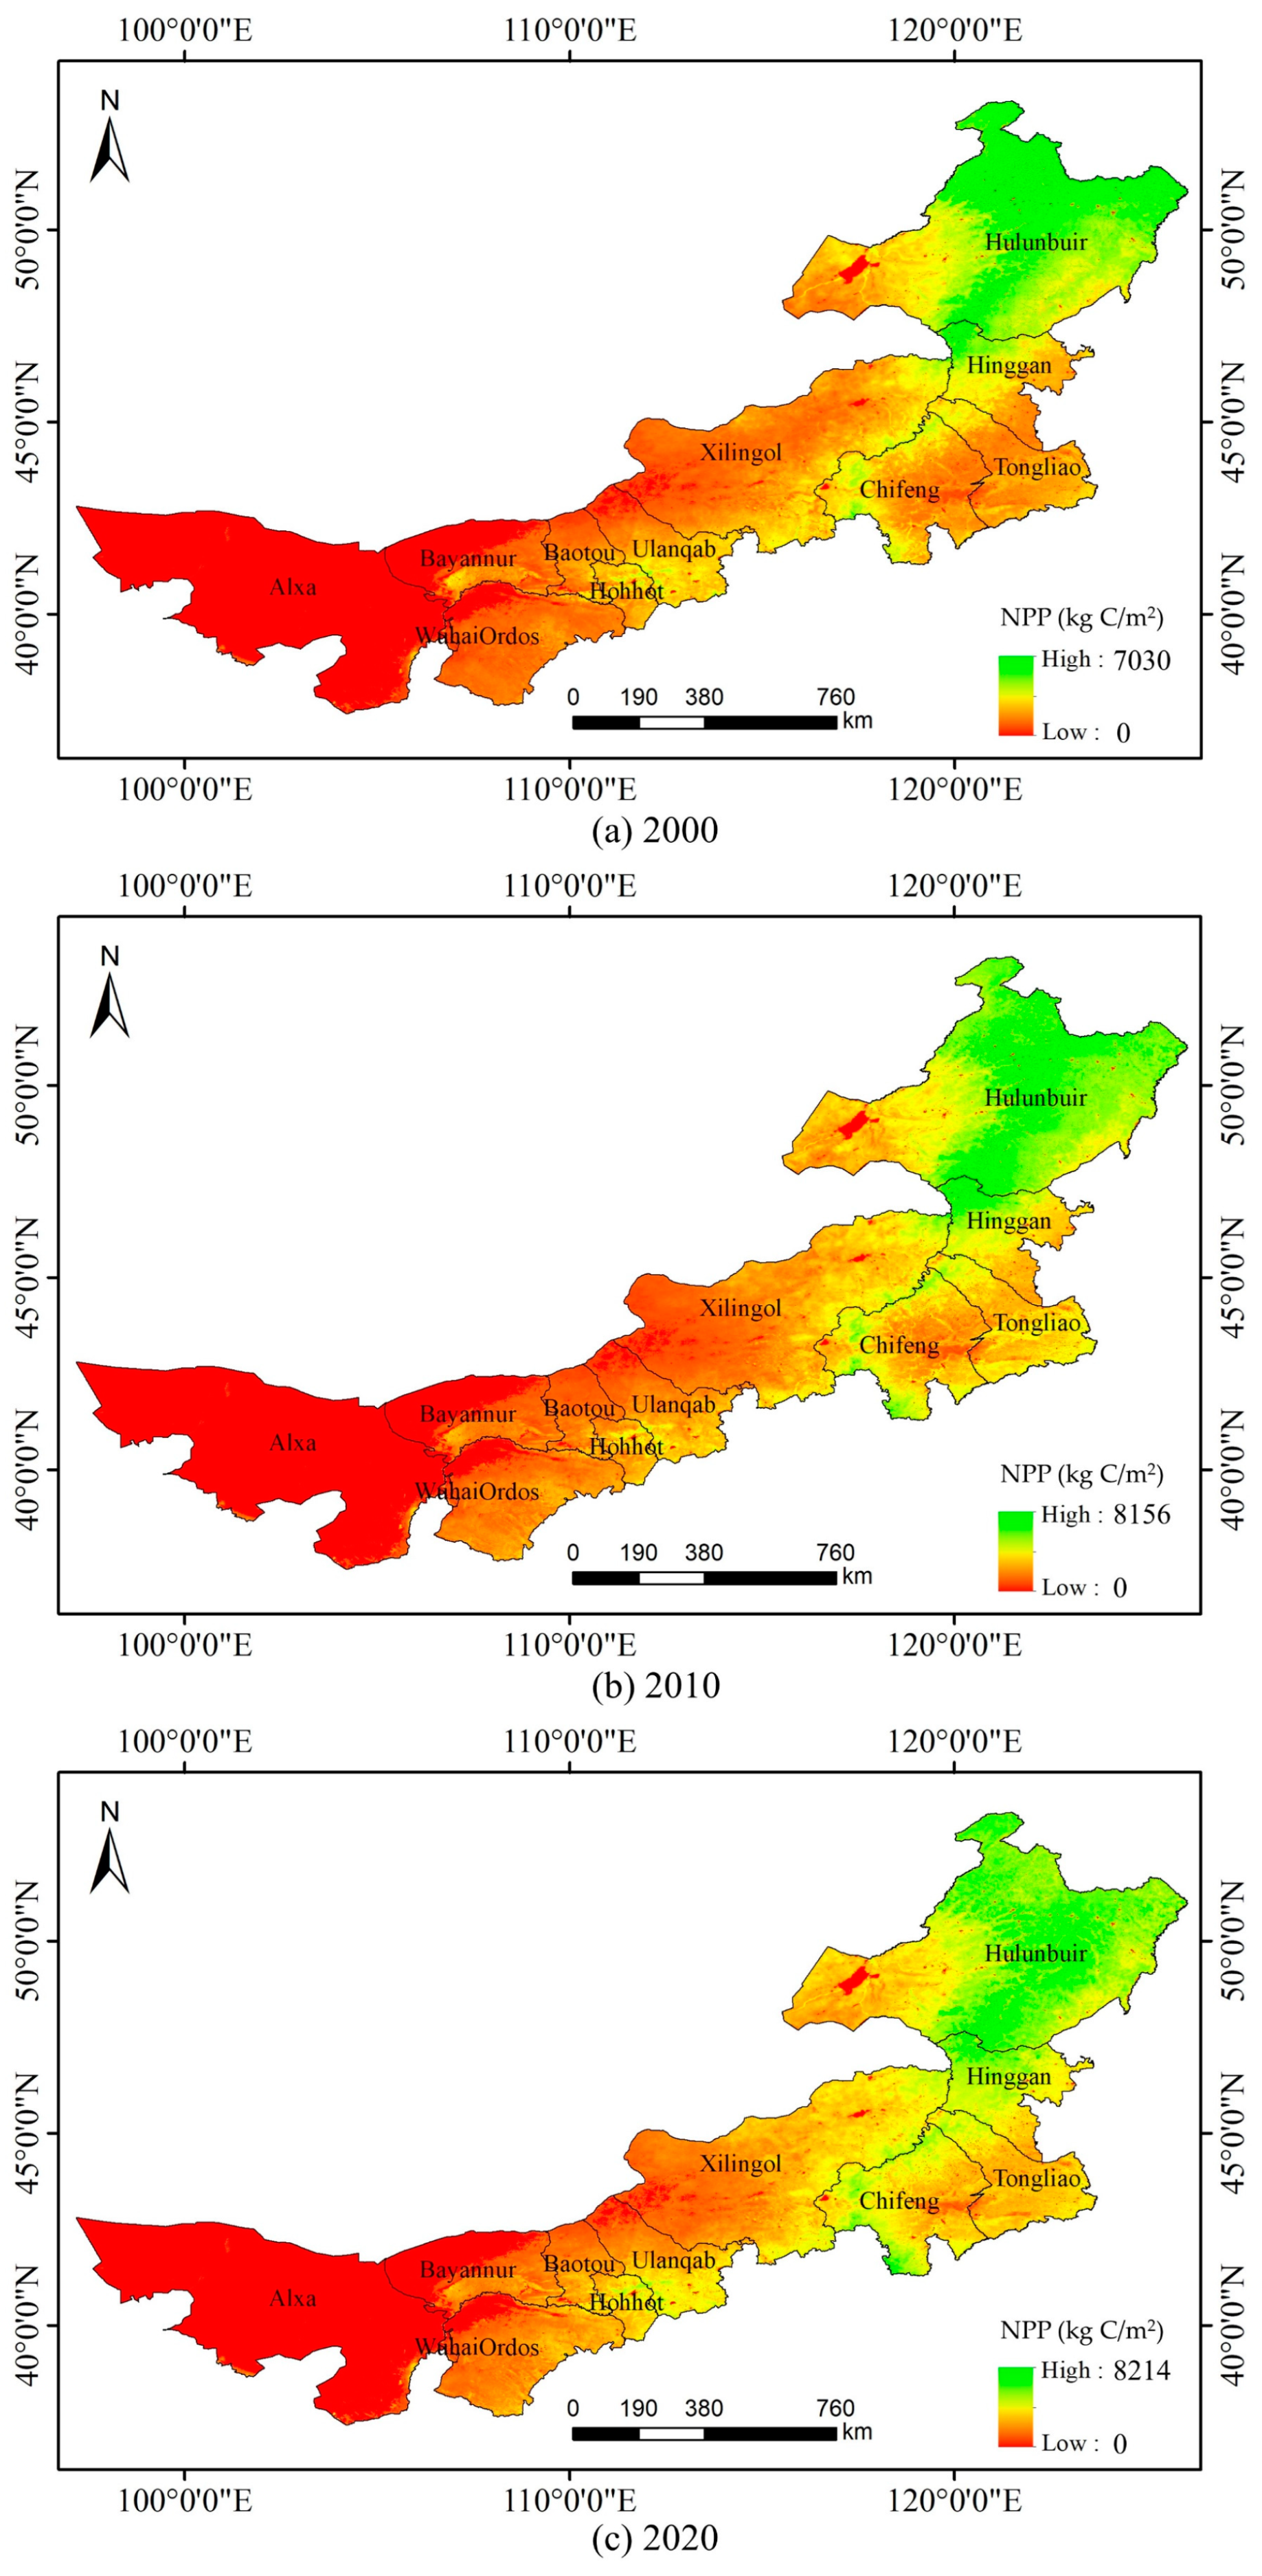
As shown in Figure 6, the areas with high NPP values in Inner Mongolia from 2000 to 2020 were mainly located in the northeastern region, e.g., Hulunbeier City, Xinggan League, and the border of Chifeng City and Xilingrad League. The areas with low NPP values were mainly concentrated in the southwestern region, e.g., Alxa League, Bayannur City, Wuhai City, and Ordos City. The distribution of NPP data in Inner Mongolia from 2000 to 2020 is in line with the change in surface vegetation from forest–grassland–desert and grassland–desert from the east to the west.
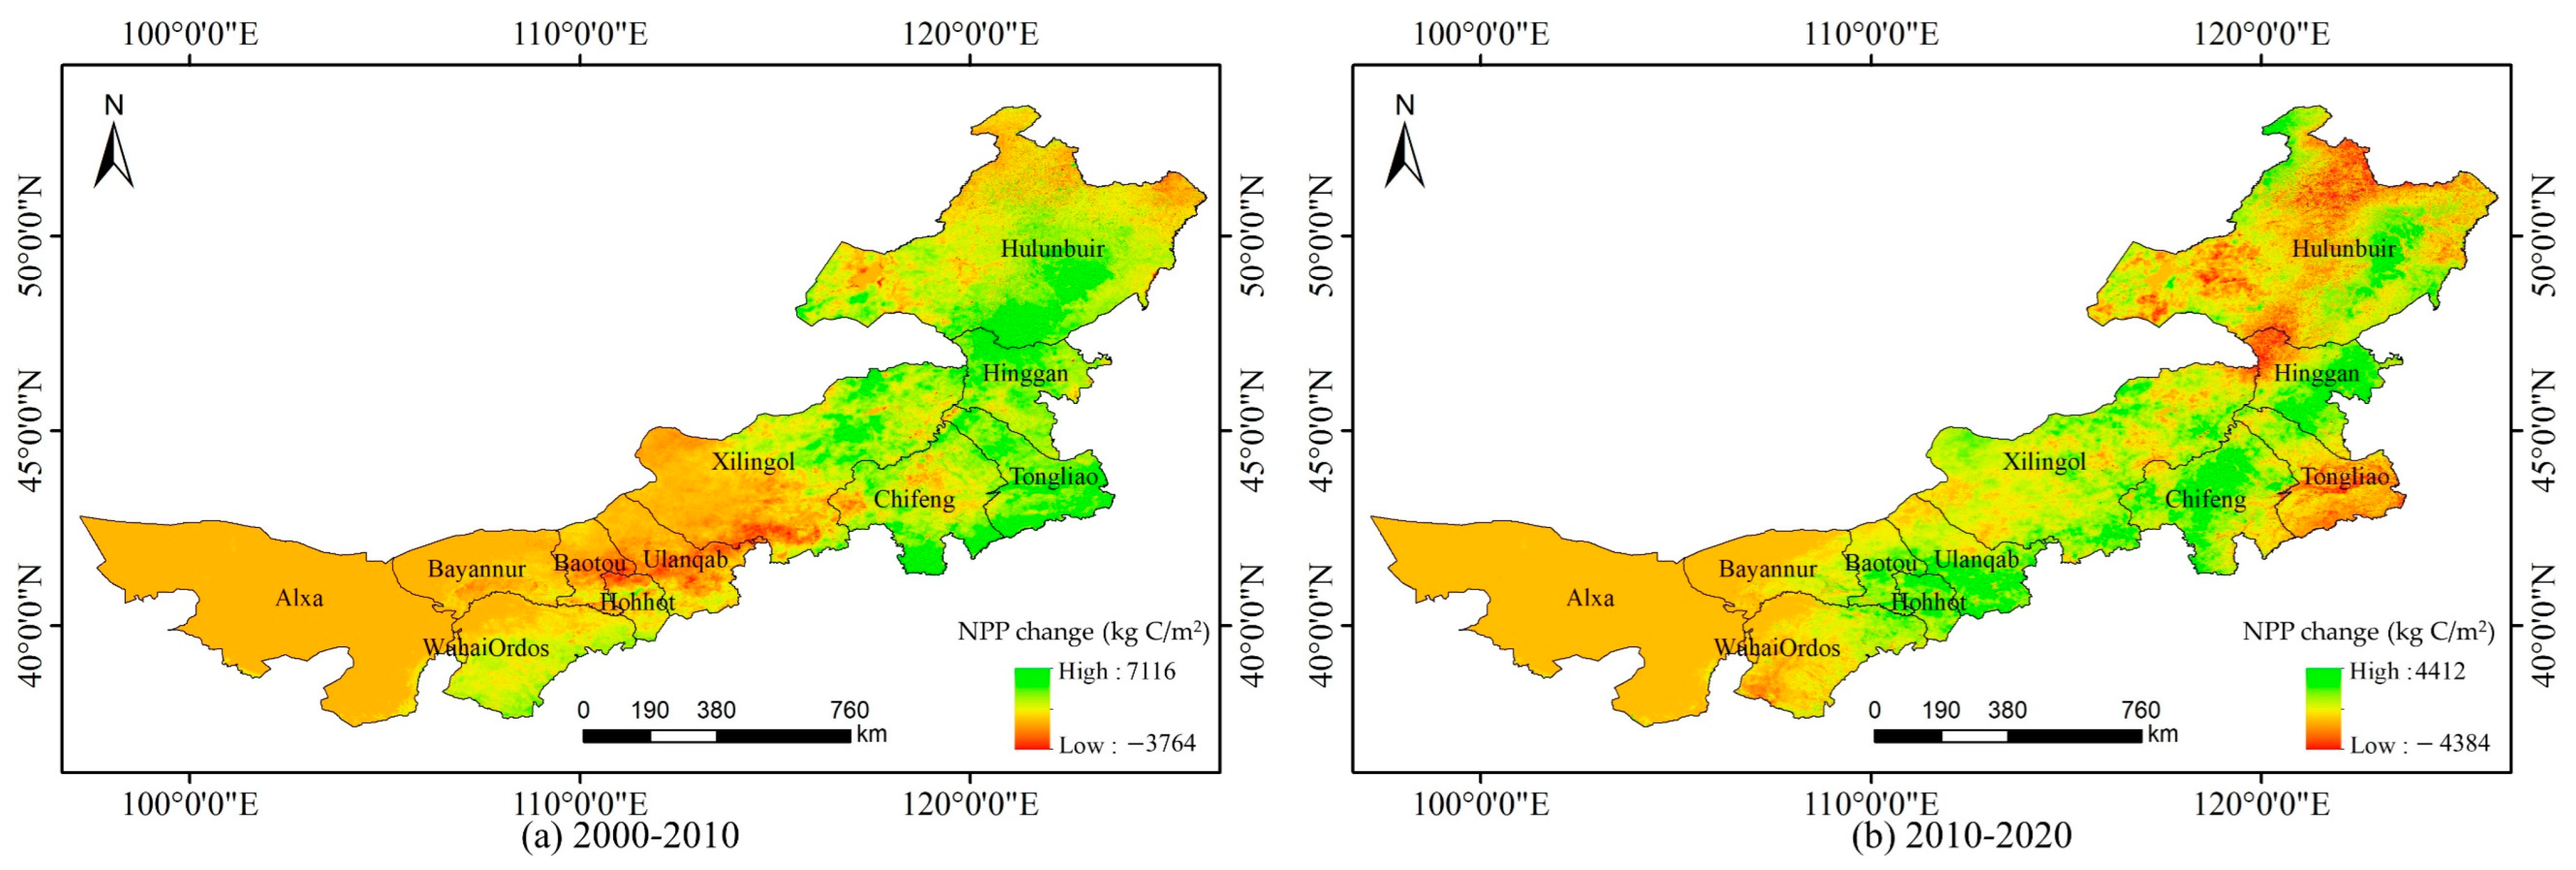
As shown in Figure 7, between 2000 and 2010, there was an increasing trend in NPP values in Hulunbeier City, Xinggan League, Tongliao City, Chifeng City, and the northeastern part of Xilingrad League, as well as the southern part of Ordos City. Decreases in NPP were evident in the southern part of Xilingrad League, the central part of Ulanqab City, and the southern part of Baotou City. Between 2010 and 2020, the NPP values in the southeastern regions of Hulunbeier City and Tongliao City showed a significant decrease. Chifeng City, the eastern part of Xinggan League, the southern part of Ulanqab City, the southern part of Baotou City, and Hohhot City showed a significant increase.

3.2. Vegetation Carbon Stock Changes Resulting from Land-Cover Change

The density of vegetation carbon storage for different land-cover types [7,46] is shown in Table 3. As shown in Table 4, according to the change in land cover from 2000 to 2020, the changes in vegetation carbon storage affected by land-cover change in Inner Mongolia from 2000 to 2010 and from 2010 to 2020 were 10,736,986.11 t and 3,894,272.41 t, respectively. The reductions in carbon storage of vegetation from 2000–2010 were 2,211,796.64 t, 38,494,983.06 t, and 8,240,144.44 t for the conversion of cultivated land, forest, and shrubland to grassland, respectively. From 2010 to 2020, the carbon storage of vegetation from other land-cover types converted to grassland and artificial surfaces decreased by 35,555,321.59 t and 2,223,251.93 t, respectively. The increase in the carbon storage of vegetation affected by land-cover change from 2000 to 2020 was mainly due to the conversion of other land-cover types to forest, cultivated land, and shrubland.
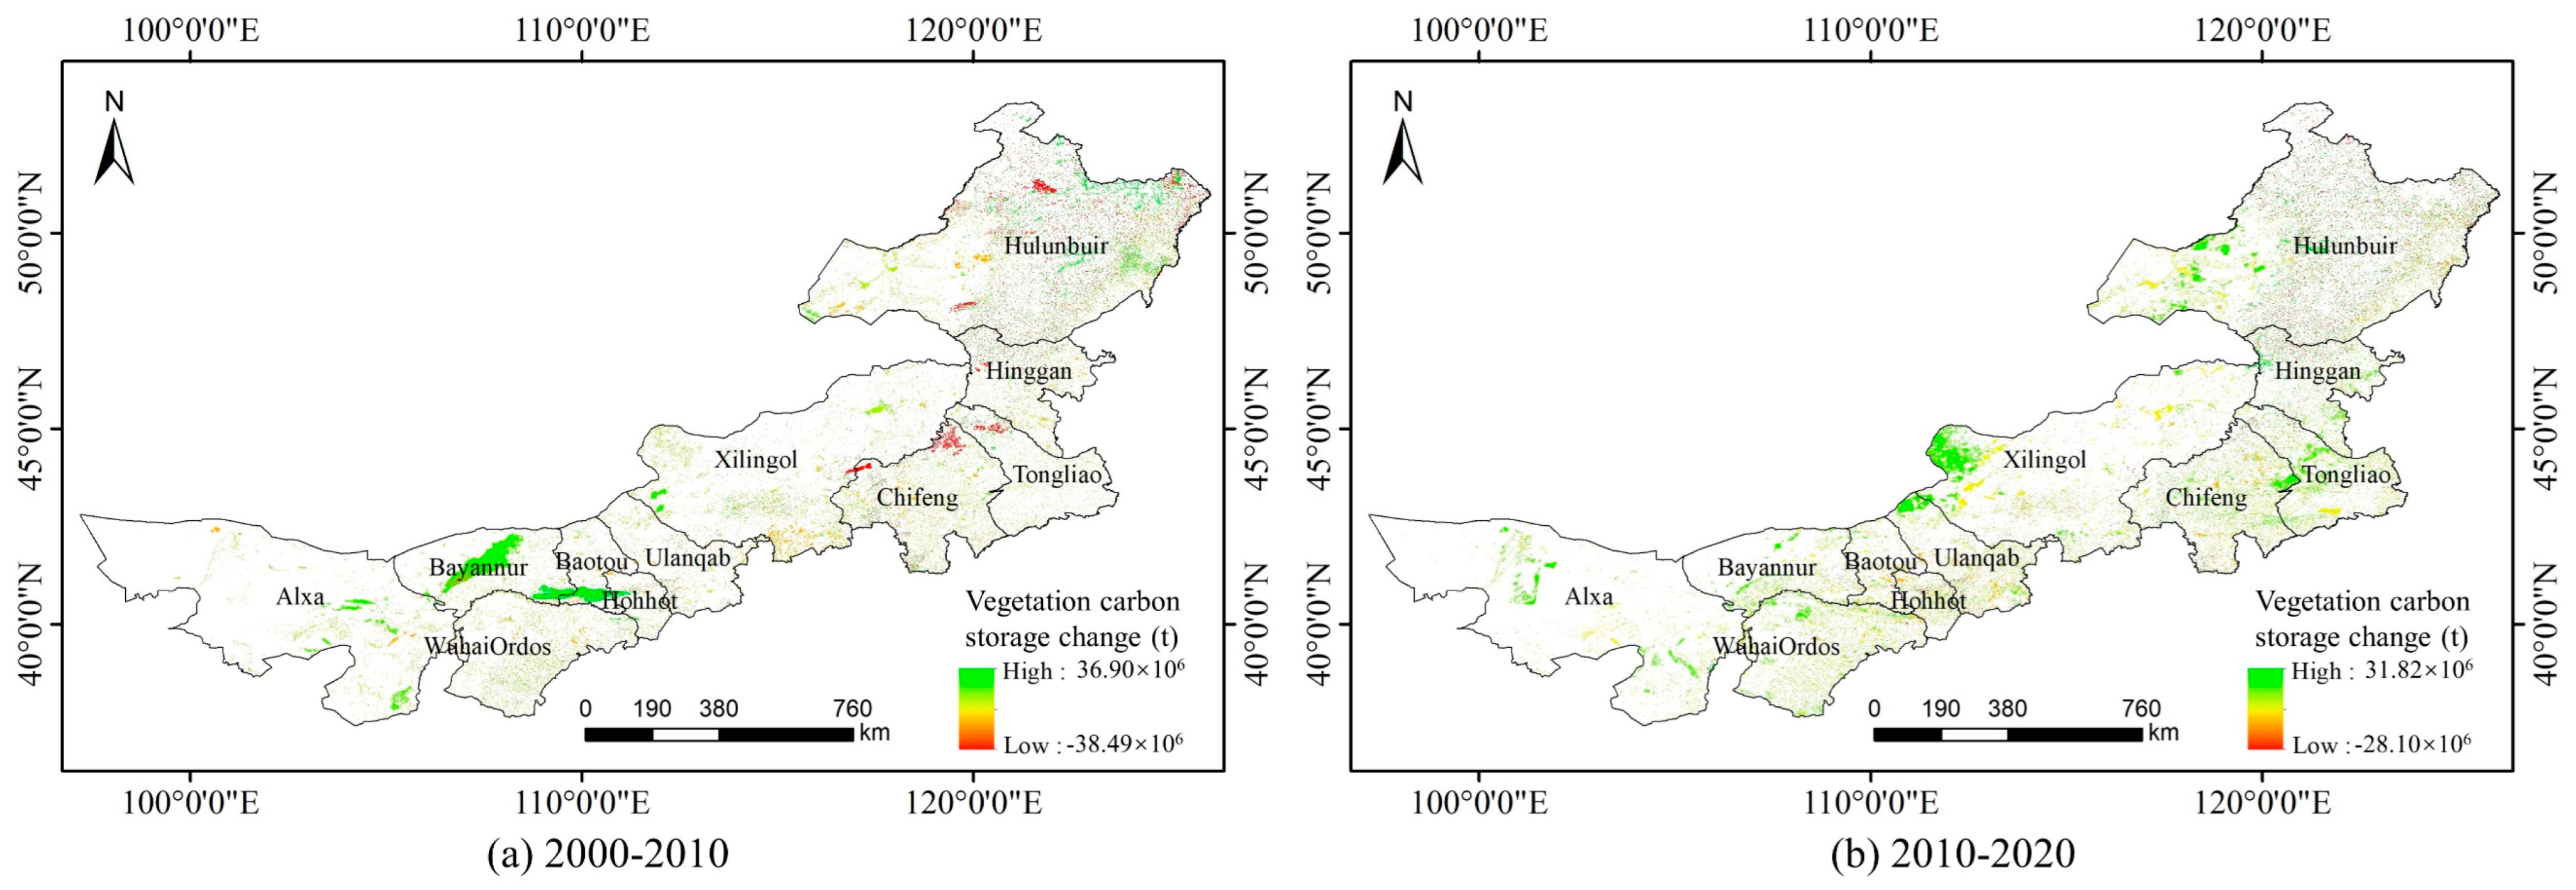
Figure 8 shows the spatial distribution of changes in vegetation carbon storage affected by land-cover change in Inner Mongolia from 2000 to 2020. From 2000 to 2010, the increase in vegetation carbon storage affected by land-cover change was mainly concentrated in the central and western parts of Inner Mongolia, i.e., the southeastern part of Alxa League, the central part of Bayannur City, the southern part of Baotou City, and the western part of Hohhot City, with some increase in the northeastern part of Inner Mongolia. The areas where vegetation carbon storage decreased were mainly located in the northern part of Chifeng City, the northwestern part of Tongliao City, the eastern part of Xilingrad League, and the northern part of Hulunbeier City. From 2010 to 2020, the increase in vegetation carbon storage mainly occurred in the western and southern parts of Alxa League, the central part of Bayannur City, the northern part of Ordos City, the northern part of Ulanqab City, the western part of Xilingrad League, the border between Tongliao City and Chifeng City, and the western part of Hulunbeier City. The regional distribution of the reduction in vegetation carbon storage was more dispersed.

3.3. Effect Analysis of Land Cover on NPP

Table 5 shows the spatial correlation analysis between land-cover and NPP data from 2000 to 2020. The GlobeLand30 land-cover-type values are specified as follows: cultivated land is 10, forest is 20, grassland is 30, shrubland is 40, wetland is 50, water bodies are 60, artificial surface is 80, and bare land is 90. It can be clearly seen that there is a significant negative correlation between the spatial distribution of land-cover type values and the spatial distribution of NPP values. Combined with the Pearson correlation coefficient, it can be observed that land-cover types with smaller values, such as cultivated land, forest, and grassland, have larger NPP values. Land-cover types with larger values, such as water bodies, artificial surfaces, and bare ground, have smaller NPP values.
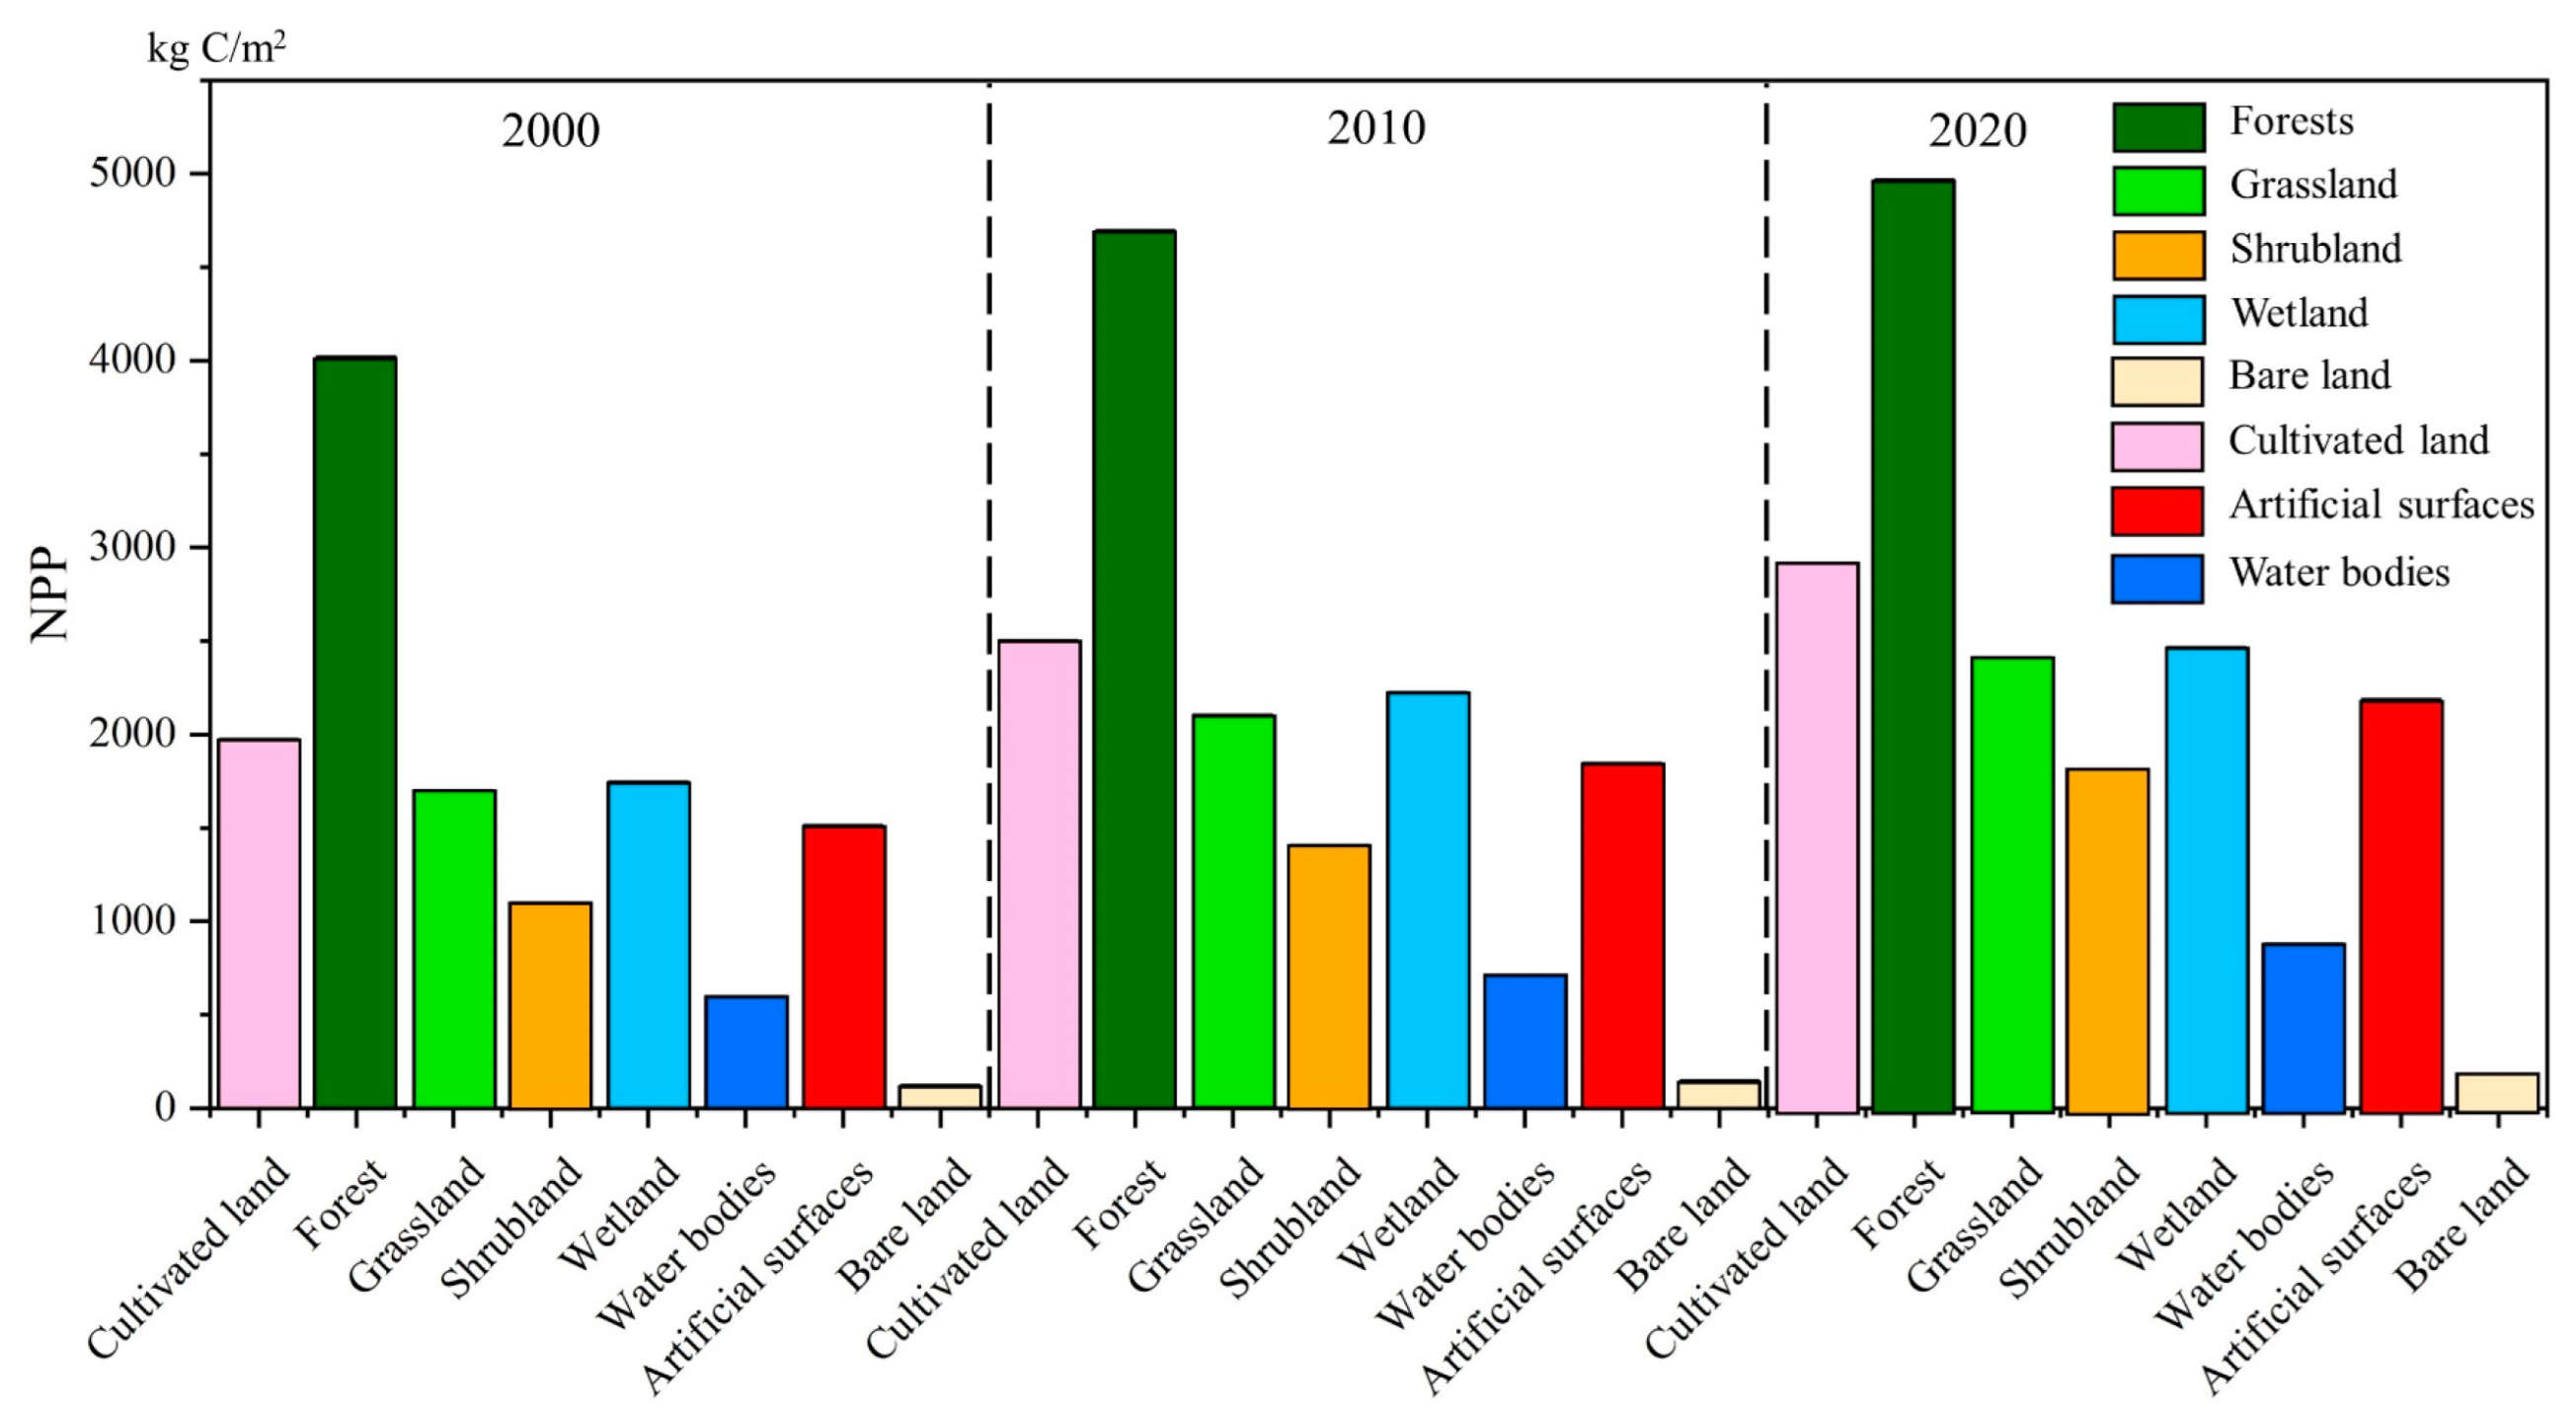
As shown in Figure 9, different land-cover types had different effects on the value of NPP from 2000 to 2020, with the mean values of NPP for different land-cover types in descending order being forest > cultivated land > wetland > grassland > artificial surfaces > shrubland > water bodies > bare land. From 2000 to 2020, the mean values of NPP for different land-cover types showed an increasing trend.

3.4. Impact Analysis of Land-Cover Change on NPP Change

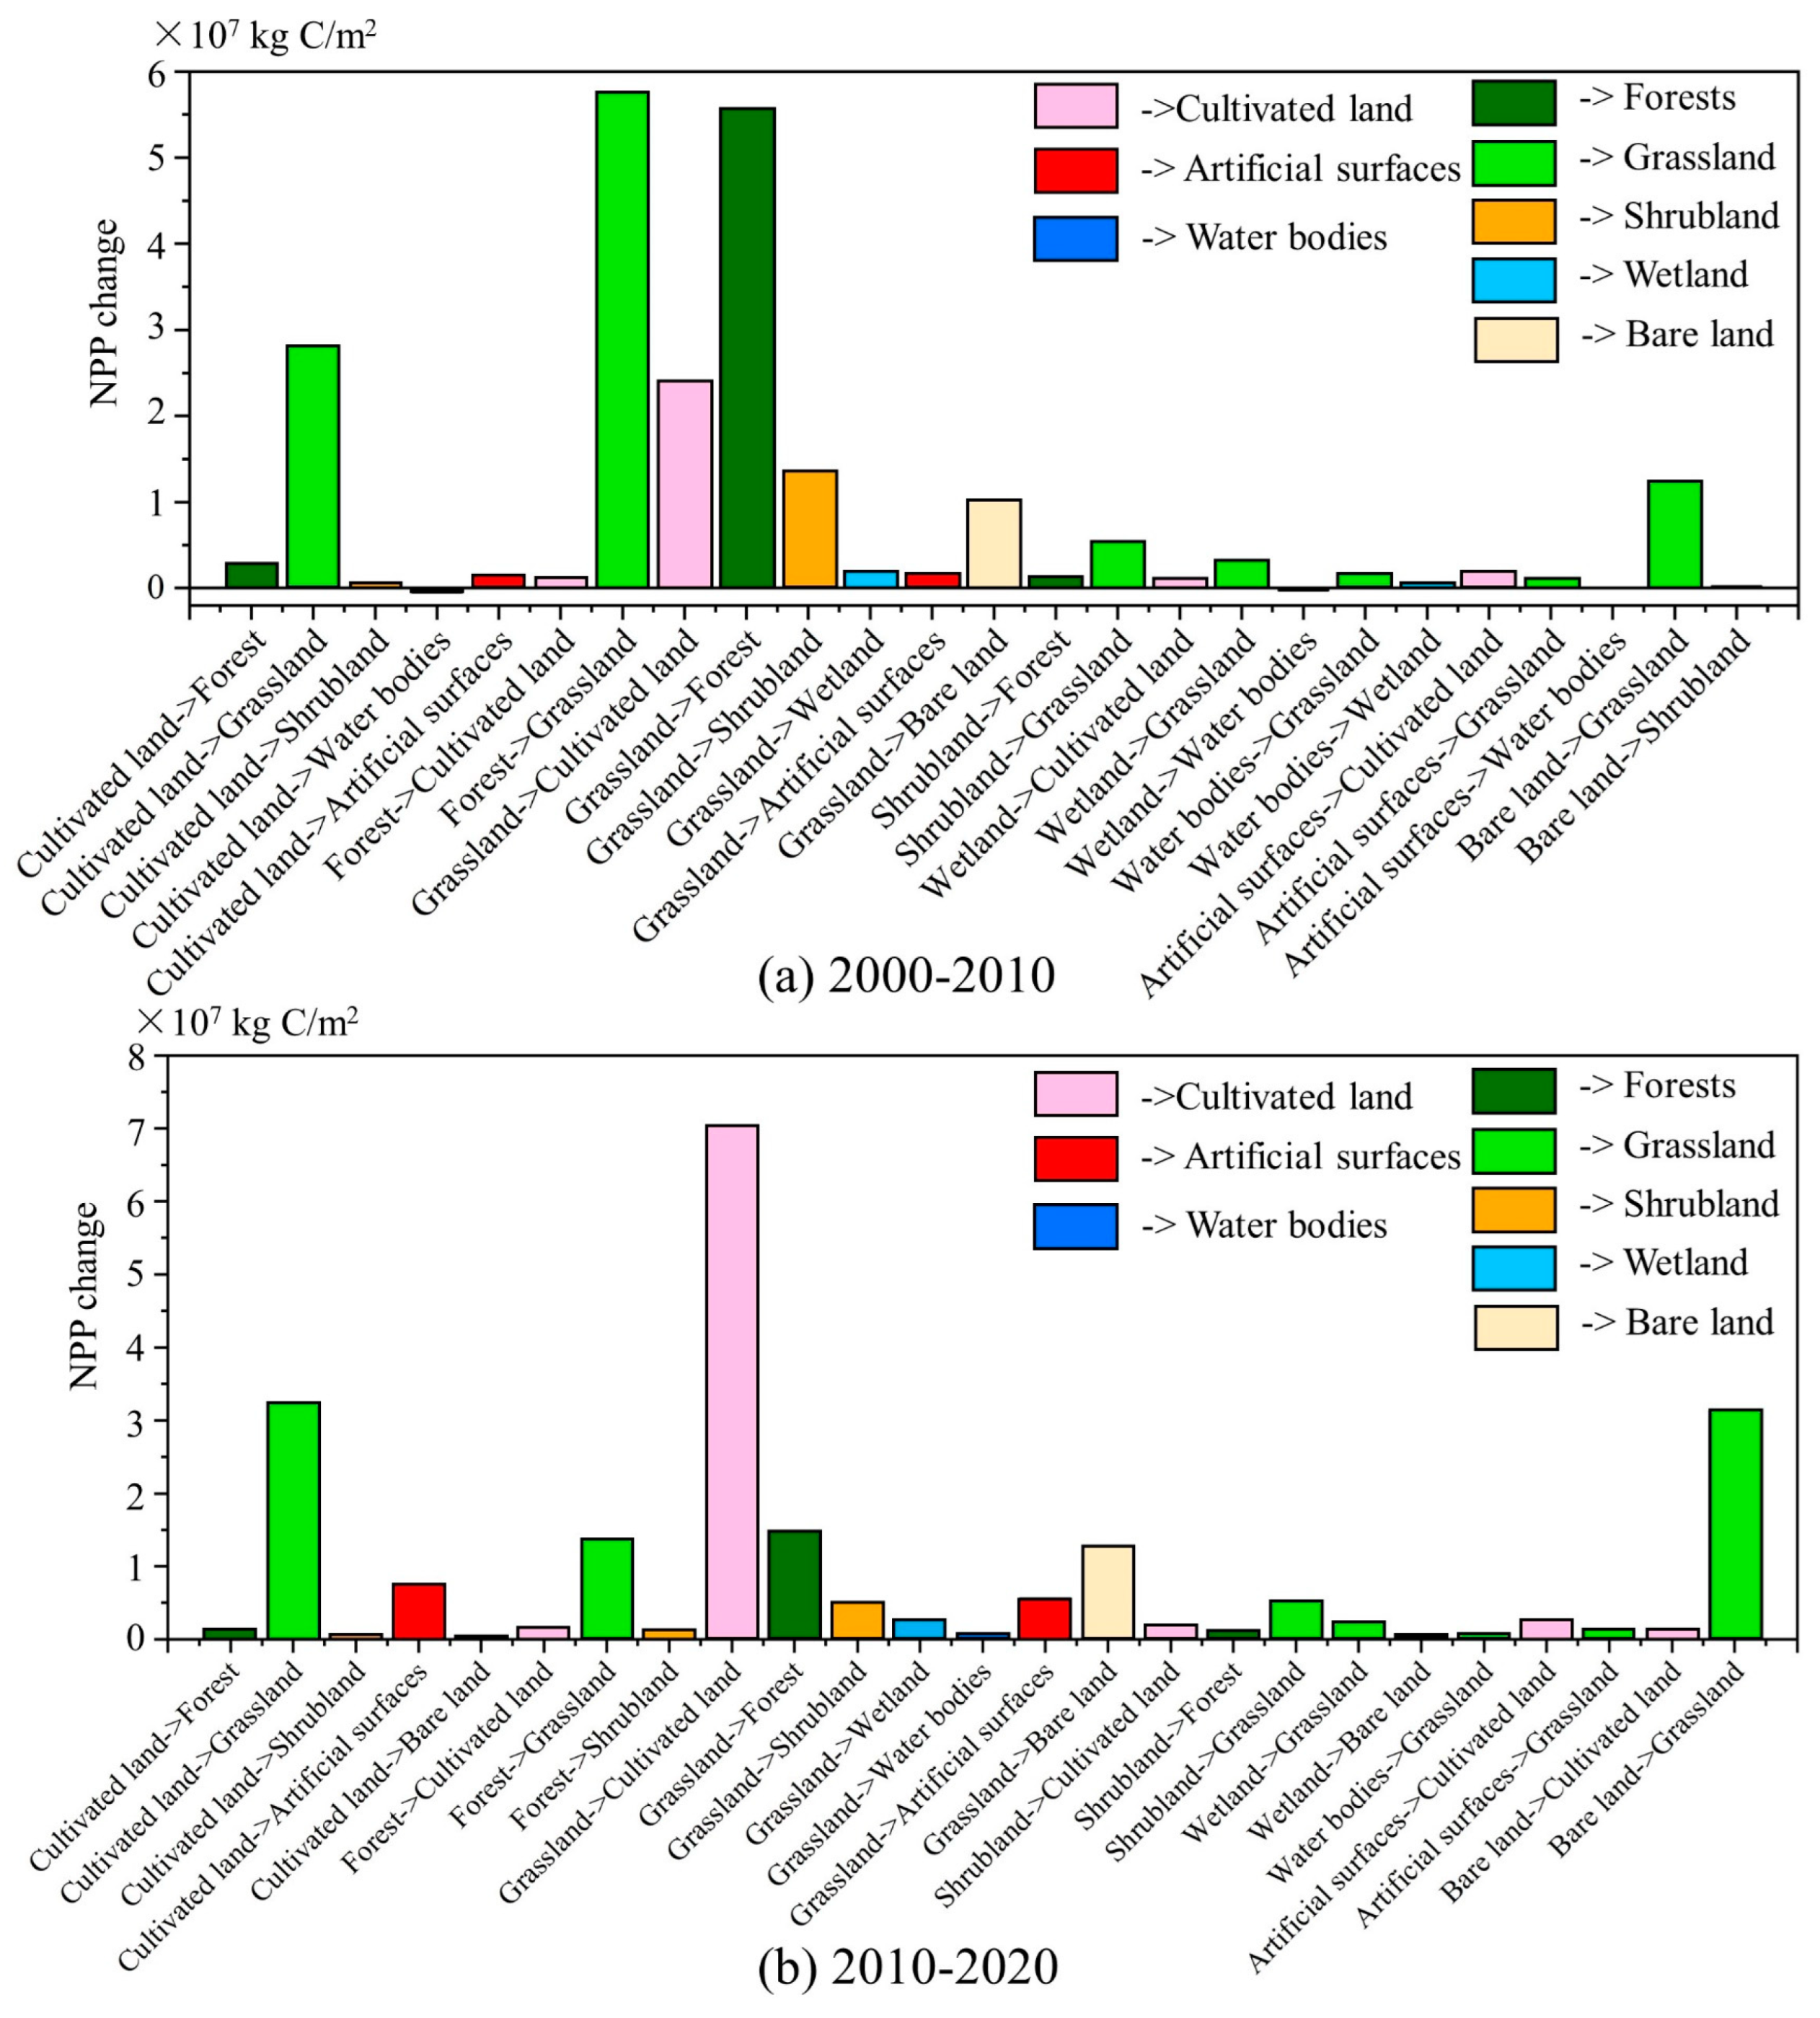
The changes in total NPP for land-cover change from 2000 to 2020 are shown in Table 6. The total NPP change is a better reflection of the increase or decrease in NPP due to land-cover change than the average NPP change. The NPP values in the land-cover-unchanged areas of Inner Mongolia from 2000 to 2020 all showed an increasing trend. As shown in Figure 10, between 2000 and 2010, the main cause of the decrease in NPP was the conversion of land-cover types to water bodies, where the conversion of cultivated land to water bodies led to a decrease in NPP of 534,539 kg C/m2, the conversion of wetlands to water bodies led to a decrease in NPP of 292,667 kg C/m2, and the conversion of artificial surfaces to water bodies led to a decrease in NPP of 32,119 kg C/m2. Excluding areas with a constant land-cover type, the main causes of the increase in NPP between 2000 and 2020 were the conversion of other land-cover types to cultivated land, forest, and grassland. Between 2000 and 2010, the change from other land-cover types to cultivated land resulted in an increase in NPP of 28,785,156 kg C/m2, and the conversion of grassland to cultivated land accounted for 83.03%. Other land-cover types converted to forest caused an increase in NPP of 60,048,533 kg C/m2, and the conversion of grassland to forest accounted for 92.42%. The transformation of other land-cover types to grassland resulted in an increase in NPP distribution of 108,968,184 kg C/m2; the conversion of forest to grassland accounted for 52.56%. The increase in NPP due to the conversion of grassland to cultivated land accounted for 89.52% of the increase in NPP due to the conversion of other land-cover types to cultivated land between 2010 and 2020. Grassland conversion to forest contributed to 85.89% of the increase in NPP due to the conversion of other land-cover types to forest.

4. Discussion

4.1. Analysis of This Study

Agreeing with the results of Li et al. (2018) [47], the main change that occurred in Inner Mongolia from 2000 to 2020 was the conversion of grassland, which was mainly due to the increase in sown pastures. The conversion of forest, cultivated land, and shrubland to grassland was the main reason for the decrease in carbon storage in Inner Mongolia’s vegetation between 2000 and 2010. This was followed by the conversion of cultivated land, forest, grassland, and shrubland to bare land. During 2010–2020, the conversion of cultivated land, forest, and shrubland to grassland and the conversion of cultivated land, grassland, forest, and shrubland to artificial surfaces were the main reasons for the reduction in vegetation carbon storage in Inner Mongolia [47,48]. Economic and population growth in Inner Mongolia are the main influences leading to increased urbanisation [49,50]. The increase in forest and shrubland due to the implementation and enactment of relevant ecological protection policies is the main reason to maintain positive vegetation carbon stocks in Inner Mongolia.
The correlation between the spatial distribution of land-cover types and the spatial distribution of NPP in this study illustrates the relatively high NPP of forests, cultivated land, wetland, and grassland, which is consistent with the findings of [20,51]. This is due to the fact that vegetation is one of the most important components of terrestrial ecosystems and plays an important role in global climate change processes and carbon balance, with the ability to indicate changes in the atmospheric, water, and soil components of the natural environment [52]. The conversion of cultivated land, wetland, and artificial surfaces to water bodies was the main reason for the decrease in NPP. Other land-cover types being converted to cultivated land, forest, and grassland are the main reasons for the increase in NPP. In addition, the mean values of NPP for each land-cover type exhibited an increasing trend from 2000 to 2020, which is related to the ecological protection policy in Inner Mongolia.

4.2. Recommendations of This Study

Combined with the above findings, the following measures can improve the carbon sequestration capacity of the vegetation in Inner Mongolia to a certain extent. Specifically, the continued implementation of desert management measures and instruments [49], such as the forest and grass ecological protection construction promoted by Alxa League, has contributed to the continuous increase in grassland area. Forests, shrublands, and other crops with high vegetation carbon storage density can be reasonably planted in Inner Mongolia, and existing crops with high vegetation carbon storage density can be protected [12,53]. On this basis, land-cover types with low vegetation carbon storage density, such as wetlands, croplands, and grasslands, should also be protected and managed accordingly [54].
The next most important recommendation for Inner Mongolia is to optimize thermal power and industrial restructuring strategies to respond positively to the slowdown and cessation of the construction of high-energy-consuming and high-polluting projects [55]. We recommend accelerating the implementation and popularisation of clean and renewable energy sources, reducing the total energy consumption in all sectors as far as possible, developing green and low-carbon industry codes, and strengthening the implementation in all sectors and localities [56,57,58].

4.3. Limitations of This Study

In this study, the NPP data were MODIS MOD17A3H 500 m resolution data. The GlobeLand30 data were 30 m resolution data. The difference in spatial resolution between the two datasets was large, and although the results obtained are generally consistent with other studies, there was insufficient spatial refinement for the NPP data and insufficient temporal scale for the GlobeLand30 data. Therefore, further studies need to further investigate relevant data with higher spatial resolutions and higher temporal resolutions to obtain finer results.
In addition, besides the effects of land-cover change, some studies have shown that the effects of natural factors such as climatic factors also respond to NPP [59,60]. However, this study did not consider the influence of climatic factors on NPP. Therefore, further studies need to consider the extent and proportion of the effect of land-cover change on NPP, as well as the extent and proportion of the effect of climatic factors on NPP [51].

5. Conclusions

This paper made use of GlobeLand30 land-cover data to analyse changes in vegetation carbon storage in Inner Mongolia as influenced by land-cover change from 2000 to 2020 and the relationship between land-cover change and NPP. Specific conclusions are presented below.
(1)
During the period of 2000–2020, the conversion of land cover in Inner Mongolia mainly occurred regarding other land-cover types into grassland, of which the conversion of bare land to grassland was 20,634.87 km2 from 2000 to 2010. A more pronounced conversion of grassland to shrubland also occurred from 2010 to 2020.
(2)
The high values of NPP were mainly concentrated in the northeastern regions of Inner Mongolia, e.g., Hulunbeier City, Xinggan League, and the border of Chifeng City and Xilingrad League, while the low values were mainly distributed in the southwestern regions of Inner Mongolia, e.g., Alxa League, Bayannur City, Wuhai City, and Ordos City.
(3)
The changes in total carbon storage in vegetation affected by land-cover change from 2000 to 2010 and 2010 to 2020 were 10,736,986.11 t and 3,894,272.41 t, respectively. Of these, the conversion of cultivated land, forest, and shrubland to grassland and the expansion of artificial surfaces were responsible for the decrease in vegetation carbon storage.
(4)
The spatial distribution of land-cover types was significantly correlated with the spatial distribution of NPP, and the mean values of NPP for land cover from 2000 to 2020 were in the following order: forest > cultivated land > wetland > grassland > artificial surfaces > shrubland > water bodies > bare land.
(5)
From 2000 to 2020, NPP in areas of Inner Mongolia where land cover did not change all exhibited an increasing trend. The change from land-cover types to water bodies was the main cause of the decrease in NPP. Without including areas with unchanged land-cover types, the main reason for the increase in NPP between 2000 and 2020 was due to other land-cover types converting to cultivated land, forests, and grassland.
(6)
Improving the carbon sequestration capacity of Inner Mongolia’s vegetation can achieve the double-carbon target as soon as possible and protect Inner Mongolia’s ecological environment. For example, the implementation of appropriate conservation policies (e.g., forest and grass ecological protection construction), the rational planting of high vegetation carbon storage plants, the protection of land-cover types with low vegetation carbon storage, etc.
This study provides a more comprehensive analysis of vegetation carbon storage influenced by land-cover change and the potential relationship between land-cover change and NPP in Inner Mongolia, which can provide some referential basis for local governments to coordinate land spatial planning.

Author Contributions

Conceptualization, L.Z. and M.S.; methodology, L.Z. and D.F.; software, L.Z., K.T. and W.S.; writing—original draft preparation, L.Z.; writing—review and editing, M.S., D.F., K.T. and W.S. All authors have read and agreed to the published version of the manuscript.

Funding

This study was funded by the Ordos City Landmark Team Project (2022).

Institutional Review Board Statement

Not applicable, this study does not involve humans or animals.

Informed Consent Statement

Not applicable, this study does not involve humans or animals.

Data Availability Statement

Not applicable.

Acknowledgments

The authors would like to thank the editors and the anonymous reviewers for their constructive comments and suggestions, which greatly helped improve the quality of the manuscript.

Conflicts of Interest

The authors declare no conflict of interest.

References

  1. Wang, X.; Wang, R.; Yu, Q.; Liu, H.; Liu, W.; Ma, J.; Niu, T.; Yang, L. Study on the Structural Properties of an Ecospatial Network in Inner Mongolia and Its Relationship with NPP. Appl. Sci. 2022, 12, 4872. [Google Scholar] [CrossRef]
  2. Pan, Y.; Birdsey, R.A.; Fang, J.; Houghton, R.; Pekka, E.; Kurz, W.A.; Phillips, O.L.; Shvidenko, A.; Simon, L.; Canadell, J.G.; et al. A large and persistent carbon sink in the world’s forests to cite this version: HAL Id: Cea-00819253 A Large and Persistent Carbon Sink in the World’s Forests. Science 2011, 333, 988–993. [Google Scholar] [CrossRef] [Green Version]
  3. Roux, N.; Kastner, T.; Erb, K.H.; Haberl, H. Does agricultural trade reduce pressure on land ecosystems? Decomposing drivers of the embodied human appropriation of net primary production. Ecol. Econ. 2021, 181, 106915. [Google Scholar] [CrossRef]
  4. Arif, M.; Shahzad, M.K.; Elzaki, E.E.A.; Hussain, A.; Zhang, B.; Yukun, C. Biomass and carbon stocks estimation in Chichawatni irrigated plantation in Pakistan. Int. J. Agric. Biol. 2017, 19, 1339–1349. [Google Scholar] [CrossRef]
  5. Zhang, J.; Zhang, C.; Zhang, A.; Fang, M.; Wu, M.; Lin, Z.; Zhang, Y.; Song, X. Relative effects of hydrothermal fluctuation and land cover changes on vegetation net primary productivity in Northeast China. Acta Oceanol. Sin. 2020, 40, 7733–7744. [Google Scholar]
  6. Fang, J.; Yu, G.; Liu, L.; Hu, S.; Stuart Chapin, F. Climate change, human impacts, and carbon sequestration in China. Proc. Natl. Acad. Sci. USA 2018, 115, 4015–4020. [Google Scholar] [CrossRef] [Green Version]
  7. Zhu, E.; Deng, J.; Zhou, M.; Gan, M.; Jiang, R.; Wang, K.; Shahtahmassebi, A.R. Carbon emissions induced by land-use and land-cover change from 1970 to 2010 in Zhejiang, China. Sci. Total Environ. 2019, 646, 930–939. [Google Scholar] [CrossRef]
  8. Sha, Z.; Bai, Y.; Lan, H.; Liu, X.; Li, R.; Xie, Y. Can more carbon be captured by grasslands? A case study of Inner Mongolia, China. Sci. Total Environ. 2020, 723, 138085. [Google Scholar] [CrossRef] [PubMed]
  9. Massetti, A.; Gil, A. Mapping and assessing land cover/land use and aboveground carbon stocks rapid changes in small oceanic islands’ terrestrial ecosystems: A case study of Madeira Island, Portugal (2009–2011). Remote Sens. Environ. 2020, 239, 111625. [Google Scholar] [CrossRef]
  10. DeFries, R.S.; Field, C.B.; Fung, I.; Collatz, G.J.; Bounoua, L. Combining satellite data and biogeochemical models to estimate global effects of human-induced land cover change on carbon emissions and primary productivity. Glob. Biogeochem. Cycles 1999, 13, 803–815. [Google Scholar] [CrossRef]
  11. Achard, F.; Eva, H.D.; Mayaux, P.; Stibig, H.J.; Belward, A. Improved estimates of net carbon emissions from land cover change in the tropics for the 1990s. Glob. Biogeochem. Cycles 2004, 18, 1–12. [Google Scholar] [CrossRef]
  12. Houghton, R.A.; House, J.I.; Pongratz, J.; Van Der Werf, G.R.; Defries, R.S.; Hansen, M.C.; Le Quéré, C.; Ramankutty, N. Carbon emissions from land use and land-cover change. Biogeosciences 2012, 9, 5125–5142. [Google Scholar] [CrossRef] [Green Version]
  13. Yang, H.; Mu, S.; Li, J. Effects of ecological restoration projects on land use and land cover change and its influences on territorial NPP in Xinjiang, China. Catena 2014, 115, 85–95. [Google Scholar] [CrossRef]
  14. Lai, L.; Huang, X.; Yang, H.; Chuai, X.; Zhang, M.; Zhong, T.; Chen, Z.; Chen, Y.; Wang, X.; Thompson, J.R. Carbon emissions from land-use change and management in China between 1990 and 2010. Sci. Adv. 2016, 2, e1601063. [Google Scholar] [CrossRef] [PubMed] [Green Version]
  15. Li, W.; Ciais, P.; Peng, S.; Yue, C.; Wang, Y.; Thurner, M.; Saatchi, S.S.; Arneth, A.; Avitabile, V.; Carvalhais, N.; et al. Land-use and land-cover change carbon emissions between 1901 and 2012 constrained by biomass observations. Biogeosciences 2017, 14, 5053–5067. [Google Scholar] [CrossRef] [Green Version]
  16. Peng, D.; Zhang, B.; Wu, C.; Huete, A.R.; Gonsamo, A.; Lei, L.; Ponce-campos, G.E.; Liu, X.; Wu, Y. Country-level net primary production distribution and response to drought and land cover change. Sci. Total Environ. 2017, 574, 65–77. [Google Scholar] [CrossRef]
  17. Chuai, X.; Yuan, Y.; Zhang, X.; Guo, X.; Zhang, X.; Xie, F.; Zhao, R.; Li, J. Multiangle land use-linked carbon balance examination in Nanjing City, China. Land Use Policy 2019, 84, 305–315. [Google Scholar] [CrossRef]
  18. Wu, Y.; Tao, Y.; Yang, G.; Ou, W.; Pueppke, S.; Sun, X.; Chen, G.; Tao, Q. Impact of land use change on multiple ecosystem services in the rapidly urbanizing Kunshan City of China: Past trajectories and future projections. Land use policy 2019, 85, 419–427. [Google Scholar] [CrossRef]
  19. Yang, H.; Huang, J.; Liu, D. Linking climate change and socioeconomic development to urban land use simulation: Analysis of their concurrent effects on carbon storage. Appl. Geogr. 2020, 115, 102135. [Google Scholar] [CrossRef]
  20. Hao, L.; Wang, S.; Cui, X.; Zhai, Y. Spatiotemporal dynamics of vegetation net primary productivity and its response to climate change in inner mongolia from 2002 to 2019. Sustainability 2021, 13, 13310. [Google Scholar] [CrossRef]
  21. Liu, P.; Liu, L.; Xu, X.; Zhao, Y.; Niu, J.; Zhang, Q. Carbon footprint and carbon emission intensity of grassland wind farms in Inner Mongolia. J. Clean. Prod. 2021, 313, 127878. [Google Scholar] [CrossRef]
  22. Dang, H.; Yi, X.; Zhang, Z.; Zhang, H.; Lin, J.; Zhang, W.; Zhai, S.; Zhang, J.; Bai, T.; Zhang, X.; et al. The level, distribution and source of artificial radionuclides in surface soil from Inner Mongolia, China. J. Environ. Radioact. 2021, 233, 106614. [Google Scholar] [CrossRef] [PubMed]
  23. Zhang, Q.; Buyantuev, A.; Fang, X.; Han, P.; Li, A.; Li, F.Y.; Liang, C.; Liu, Q.; Ma, Q.; Niu, J.; et al. Ecology and sustainability of the Inner Mongolian Grassland: Looking back and moving forward. Landsc. Ecol. 2020, 35, 2413–2432. [Google Scholar] [CrossRef]
  24. Dai, E.; Huang, Y.; Wu, Z.; Zhao, D. Analysis of spatio-temporal features of a carbon source/sink and its relationship to climatic factors in the Inner Mongolia grassland ecosystem. J. Geogr. Sci. 2016, 26, 297–312. [Google Scholar] [CrossRef] [Green Version]
  25. Zhou, W.; Yang, H.; Zhou, L.; Chen, Y.; Huang, L.; Ju, W. Dynamics of grassland carbon sequestration and its coupling relation with hydrothermal factor of Inner Mongolia. Ecol. Indic. 2018, 95, 1–11. [Google Scholar] [CrossRef]
  26. Chen, J.M.; Ju, W.; Ciais, P.; Viovy, N.; Liu, R.; Liu, Y.; Lu, X. Vegetation structural change since 1981 significantly enhanced the terrestrial carbon sink. Nat. Commun. 2019, 10, 4–10. [Google Scholar] [CrossRef] [Green Version]
  27. Li, H.; Li, H.; Wang, J.; Hao, X. Monitoring high-altitude river ice distribution at the basin scale in the northeastern Tibetan Plateau from a Landsat time-series spanning 1999–2018. Remote Sens. Environ. 2020, 247, 111915. [Google Scholar] [CrossRef]
  28. Li, X.; Ling, F.; Foody, G.M.; Boyd, D.S.; Jiang, L.; Zhang, Y.; Zhou, P.; Wang, Y.; Chen, R.; Du, Y. Monitoring high spatiotemporal water dynamics by fusing MODIS, Landsat, water occurrence data and DEM. Remote Sens. Environ. 2021, 265, 112680. [Google Scholar] [CrossRef]
  29. Meng, Y.; Wong, M.S.; Xing, H.; Kwan, M.P.; Zhu, R. Yearly and daily relationship assessment between air pollution and early-stage COVID-19 incidence: Evidence from 231 countries and regions. ISPRS Int. J. Geo-Inf. 2021, 10, 401. [Google Scholar] [CrossRef]
  30. Hu, Q.; Xiang, M.; Chen, D.; Zhou, J.; Wu, W.; Song, Q. Global cropland intensification surpassed expansion between 2000 and 2010: A spatio-temporal analysis based on GlobeLand30. Sci. Total Environ. 2020, 746, 141035. [Google Scholar] [CrossRef]
  31. Shafizadeh-Moghadam, H.; Minaei, M.; Feng, Y.; Pontius, R.G. GlobeLand30 maps show four times larger gross than net land change from 2000 to 2010 in Asia. Int. J. Appl. Earth Obs. Geoinf. 2019, 78, 240–248. [Google Scholar] [CrossRef]
  32. Chen, J.; Cao, X.; Peng, S.; Ren, H. Analysis and applications of GlobeLand30: A review. ISPRS Int. J. Geo-Inf. 2017, 6, 230. [Google Scholar] [CrossRef] [Green Version]
  33. Brovelli, M.A.; Molinari, M.E.; Hussein, E.; Chen, J.; Li, R. The first comprehensive accuracy assessment of globel and 30 at a national level: Methodology and results. Remote Sens. 2015, 7, 4191–4212. [Google Scholar] [CrossRef] [Green Version]
  34. Arvor, D.; Betbeder, J.; Daher, F.R.G.; Blossier, T.; Le Roux, R.; Corgne, S.; Corpetti, T.; de Freitas Silgueiro, V.; da Silva Junior, C.A. Towards user-adaptive remote sensing: Knowledge-driven automatic classification of Sentinel-2 time series. Remote Sens. Environ. 2021, 264, 112615. [Google Scholar] [CrossRef]
  35. Teluguntla, P.; Thenkabail, P.; Oliphant, A.; Xiong, J.; Gumma, M.K.; Congalton, R.G.; Yadav, K.; Huete, A. A 30-m landsat-derived cropland extent product of Australia and China using random forest machine learning algorithm on Google Earth Engine cloud computing platform. ISPRS J. Photogramm. Remote Sens. 2018, 144, 325–340. [Google Scholar] [CrossRef]
  36. Guo, Y.; Xia, H.; Pan, L.; Zhao, X.; Li, R. Mapping the Northern Limit of Double Cropping Using a Phenology-Based Algorithm and Google Earth Engine. Remote Sens. 2022, 14, 1004. [Google Scholar] [CrossRef]
  37. Zhu, L.; Xing, H.; Hou, D. Analysis of carbon emissions from land cover change during 2000 to 2020 in Shandong Province, China. Sci. Rep. 2022, 12, 8021. [Google Scholar] [CrossRef]
  38. Hu, Y.; Batunacun; Zhen, L.; Zhuang, D. Assessment of Land-Use and Land-Cover Change in Guangxi, China. Sci. Rep. 2019, 9, 2189. [Google Scholar] [CrossRef] [Green Version]
  39. Pei, J.; Niu, Z.; Wang, L.; Song, X.P.; Huang, N.; Geng, J.; Wu, Y.B.; Jiang, H.H. Spatial-temporal dynamics of carbon emissions and carbon sinks in economically developed areas of China: A case study of Guangdong Province. Sci. Rep. 2018, 8, 13383. [Google Scholar] [CrossRef] [Green Version]
  40. Muñoz-Rojas, M.; De la Rosa, D.; Zavala, L.M.; Jordán, A.; Anaya-Romero, M. Changes in land cover and vegetation carbon stocks in Andalusia, Southern Spain (1956–2007). Sci. Total Environ. 2011, 409, 2796–2806. [Google Scholar] [CrossRef]
  41. Xu, J.; Tang, Y.; Xu, J.; Chen, J.; Bai, K.; Shu, S.; Yu, B.; Wu, J.; Huang, Y. Evaluation of Vegetation Indexes and Green-Up Date Extraction Methods on the Tibetan Plateau. Remote Sens. 2022, 14, 3160. [Google Scholar] [CrossRef]
  42. Xing, H.; Zhu, L.; Chen, B.; Niu, J.; Li, X.; Feng, Y.; Fang, W. Spatial and temporal changes analysis of air quality before and after the COVID-19 in Shandong Province, China. Earth Sci. Inform. 2022, 15, 863–876. [Google Scholar] [CrossRef]
  43. Zhu, L.; Xing, H.; Hou, D.; Feng, Y.; Yang, F.; Qiu, P. A Long-Term Analysis of Spatiotemporal Change and Driving Factors on Poyang Lake during 1987–2019. Polish J. Environ. Stud. 2021, 30, 4389–4399. [Google Scholar] [CrossRef]
  44. Shi, Y.; Shi, Y. Spatio-temporal variation characteristics and driving forces of farmland shrinkage in four metropolises in East Asia. Sustainability 2020, 12, 754. [Google Scholar] [CrossRef] [Green Version]
  45. Jiang, M.; Tian, S.; Zheng, Z.; Zhan, Q.; He, Y. Human activity influences on vegetation cover changes in Beijing, China, from 2000 to 2015. Remote Sens. 2017, 9, 271. [Google Scholar] [CrossRef] [Green Version]
  46. Qiu, L.; Zhu, J.; Wang, K.; Hu, W. Land use changes induced county-scale carbon consequences in southeast China 1979–2020, evidence from Fuyang, Zhejiang province. Sustainability 2016, 8, 38. [Google Scholar] [CrossRef] [Green Version]
  47. Li, J.; Wang, Z.; Lai, C.; Wu, X.; Zeng, Z.; Chen, X.; Lian, Y. Response of net primary production to land use and land cover change in mainland China since the late 1980s. Sci. Total Environ. 2018, 639, 237–247. [Google Scholar] [CrossRef]
  48. Li, Q.; Zhang, X.; Liu, Q.; Liu, Y.; Ding, Y.; Zhang, Q. Impact of land use intensity on ecosystem services: An example from the agro-pastoral ecotone of central Inner Mongolia. Sustainability 2017, 9, 1030. [Google Scholar] [CrossRef] [Green Version]
  49. Wang, Z.; Deng, X.; Song, W.; Li, Z.; Chen, J. What is the main cause of grassland degradation? A case study of grassland ecosystem service in the middle-south Inner Mongolia. Catena 2017, 150, 100–107. [Google Scholar] [CrossRef]
  50. Wang, Z.; Zhong, J.; Lan, H.; Wang, Z.; Sha, Z. Association analysis between spatiotemporal variation of net primary productivity and its driving factors in inner mongolia, china during 1994–2013. Ecol. Indic. 2019, 105, 355–364. [Google Scholar] [CrossRef]
  51. Li, H.; Ding, J.; Zhang, J.; Yang, Z.; Yang, B.; Zhu, Q.; Peng, C. Effects of land cover changes on net primary productivity in the terrestrial ecosystems of China from 2001 to 2012. Land 2020, 9, 480. [Google Scholar] [CrossRef]
  52. Yang, L.; Jia, K.; Liang, S.; Liu, M.; Wei, X.; Yao, Y.; Zhang, X.; Liu, D. Spatio-temporal analysis and uncertainty of fractional vegetation cover change over Northern China during 2001–2012 based on multiple vegetation data sets. Remote Sens. 2018, 10, 549. [Google Scholar] [CrossRef] [Green Version]
  53. Zheng, Z.; Zeng, Y.; Schneider, F.D.; Zhao, Y.; Zhao, D.; Schmid, B.; Schaepman, M.E.; Morsdorf, F. Mapping functional diversity using individual tree-based morphological and physiological traits in a subtropical forest. Remote Sens. Environ. 2021, 252, 112170. [Google Scholar] [CrossRef]
  54. Tan, J.; Yu, D.; Li, Q.; Tan, X.; Zhou, W. Spatial relationship between land-use/land-cover change and land surface temperature in the Dongting Lake area, China. Sci. Rep. 2020, 10, 9245. [Google Scholar] [CrossRef]
  55. Tian, X.; Bai, F.; Jia, J.; Liu, Y.; Shi, F. Realizing low-carbon development in a developing and industrializing region: Impacts of industrial structure change on CO2 emissions in southwest China. J. Environ. Manag. 2019, 233, 728–738. [Google Scholar] [CrossRef]
  56. Ma, M.; Ma, X.; Cai, W.; Cai, W. Low carbon roadmap of residential building sector in China: Historical mitigation and prospective peak. Appl. Energy 2020, 273, 115247. [Google Scholar] [CrossRef]
  57. Chen, Z.; Hao, X.; Zhang, X.; Chen, F. Have traffic restrictions improved air quality? A shock from COVID-19. J. Clean. Prod. 2021, 279, 123622. [Google Scholar] [CrossRef]
  58. Yang, D.; Liu, B.; Ma, W.; Guo, Q.; Li, F.; Yang, D. Sectoral energy-carbon nexus and low-carbon policy alternatives: A case study of Ningbo, China. J. Clean. Prod. 2017, 156, 480–490. [Google Scholar] [CrossRef]
  59. Liu, H.; Zhang, A.; Liu, C.; Zhao, Y.; Zhao, A.; Wang, D. Analysis of the time-lag effects of climate factors on grassland productivity in Inner Mongolia. Glob. Ecol. Conserv. 2021, 30, e01751. [Google Scholar] [CrossRef]
  60. Guo, D.; Song, X.; Hu, R.; Cai, S.; Zhu, X.; Hao, Y. Grassland type-dependent spatiotemporal characteristics of productivity in Inner Mongolia and its response to climate factors. Sci. Total Environ. 2021, 775, 145644. [Google Scholar] [CrossRef]
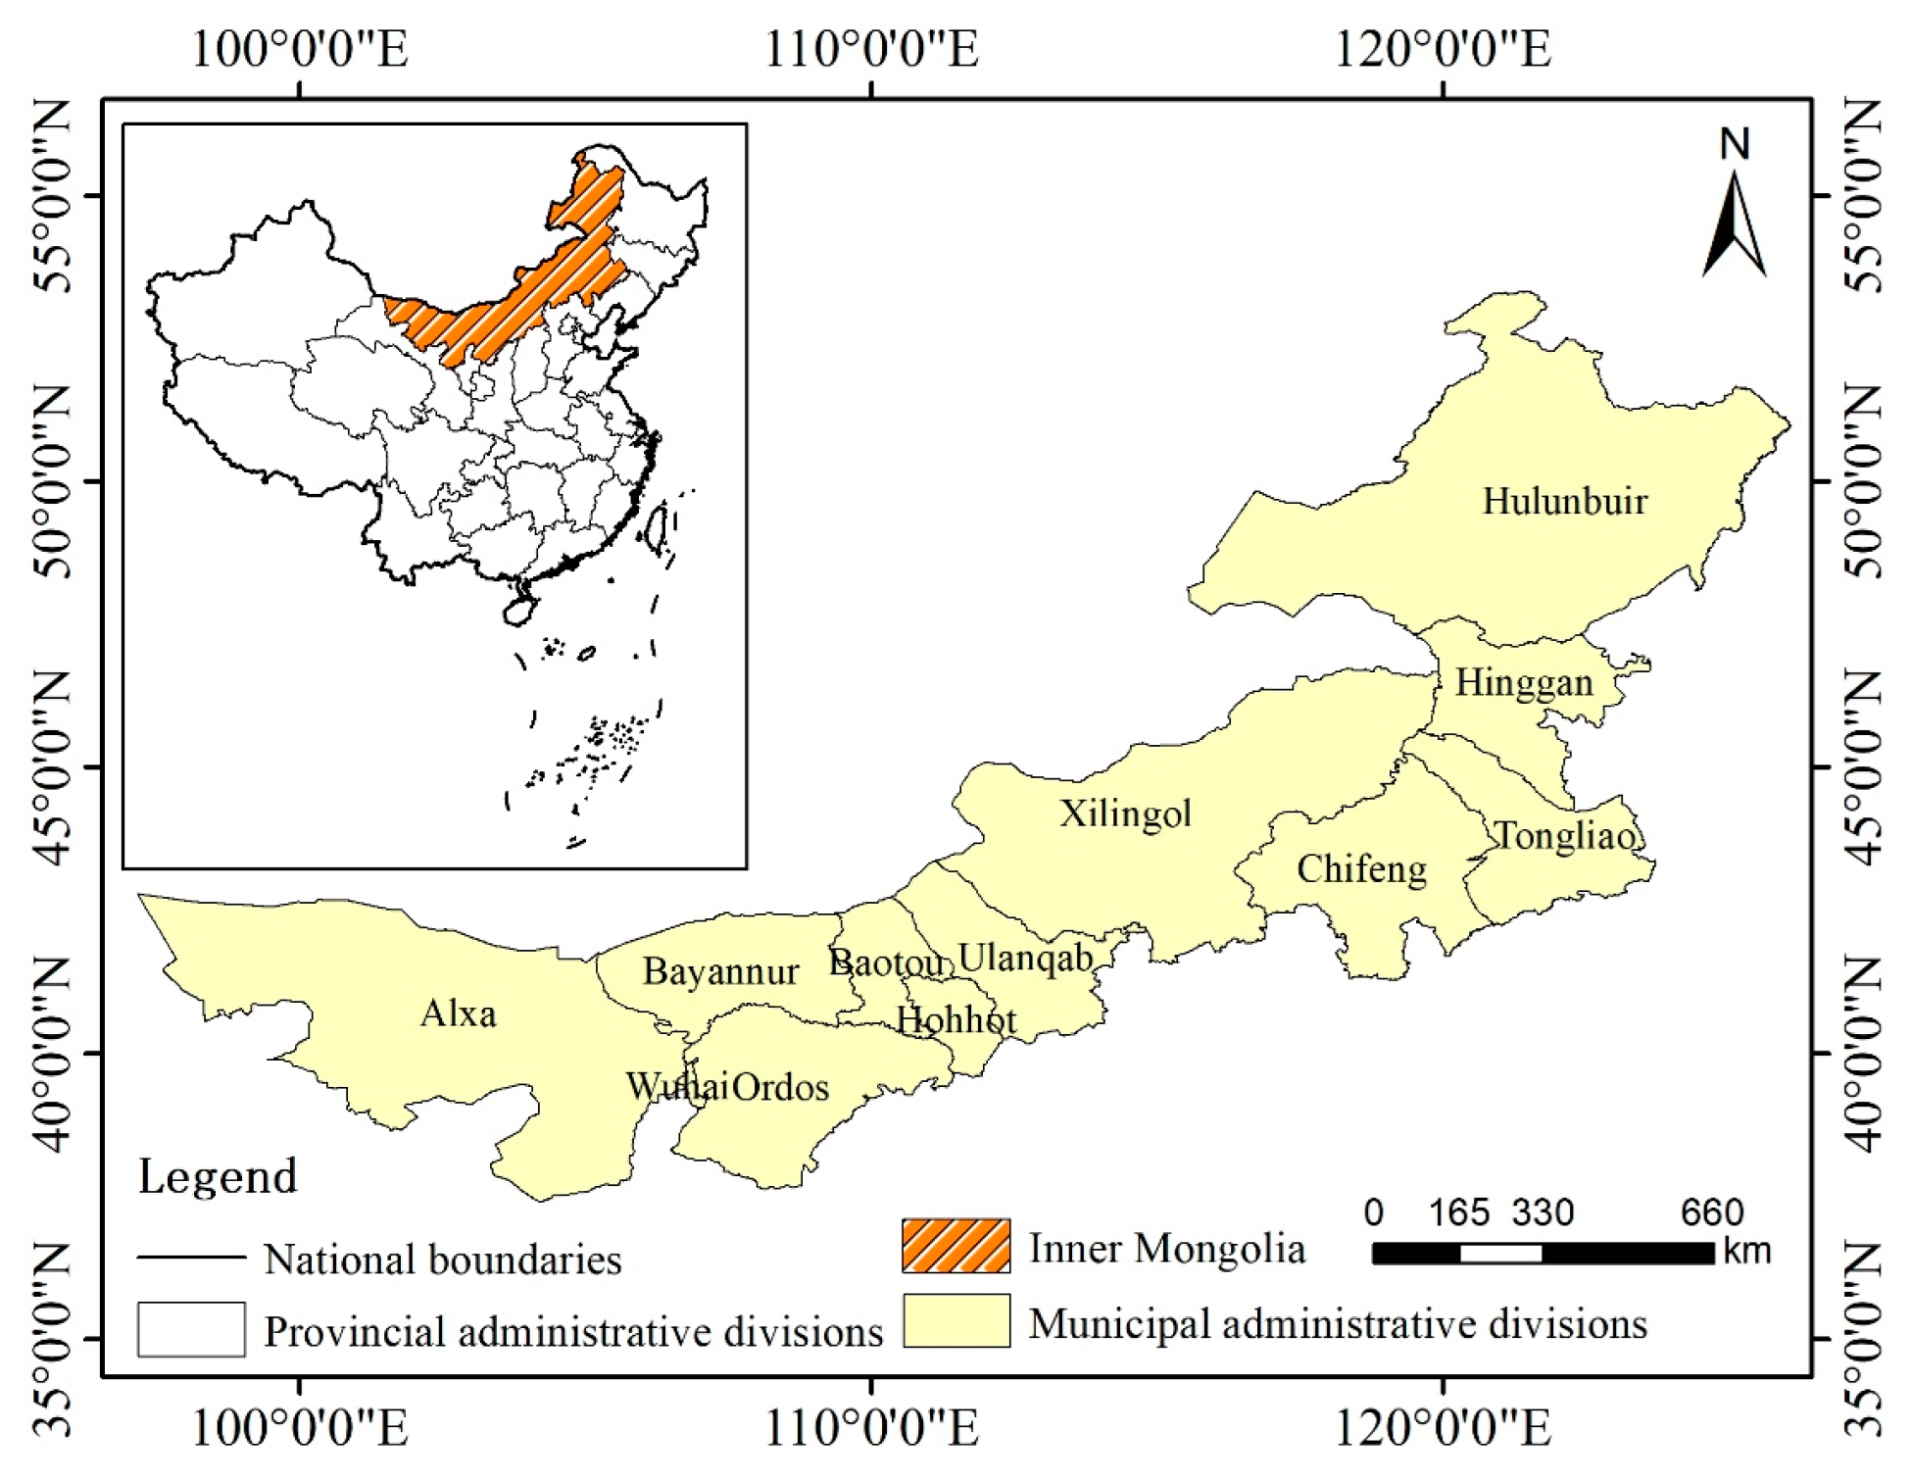
Figure 1. Location of Inner Mongolia.
Sustainability 15 04735 g001
Figure 2. Flowchart of this study.
Sustainability 15 04735 g002
Figure 3. Spatial distribution of land-cover in Inner Mongolia, 2000–2020.
Sustainability 15 04735 g003
Figure 4. Amount of land-cover change in Inner Mongolia, 2000–2020.
Sustainability 15 04735 g004
Figure 5. Land-cover change in Inner Mongolia, 2000–2020.
Sustainability 15 04735 g005
Figure 6. Spatial distribution of annual NPP data in Inner Mongolia.
Sustainability 15 04735 g006
Figure 7. Change in annual NPP data for Inner Mongolia.
Sustainability 15 04735 g007
Figure 8. Spatial distribution of vegetation carbon storage changes in Inner Mongolia.
Sustainability 15 04735 g008
Figure 9. Impact of land-cover on NPP from 2000 to 2020.
Sustainability 15 04735 g009
Figure 10. Impact of land-cover changes on NPP changes from 2000 to 2020.
Sustainability 15 04735 g010
Table 1. Land-cover change in Inner Mongolia, 2000–2020.
2000201020202000–20102010–2020
Area/km2Proportion/%Area/km2Proportion/%Area/km2Proportion/%Amount of Change/km2Rate of Change/%Amount of Change/km2Rate of Change/%
Cultivated land143,241.5512.36138,056.0011.92153,277.7113.23−5185.56−3.6215,221.7111.03
Forest132,292.7511.42132,616.9011.45133,672.8511.54324.150.251055.950.80
Grassland534,473.8046.13549,358.4547.42539,560.6446.5714,884.642.78−9797.81−1.78
Shrubland5790.570.59560.180.828860.760.763769.6165.10−699.42−7.32
Wetland7678.730.665969.670.515747.860.50−1709.06−22.26−221.81−3.72
Water bodies6566.030.575369.560.466121.380.53−1196.47−18.22751.8214.00
Artificial surfaces7609.680.668908.310.7714,914.241.291298.6317.076005.9367.42
Bare land320,912.3627.7308,726.4226.65296,410.0525.58−12,185.94−3.80−12,316.37−3.99
Table 2. Land-cover transfer matrix for 2000–2020.
Area/km2Cultivated LandForestGrasslandShrublandWetlandWater BodiesArtificial SurfacesBare LandTotal 2010
Cultivated land129,877.15276.696548.1545.77378.77302.54529.8797.05138,055.99
Forest734.85117,518.5313,733.21377.98120.50117.7912.201.83132,616.90
Grassland11,003.9614,326.38496,955.993066.671825.681140.21404.6820,634.87549,358.44
Shrubland164.33109.006907.411979.5376.3231.797.07284.729560.18
Wetland92.2417.44586.746.034544.21661.806.3054.905969.67
Water bodies224.8335.55416.996.52452.783967.388.94256.565369.56
Artificial surfaces1036.066.121135.365.8311.5911.286608.2993.788908.31
Bare land108.133.048189.95302.23268.87333.2332.33299,488.63308,726.42
Total 2000143,241.55132,292.75534,473.805790.577678.736566.037609.68320,912.361,158,565.47
Area /km2Cultivated LandForestGrasslandShrublandWetlandWater BodiesArtificial SurfacesBare LandTotal 2020
Cultivated land122,910.99 664.64 26,585.36 527.99 226.19 252.16 1078.72 1031.66 153,277.71
Forest492.21 120,958.79 11,843.62 292.67 6.10 61.65 15.59 2.22 133,672.85
Grassland10,551.24 10,456.65 490,985.41 2538.29 1282.79 404.28 434.60 22,907.37 539,560.63
Shrubland118.38 302.67 2518.19 5709.26 4.65 5.10 22.19 180.33 8860.76
Wetland93.91 23.80 1644.15 26.62 3534.89 297.28 1.94 125.27 5747.86
Water bodies338.93 91.44 778.65 27.80 505.39 3998.32 12.69 368.17 6121.38
Artificial surfaces3352.07 96.84 3532.10 139.78 63.37 19.13 7316.09 394.85 14,914.24
Bare land198.27 22.08 11,470.95 297.78 346.29 331.64 26.49 283,716.55 296,410.05
Total 2010138,056.00 132,616.90 549,358.45 9560.18 5969.67 5369.56 8908.31 308,726.42 1,158,565.48
Table 3. Carbon density of vegetation in different land-cover types.
Land-Cover TypeVegetation Carbon Density (t C/ha)
XXminXmax
Cultivated land3.251.295.70
Forest28.1112.0650.18
Grassland1.240.002.30
Shrubland28.1112.0650.18
Wetland0.670.001.80
Water bodies---
Artificial surfaces---
Bare land0.670.001.80
Table 4. Carbon storage change transfer matrix, 2000–2020.
Carbon Storage/tCultivated LandForestGrasslandShrublandWetlandWater BodiesArtificial SurfacesBare LandTotal 2010
Cultivated land0.00−687,848.361,316,177.21−113,787.4597,723.9298,324.75172,208.2125,039.98907,838.26
Forest1,826,843.810.0036,901,146.820.00330,649.80331,110.7834,300.385033.0439,429,084.65
Grassland−2,211,796.64−38,494,983.060.00−8,240,144.44104,063.85141,386.0450,180.381,176,187.68−47,475,106.20
Shrubland408531.340.0018560220.340.00209429.4989,368.7219,864.77781,267.8420,068,682.50
Wetland−23,797.71−47,865.79−33,444.06−16,548.790.0044,340.76422.100.00−76,893.49
Water bodies−73,069.43−99,925.99−51,707.18−18,336.72−30,336.090.000.00−17,189.84−290,565.24
Artificial surfaces−336,718.40−17,210.91−140,784.74−16,386.16−776.300.000.00−6283.20−518,159.71
Bare land−27,898.60−8337.37−466,827.33−829,323.780.0022,326.502165.920.00−1,307,894.67
Total 2000−437,905.62−39,356,171.4756,084,781.06−9,234,527.34710,754.68726,857.55279,141.761,964,055.5010,736,986.11
Carbon Storage/tCultivated LandForestGrasslandShrublandWetlandWater BodiesArtificial SurfacesBare LandTotal 2020
Cultivated land0.00−1,652,293.055,343,656.84−1,312,595.3258,357.6781,953.24350,583.19266,167.613,135,830.16
Forest1,223,636.300.0031,823,814.730.0016,731.54173,290.5643,825.466097.4433,287,396.03
Grassland−2,120,799.06−28,097,011.300.00−6,820,372.6073,119.2850,131.0553,890.861,305,720.18−35,555,321.59
Shrubland294,285.220.006,766,388.890.0012,753.0114,331.8862,382.27494,816.467,644,957.75
Wetland−24,229.61−65,303.63−93,716.79−73,048.300.0019,917.51129.890.00−236,250.93
Water bodies−110,152.28−257,025.19−96,553.20−78,133.43−33,860.800.000.00−24,667.46−600,392.37
Artificial surfaces−1,089,421.81−272,222.30−437,980.56−392,926.36−4245.900.000.00−26,455.00−2,223,251.93
Bare land−51,153.89−60,584.23−653,844.20−817,106.670.0022,219.771774.510.00−1,558,694.72
Total 2010−1,877,835.13−30,404,439.7042,651,765.71−9,494,182.68122,854.79361,844.01512,586.172,021,679.233,894,272.41
Table 5. Spatial correlation analysis of NPP and land-cover.
YearPearson Correlation CoefficientpSig
2000−0.75p < 0.050.000
2010−0.77p < 0.050.000
2020−0.80p < 0.050.000
Table 6. Change values of total NPP for land-cover change in Inner Mongolia, 2000–2020.
kg C/m2Cultivated LandForestGrasslandShrublandWetlandWater BodiesArtificial SurfacesBare LandTotal 2010
Cultivated land406,114,3291,169,60523,914,517143,274964,289509,3331,911,831172,307434,899,485
Forest2,878,620467,431,45855,495,608979,299235,248403,39049,2117157527,479,991
Grassland28,058,35757,275,3121,302,144,8815,370,0343,128,8241,620,5461,175,17212,339,9391,411,113,065
Shrubland365,988387,24413,613,5283,468,96686,48954,60217,502220,17118,214,490
Wetland104,95459,7691,646,98559649,550,637531,21316,45225,02411,940,998
Water bodies−534,539110,800280,9429063−292,6671,840,279−32,11911,4261,393,185
Artificial surfaces1,394,83814,3151,565,94816,2984974674215,694,09238,49618,735,703
Bare land148,686627310,125,99785,771221,618132,02117,87836,197,54646,935,790
Total 2000438,531,233526,454,7761,408,788,40610,078,66913,899,4125,098,12618,850,01949,012,0662,470,712,707
kg C/m2Cultivated LandForestGrasslandShrublandWetlandWater BodiesArtificial SurfacesBare LandTotal 2020
Cultivated land318,640,1381,464,41170,352,9411,858,616374,149344,4292,744,6251,448,455397,227,764
Forest1,207,830196,967,65914,434,3101,083,18711,65353,31110,2304195213,772,375
Grassland32,309,68913,627,0001,041,160,8035,153,9262,350,488701,0751,064,25431,281,4841,127,648,719
Shrubland388,1341,167,6024,830,59314,919,4398505906657,268112,35421,492,961
Wetland114,36665,9912,461,71925,3324,617,929273,7502418106,0437,667,548
Water bodies73,70128,032522,95480222,4641,435,71313,398107,9502,404,292
Artificial surfaces7,448,703122,3355,605,565271,74848,50617,61512,581,532294,04726,390,051
Bare land366,42127,94912,459,579285,775487,245144,12922,24243,531,23657,324,576
Total 2010360,548,982213,470,9791,151,828,46423,598,1038,120,9392,979,08816,495,96776,885,7641,853,928,286
Disclaimer/Publisher’s Note: The statements, opinions and data contained in all publications are solely those of the individual author(s) and contributor(s) and not of MDPI and/or the editor(s). MDPI and/or the editor(s) disclaim responsibility for any injury to people or property resulting from any ideas, methods, instructions or products referred to in the content.