Energy Measurement in Standard Penetration Tests
Abstract
:1. Introduction
2. Materials and Methods
2.1. Quantitative Research Method of Standard Penetration Test
2.1.1. Force-Leveling Method to Determine the Hammer Strike Energy
2.1.2. Force-Speed Method
2.2. Fluctuation Test of the In Situ SPT
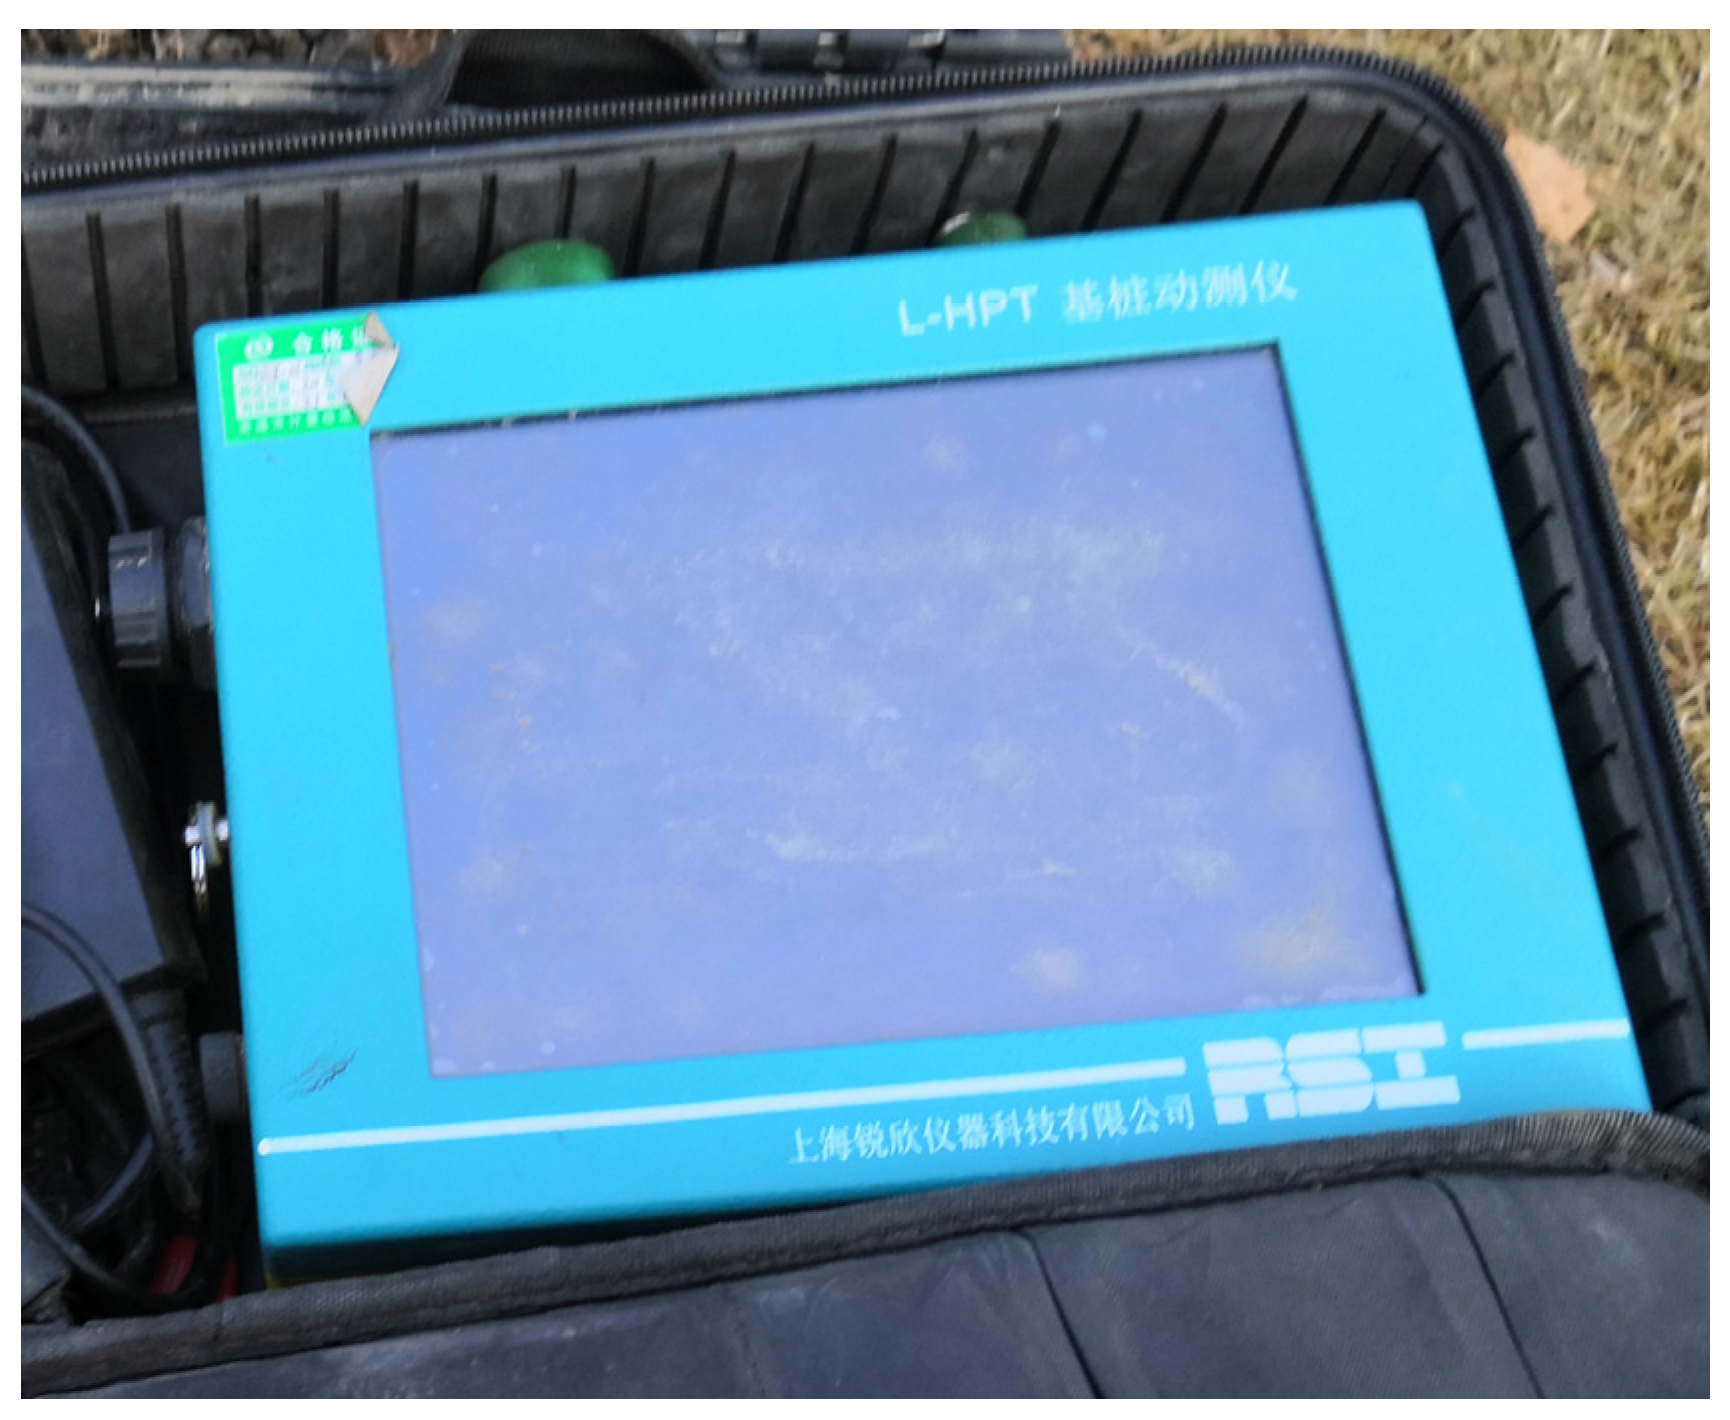
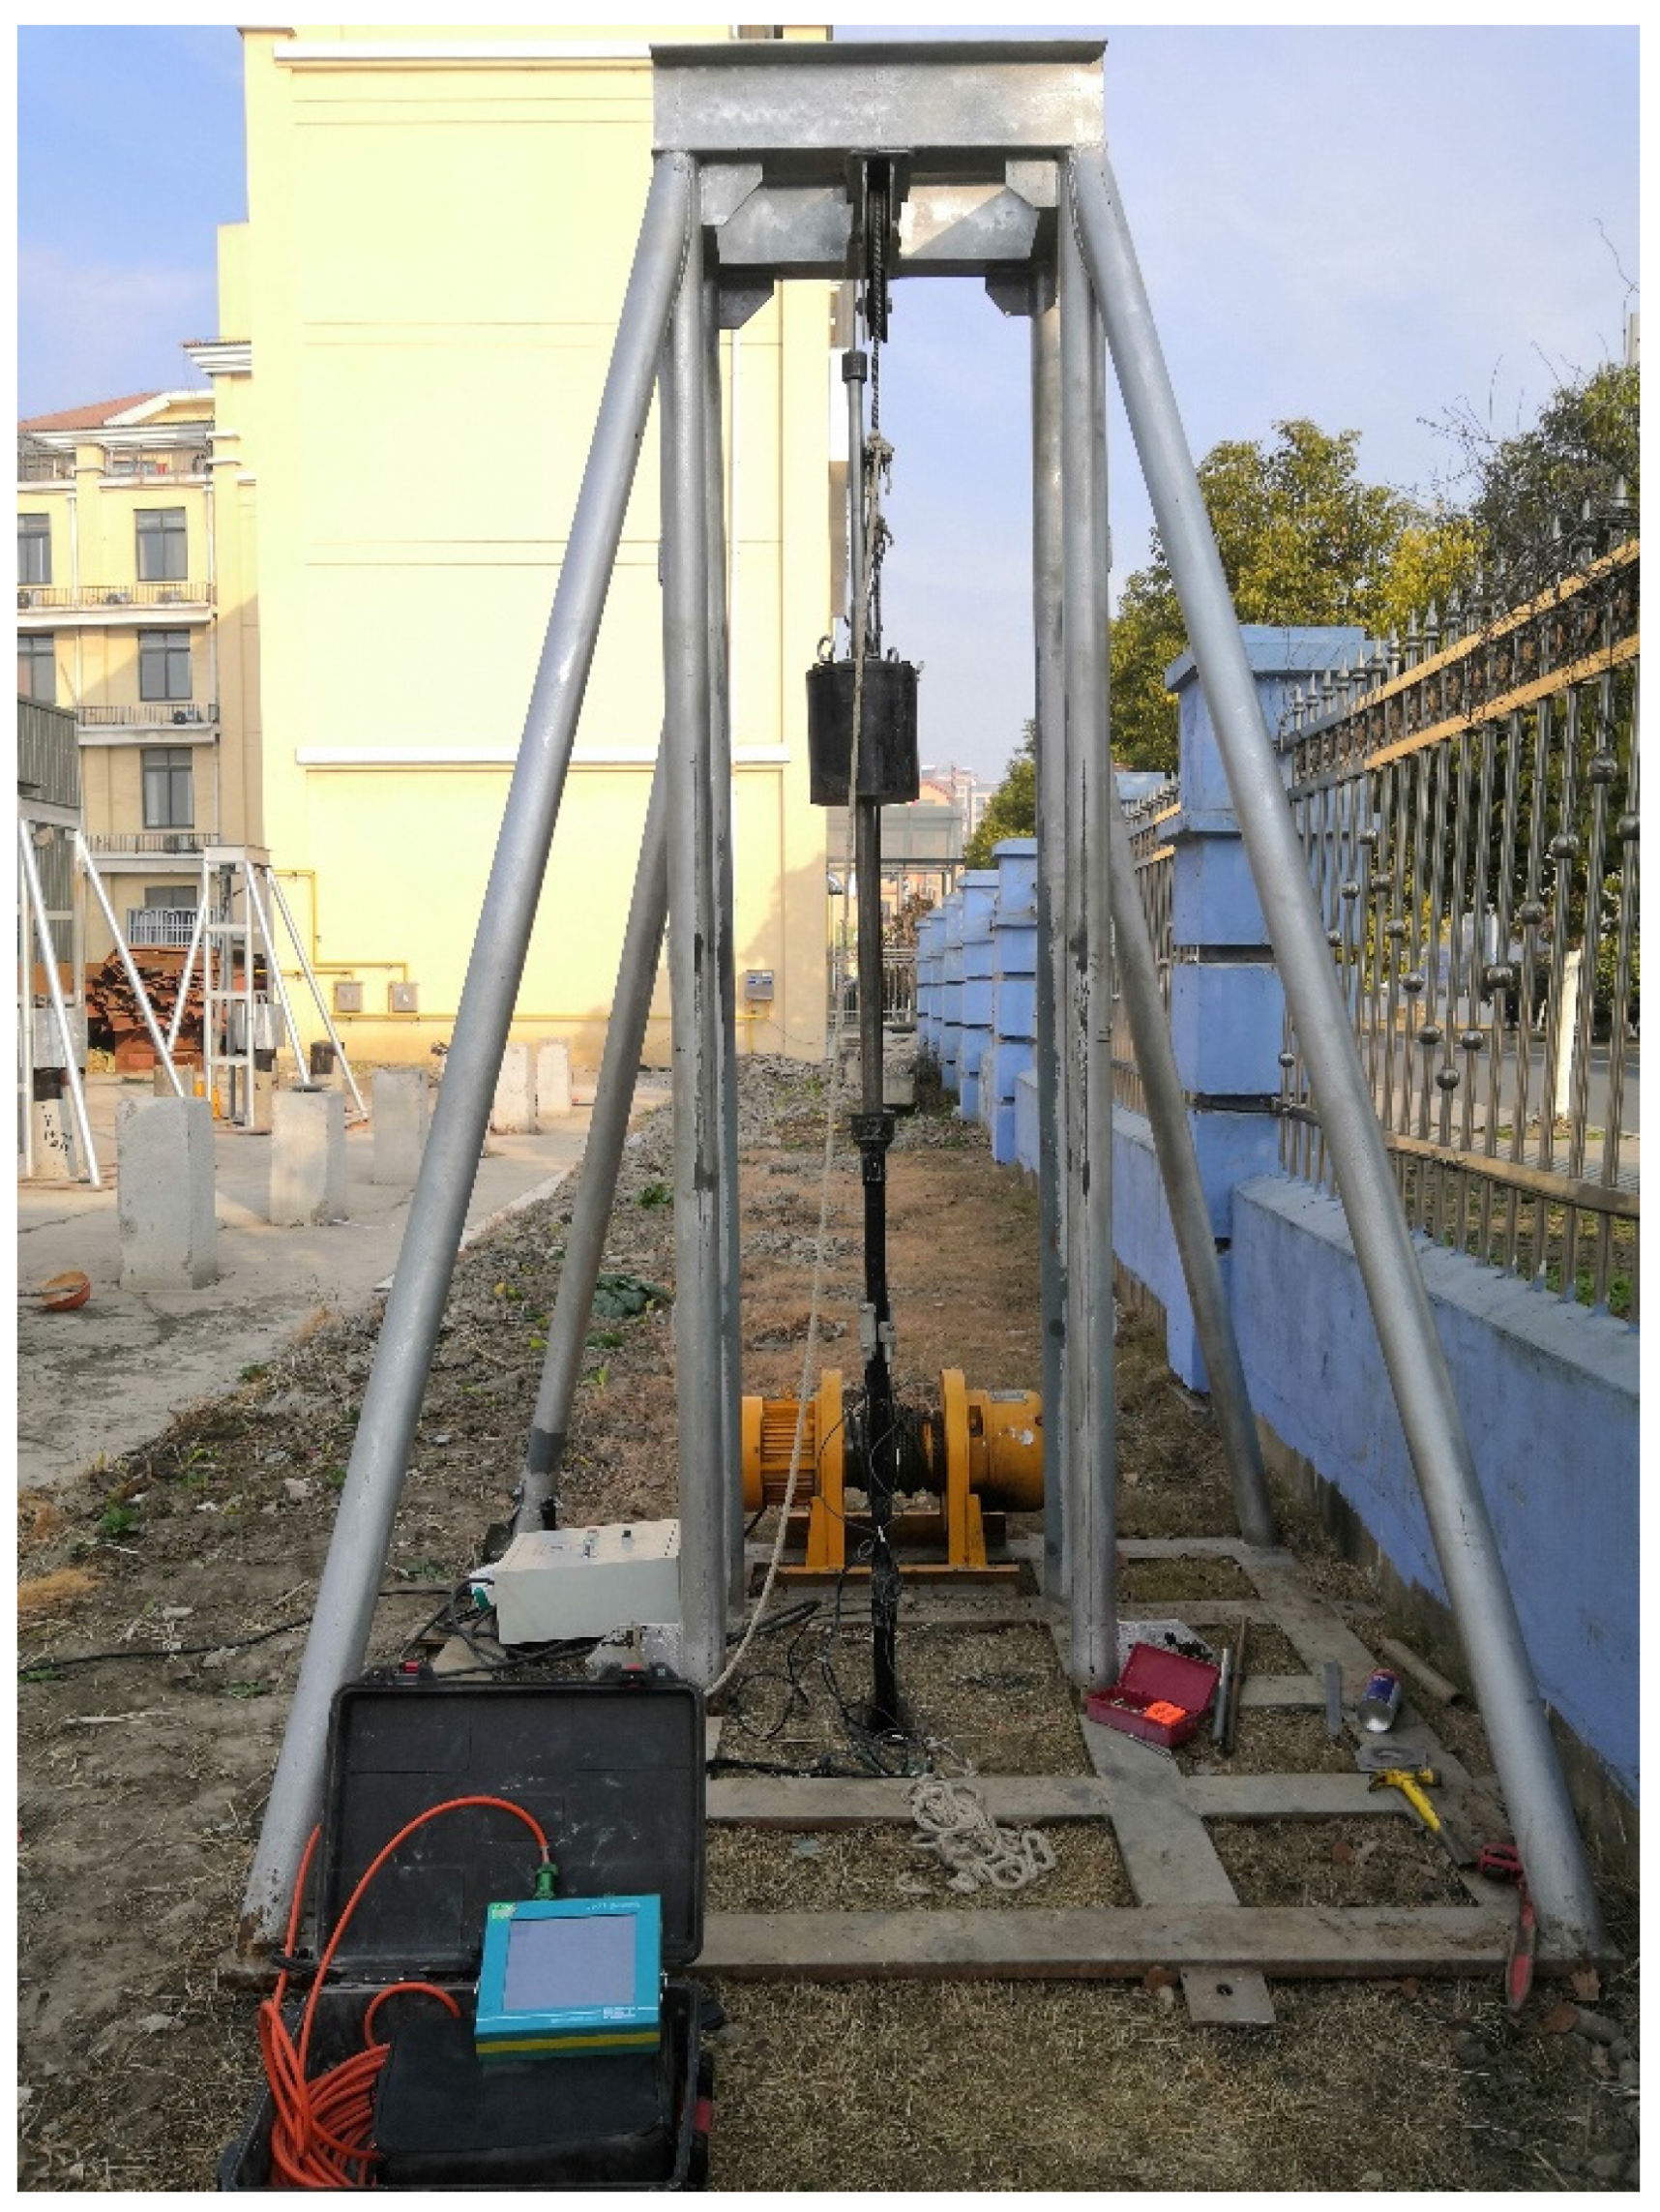
2.2.1. Volatility Test Instruments and Equipment
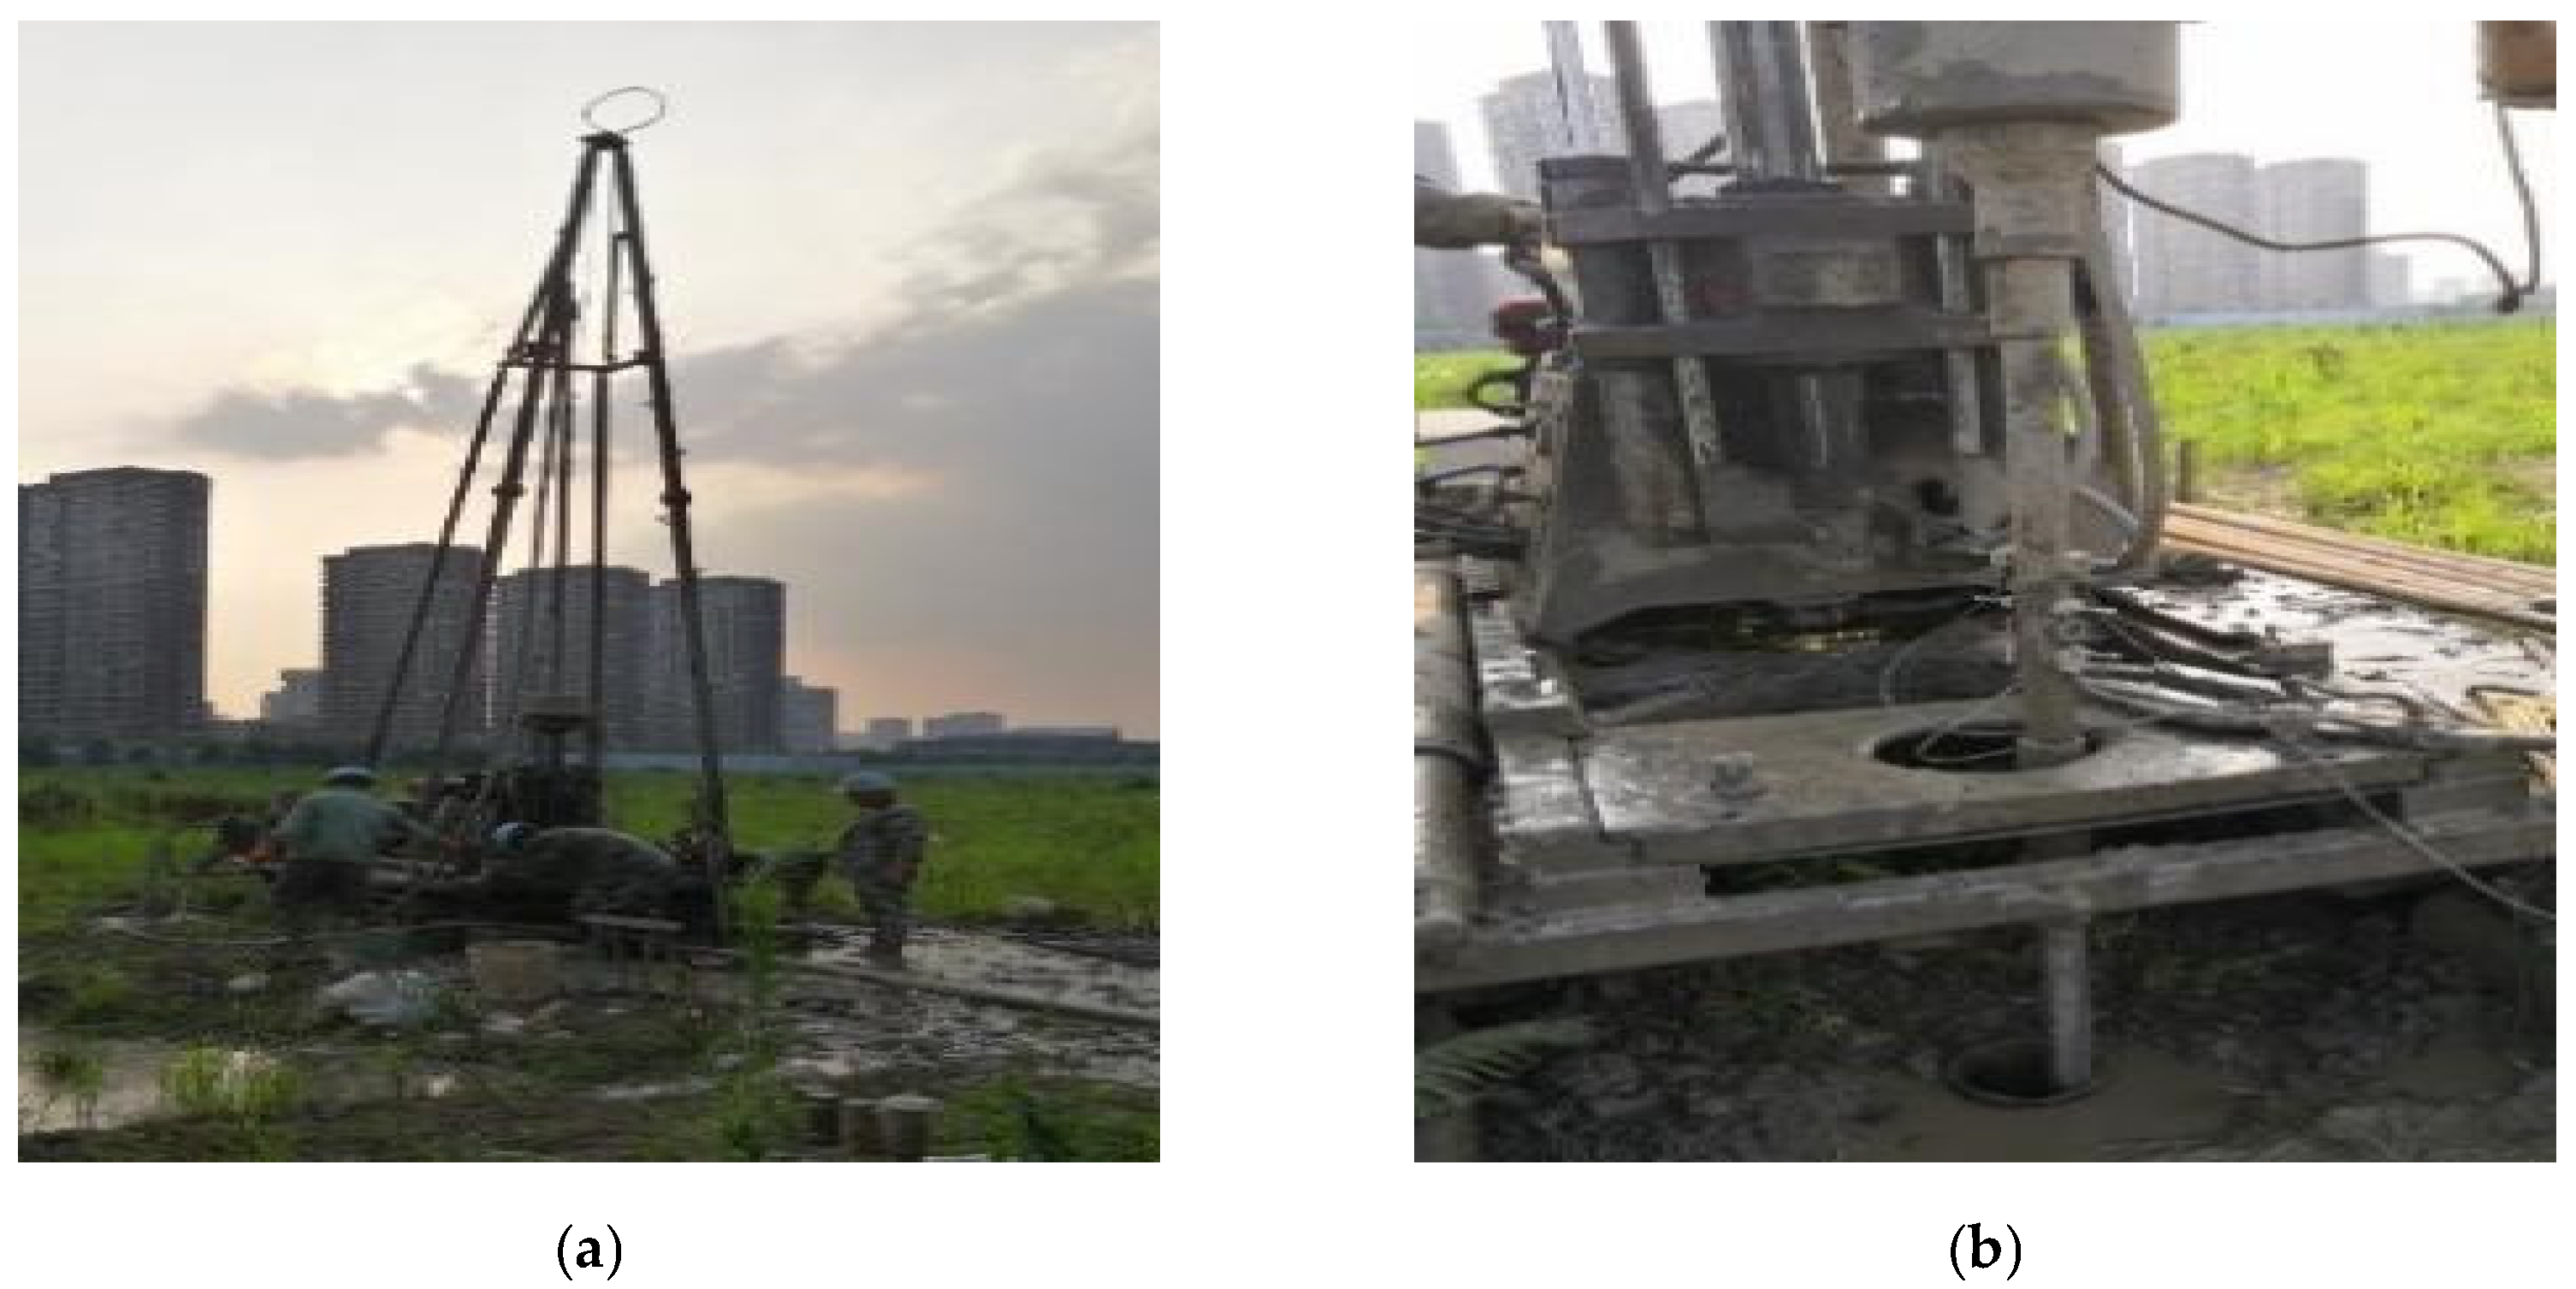
2.2.2. Geology of the Test Site
2.2.3. Standard Test Fluctuation Test Process
- We used the crane to lift the steel support to the test position to maintain stability. We used a winch that met the lifting requirements, fixed a pulley to guide the steel wire rope on the top of the support, and connected the power supply.
- We determined the appropriate drilling position to ensure that the drop hammer’s centerline and the desired hole’s centerline were located on the same vertical line. During hammering, we ensured the vertical alignment of the falling hammer and the drill rod to mitigate unnecessary friction between the falling hammer and the guide rod, and any eccentricity in the contact between the heavy hammer and the hammer pad, which would have affected the collected data.
- The drill rod of the installed sensor was connected between the hammer pad and the drill rod under the standard penetration instrument; the drilling hole was located 30 cm under the hammer pad, and the drilling position was kept approximately 0.6 m above the ground.
- We installed the strain and acceleration sensors on the drill rod securely, and connected the high strain collection instrument.
- We turned the high-strain acquisition instrument on; set the appropriate engineering parameters, pile parameters and sensor parameters, selected the appropriate trigger voltage; adjusted and confirmed that the sensor was ready, and waited for the hammer to impact the test sample.
- We commanded the operator to use the winch to lift the hammer until it automatically fell and impacted the hammer pad. We then ceased data acquisition and saved all data that were recorded 100 ms after the trigger.
- We commanded the drilling operator to lift the hammer in order to repeat the test. We then repeated step 6 until the end of the SPT. We then recorded the test depth, rod length, mark, stroke number and other relevant data.
- We removed the sensor and wire, arranged the relevant instruments, removed the standard penetration device and cleaned any debris from it. We then placed the device back into the borehole for the next depth of the SPT. Photographs of the in situ trials are shown in Figure 6.
3. Results
Data Wrangling
- Comparison of force time course curve calculated by force-velocity method and force-leveling method.
- Comparison of the displacement and measured penetration
4. Discussion
4.1. Stress Wave and Energy Transfer Law
4.1.1. Acceleration and Speed
4.1.2. Force
4.1.3. Stress Wave and Energy Propagation
4.1.4. Comparison of the Force-Speed Method (FV) and Force-Flat Method (F2)
4.1.5. Penetration
4.1.6. Impact of Drill Joints
4.2. Hammer Strike Energy
5. Conclusions
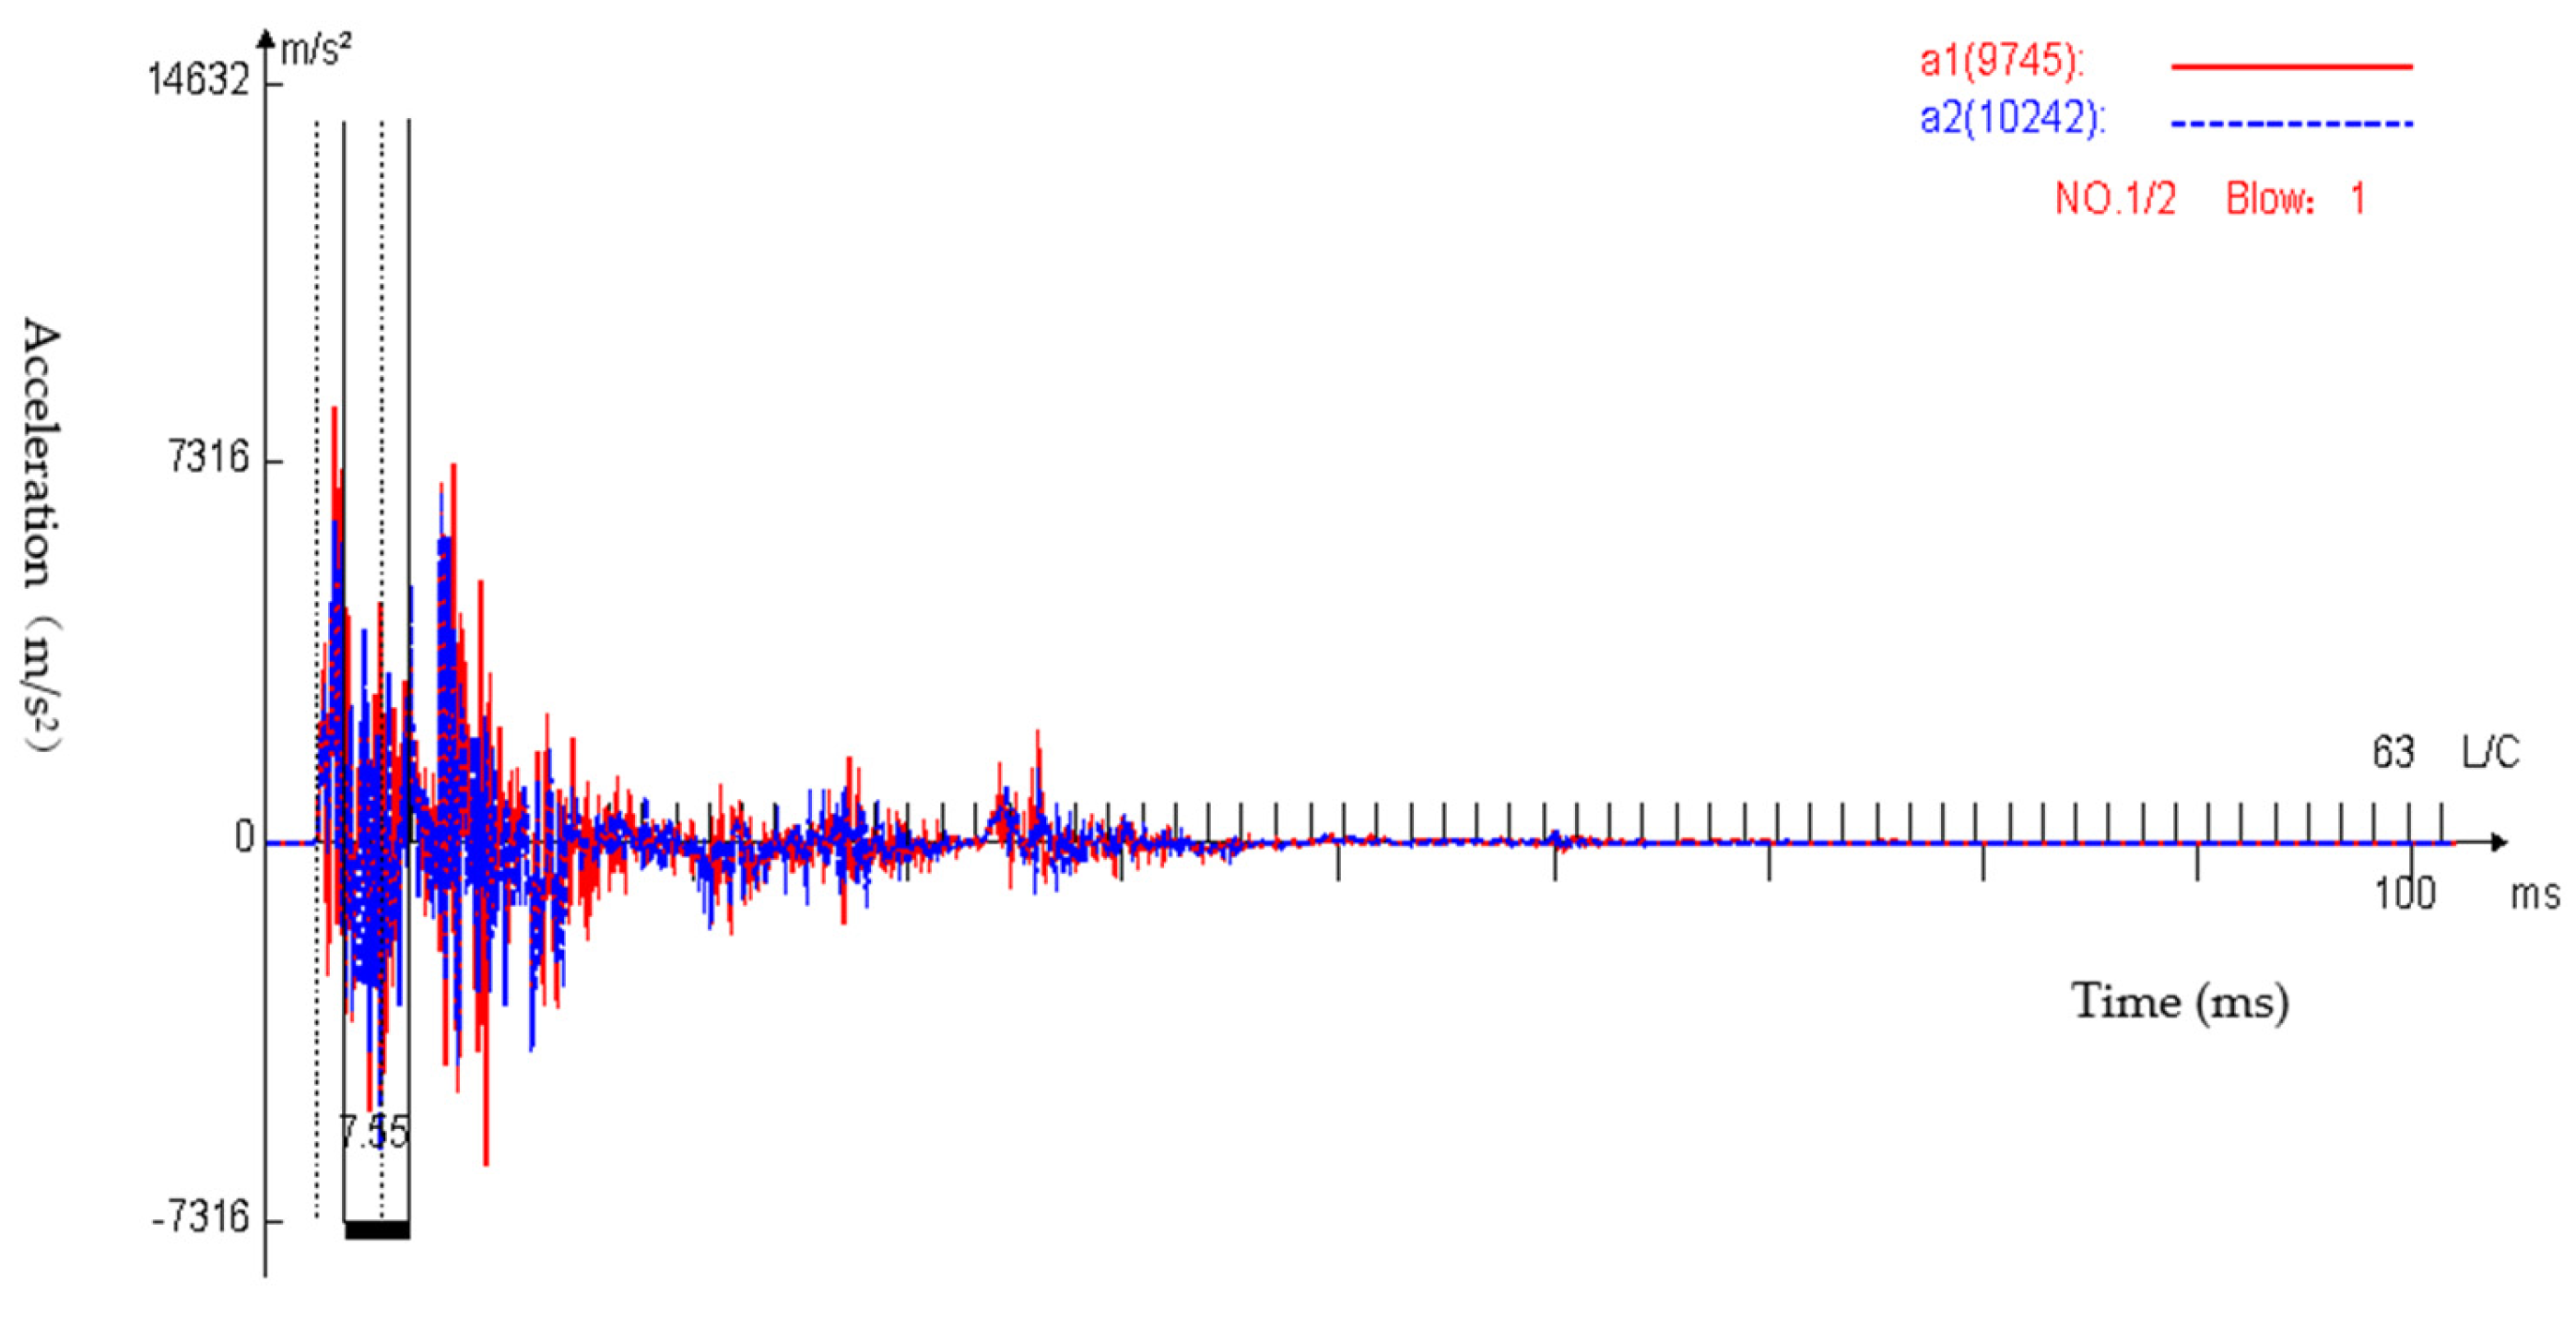
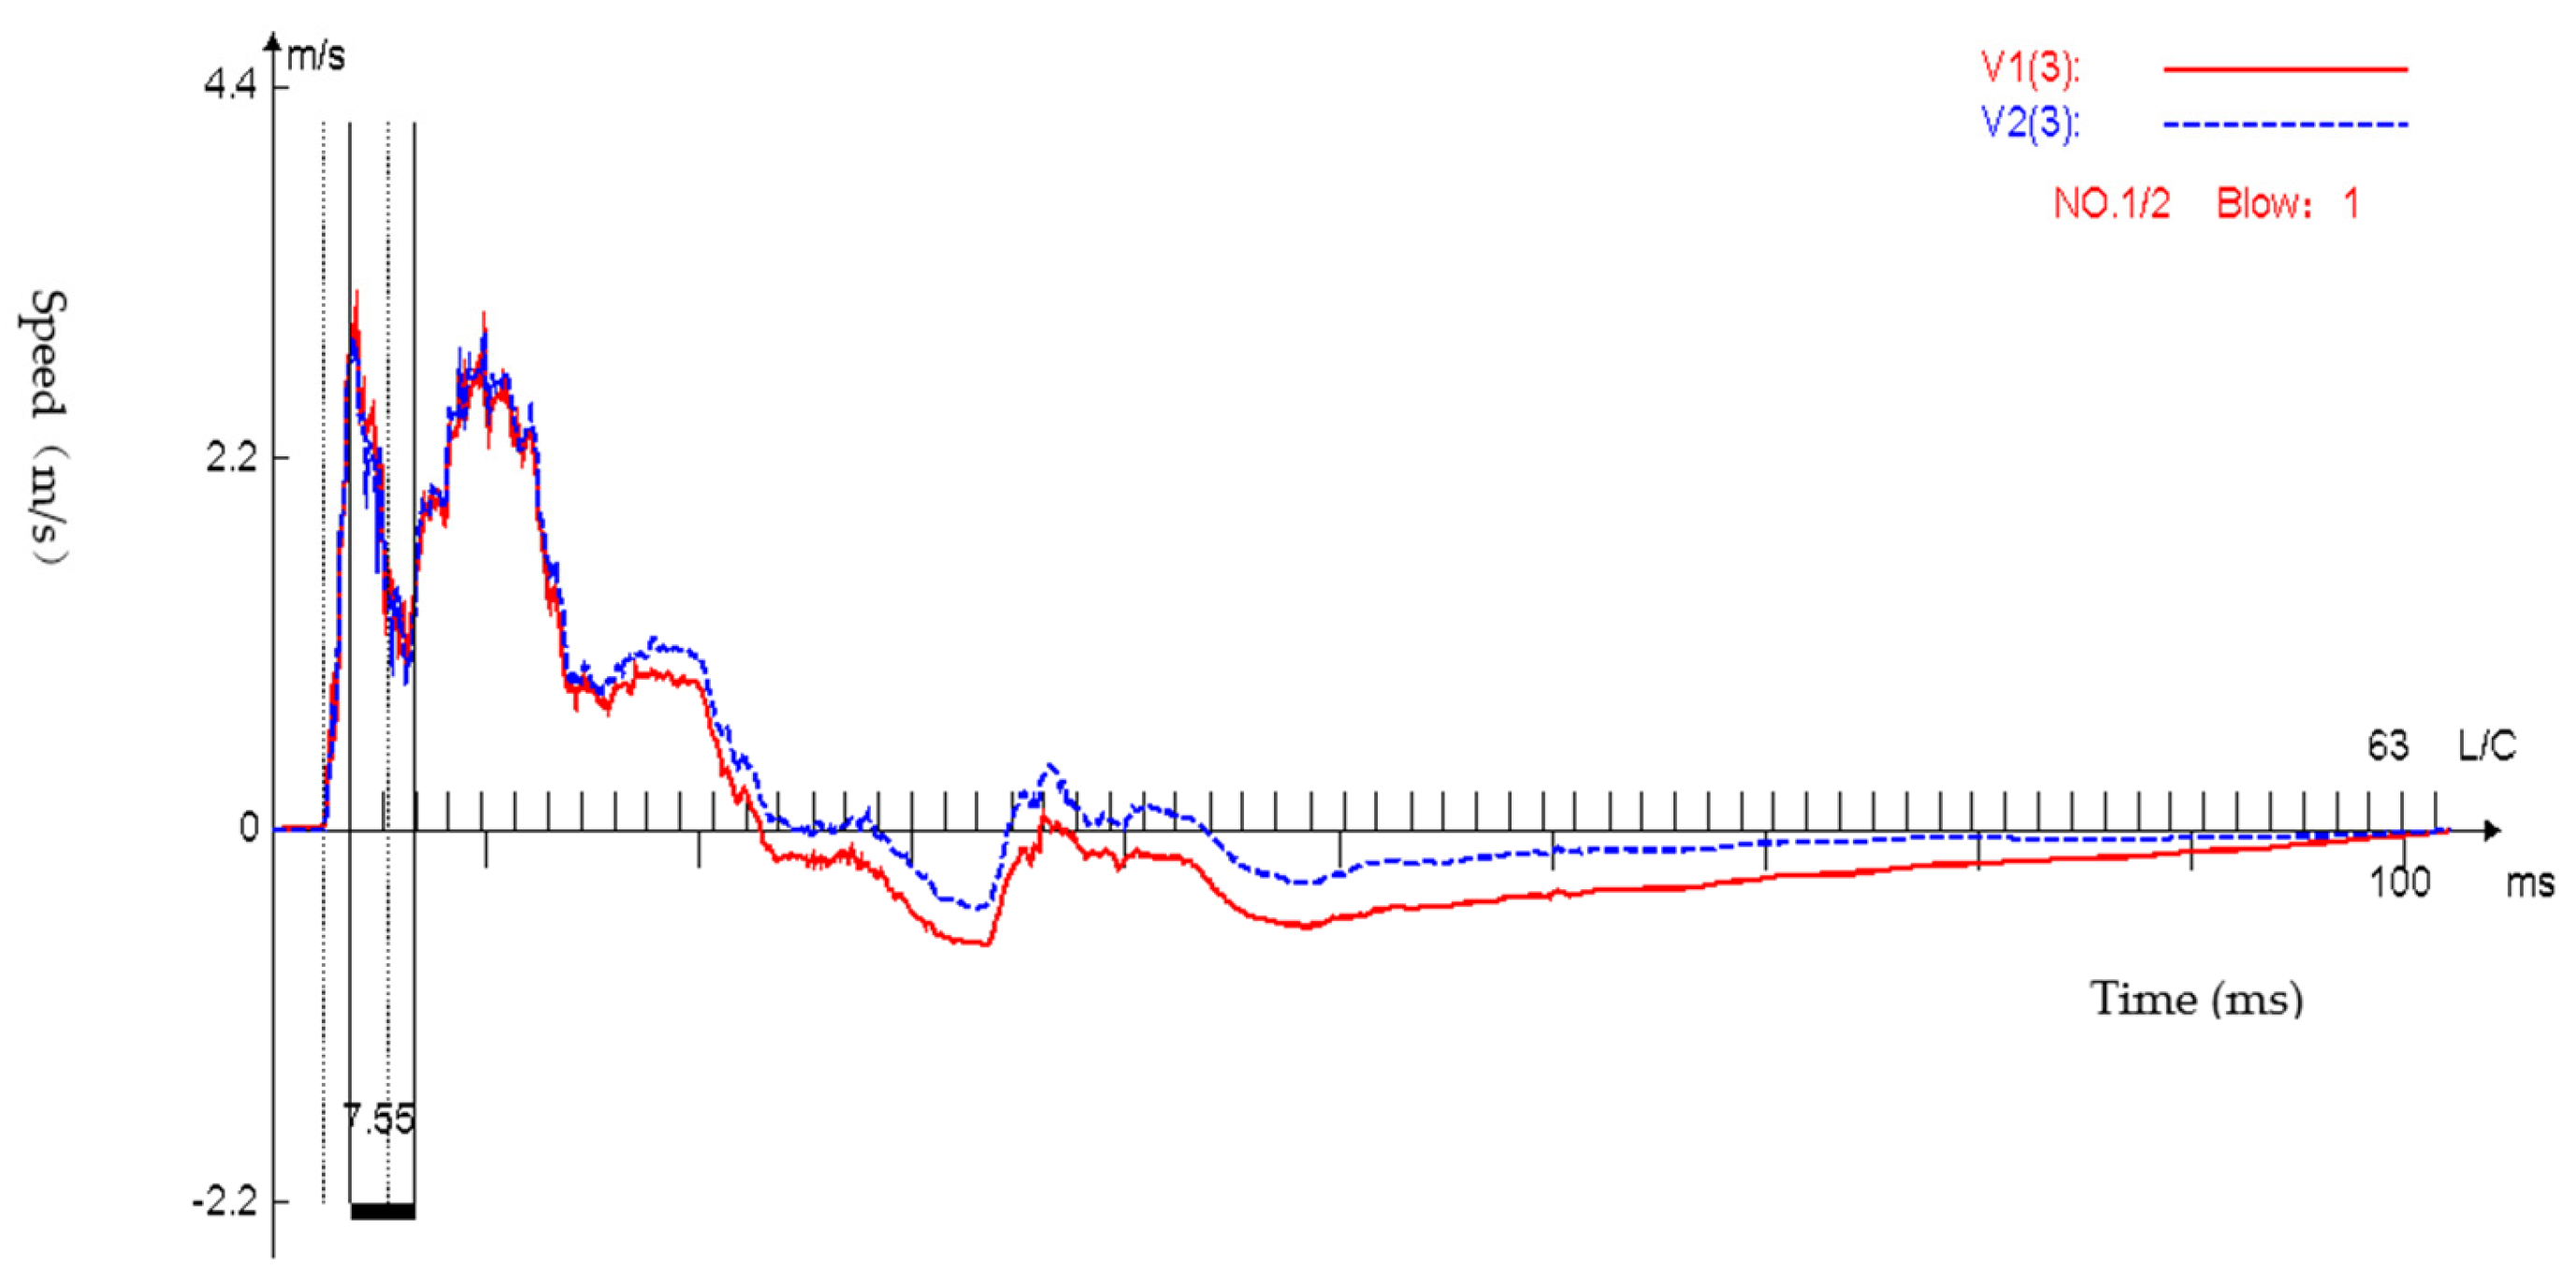
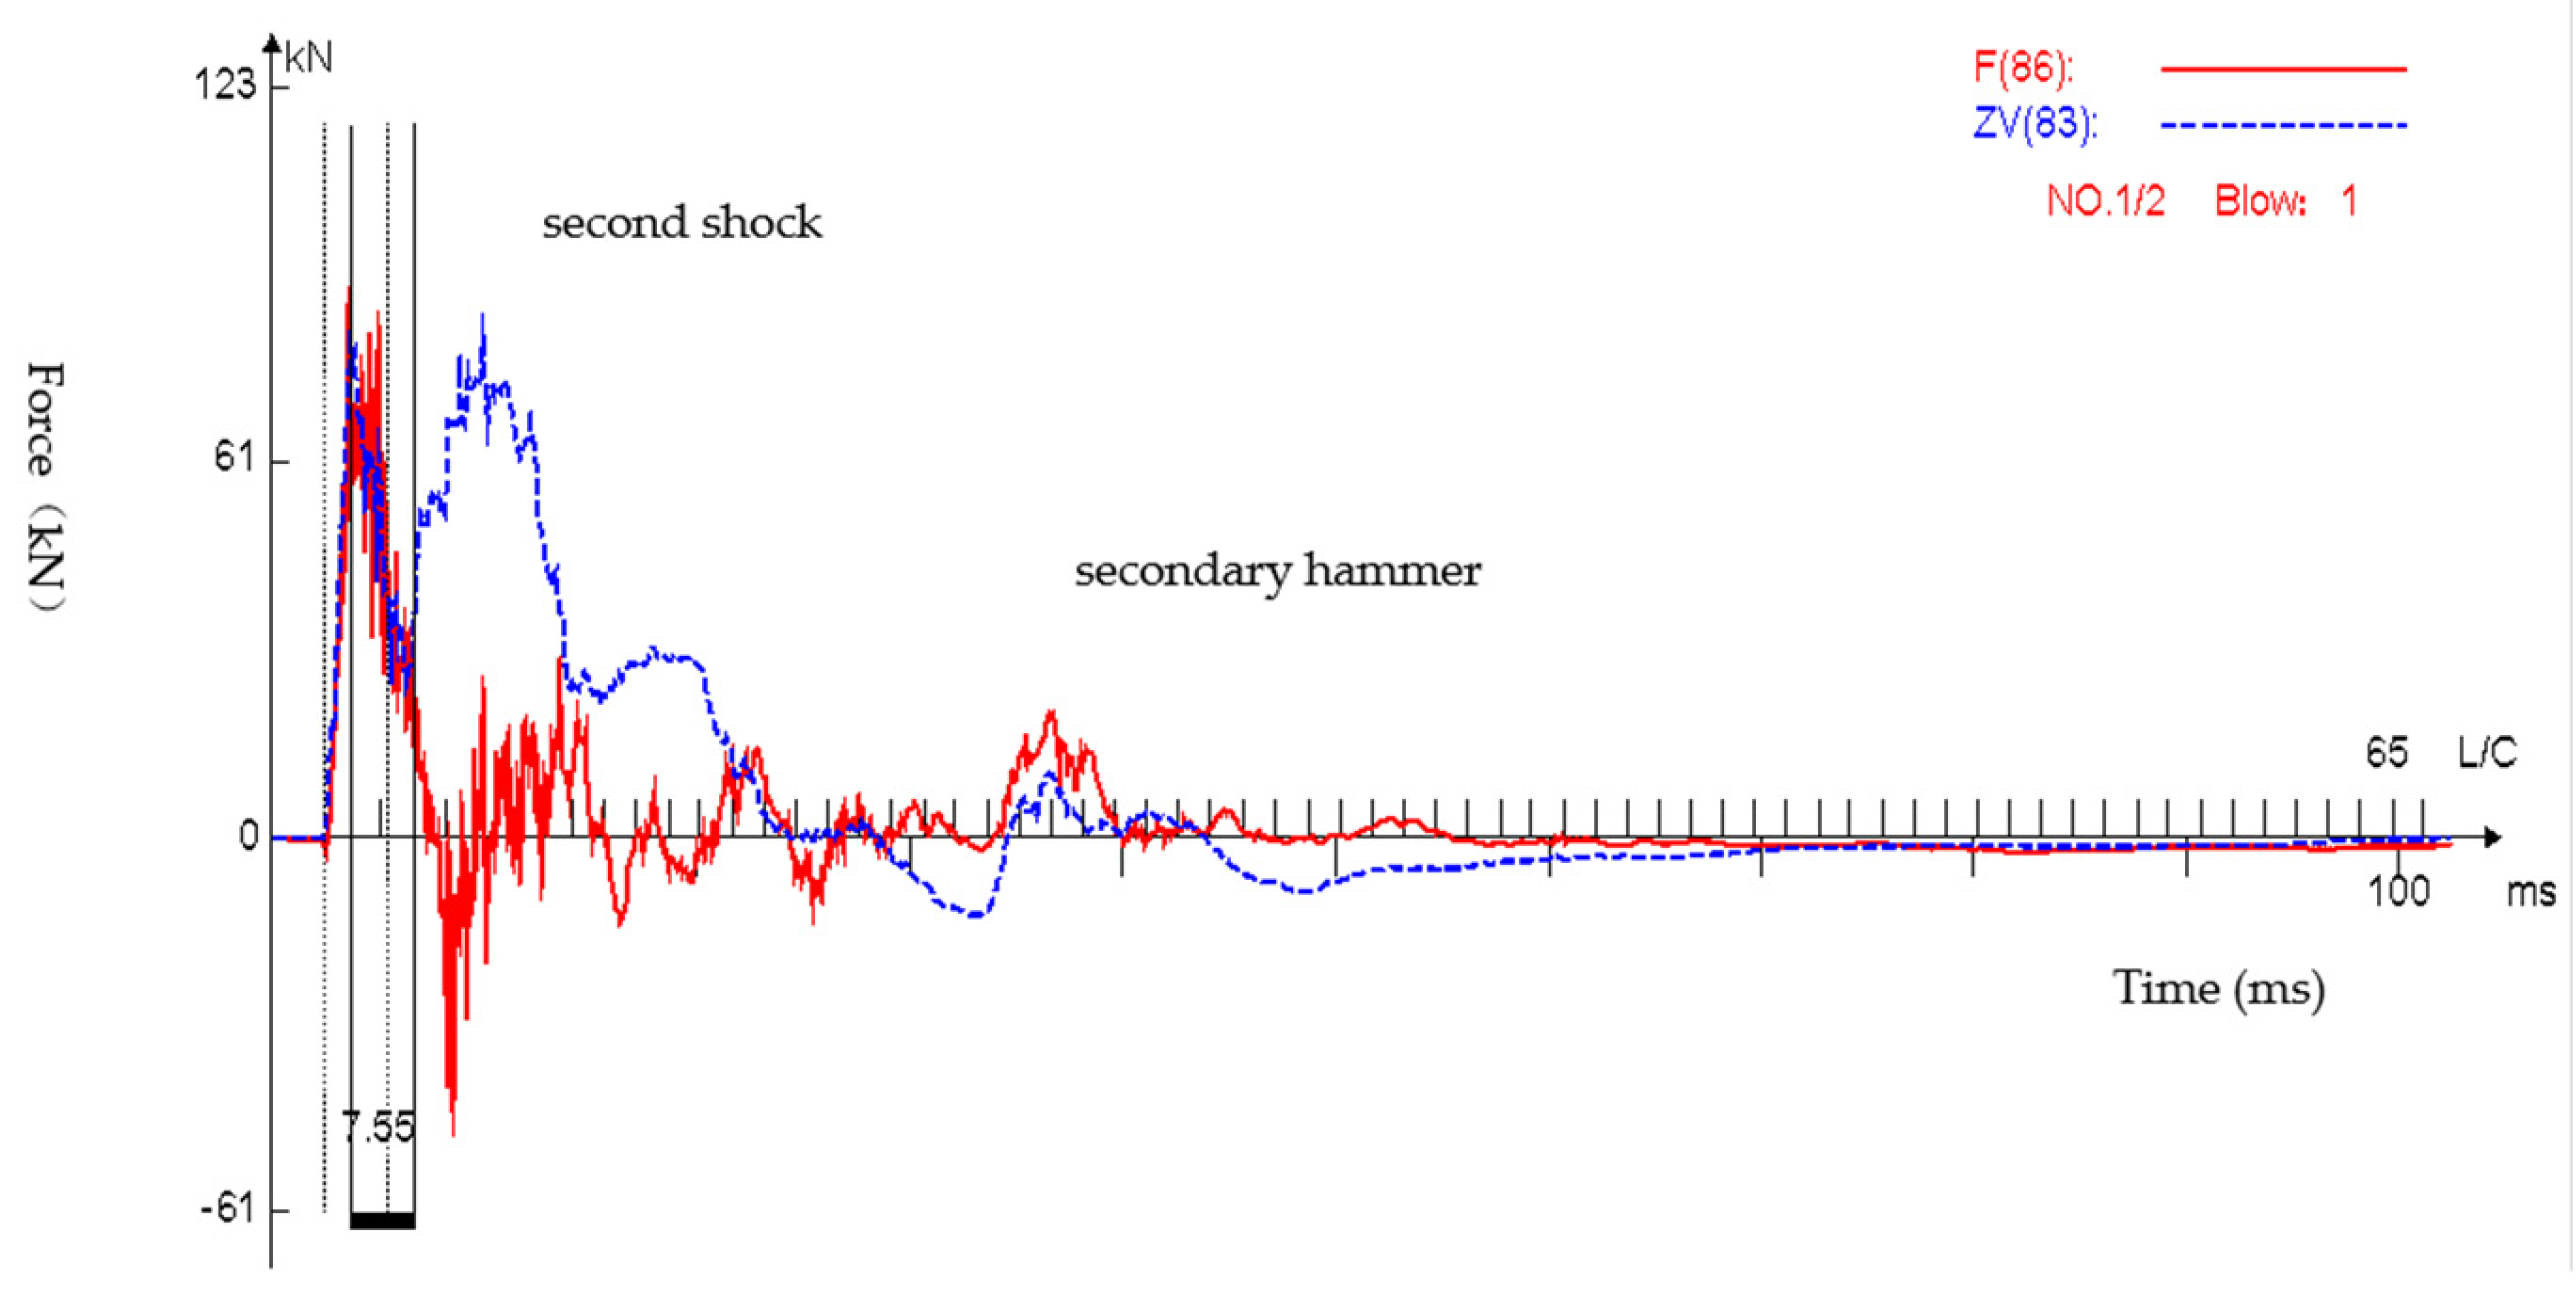
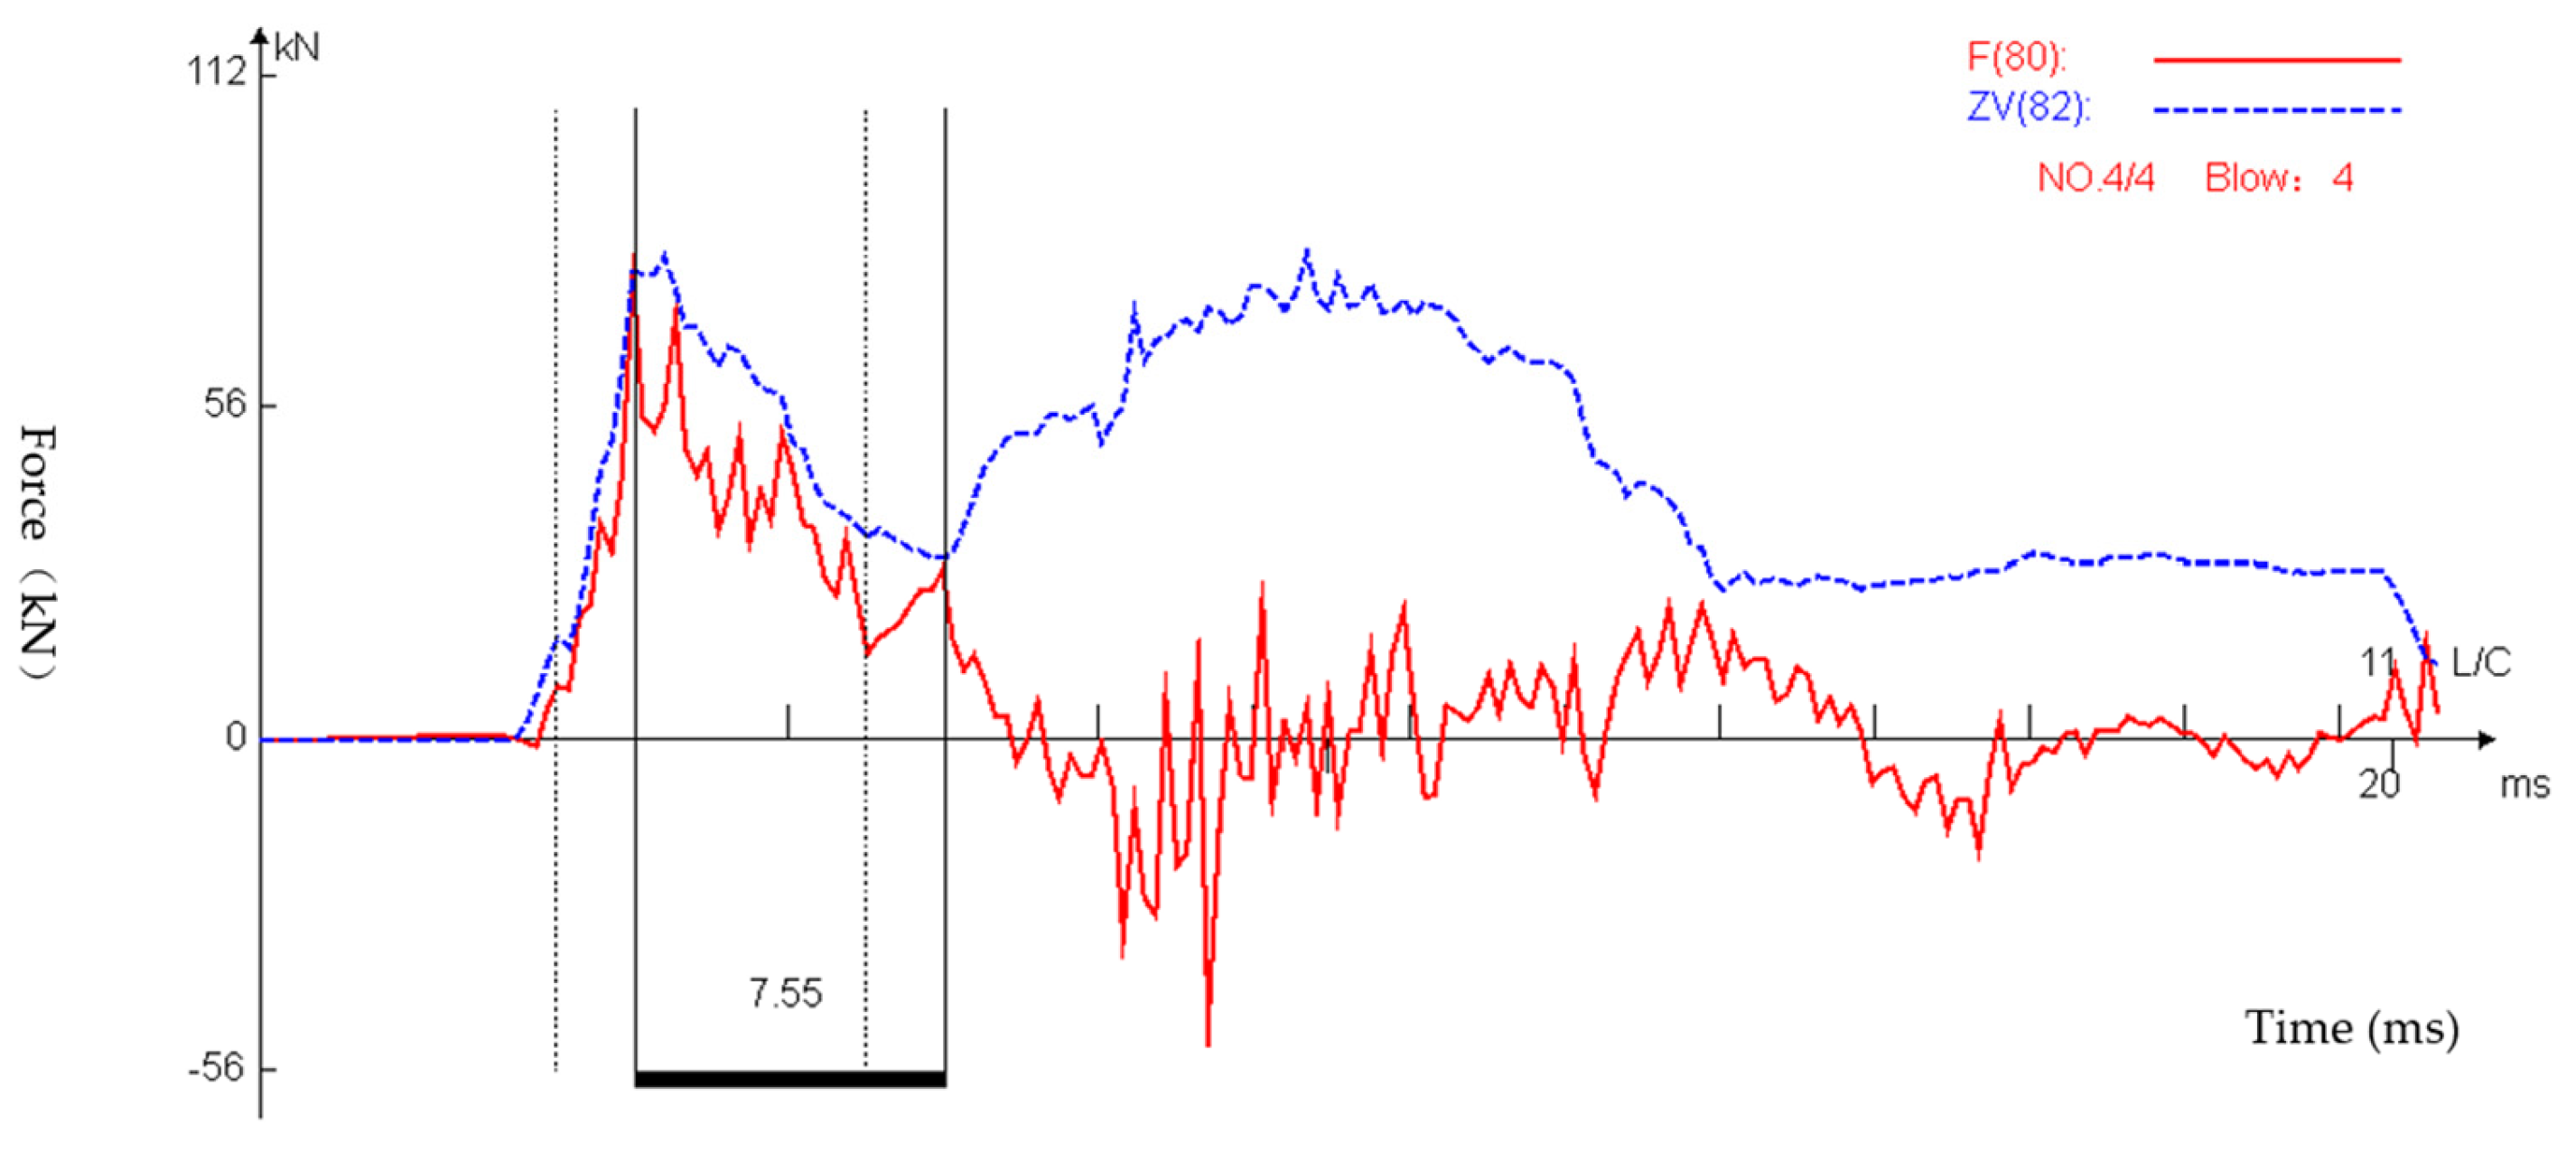
- As shown in the measured force (F) time curve and ZV time curve, the impact of the falling hammer produces a compression wave that propagates down along the drill rod to the tip of the inflow device. The inflow device moves down under the action of the compression wave and produces the corresponding stretching wave, and the stretching wave then reflects upward along the drill rod. When the length of the drill rod from the hammer to the penetration tip is short, the initial tensile wave returning from the bottom of the drill rod begins to reach the top of the drill rod before the full compression force is successfully transferred from the heavy hammer to the drill rod, counteracting the partial compression wave, and resulting in reduced energy transmission.
- The F and ZV time-course curves nearly coincide, before the reflection wave is reflected back to the measurement point position; however, after that time, these curves are no longer proportional to each other. The arrival of the reflected stretching wave typically results in a physical separation between the heavy hammer and the drill rod, and this stretching wave then reflects back again as the compression waves along the drill rod. The heavy hammer falls again due to gravity, and recontacts the top of the drill rod at some point in time, providing a secondary hammer. The secondary impact of the reflected wave and the secondary hammer of the heavy hammer will increase the energy transmitted to the drill rod. The real energy transmitted to the rod should thus include all subsequent impacts. Therefore, when compared to the force-square (F2) method, the force-speed (FV) method can more accurately obtain all the energy transmitted by the drop hammer system.
- The ratio between force and speed is not completely consistent until the tensile wave reflects back to the test point position. This phenomenon may be due to changes in the impedance (e.g., loose joints; sudden changes in the cross-sectional area).
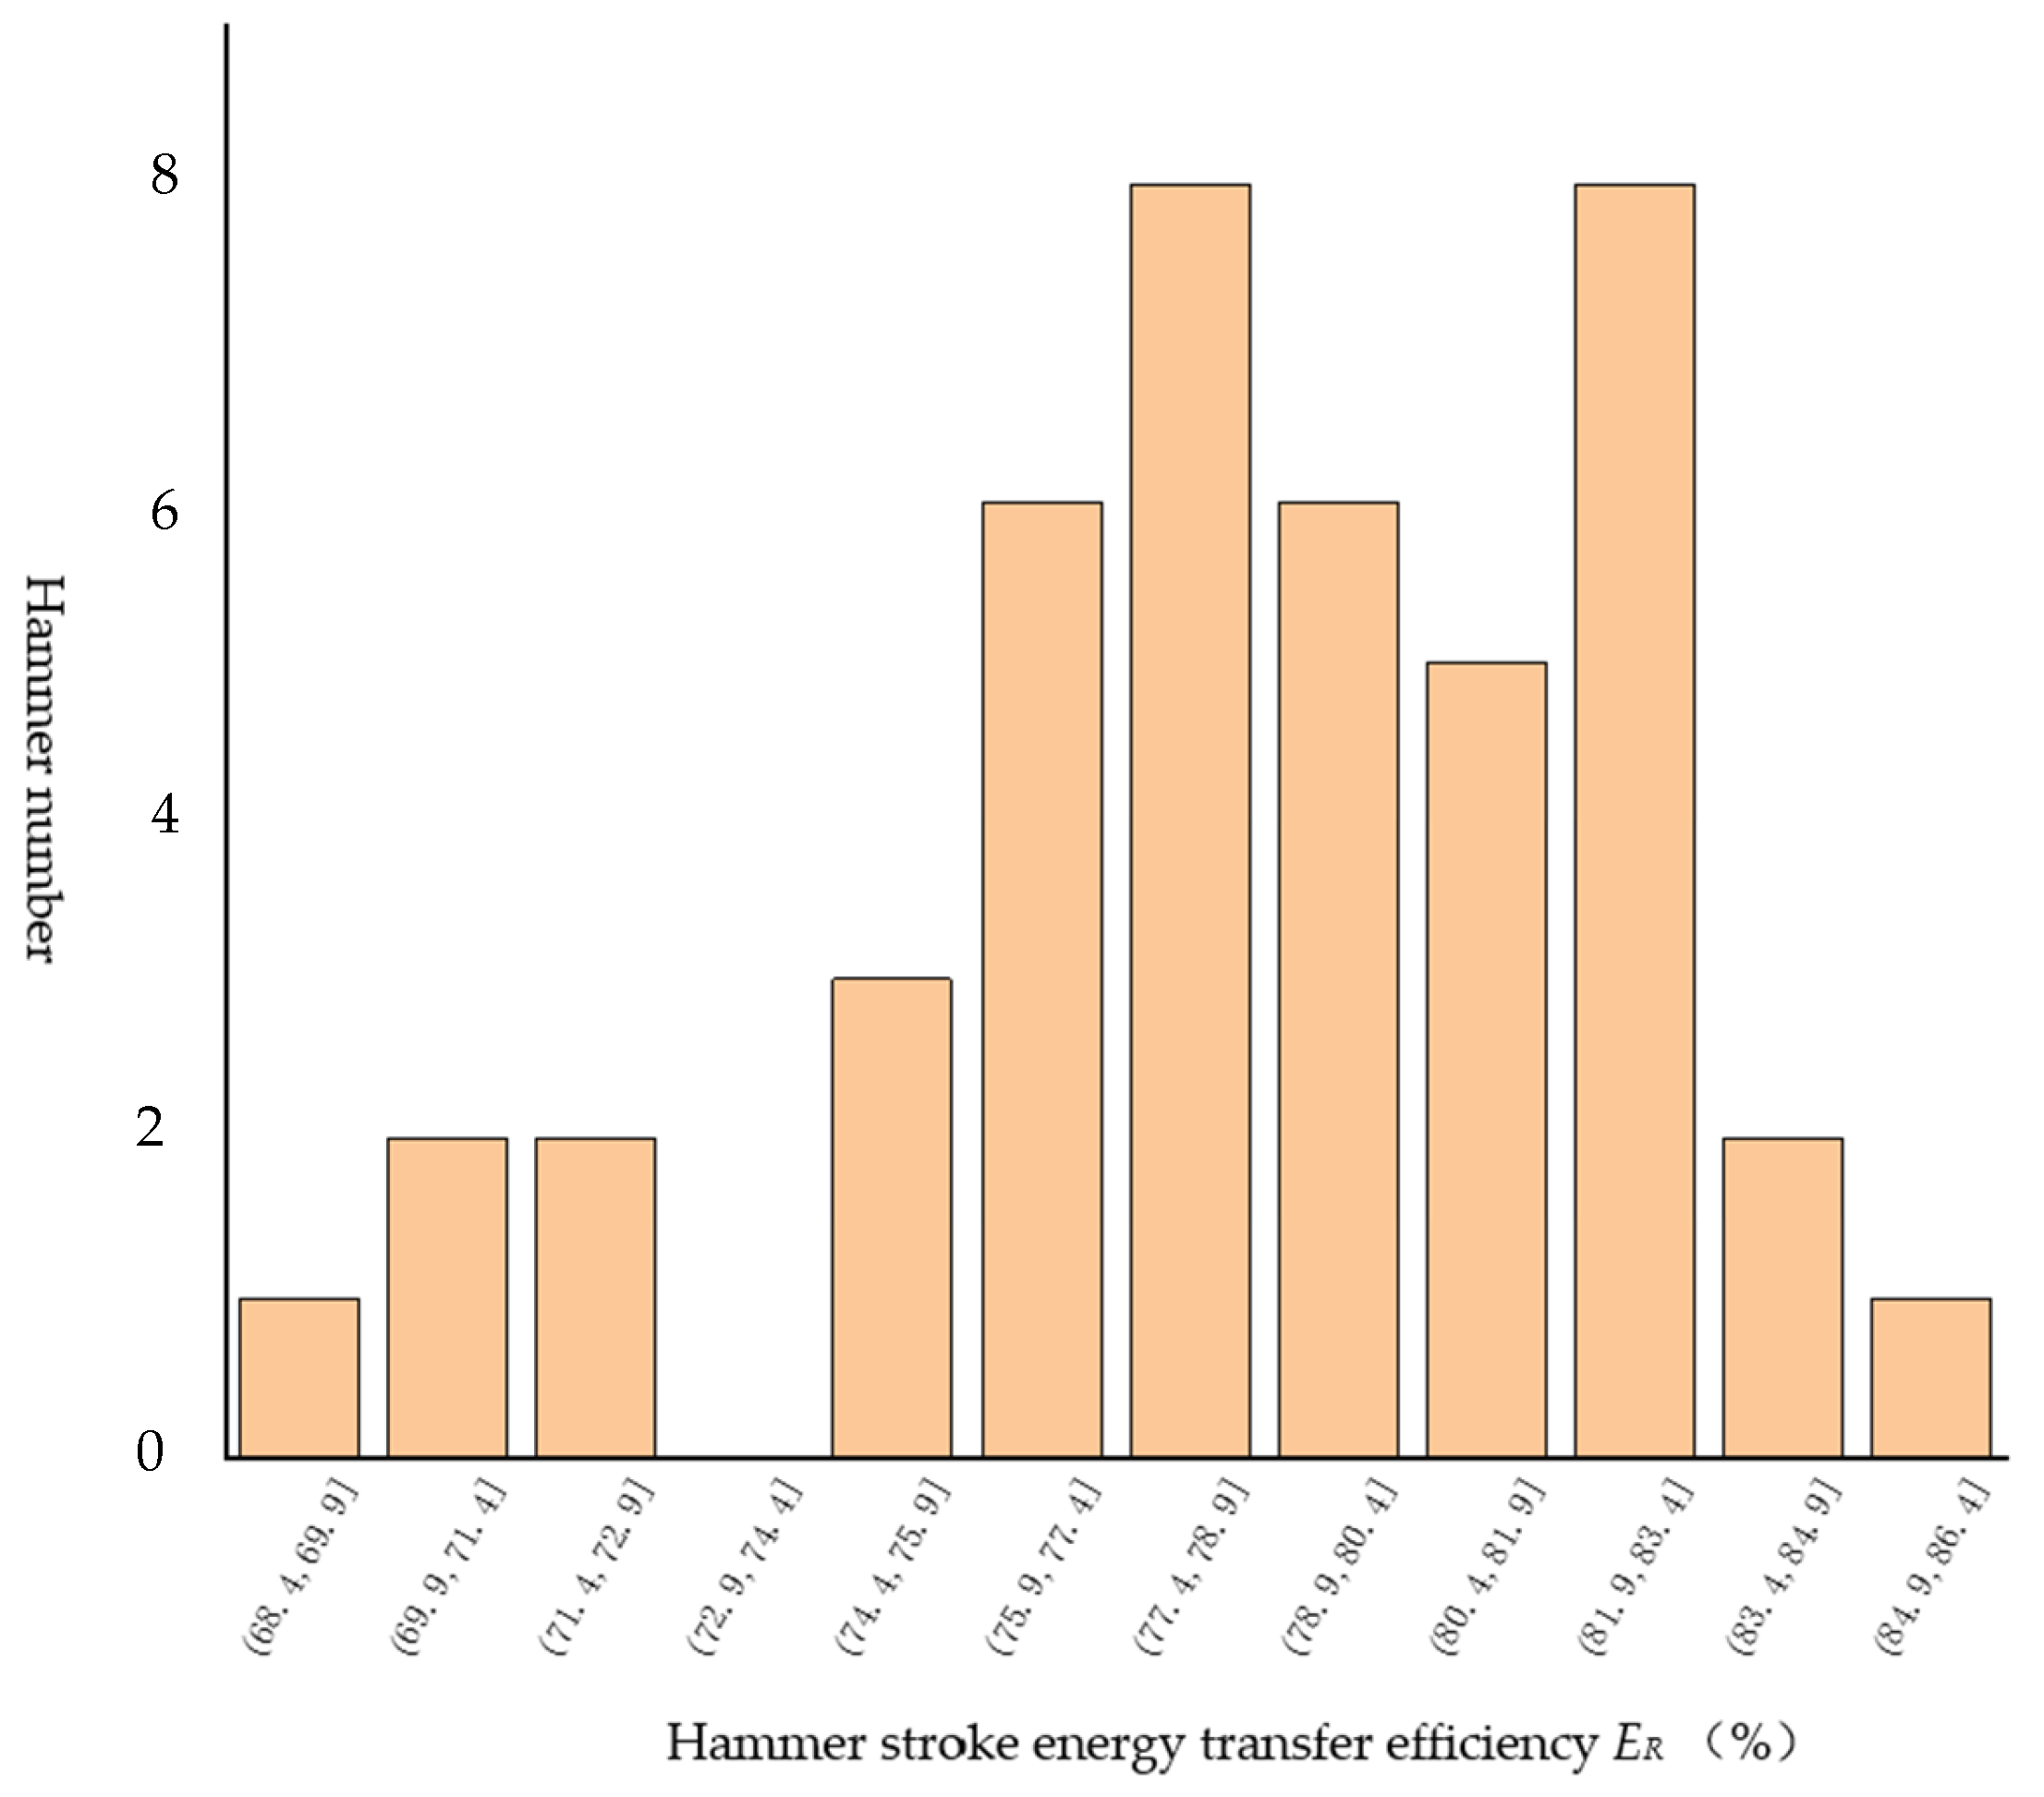
- Most of the measured hammer energy transfer efficiency of the site in situ tests is between 74.5% and 84.5%. The average measured energy is 0.37 kJ; the average energy transfer efficiency is 78.7%; the standard deviation in energy transfer efficiency SD is 3.82; and the variation coefficient of the energy transfer efficiency CV is 4.9%. The average energy transfer efficiency of 78.7% can be used as the standard energy transfer efficiency of a hammer system with a common penetration instrument in China.
Author Contributions
Funding
Institutional Review Board Statement
Informed Consent Statement
Data Availability Statement
Conflicts of Interest
References
- Editorial Committee of Engineering Geology Manual. Engineering Geology Manual, 5th ed.; China Architecture Press: Beijing, China, 2018; pp. 206–223. [Google Scholar]
- Zhou, Y.X. Comparative Study on Geotechnical Engineering Investigation Codes of China, America and Europe. Master’s Thesis, Southeast University, Nanjing, China, 2015. [Google Scholar]
- Seed, H.B.; Idriss, M.; Arango, I. Evaluation of Liquefaction Potential Using Field Performance Data. J. Geotech. Eng. 1983, 109, 458–482. [Google Scholar] [CrossRef]
- Skempton, A.W. Standard penetration test procedures and the effects in sands of overburden pressure, relative density, particle size, ageing and overconsolidation. Geotechnique 1986, 36, 411–412. [Google Scholar] [CrossRef]
- Schmertmann, J.H.; Palacios, A. Energy dynamics of SPT. J. Geotech. Eng. 1979, 105, 909–926. [Google Scholar] [CrossRef]
- Lu, K.Y.; Li, Z.Y.; Yuan, X.M. Study on influencing factors of standard penetration test in China and abroad. Earthq. Res. 2020, 43, 582–591. [Google Scholar]
- Lee, C.; An, S.; Lee, W. Real-time monitoring of SPT donut hammer motion and SPT energy transfer ratio using digital line-scan camera and pile driving analyzer. Acta Geotech. 2014, 9, 959–968. [Google Scholar] [CrossRef]
- Yokel, F.Y. Energy Transfer Mechanism in SPT. J. Geotech. Eng. 1989, 115, 1331–1336. [Google Scholar] [CrossRef]
- Sy, A. Energy Measurements and Correlations of the Standard Penetration Test (SPT) and the Becker Penetration Test (BPT). Ph.D. Thesis, University of British Columbia, New York, NY, USA, October 1993. [Google Scholar]
- Tsai, J.; Liou, Y.; Liu, F. Effect of Hammer Shape on Energy Transfer Measurement in the Standard Penetration Test. Soils Found. 2004, 44, 103–114. [Google Scholar] [CrossRef] [PubMed]
- Batilas, A.V.; Pelekis, P.C.; Roussos, P.G. SPT Energy Measurements: Manual vs. Automatic Hammer Release. Geotech. Geol. Eng. 2017, 35, 879–888. [Google Scholar] [CrossRef]
- Lukiantchuki, J.A.; Bernardes, G.D.P.; Esquivel, E.R. Energy Ratio (ER) for the Standard Penetration Test Based on Measured Field Tests. Soils Rocks 2017, 40, 77–91. [Google Scholar] [CrossRef]
- Matsumoto, T.; Phan, L.T.; Oshima, A. Measurements of driving energy in SPT and various dynamic cone penetration tests. Soils Found. 2015, 55, 201–212. [Google Scholar] [CrossRef]
- Liao, X.B.; Zhu, L.W.; Wen, J. Influence of Different Hammer Cushion on Standard Penetration Hammer Energy. In Proceedings of the China Engineering Survey Academic Conference, Taiyuan, China, June 2016. [Google Scholar]
- Youd, T.L.; Bartholomew, H.W.; Steidl, J.H. SPT Hammer Energy Ratio versus Drop Height. J. Geotech. Geoenviron. Eng. 2008, 134, 397–400. [Google Scholar] [CrossRef]
- Honeycutt, J.N.; Kiser, S.E.; Anderson, J.B. Database Evaluation of Energy Transfer for Central Mine Equipment Automatic Hammer Standard Penetration Tests. J. Geotech. Geoenviron. Eng. 2014, 140, 194–200. [Google Scholar] [CrossRef]
- Anbazhagan, P.; Yadhunandan, M.E.; Kumar, A. Effects of Hammer Energy on Borehole Termination and SBC Calculation Through Site-Specific Hammer Energy Measurement Using SPT HEMA. Indian Geotech. J. 2022, 52, 381–399. [Google Scholar] [CrossRef]
- Anbazhagan, P.; Ayush, K.; Yadhunandan, M.E.; Siriwanth, K.; Suryanarayana, K.; Sahodar, G. Effective Use of SPT: Hammer Energy Measurement and Integrated Subsurface Investigation. Indian Geotech. J. 2022, 52, 1079–1096. [Google Scholar] [CrossRef]
- Abou-Matar, H.; Goble, G.G. SPT Dynamic Analysis and Measurements. J. Geotech. Geoenviron. Eng. 1997, 123, 921–928. [Google Scholar] [CrossRef]
- Lee, C.; Lee, J.; An, S. Effect of Secondary Impacts on SPT Rod Energy and Sampler Penetration. J. Geotech. Geoenviron. Eng. 2010, 136, 522–526. [Google Scholar] [CrossRef]

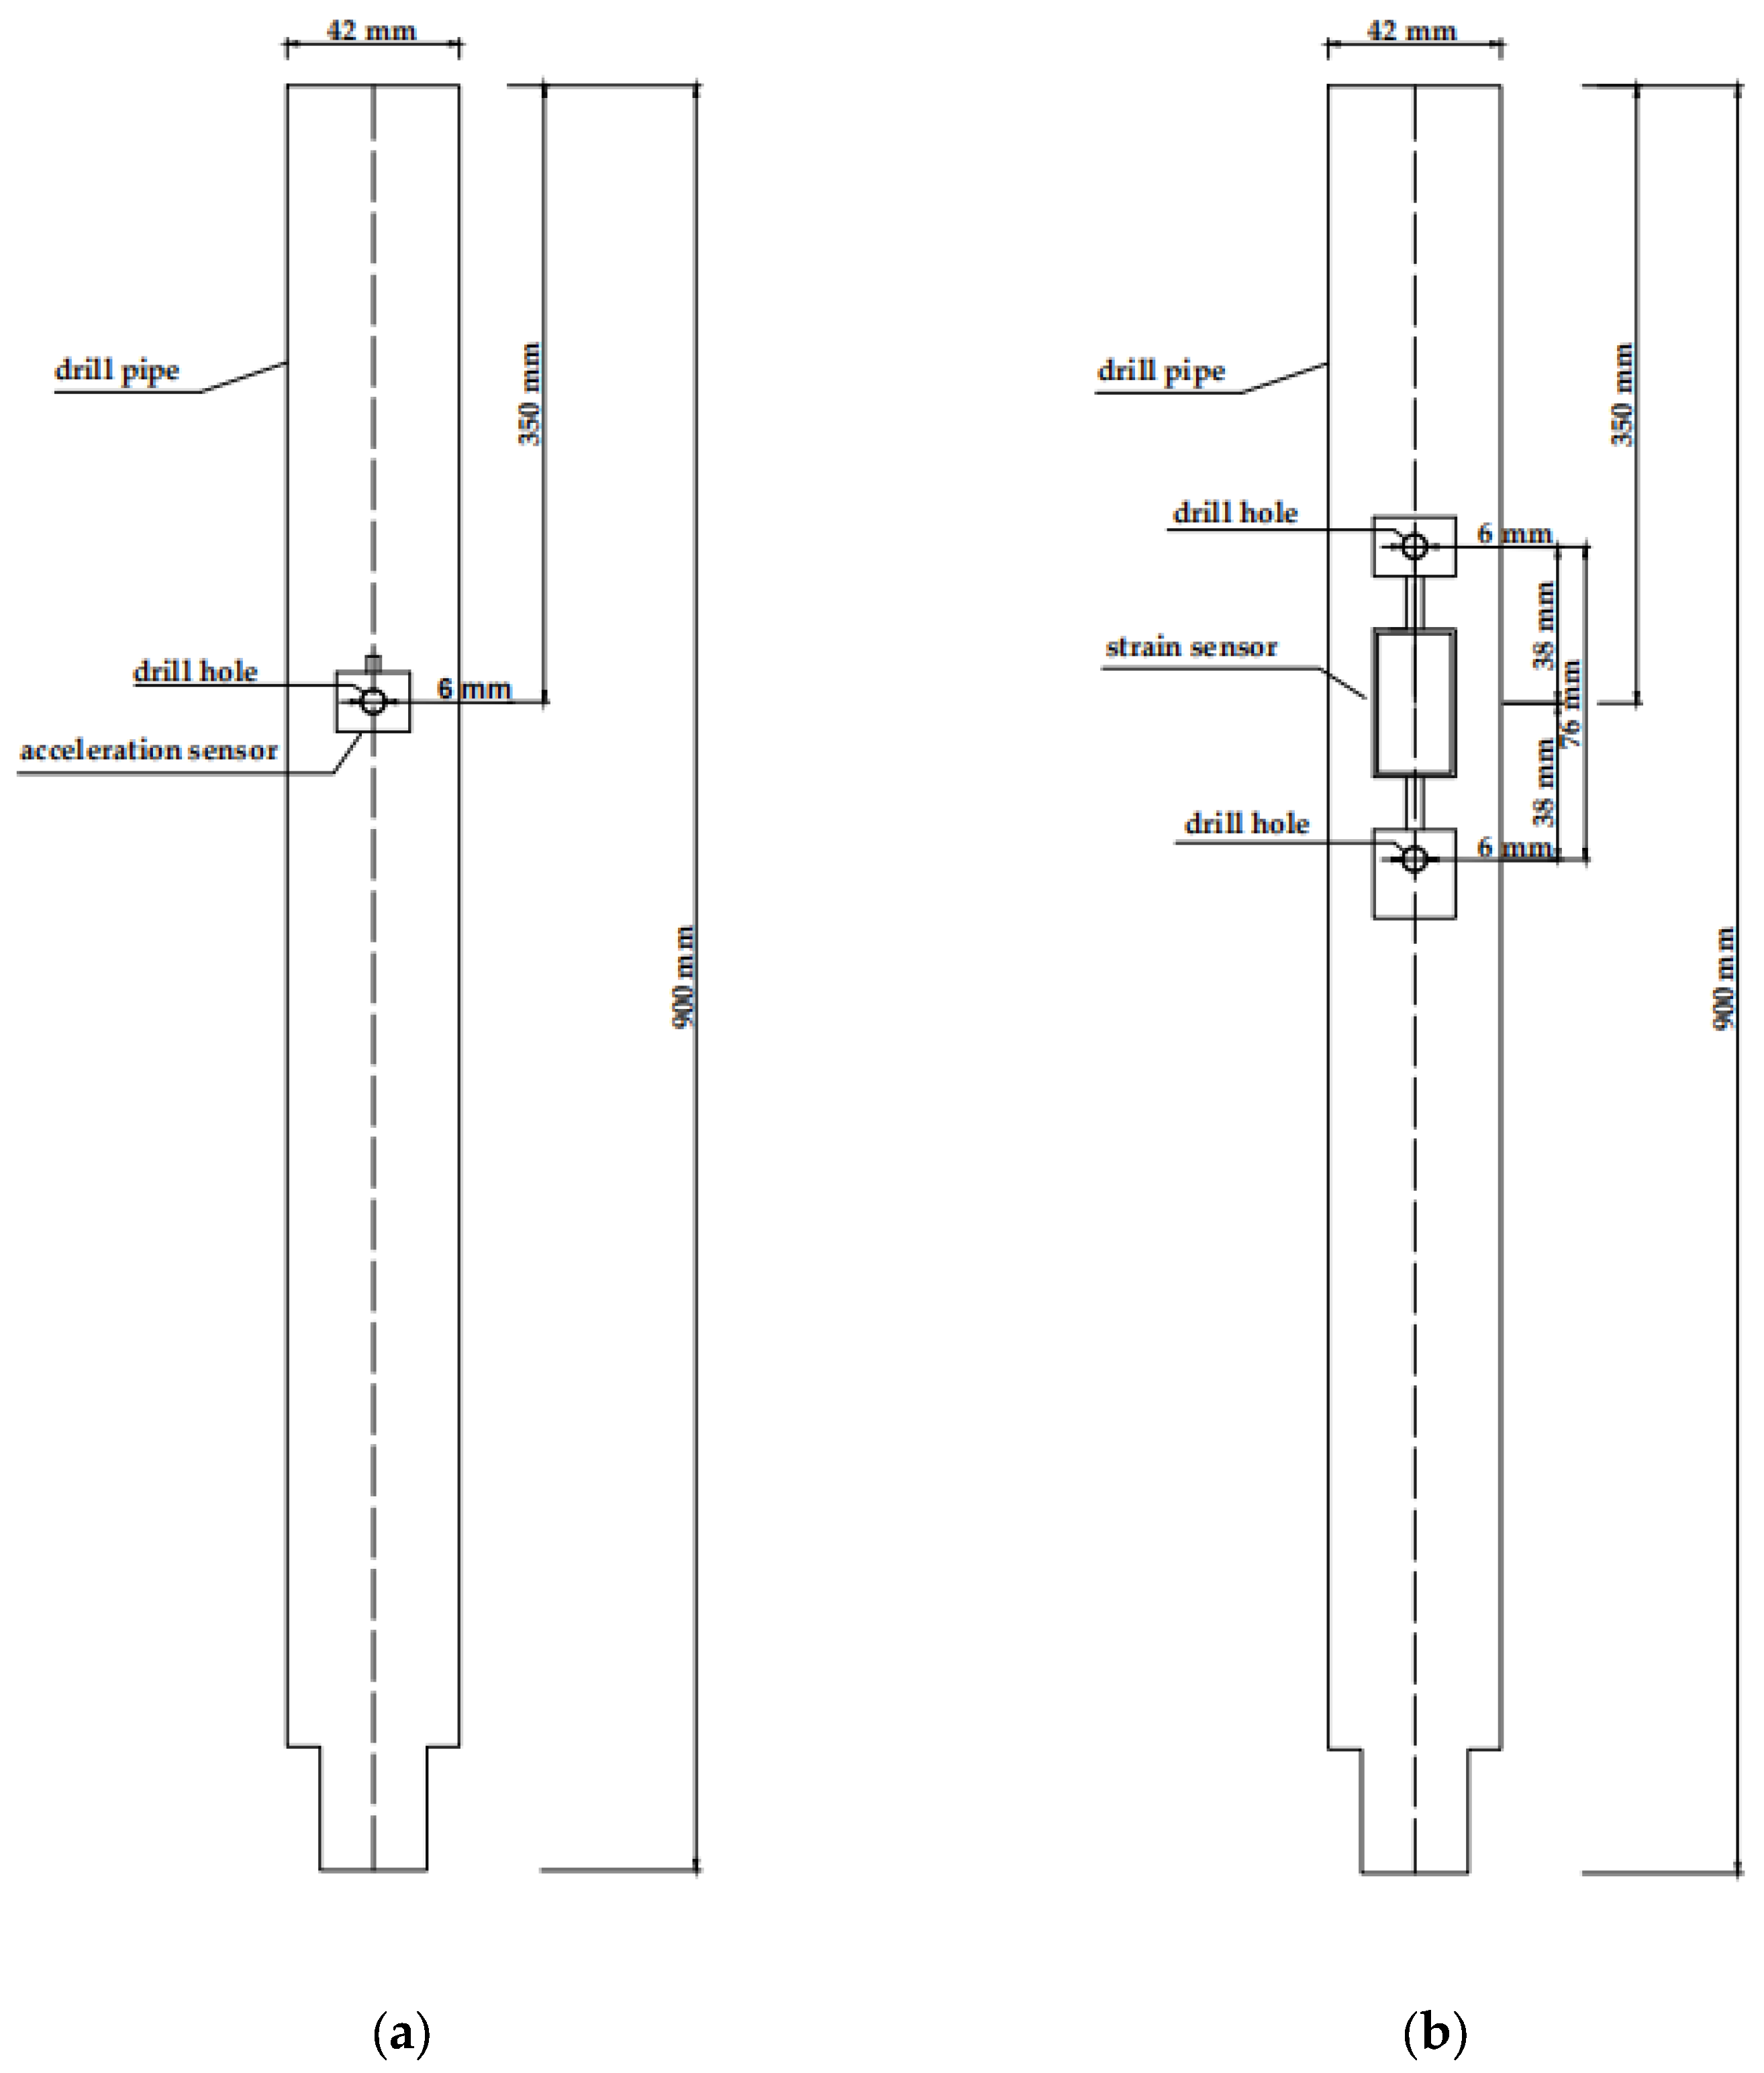



| Measurement Range (με) | Sensitivity (mV/V) | Weight (g) | Temperature Range (°C) | Overall Dimensions (mm) |
|---|---|---|---|---|
| 2000 | 3.37 | 90 | −30~80 | 115 × 37 × 11 |
| Sensitivity (Pc/g) | Frequency Range (kHz) | Weight (g) | Temperature Range (°C) | Overall Dimensions (mm) |
|---|---|---|---|---|
| 1.02 | 0.5~10 | 100 | −54~+120 | 80 × 27 × 25 |
| Measured Hammer Energy E (kJ) | Energy Transfer Efficiency ER (%) | Measured Hammer Energy E (kJ) | Energy Transfer Efficiency ER (%) |
|---|---|---|---|
| 0.3810 | 80.5 | 0.3749 | 79.3 |
| 0.3740 | 79.1 | 0.3807 | 80.5 |
| 0.3746 | 79.2 | 0.3887 | 82.2 |
| 0.4085 | 86.4 | 0.3678 | 77.8 |
| 0.3841 | 81.2 | 0.3705 | 78.3 |
| 0.3899 | 82.4 | 0.3913 | 82.7 |
| 0.3430 | 72.5 | 0.3860 | 81.6 |
| 0.3904 | 82.5 | 0.3685 | 77.9 |
| 0.3916 | 82.8 | 0.3787 | 80.1 |
| 0.3731 | 78.9 | 0.3603 | 76.2 |
| 0.3657 | 77.3 | 0.3687 | 77.9 |
| 0.3899 | 82.4 | 0.3541 | 74.9 |
| 0.3571 | 75.5 | 0.3555 | 75.2 |
| 0.3374 | 71.3 | 0.3599 | 76.1 |
| 0.3618 | 76.5 | 0.3235 | 68.4 |
| 0.3923 | 82.9 | 0.3982 | 84.2 |
| 0.3813 | 80.6 | 0.3792 | 80.2 |
| 0.3922 | 82.9 | 0.3608 | 76.3 |
| 0.3758 | 79.5 | 0.3970 | 83.9 |
| 0.3716 | 78.6 | 0.3445 | 72.8 |
| 0.3324 | 70.3 | 0.3719 | 78.6 |
| 0.3637 | 76.9 | 0.3696 | 78.1 |
Disclaimer/Publisher’s Note: The statements, opinions and data contained in all publications are solely those of the individual author(s) and contributor(s) and not of MDPI and/or the editor(s). MDPI and/or the editor(s) disclaim responsibility for any injury to people or property resulting from any ideas, methods, instructions or products referred to in the content. |
© 2023 by the authors. Licensee MDPI, Basel, Switzerland. This article is an open access article distributed under the terms and conditions of the Creative Commons Attribution (CC BY) license (https://creativecommons.org/licenses/by/4.0/).
Share and Cite
Ji, P.; Yang, J.; Zhang, N.; Zhai, Q.; Li, M.; Wang, Y.; Shen, T.; Satyanaga, A. Energy Measurement in Standard Penetration Tests. Sustainability 2023, 15, 4763. https://doi.org/10.3390/su15064763
Ji P, Yang J, Zhang N, Zhai Q, Li M, Wang Y, Shen T, Satyanaga A. Energy Measurement in Standard Penetration Tests. Sustainability. 2023; 15(6):4763. https://doi.org/10.3390/su15064763
Chicago/Turabian StyleJi, Peng, Jiling Yang, Nan Zhang, Qian Zhai, Minjie Li, Yueyi Wang, Tianlun Shen, and Alfrendo Satyanaga. 2023. "Energy Measurement in Standard Penetration Tests" Sustainability 15, no. 6: 4763. https://doi.org/10.3390/su15064763
APA StyleJi, P., Yang, J., Zhang, N., Zhai, Q., Li, M., Wang, Y., Shen, T., & Satyanaga, A. (2023). Energy Measurement in Standard Penetration Tests. Sustainability, 15(6), 4763. https://doi.org/10.3390/su15064763


