Article

Variation of Physico-Chemical Properties among Different Soil Orders under Different Land Use Systems of the Majha Region in North-Western India

1
Department of Soil Science, Punjab Agricultural University, Ludhiana 141004, India
2
Regional Research Station, Punjab Agricultural University, Gurdaspur 143521, India
3
Department of Chemistry, Punjab Agricultural University, Ludhiana 141004, India
*
Author to whom correspondence should be addressed.
Sustainability 2023, 15(6), 4779; https://doi.org/10.3390/su15064779
Submission received: 20 October 2022 / Revised: 6 December 2022 / Accepted: 7 December 2022 / Published: 8 March 2023
(This article belongs to the Section Sustainability in Geographic Science)

Abstract

:
The impact of different soil orders and land use systems on the distribution of physico-chemical properties is the most critical matter to address in order to maintain sustainable agricultural production. Hence, the present investigation was carried out to study the variation in the physico-chemical characteristics of soil in diverse land use systems (LUSs), i.e., agriculture, horticulture, and forestry, under major soil orders (entisol, inceptisol, and alfisol) in the Majha region of Punjab. A total of 225 depth-wise (at 0–20 cm, 20–40 cm, 40–60 cm, 60–80 cm and 80–100 cm) soil samples were collected from three land-use systems under different soil orders. The mean values of the physico-chemical properties ranged from 6.80–7.50, 7.64–8.34 and 6.94–7.87 for pH; 0.13–0.42, 0.19–0.54 and 0.19–0.46 dS m−1 for EC; 0.14–0.99, 0.21–0.69 and 0.15–0.72% for OC; 0.75–2.07, 1.07–3.32 and 0.93–2.29% for CaCO3; 7.77–41.84, 10.56–40.23 and 7.24–39.51 kg ha−1 for P; and 98.37–334.68, 94.51–230.18 and 93.01–367.39 kg ha−1 for K under different land uses in soil orders entisols, inceptisols and alfisols, respectively. Soil parameters including pH, CaCO3, and phosphorus (P) distribution differed significantly among soil orders; however, soil EC, organic carbon (OC) and available potassium (K) did not. The inceptisols under the agricultural land use system (ALUS) had the highest soil pH, EC, and CaCO3 values. The highest soil OC content was found in entisols under forest land use systems (FLUS), followed by horticultural land use systems (HLUS). The highest values of soil-available phosphorous (P) were found in FLUS under inceptisols, while the highest amounts of soil-available potassium (K) were found in entisols and alfisols under ALUS and FLUS, respectively. Thus, the distribution of physico-chemical properties under different LUSs in each soil order is highly variable and does not follow any particular trend. In general, soil properties such as OC, P, and K content decreased with an increase in soil depth, while pH and CaCO3 values increased with depth in all land uses and soil orders. There was a positive correlation between soil OC and EC, as well as available P and K in the soils investigated. The available P and K are negatively correlated with soil pH and CaCO3 content in the soil. The principal component analysis (PCA) revealed that soil pH and OC were the most variable soil parameters, which influence the availability of other physico-chemical properties under different soil orders and land use systems. Therefore, it is suggested that the land use systems play an important role in the distribution of physico-chemical properties of soil in different soil orders. The results of the study will help students, researchers, and agricultural management staff in managing different land uses for maintaining soil fertility and productivity in alluvial soils of North-western India.

1. Introduction

The state of Punjab covers an area of 5.03 mha (comprising 1.5% area of the country), of which 4.20 mha of land comes under cultivation. The state has varied climatic conditions, with large variations in nutrients content in soil. The soils of Punjab, in north-western India, developed from alluvium parent material deposited by the Indus system′s rivers. The state has been well-known for its agricultural activities and plantations, supplying 40–50% of the rice and 60–65% of the wheat in the central pool. Rising socio-economic demands and an increasing population put pressure on agricultural production systems, resulting in paradigm shifts in patterns of land use [1]. As agriculture becomes more advanced and intensive farming systems develop, there have been gradual losses in soil quality that have caused drastic reductions in yield. The rate of degradation of quality is governed by land use systems, the type of soil, topography, and climate factors. Several studies have indicated that inappropriate land use causes physicochemical and biological deterioration of the soil [2,3]. Changes in land use are considered to be an important component and a primary cause of global environmental change [4]. According to Heluf and Wakene, changes in land use and management practices frequently alter most physical, chemical, and biological characteristics of most soil, which has been reflected in agricultural production [5]. Different land use systems viz., agricultural (irrigated and rainfed), horticultural and forestry systems modify the physico-chemical characteristics of the soil as well as the nutrient content [6]. Dynamic properties such as soil organic matter (SOM), cation exchange capacity, soil pH, EC and texture are sensitive to land use practices and can provide valuable information about important soil processes such as nutrient cycling, decomposition and formation of SOM and overall productivity potential [7].
Land use systems and their management practices cause qualitative and quantitative changes in soil organic matter, which has a significant impact on the chemical, physical, and biological properties of the soil, which directly influence nutrient availability to plants [8]. Anthropogenic activities like input and management of the land use system, as well as the addition of plant litter, can all have a direct impact on soil properties. Land use and management changes can have a major impact on the organic matter properties of soil; conversion from forest to cropland, combined with conventional tillage and a lack of biomass return to soil, has been shown to reduce the degree of humification of the organic matter of soil [9,10]. Factors such as vegetation coverage, litter fall, root impact, and disturbance or management system can all contribute to major differences in surface soil organic carbon (SOC) and other soil properties across land use types [11,12]. Agricultural land use had significantly more available P and K than agroforestry and grassland systems in different soils of Punjab [13]. Datta et al. evaluated several land use types (Guava, Mango, Litchi, Jamun, Prosopis, Eucalyptus, and Rice-wheat cropping system) in alfisols and found that soil pH increased with depth, due to leaching and basic cation accumulation in the lower depth of the profiles in all land uses [14]. A few studies on soil orders found a higher OC status in inceptisols and alfisols. This might be due to the accumulation of more organic residues in the soils. The distribution of CaCO3 is also varied among soil orders and the highest calcium carbonate content was noticed in the aridisols, followed by the inceptisols, entisols, and alfisols [15]. Thus, the variability in the distribution of soil properties such as pH, EC, OC, CaCO3, and available P and K in different soils is greatly influenced by soil orders under different land use systems in the particular region [16].
The soils of the Majha region of Punjab belong to three soil orders viz., entisols, inceptisols and alfisols, out of twelve soil orders categorized according to the USDA taxonomic classification which are officially recognized as being in Punjab [17]. In the Majha region, the dominant area is occupied by inceptisols, followed by entisols and alfisols. Entisols serve as precursors to all other soil orders during their evolutionary history [18]. Inceptisols are relatively young soils that have fewer features than mature soils but retain a close resemblance to the parent material. Inceptisols are the most productive soils; they include soils from Ustic to Udic moisture regimes that have altered B horizons due to some chemical weathering processes [19]. On the other hand, alfisols are commonly found on stable geomorphic surfaces and developed over a wide range of parent materials. Sharma et al. studied alfisols, which are commonly associated with inceptisols and found on concave mountain slopes (Udic moisture regime), as well as the piedmont and plains (Ustic moisture regime). The major driving processes of alfisols are eluviation and illuviation [20]. Physico-chemical properties play an important role in nutrient availability in different group of soils. These properties in soil profiles not only depend on soil formation process, mineralogy, climate and topography of soil but are also influenced by the change in land use system in an area [16].
So far, little attention has been paid to monitoring the distribution of physico-chemical properties in different land use systems in the study area. Soil productivity in various land uses is directly related to the management and conservation of soil fertility over time. A detailed investigation of the processes leading to the delineation of various soil fertility parameters can aid in the breakthrough of ways and means to achieve sustainable high levels of production in various land use systems. Keeping in mind that several distinct land use systems exist in different soil orders with different fertility status, the present study aims to characterize the soil properties in different land use systems under distinct soil orders in the Majha region of Punjab. This investigation fills a knowledge gap regarding the variation of soil properties such as pH, EC, OC, CaCO3, available P and K in agriculture, horticulture, and forest land use systems falling in the entisol, inceptisol and alfisol soil orders. The outcome of the research will help students, researchers, scientists, and agricultural administrators in managing various land use systems with the aim of preserving soil fertility and productivity of different land use systems in distinct soil orders in the Majha region of Punjab in north-western India.

2. Materials and Methods

2.1. Geographical Area and Location

The Punjab state lies between 29°33′ N and 32°32′ N latitude and 73°53′ E to 76°56′ E longitude (Figure 1). It has an average elevation of 300 m (980 feet) above sea level. An investigation was carried out in order to study the variations of physico-chemical properties under different land use systems in dominant soil orders in the Majha region of Punjab at Punjab Agricultural University, Ludhiana, during 2019–2022. This region consists of four districts, i.e., Amritsar, Gurdaspur, Pathankot, and Tarn-Taran, having three dominant soil orders: entisols, inceptisols, and alfisols. It is characterized by three main land use systems such as agriculture, horticulture, and forestry. Wheat, rice, maize, sugarcane, peas, potato, tomato, oil seeds, and pulses are the most important crops grown in the agricultural system. The main fruit crops in the horticultural system are mango, guava, peach, rock pear and litchi. Mixed forest, poplar, and eucalyptus plantations are the most important forest land use systems in this region. Agricultural systems are characterized by the use of chemical fertilizers and farmyard manure. Crop waste management methods differ depending on the type of agricultural area. Farmers burn crop waste after harvesting their summer crops to clear their fields and prepare for the next sowing. Crop waste, on the other hand, is being incorporated into the soil in some areas. Because of the heavy use of machinery and farm equipment, the subsurface soils under agricultural fields (primarily the rice-wheat cropping system) were extremely hard as depth increased. Horticultural land use systems were characterized by the addition of organic residues through leaf litter and the application of chemical fertilizer and manures. However, some horticultural fields were not properly managed and thus accumulated less organic matter. The regular addition of organic residues in the form of leaves and other debris distinguished the forest land use systems.

2.2. Site Selection and Sample Collection

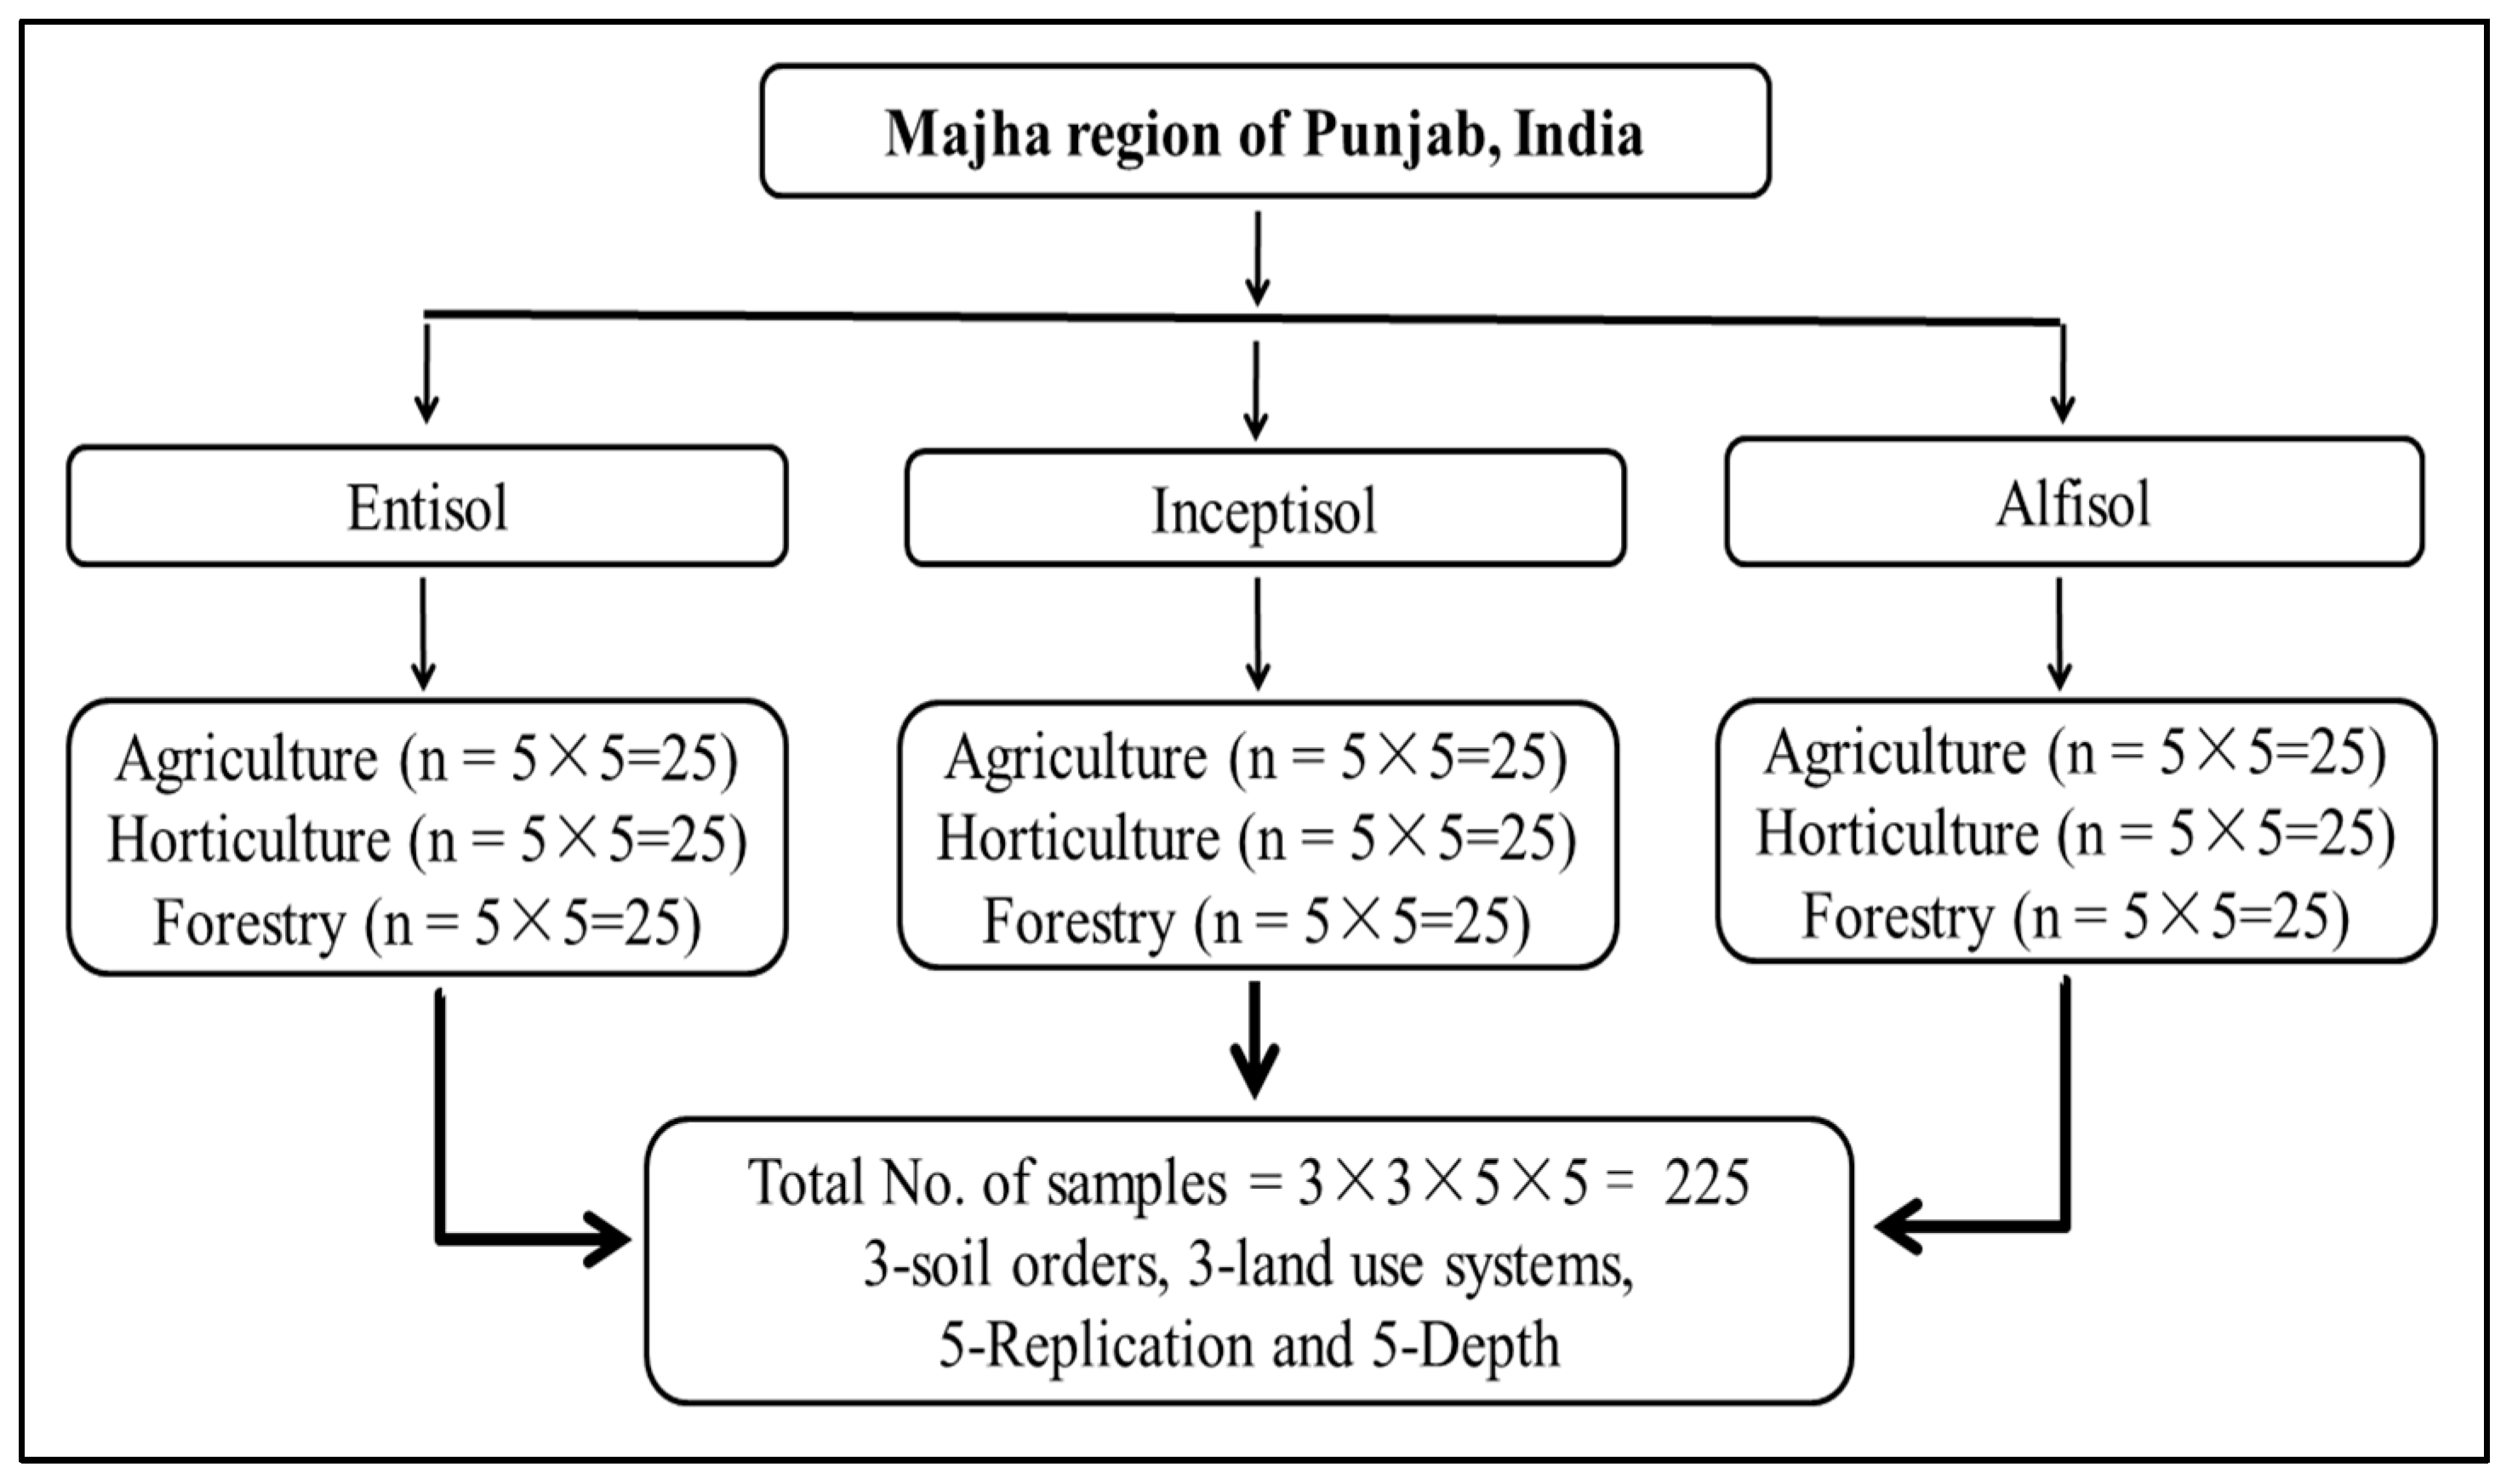
Three dominant land use systems, i.e., agriculture, horticulture and forest, were selected under each soil order (entisol, inceptisol and alfisol) in the Majha regions of Punjab. Depth-wise soil samples (0–20 cm, 20–40 cm, 40–60 cm, 60–80 cm and 80–100 cm) were collected from five locations for each land use system in all soil orders in the region using a stainless-steel auger, and the global positioning system of each profile was recorded. Figure 2 depicts the classification of land use systems within each soil order in the Majha regions of Punjab. In the study area, three soil orders were recognized. Three LUSs were identified in each soil order, five replications were considered in each LUSs, and soil samples were collected at five depths in each replication. Thus, a total of 225 samples (45 locations, 5 depths) were collected from three land use systems in all soil orders for the present study.

2.3. Analysis of Soil Samples

The standard methodologies were used to ascertain different physico-chemical parameters for soil. A glass electrode pH meter (Elico, LI-120, Hyderabad, India) was used to determine the pH from soil suspension in water at a ratio of (1:2), after keeping the same supernatant solution at equilibration for 24 h, the EC was determined using a conductivity bridge (Elico, CM-183, Hyderabad, India) and expressed in dS m−1 [21]. Soil organic carbon (SOC) levels were determined in soil samples using a potassium dichromate rapid titration method and the results were expressed as a percentage [22]. The titration of soil suspension with 0.5 N H2SO4 in the presence of bromothymol blue and bromocresol green indicators yielded the calcium carbonate concentration of soil, which was reported as a percentage [23]. The available phosphorus (P) was extracted from the soil using 0.5 M NaHCO3 and the content of P in the extract was measured by stannous chloride reduced molybdophosphric acid blue color in HCl system by using spectrophotometer measured at 760 nm wavelength and the results were represented in kg ha−1 [24]. The available potassium (K) in the soils was extracted using neutral N normal ammonium acetate in a 1:5 soil to extractant ratio and the concentration of K contained in the extract was evaluated using a flame photometer [25].

2.4. Statistical Analysis

Using the Agricolae package included in the R programming language, distribution patterns of several physico-chemical characteristics (at various soil orders, land use systems and depth) were subjected to an ANOVA. The Tukeys post-hoc test of significance was used to determine the level of significance (p-value < 0.05). Using R programming, the Pearson correlation coefficient was used to calculate correlations between various soil parameters. Using the Devtools and Factoextra packages included in R programming, principal component analysis (PCA) was carried out on a correlation matrix between the 6 variables of various physico-chemical parameters among different soil orders and land use systems.

3. Results and Discussion

3.1. Variation of Soil pH under Soil Orders under Different Land Use Systems

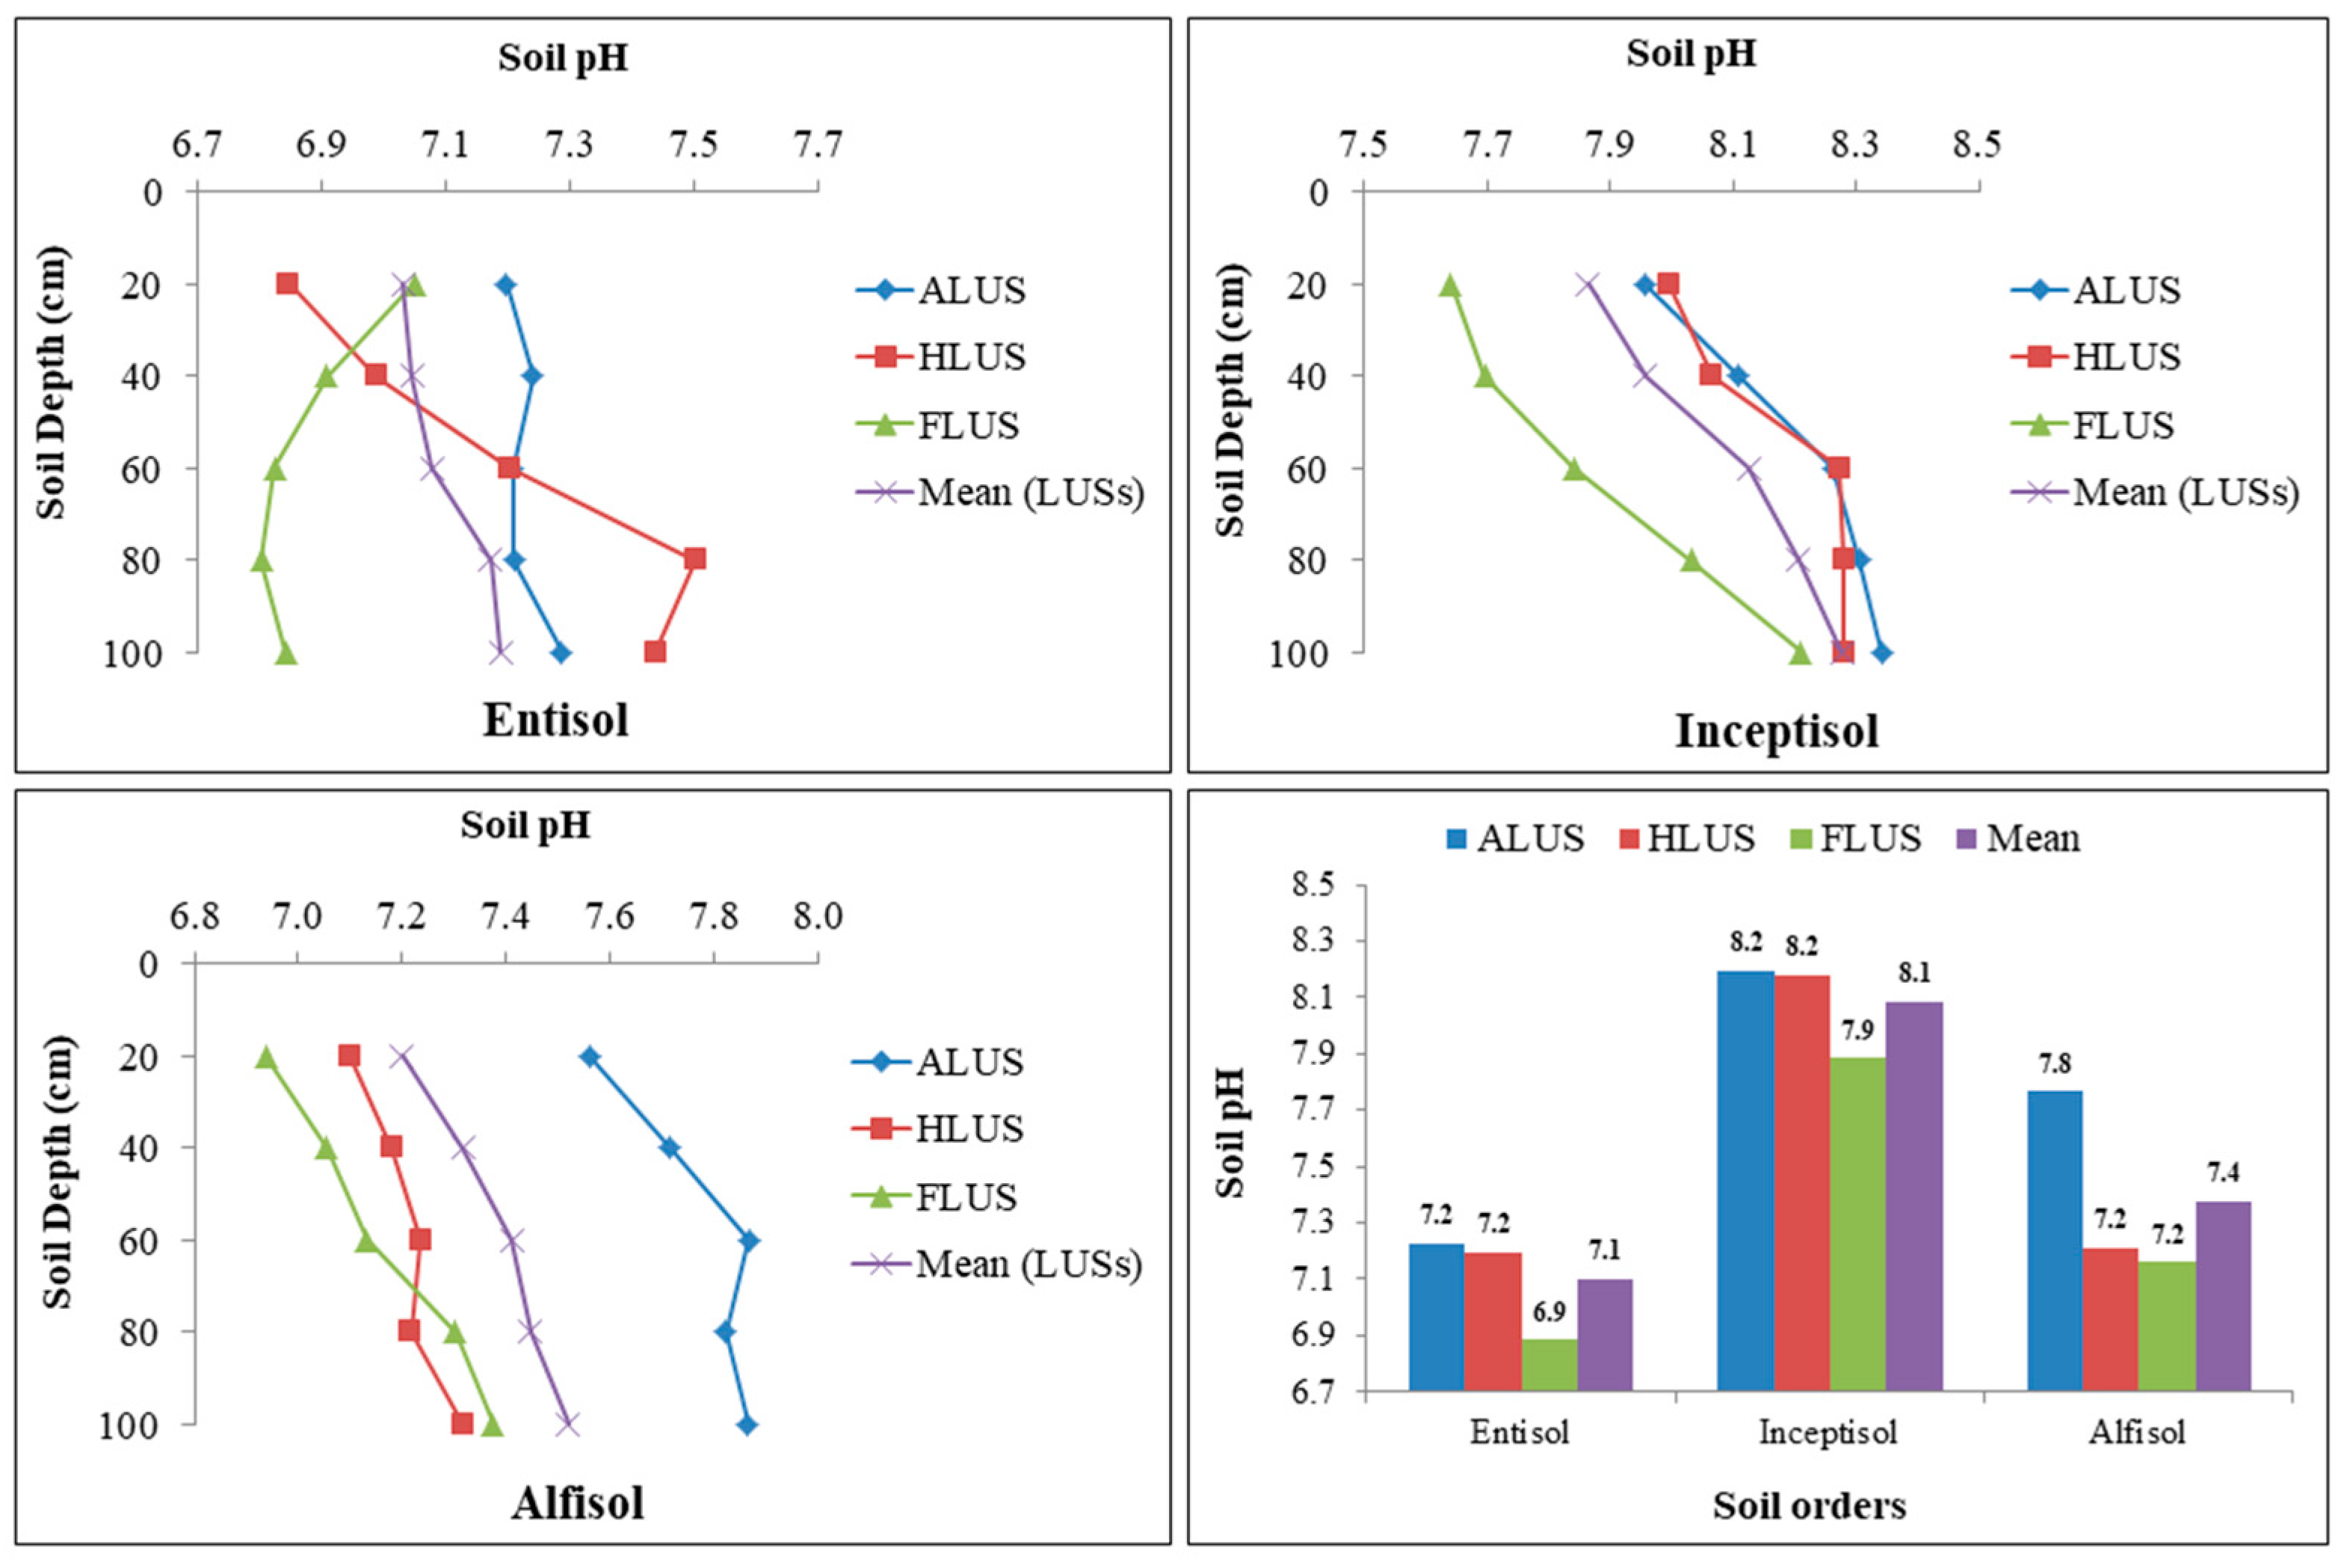
The distribution pattern of soil pH at various soil orders under different land use systems is presented in Figure 3. Soils under all three soil orders were neutral to slightly alkaline in nature, and optimal for most of the crops. In the soil profiles of various land use systems, the soil pH is varied from 6.80 to 7.50 in entisols, 7.64 to 8.34 in inceptisols and 6.94 to 7.87 in alfisols. In each soil order, the impact of soil depth and LUSs on soil pH distribution varies greatly. The pH in entisols varies significantly among different land use systems, while depth does not. The highest pH values were found in agricultural and horticultural LUSs, whereas the lowest values were found in FLUS. All the LUSs and depth had a significant impact on soil pH in the inceptisol. When compared to ALUS and HLUS, FLUS exhibited significantly lower soil pH. In all land use systems, soil pH is much lower in surface horizons and increases with depth. Different LUSs significantly affect the soil pH in alfisols, although depth has no significant impact on soil pH. ALUS had the highest soil pH and FLUS had the lowest soil pH in alfisols. A perusal of the data revealed that soil orders and land use systems (LUSs) had a significant impact on soil pH. Among soil order, highest average soil pH (8.09) was observed in inceptisols, followed by alfisols (7.38) and entisols (7.10). Among the examined soils, the highest pH was observed in inceptisols under ALUS. This might be due to a higher concentration of base-forming cations provided by fertilizers and chemical amendments added to the soil. Entisols and alfisols, on the other hand, have a lower pH, possibly owing to agricultural wastes and litter fall from the forest land use system continually adding organic matter to these soils, and the breakdown of the litter also releasing weak organic acids [16]. Several studies have found a similar trend in soil pH [7,26]. Irrespective of the soil orders, the soil pH was found to increase with depth in the profiles [13,15]. The subsurface leaching of basic cations and salts to the deeper layer of soil under all systems results in the gradual rise in the pH of soils with depth [7,27].

3.2. Variation of Soil Electrical Conductivity (EC) under Soil Orders under Different Land Use Systems

The data provided in Figure 4 demonstrated the variation of soluble salt concentration, i.e., soil EC in profiles of various soil orders under different land use systems. The EC values in the soil profiles of various land use systems ranged from 0.13 to 0.42, 0.19 to 0.54 and 0.19 to 0.46 dS m−1 in entisols, inceptisols and alfisols, respectively. The distribution of soil EC did not differ significantly across soils from different LUSs under entisols; however, soil depth has a significant impact on the variance of soluble salts in the soil profile of investigated soils. Significantly higher soil EC was observed under the surface horizon, and soluble salt concentration decreased with an increase in depth in all the land use systems of entisols. The depth of the soil has no influence on the salt concentration in profiles, while the distribution of soil EC varies significantly among distinct LUSs within the inceptisols soil order. ALUS and HLUS had significantly higher soil EC than FLUS. In alfisols, LUSs has a significant influence on the distribution of EC, but there is no significant variation in soil depth. FLUS had significantly higher soil EC when compared to agricultural and horticultural LUSs in alfisols. The distribution of soil EC among LUSs in entisol, inceptisol and alfisols follows the order HLUS > FLUS > HLUS, ALUS > HLUS > FLUS and FLUS > ALUS > HLUS, respectively. The mean values of soil orders are shown to have a non-significant influence on the distribution of soil EC. Among different soil orders, the highest value of EC (0.34 dS m−1) was recorded in the profile of inceptisols, followed by alfisols (0.29 dS m−1) and lowest EC value (0.28 dS m−1) was observed in the entisols. The higher EC in inceptisols under ALUS could be attributed to greater evaporation, and excessive usage of fertilizer salts, which results in the deposition of soluble salts [16], resulting in increased salt build-up in soils [28]. In general, the lower values of EC in entisols and alfisols could be attributed to sandy loam texture, which allows free leaching of soluble salts, and also due to low amounts of soluble salts in the original deposits [15]. The EC in soils changed significantly as the soil depth increased. Irrespective of soil orders and LUSs, there was no specific pattern in the distribution of soil EC among soil profiles, but it showed a subsequent decrease as depth increased. The EC of the surface layer was higher, which might mean more nutrient ions at the surface; however, as depth increased, the EC in the profile decreased as nutrient ions declined [29]. Similar patterns of decreasing soil EC with an increase in depth of all the land uses have been observed [7,13].

3.3. Variation of Soil Organic Carbon (SOC) under Soil Orders under Different Land Use Systems

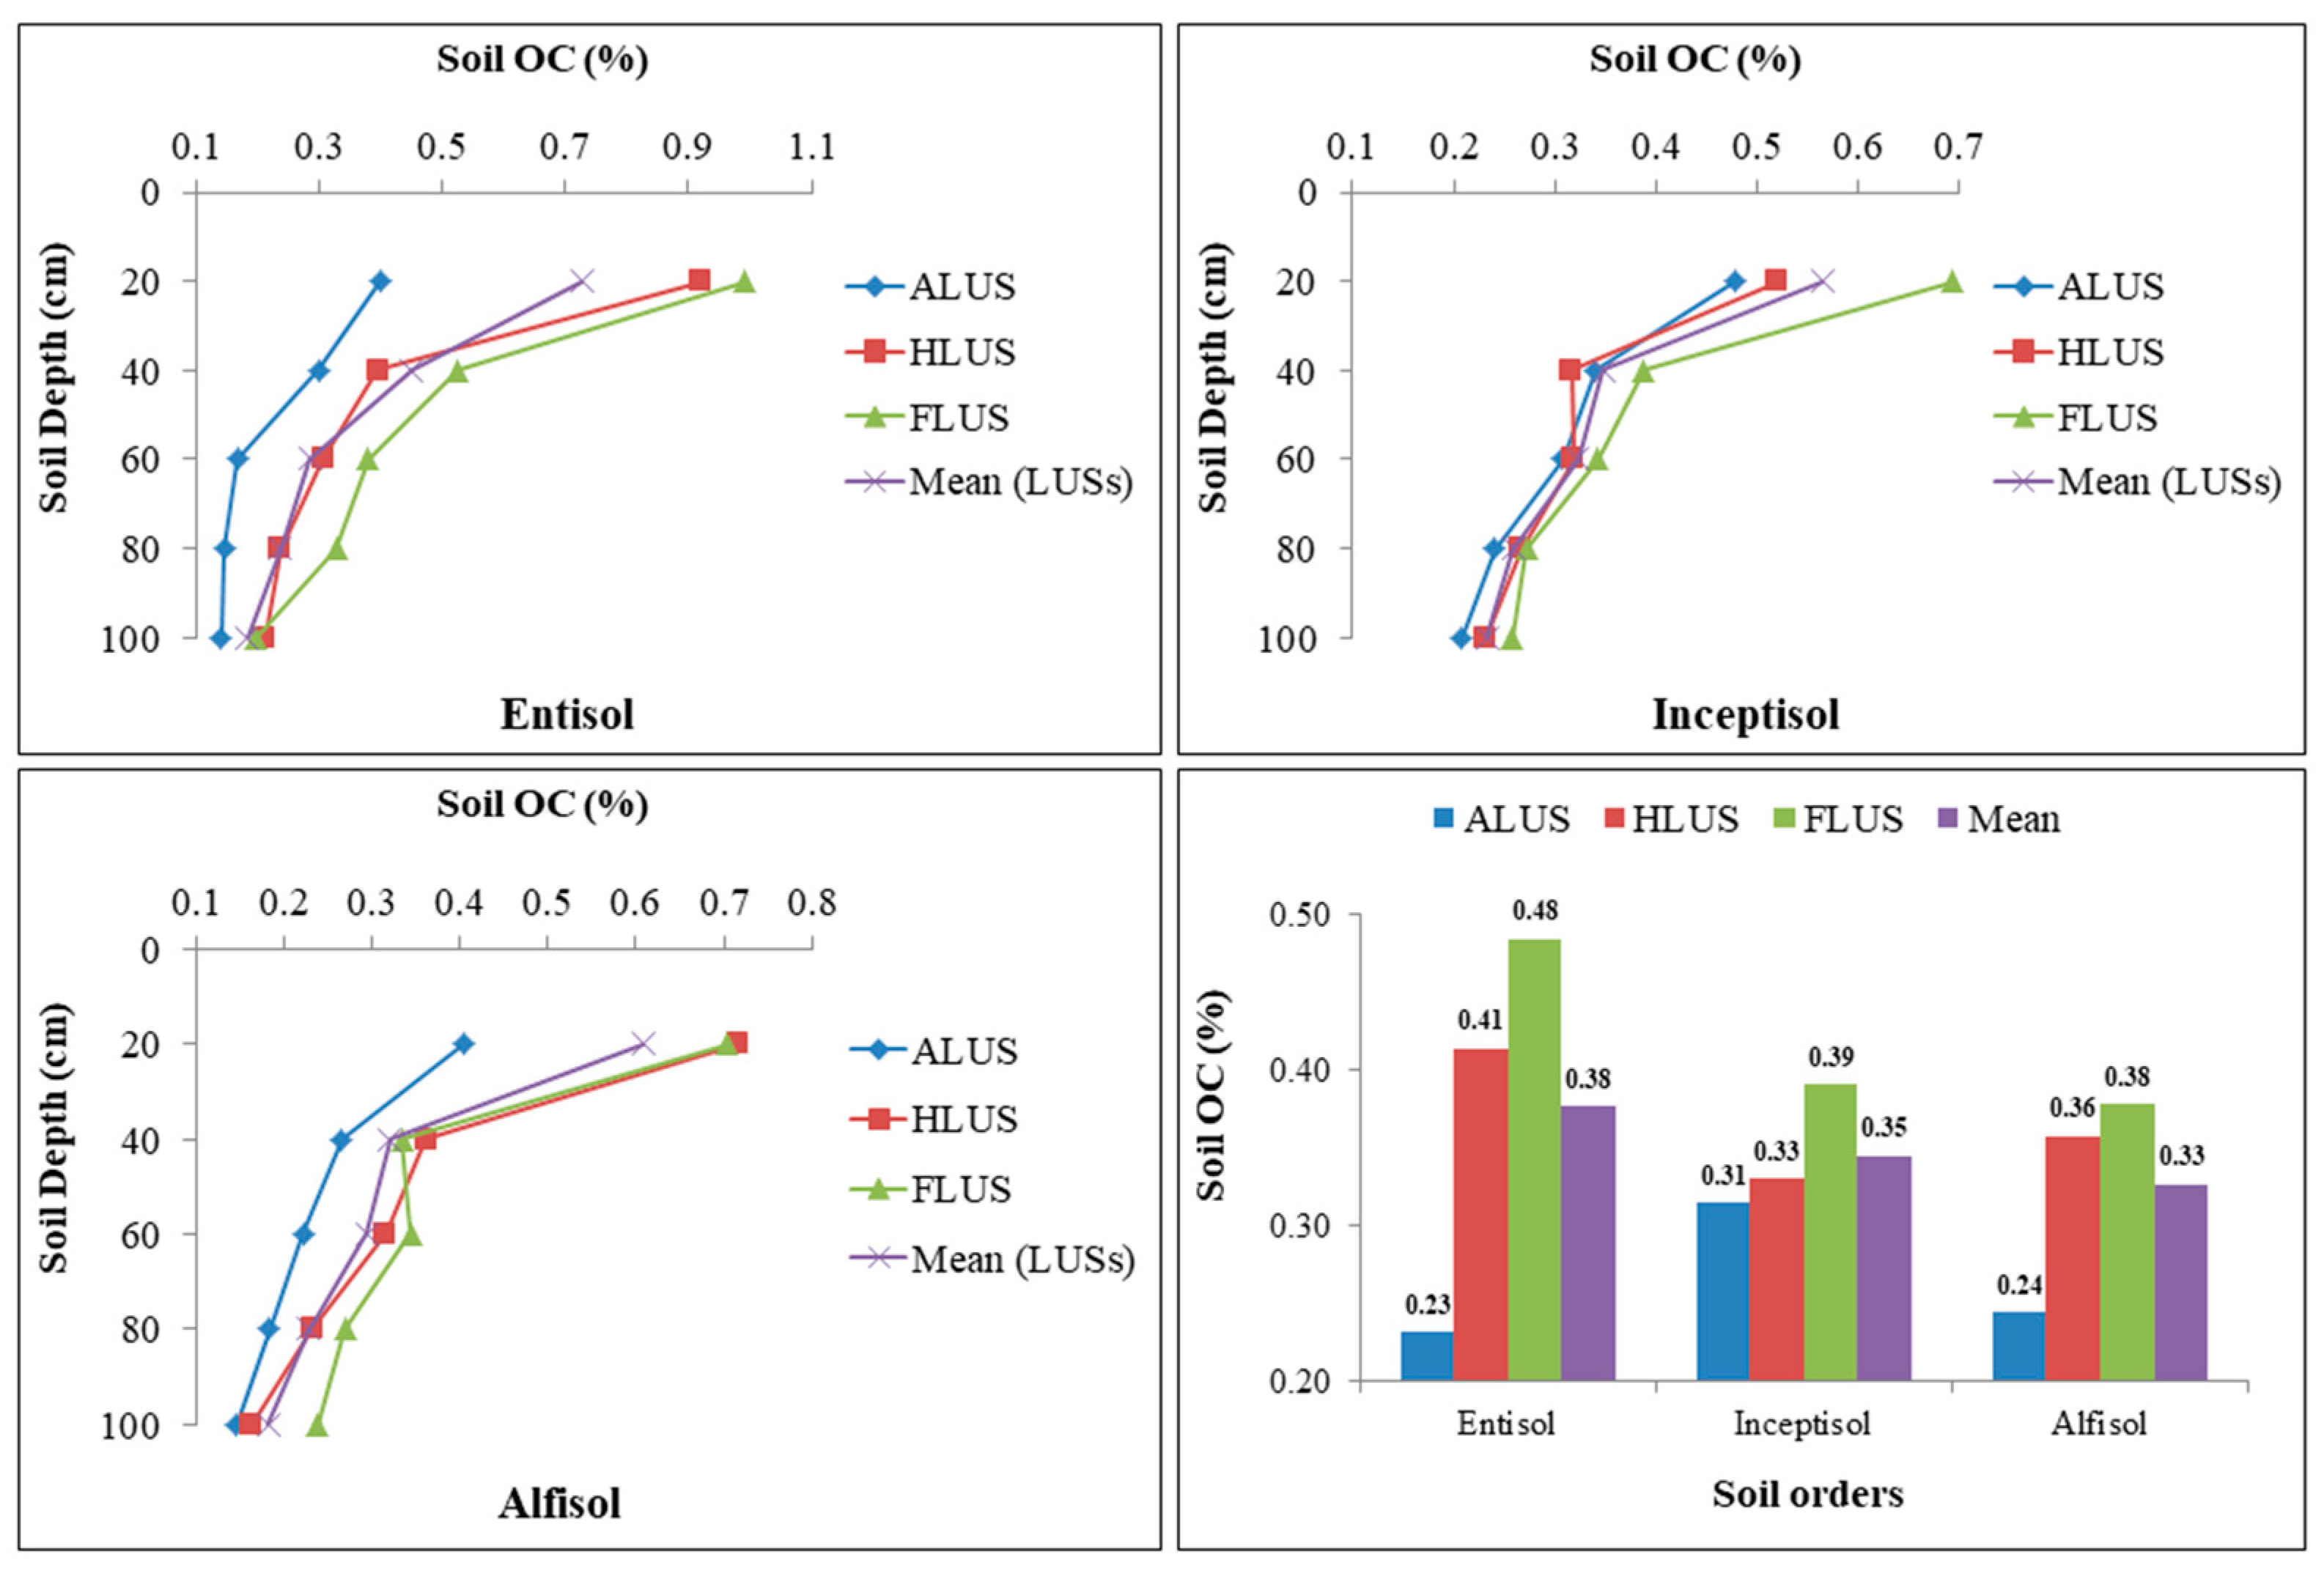
The status of soil organic carbon in profiles of different soil orders is shown in Figure 5. The results revealed that in each soil order, depth had a significant impact on the distribution of SOC content, whereas all the LUSs in the entisol and alfisol soil orders have a substantial impact on SOC except for the inceptisols. In all the soil orders, the mean values of SOC were highest in FLUS, followed by HLUS and comparatively lowest in ALUS. Irrespective of soil orders and LUSs, the surface soils had substantially larger SOC concentrations than subsurface layers in all soil profiles investigated. The SOC varied substantially between 0 to 20 and 20 to 40 cm soil depth, but not between 40 to 60, 60 to 80 and 80 to 100 cm soil depth. In all soil orders, the 80 to 100 cm depth had the lowest soil OC levels. The organic carbon content in the Majha region of Punjab typically declines due to the hyperthermic soil temperature regime. The soil OC in soil profiles of various land use systems ranged from 0.14 to 0.99% in entisols, 0.21 to 0.69% in inceptisols and 0.15 to 0.72% in alfisols. The distribution of SOC is not significantly affected among different soil orders in the region. Among the soil orders studied, entisols under FLUS had a higher SOC content than other soil orders due to there being more organic residues via leaf litter and other plant residues (roots, stubbles), whereas alfisols had the lowest concentration due to their limited vegetation and widespread erosion impact, resulting in a lower OC status in these soils [16]. Furthermore, the prolonged and intensive cultivation and other agricultural activities that increased the mineralization of organic residues, along with the activity of soil microorganisms, may be the cause of the low level of SOC in alfisols and entisols [15,30]. Nevertheless, higher OC in entisols attributed to adequate moisture availability, which led to better vegetation growth. As a result, these soils have higher levels of organic residue and consequently, more OC in the soil [30]. In addition, lower temperatures and prolonged rainfall intensity and duration favor higher OC in soil [20]. FLUS are more productive than ALUS in terms of resource capture and biomass growth, resulting in increased carbon inputs to the soil. Soil carbon in FLUS is facilitated by inputs from litter production and turnover, as well as soil stabilization processes [3,4]. The maximum OC level was found at the surface, owing to litter and organic residue deposition, regardless of soil orders or land use systems and this decreased with depth [29]. A similar pattern of decreasing OC content with depth has been documented [28]. In general, the organic carbon content of arid and semi-arid soils was low, which might be attributed to the poor biological activity or the quick degradation of organic biomass under frequent torrid conditions [31].

3.4. Variation of Soil Calcium Carbonate (CaCO3) under Soil Orders under Different Land Use Systems

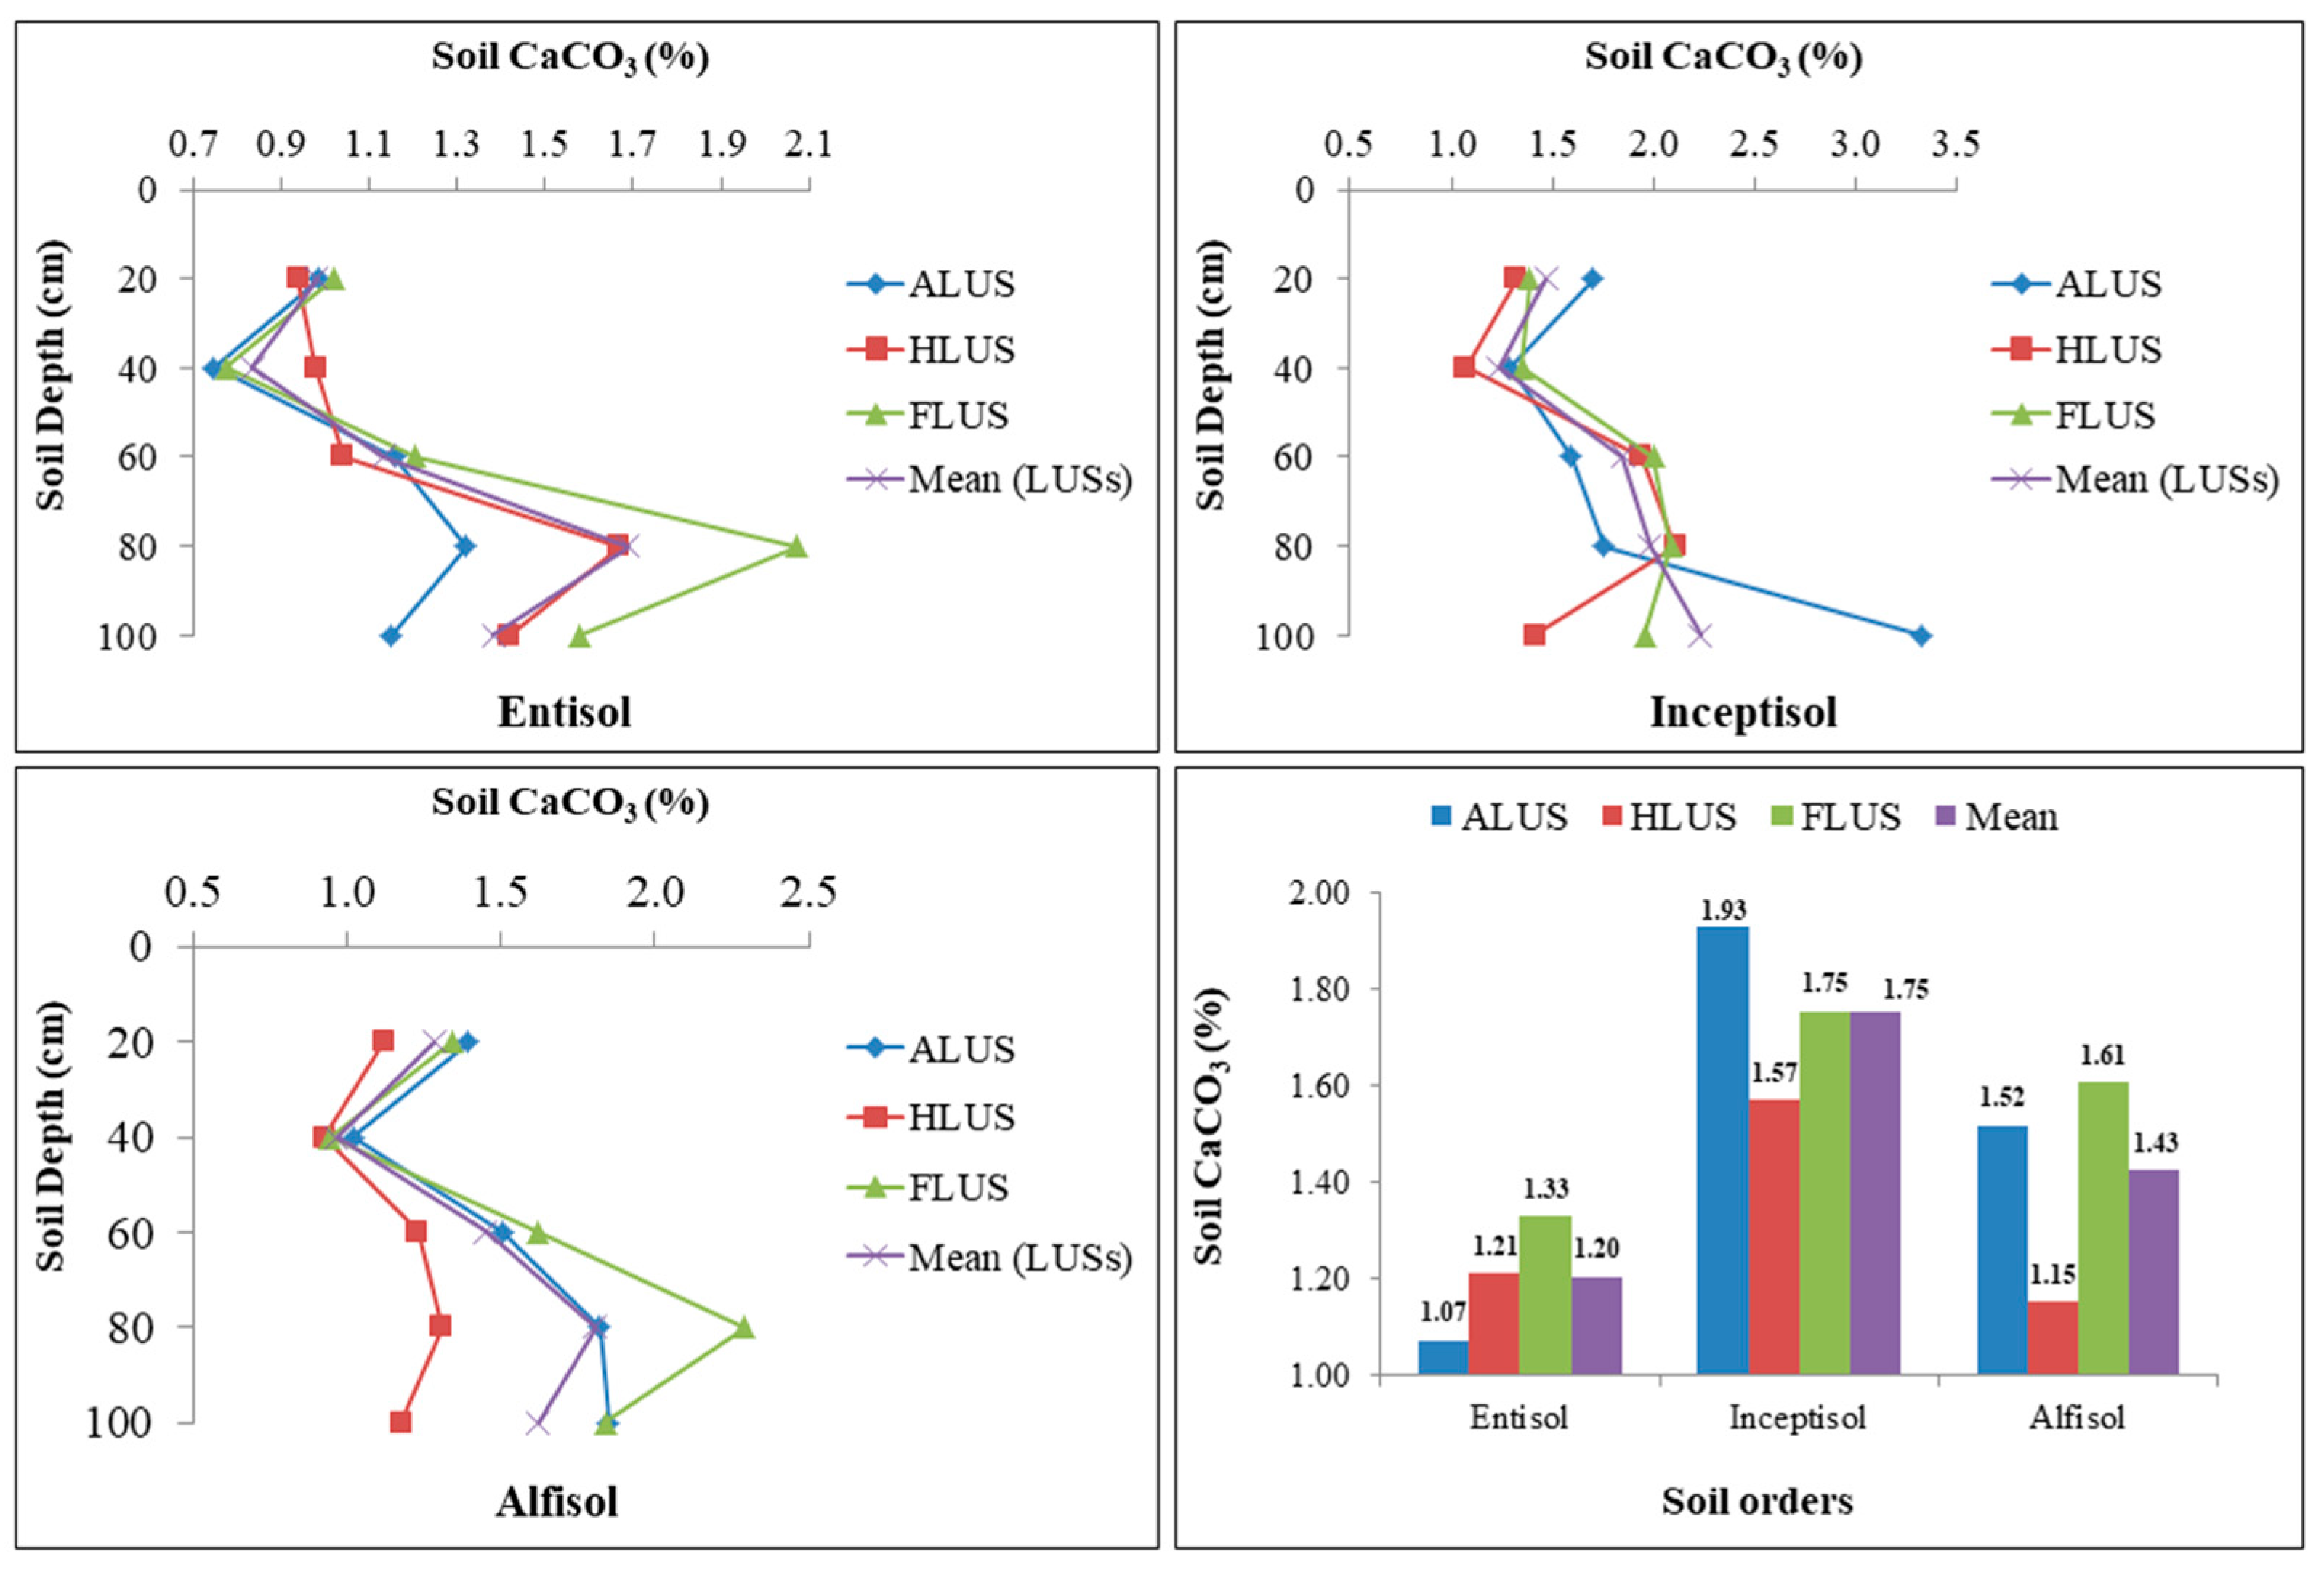
The variation of CaCO3 in different soil orders are given in Figure 6. The CaCO3 in soils of different land use systems varied from 0.75 to 2.07% in entisols, 1.07 to 3.32% in inceptisols and 0.93 to 2.29% in alfisols. The data illustrated that there is a significant variation in CaCO3 content among the different soil orders at various depths. The interesting feature of the study was the presence of calcium carbonate in all the profiles of the soil orders. In each soil order, the impact of land use systems and depth on calcium carbonate concentration is highly variable. Land use system and depth did not significantly affect the distribution of CaCO3 under inceptisols. ALUS and FLUS both had the highest concentrations; however, FLUS had a lower concentration. The CaCO3 composition of the entisol and alfisol profiles is significantly influenced by land use systems and depth. Among the three land uses in entisol soil order, FLUS had a significantly higher CaCO3 concentration, followed by HLUS and the lowest was recorded in ALUS. In the alfisols, however, significantly higher values were detected in FLUS and ALUS than to HLUS. Thus, there was no specific trend in the distribution of calcium carbonate in soils of distinct LUSs. Based on the results of the study, the distribution of CaCO3 differs significantly among land use systems in all the soil orders except inceptisols. Thus, the results indicate the impact of land use systems on the distribution of CaCO3 in each soil order in the Majha region. The distribution of CaCO3 is also affected by soil formation process, mineralogy and climate of a particular region [28]. The highest percentage of CaCO3 (1.75%) was recorded in inceptisols, followed by alfisols (1.43%) and entisols (1.20%). When compared to other soil orders, the higher concentration of inceptisols may be the result of a greater accumulation of CaCO3 throughout the soil profiles. However, there was no trend in the depth-wise distribution of calcium carbonate in soils of different LUSs. The literature revealed that the irregular distribution of CaCO3 with depth was caused by the soil′s alluvial nature. Regardless of the soil orders and land uses, the values of CaCO3 varied considerably from one another and increased with depth [32]. The leaching of calcium, which then precipitated as carbonate at a lower depth, suggested that a larger concentration of CaCO3 was associated with depth. Similar findings were also reported in the literature [33]. The CaCO3 leaching might be caused by high permeability and sand content in all land uses. As a consequence, the drainage system, water supply and soil depth, all played a role in the variation of CaCO3 in different LUSs among soil orders [34]. In addition to rainfall and temperature, irrigation water quality, soil texture and parent material of an area all affect the distribution of calcium carbonate in different soil orders under various LUSs [35].

3.5. Variation of Available Phosphorus (P) under Soil Orders under Different Land Use Systems

The distribution of available P in studied soils was found to be significantly influenced by soil orders and land use systems at various depths (Figure 7). The available P in soil profiles of various land use systems ranged from 7.77 to 41.84, 10.56 to 40.23 and 7.24 to 39.51 kg ha−1 in entisols, inceptisols and alfisols, respectively. The distribution of P in land use systems of all soil orders did not follow any trend. The pattern of available P in entisol, inceptisol and alfisols is as follows: HLUS > ALUS > FLUS, FLUS > HLUS > ALUS and ALUS > FLUS > HLUS. ALUS had higher available phosphorus content in alfisols than in forest and horticulture, which could be attributed to the use of P fertilizers in agricultural fields [36]. Forest and horticultural LUSs had the highest P levels in inceptisols and entisols, which could be attributed to the frequent addition of organic residues, during decomposition which releases more available P in soils. This variability effectively shows the impact of land uses and their management strategies on soil available P in different soil orders in an area. Soil P is much greater in the surface layers of all soil profiles studied, and it declines as depth rises. When compared to the land use systems of entisols and alfisols, agricultural, horticultural and forest systems in inceptisols had a comparatively higher quantity of available P, resulting in significantly higher available P in inceptisols, followed by entisols (20.21 kg ha−1) and alfisols (19.72 kg ha−1). The higher amount of P in inceptisols might be due to the addition of organic matter through leaf litter (from HLUS and FLUS) and the continuous application of fertilizers in ALUS in the soils [37]. Several factors, including soil amendments, farming methods and weather patterns, have a substantial impact on the widely varying P concentration in distinct soil orders under various land use systems. The amount of P was higher on the surface soils but decreased with an increase in depth of all soil orders, which might be attributable to its higher release proportion to the larger accumulation of organic matter on the surface of the soil [7]. The decrease in the concentration with depth might be due to the constant decline in content and organic matter addition in soils [31]. Intensive farming, inadequate application of organic manures and P fertilizers, ongoing exclusion of crop residues and resulting nutrient decline in various soils may all be contributing factors to the decline in available P in the soil profiles of several LUSs [38].

3.6. Variation of Available Potassium (K) under Soil Orders under Different Land Use Systems

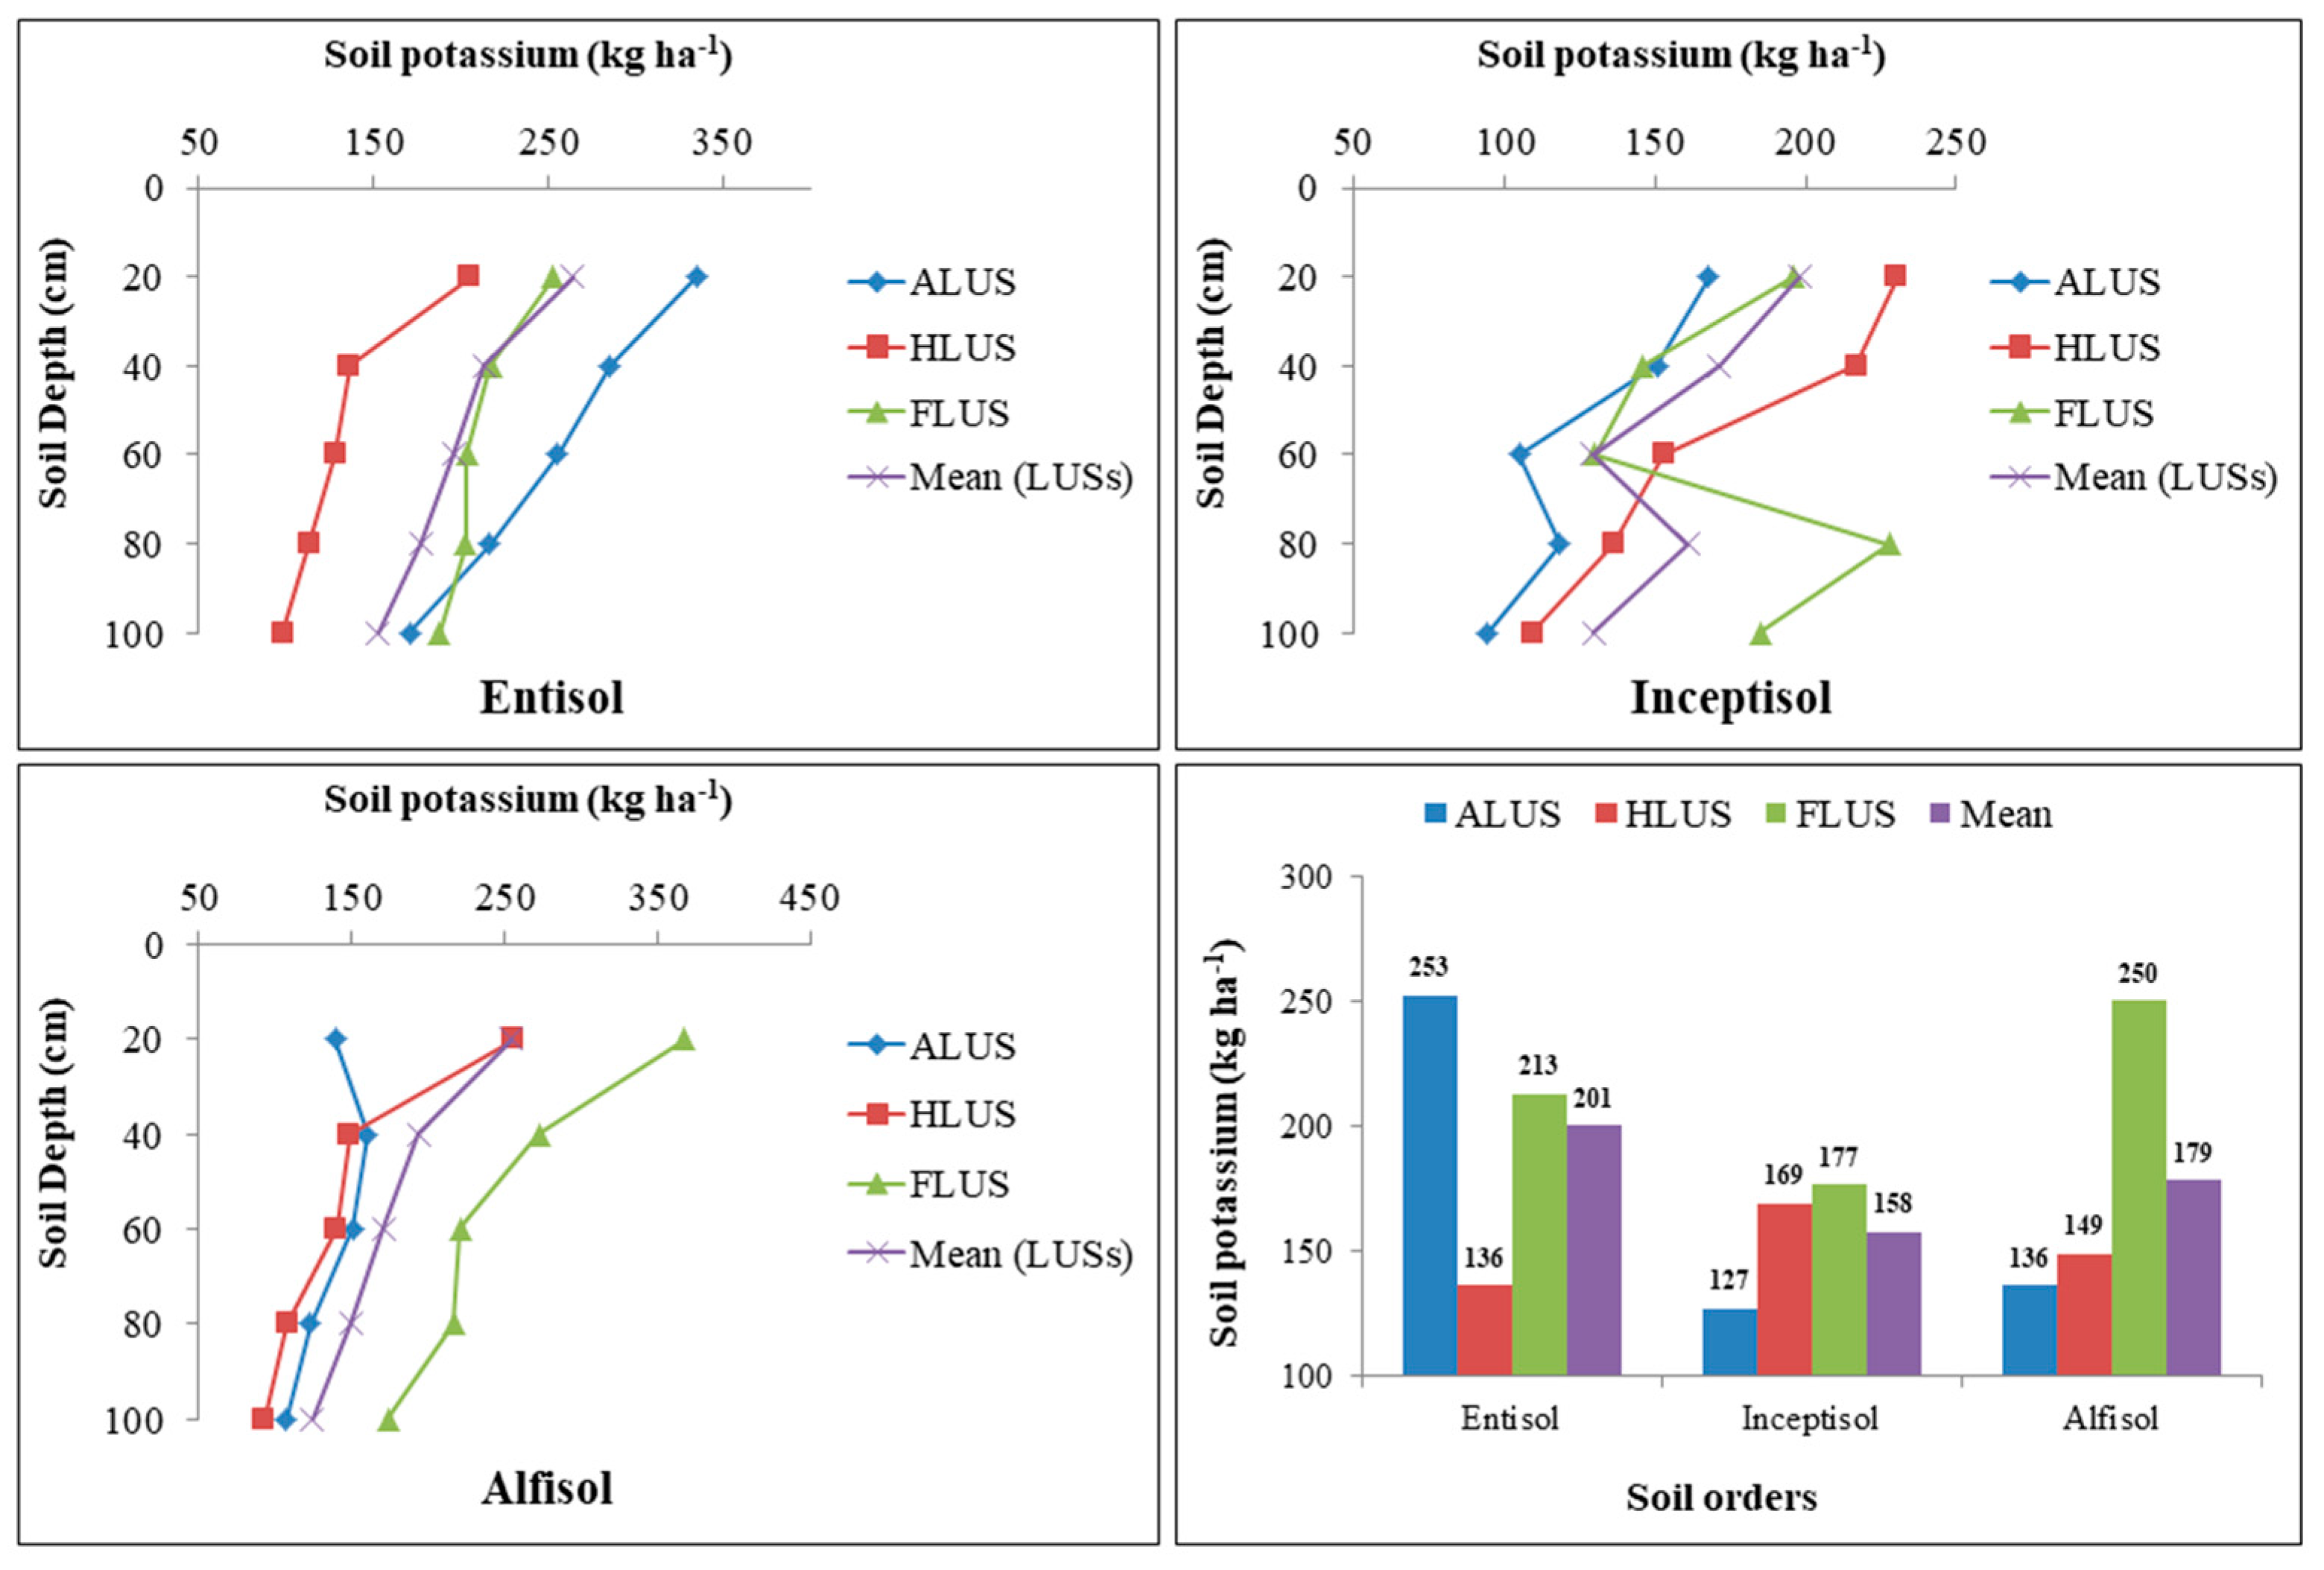
The results presented in Figure 8 indicated the variability of available K in soil orders of the Majha region of Punjab. The available K in all of the examined soils was greater in soil profiles across all land use systems and ranged from 98.37 to 334.68, 94.51 to 230.18 and 93.01 to 367.39 kg ha−1 in entisols, inceptisols and alfisols, respectively. In each soil order, the variation of soil K is differed among land use systems and depth. The study reported that land use systems and depth strongly affected the available K in alfisols, but there was no significant variation was observed in entisols and inceptisols. In alfisols and inceptisols, the highest available K was found in FLUS, followed by HLUS and the lowest amount was found in ALUS; however, in entisols, ALUS recorded the highest amount of available K, followed by FLUS and HLUS. The high available K values in FLUS might be attributable to nutrient recycling caused by dropping leaves of different tree species [13]. Soil orders were found to have a non-significant effect on available K distribution in various soils. Among the soil orders investigated, higher available K was observed in entisols (200.59 kg ha−1), followed by alfisols (178.58 kg ha−1) and inceptisols (157.76 kg ha−1). The distribution of available K in soil follows a distinct geomorphic pattern and is heavily influenced by parent material, weathering, particle size and management practices. The majority of potassium in soil is in the form of minerals such as feldspars and micas [39]. Entisols had the highest amount of available K when compared to inceptisols and alfisols, which correlates strongly to the governance of minerals rich in K as well as the addition of a higher proportion of OM, which aided in the restoration of soil nutrient status [15]. Regardless of soil orders, the surface layer recorded the highest quantity of available K, but it decreased as depth increased. The replenishing of soil with organic matter through crop residues and the addition of animal manures were both responsible for the greatest amount of K in the surface horizons [21]. The decrease in the concentration with depth might be due to the constant decline in content and organic matter addition in soils [40]. Our findings are in agreement with many other studies [41,42]. The soils are very rich in K. It is therefore advisable that farmers apply the requisite amount of potassium to replenish its removal by the respective crops of the system, so that pressure on soil K reserve may be avoided, which may otherwise result in a negative balance in soil in near future. Thus, multiple factors such as depth, soil amendments and climatic conditions under different land-use systems all contributed to increased soil available K content.

3.7. The Correlation Studies between Various Physico-Chemical Parameters

The correlation analysis was carried out between soil physico-chemical parameters of the soils examined (Table 1). The analysis revealed that soil available P showed a significantly positive correlation with EC (p < 0.01 and r = 0.47) and OC (p < 0.01 and r = 0.66). However, it showed a negative correlation between with pH (r = −0.03) and CaCO3 (p < 0.01 and r = −0.38). The available soil K was positively associated with EC (r = 0.26), OC (p < 0.01 and 0.46), but significantly negatively correlated with soil pH (p < 0.01 and r = −0.46) and CaCO3 (p < 0.05 and r = −0.35) content in soil. Depth-wise distribution of CaCO3 was significantly negatively associated to OC (p < 0.05 and r = −0.35) but positively correlated with soil pH (p < 0.01 and r = 0.52) and EC (r = 0.01). Soil OC was found to be significantly negatively correlated with pH (p < 0.05 and r = −0.31), but showed a positive correlation with EC (p < 0.05 and r = 0.38). The distribution of EC with pH showed a non-significant positive correlation (r =0.15) in the soils studied.

3.8. Principal Component Analysis for the Determination of Most Variable Factor among Several Soil Parameters under Different Soil Orders and Land Use Systems of Majha Region

Principal component analysis (PCA) exhibited the general sensitivity pattern of soil parameters and most variable parameters based on the factor loadings from each principal component (PC) (Table 2 and Figure 9). High eigenvalue principal components (PCs) were considered to represent the maximum variations among different soil properties [43]. The findings show that the first two principal components (PC1 and PC2) with >1 eigenvalues explained 69.83 percent of the total variances in the original dataset. The amount of variability expressed by PC1 47.19%, with an eigenvalue of 2.83, which indicates that soil pH had the highest positive factor loading value, i.e., 0.55, and that it contributes 30.44% in the total variations of soil properties. The PC1 was specified to the pH factor of the soil. The second principal component (PC2) explained about 22.63% of the variance, with an eigenvalue of 1.35 and the highest positive loading value was for OC (0.68), which contributes 46.92% in the total variation among other soil variables. The PC2 was specified to the SOC factor. In accordance with the PCA analysis of the various soil parameters, soil pH, followed by SOC, were the most significant factor that contributes to and represents the most variability in determining the soil quality across different LUSs and soil orders in the Majha region. The soil pH and OC are two of the most important basic soil properties which influence the availability of macro and micronutrients under different LUSs. The SOC is a measure of the quality and quantity of soil organic matter under agricultural, horticultural and forest land uses in all the soil orders. The frequent accumulation of soil organic matter under forest and horticulture land use systems increases SOC content, thereby increasing the availability of nutrients and maintaining soil fertility and productivity. In the first principal component of PCA-biplot, among various land uses and soil orders, the ALUS and HLUS under inceptisols had the highest positive loadings and represent the greatest variability in the examined soils. Thus, soils of inceptisols have greater soil pH, which reflects the maximum variability among various soil parameters and governs the availability of most of the essential nutrients to the crops in the Majha region. In the second component, the FLUS under alfisols and entisols had the maximum positive loadings, while ALUS had the highest negative loadings in all soil orders. Poor land use and management strategies made significant contributions to soil degradation, which lowers soil fertility and productivity [44,45]. Hence, FLUS has the potential to improve soil fertility and reduce soil degradation, by improving the physico-chemical properties of soil in horticultural and agricultural systems.

4. Conclusions

The distribution of physico-chemical properties varies under different soil orders and land use systems at different depths in profiles of the soil samples examined. The results of the research indicated that soil pH, CaCO3 and available P content in soil significantly varied among different soil orders, whereas EC, SOC and available K were not significantly influenced by soil orders. The highest soil pH, EC and CaCO3 values were reported in inceptisols, followed by alfisols and the lowest values were found in entisols. The pattern of SOC variation in soil orders is as follows: entisol > inceptisols > alfisols. Inceptisols had the highest available P, followed by entisols and alfisols. Entisols had the highest amount of available K, followed by alfisols and inceptisols. In all soil orders, the distribution of the physico-chemical properties of soil under different land use systems did not follow any specific trend. When compared to other land uses, the agriculture system had the highest values of soil pH, EC, CaCO3 and the lowest amount of SOC in the soils studied. The forest land use system reported maximum soil OC and available K status in the region. In general, the values of pH and CaCO3 increased with depth, attributed to the leaching and accumulation of basic cations in the sub-surface layers of the soil profile. As the depth of the soil increases, soil properties such as OC, P and K levels gradually decrease in all the land uses. The constant decline in content and addition of organic matter in soils may be the cause of the decrease in concentration with depth. The principal component analysis (PCA) reported that soil pH and OC were the most variable soil parameters, which influence the availability of other physico-chemical properties under different soil orders and land use systems. The study′s findings indicated that in agriculture systems, SOC levels are lower because soil organic matter is in relatively poor condition, and that in order to preserve soil fertility and productivity, proper management strategies are considered necessary. The soils contained a large amount of K in all the soils examined. Therefore, it is advised that farmers apply the necessary amount of potassium to replace that which is lost by the various crops in the system. The physico-chemical properties of soil play an important role in the availability of nutrients in the soil, which is a major concern for efficient crop production. Hence, it may be concluded that the variation in the distribution of soil physico-chemical properties in different soil orders is highly affected by the land use systems of the regions. However, there is a need to investigate the other physical, chemical and biological properties of soil profiles for a better understanding of the effects of existing land use systems in different soil orders of the Majha region. The results of the current study might be of great importance to researchers, state agricultural officers and farmers in implementing nutrient management strategies in different land use systems for sustainable crop production.

Author Contributions

Conceptualization, V.S. and G.V.; Methodology, G. and M.K.; Software, G. and M.K.; Formal analysis, S.S.D.; Resources, S.S.D. and J.S.; Data curation, G.V. and J.S.; Writing—original draft, G. and V.S.; Writing—review & editing, M.K.; Supervision, S.S.D.; Project administration, V.S.; Funding acquisition, S.S.D. All authors have read and agreed to the published version of the manuscript.

Funding

This research received no external funding.

Institutional Review Board Statement

Not applicable.

Informed Consent Statement

Not applicable.

Data Availability Statement

All data are available in the manuscripts.

Conflicts of Interest

The authors declare no conflict of interest.

References

  1. Seto, K.C.; Woodcock, C.E.; Song, C.; Huang, X.; Lu, J.; Kaufmann, R.K. Monitoring Land-Use Change in the Pearl River Delta using Landsat TM. Int. J. Remote Sens. 2002, 23, 1985–2004. [Google Scholar] [CrossRef]
  2. Saikh, H.; Varadachari, C.; Ghosh, K. Changes in Carbon, N and P Levels due to Deforestation and Cultivation: A Case Study in Simplipal National Park of India. Plant Soil 1998, 198, 137–145. [Google Scholar] [CrossRef]
  3. He, Z.L.; Alva, A.K.; Calvert, D.V.; Li, Y.C.; Banks, D.J. Effects of N Fertilization of Grape Fruit Trees on Soil Acidification and Nutrient Availability in a Riviera Fine Sand. Plant Soil 1999, 206, 11–19. [Google Scholar] [CrossRef]
  4. Turner, B.L.; Skole, D.; Sanderson, S.; Fischer, G.; Fresco, L.; Leemans, R. Land-Use and Land-Cover Change: Science/Research Plan; Arizona State University: Tempe, AZ, USA, 1995. [Google Scholar]
  5. Heluf, G.; Wakene, N. Impact of Land Use and Management Practice on Chemical Properties of Some Soils of Bako Area, Western Ethiopia. Ethiop. J. Nat. Resour. 2006, 2, 177–197. [Google Scholar]
  6. Ally-Said, M.; Canisius, K.K.; Douglas, N.A.; Paul, O.A.; Frank, B.G.; Gabriel, O.D.; Philip, O.O.; Ayub, V.O.O. Effects of Land Use Change on Land Degradation Reflected by Soil Properties along Mara River, Kenya and Tanzania. J. Soil Sci. 2015, 5, 20–38. [Google Scholar]
  7. Mandal, A.; Toor, A.S.; Dhaliwal, S.S. Effect of Land-Uses on Physico-Chemical Properties and Nutrient Status of Surface (0–15 cm) and Sub-Surface (15–30 cm) Layers in Soils of South-Western Punjab, India. Int. J. Curr. Microbiol. Appl. Sci. 2018, 7, 2659–2671. [Google Scholar] [CrossRef]
  8. Franchini, J.C.; Crispino, C.C.; Souza, R.A.; Torres, E.; Hungria, M. Microbiological parameters as indicators of soil quality under various soil management and crop rotation systems in southern Brazil. Soil Tillage Res. 2007, 92, 18–29. [Google Scholar] [CrossRef]
  9. Lal, R.; Kimble, J.M. Conservation Tillage for Carbon Sequestration. Nutr. Cycl. Agroecosystems 1997, 49, 243–253. [Google Scholar] [CrossRef]
  10. Yang, Z.H.; Singh, B.R.; Sitaula, B.K. Soil Organic Carbon Fractions under Different Land Uses in Mardi Watershed of Nepal. Commun. Soil Sci. Plant Anal. 2004, 5, 615–629. [Google Scholar] [CrossRef]
  11. DeGryze, S.; Six, J.; Paustian, K.; Morris, S.J.; Paul, E.A.; Merckx, R. Soil Organic Carbon Pool Changes Following Land Use Conversions. Glob. Change Biol. 2004, 10, 1120–1132. [Google Scholar] [CrossRef] [Green Version]
  12. Chen, Y.; Xu, X.; Ruan, H. Soil Labile Carbon in Secondary Quercusvariabilis Forest and Pinustaeda Plantation in Hilly Area of South Jiangsu, China. Chin. J. Ecol. 2007, 26, 2028–2034. [Google Scholar]
  13. Kaur, R.; Bhat, Z.A. Effect of Different Agricultural Land-Use System on Physico-Chemical Properties of Soil in the Sub-Mountainous District of Punjab. J. Pharm Phytochem. 2017, 6, 226–233. [Google Scholar]
  14. Datta, A.; Basak, N.; Chaudhari, S.K.; Sharma, D.K. Soil Properties and Organic Carbon Distribution under Different Land Uses in Reclaimed Sodic Soils of North-West India. Geoderma Reg. 2015, 4, 134–146. [Google Scholar] [CrossRef]
  15. Sharma, B.D.; Choudhary, O.P.; Chanay, J.K.; Singh, P.K. Forms and Uptake of Manganese in Relation to Soil Taxonomic Orders in Alluvial Soils of Punjab, India. Commun. Soil Sci. Plant Anal. 2016, 47, 313–327. [Google Scholar] [CrossRef]
  16. Dhaliwal, S.S.; Sharma, V.; Kaur, J.; Shukla, A.K.; Hossain, A.; Abdel-Hafez, S.H.; Gaber, A.; Sayed, S.; Singh, V.K. The Pedospheric Variation of DTPA-Extractable Zn, Fe, Mn, Cu and other Physicochemical Characteristics in Major Soil Orders in Existing Land Use Systems of Punjab, India. Sustainability 2021, 14, 29. [Google Scholar] [CrossRef]
  17. Soil Survey Staff. Keys to Soil Taxonomy, 12th ed.; USDA-Natural Resource Conservation Service, Government Printing Office: Washington, DC, USA, 2014.
  18. Soil Survey Staff. Soil Taxonomy: A Basic System of Soil Classification for Making and Interpreting Soil Surveys, 2nd ed.; U.S. Department of Agriculture Handbook No. 436. Natural Resource Conservation Service, Government Printing Office: Washington, DC, USA, 1999.
  19. Soil Survey Staff. Soil Taxonomy: A Basic System of Soil Classification for Making and Interpreting Soil Surveys; U.S. Department of Agriculture Handbook No. 436. Natural Resource Conservation Service, Government Printing Office: Washington, DC, USA, 1975.
  20. Sharma, B.D.; Mukhopadhyay, S.S.; Sidhu, P.S. Micro Topographic Controls on Soil Formation in the Punjab Region, India. Geoderma 1998, 81, 357–368. [Google Scholar] [CrossRef]
  21. Jackson, M.L. Soil Chemical Analysis; Prentice Hall, Inc.: Hoboken, NJ, USA, 1967. [Google Scholar]
  22. Walkley, A.; Black, C.A. An Examination of the Digestion Method for Determining Soil Organic Matter and a Proposed Modification of the Chromic Acid Titration Method. Soil Sci. 1934, 37, 27–38. [Google Scholar] [CrossRef]
  23. Puri, A.N. A New Method of Estimating Total Carbonates in Soils; Pusa Bull 206, 7; Government of India, Central Publication Branch: Delhi, India, 1930.
  24. Olsen, S.R.; Cole, C.V.; Watanable, F.S.; Dean, L.A. Estimation of Available Phosphorus by Extraction with Sodium Bicarbonate; No. 939.; U.S. Department of Agriculture: Washington, DC, USA, 1954.
  25. Pansu, M.; Gautheyrou, J. Handbook of Soil Analysis: Mineralogical, Organic and Inorganic Methods; Springer Science & Business Media: Berlin/Heidelberg, Germany, 2006; ISBN 3540312102. [Google Scholar]
  26. Dhaliwal, S.S.; Sharma, B.D.; Bijay, S. Micronutrient Status of Different Land Use Systems in Relation to Soil Quality and Sustainability under Different Watersheds in Submontaneous Tract of Punjab. Ann. Arid Zone 2009, 48, 103–112. [Google Scholar]
  27. Macedo, R.S.; Teixeira, W.G.; Correia, M.M.; Martins, G.C.; Vidal-Torrado, P. Pedogenetic Processes in Anthrosols with Pretic Horizon (Amazonian Dark Earth) in Central Amazon, Brazil. PLoS ONE 2017, 12, e0178038. [Google Scholar] [CrossRef] [Green Version]
  28. Sharma, B.D.; Brar, J.S.; Chanay, J.K.; Sharma, P.; Singh, P.K. Distribution of Forms of Copper and their Association with Soil Properties and Uptake in Major Soil Orders in Semi-Arid Soils of Punjab, India. Commun. Soil Sci. Plant Anal. 2015, 46, 511–527. [Google Scholar] [CrossRef]
  29. Mandal, D.; Dhyani, B.; Kumar, A.; Singh, C.; Bihari, B.; Muruganandam, M.; Madhu, M. Impact of Different Land Use Systems on Soil Quality in Northwest Himalayan Region. Indian J. Soil Conserv. 2013, 41, 200–205. [Google Scholar]
  30. Neha, G.; Bhople, B.S.; Sharma, S. Seasonal Variation of Rhizospheric Soil Properties under Different Land Use Systems at Lower Shivalik Foothills of Punjab, India. Agrofor. Syst. 2020, 94, 1959–1976. [Google Scholar] [CrossRef]
  31. Kadry, L.T.; Arar, A. Regional Applied Research on Sandy Soil; FAO Bull 25: Rome, Italy, 1975; pp. 147–150. [Google Scholar]
  32. Sharma, B.D.; Arora, H.; Kumar, R.; Nayyar, V.K. Relationship between Soil Characteristics and Total and DTPA-Extractable Micronutrients in Inceptisols of Punjab. Commun. Soil Sci. Plant Anal. 2004, 35, 799–818. [Google Scholar] [CrossRef]
  33. Gupta, N.; Trivadi, S.K.; Bansal, K.N.; Kaul, R.K. Vertical Distribution of Micronutrient Cations in Some Soil Series of Northern Madhya Pradesh. J. Indian Soc. Soil Sci. 2003, 51, 517–522. [Google Scholar]
  34. Sharma, B.D.; Chahal, D.S.; Singh, P.K.; Raj-Kumar. Forms of Iron and Their Association with Soil Properties in Four Soil Taxonomic Orders of Arid and Semi-arid Soils of Punjab, India. Commun. Soil Sci. Plant Anal. 2008, 39, 2550–2567. [Google Scholar] [CrossRef]
  35. Sidhu, P.S.; Sharma, P.K.; Bajwa, M.S. Characteristics, Distribution and Genesis of Salt-Affected Soils in Punjab. J. Indian Soc. Remote Sens. 1991, 19, 269–276. [Google Scholar] [CrossRef]
  36. Kumar, A.; Brar, N.S.; Pal, S.; Singh, P. Available Soil Macro and Micro-Nutrients under Rice-Wheat Cropping System in District Tarn Taran of Punjab, India. Ecol. Environ. Conserv. 2017, 23, 201–206. [Google Scholar]
  37. Chandel, S.; Hadda, M.S.; Mahal, A.K. Soil Quality Assessment through Minimum Data Set under Different Land Uses of Submontane Punjab. Commun. Soil Sci. Plant Anal. 2018, 49, 658–674. [Google Scholar] [CrossRef]
  38. Costa, J.A.; Kern, D.C.; Costa, M.L.; Rodrigues, T.E.; Kampf, N.; Lehmann, J.; Frazâo, F.J. As Terras Pretas de Índio da Amazônia: Sua Caracterização E Uso Deste Conhecimento Na Criação De Novas Áreas; Teixeira, W.G., Kern, D.C., Madari, B.E., Lima, H.N., Woods, W., Eds.; Embrapa Amazônia Ocidental: Manaus, Brazil, 2009; pp. 162–171. [Google Scholar]
  39. Bertsch, P.M.; Thomas, G.W. Potassium Status of Temperate Region Soils Potassium in Agriculture; Munson, R.D., Ed.; American Society of Agronomy: Madison, WI, USA, 1985; pp. 131–162. [Google Scholar]
  40. Cancela, R.C.; De Abreu, C.A.; Paz-González, A. DTPA and Mehlich-3 Micronutrient Extractability in Natural Soils. Commun. Soil Sci. Plant Anal. 2002, 33, 2879–2893. [Google Scholar] [CrossRef]
  41. Pang, Z.; Tayyab, M.; Kong, C.; Liu, Q.; Liu, Y.; Hu, C.; Huang, J.; Weng, P.; Islam, W.; Lin, W.; et al. Continuous Sugarcane Planting Negatively Impacts Soil Microbial Community Structure, Soil Fertility and Sugarcane Agronomic Parameters. Microorganisms 2021, 9, 2008. [Google Scholar] [CrossRef]
  42. Albuquerque, A.R. Caracterização Antracolo’Gica, Físico-Química, Isoto’Pica E Molecular da Terra Preta Do Sítioarqueolo’gico Porto, Santar’Em, PA. Ph.D. Dissertation, Universidade De São Paulo, Piracicaba, Brazil, 2017. [Google Scholar]
  43. Kaiser, H.F. The Application of Electronic Computers to Factor Analysis. Educ. Psychol. Meas. 1960, 29, 141–151. [Google Scholar] [CrossRef]
  44. Zhang, Z.; Huang, X.; Zhou, Y. Factors Influencing the Evolution of Human-Driven Rocky Desertification in Karst Areas. Land Degrad. Dev. 2021, 32, 817–829. [Google Scholar] [CrossRef]
  45. Zhang, Z.; Wu, X.; Zhang, J.; Huang, X. Distribution and Migration Characteristics of Microplastics in Farmland Soils, Surface Water and Sediments in Caohai Lake, Southwestern Plateau Of China. J. Clean. Prod. 2022, 366, 132912. [Google Scholar] [CrossRef]
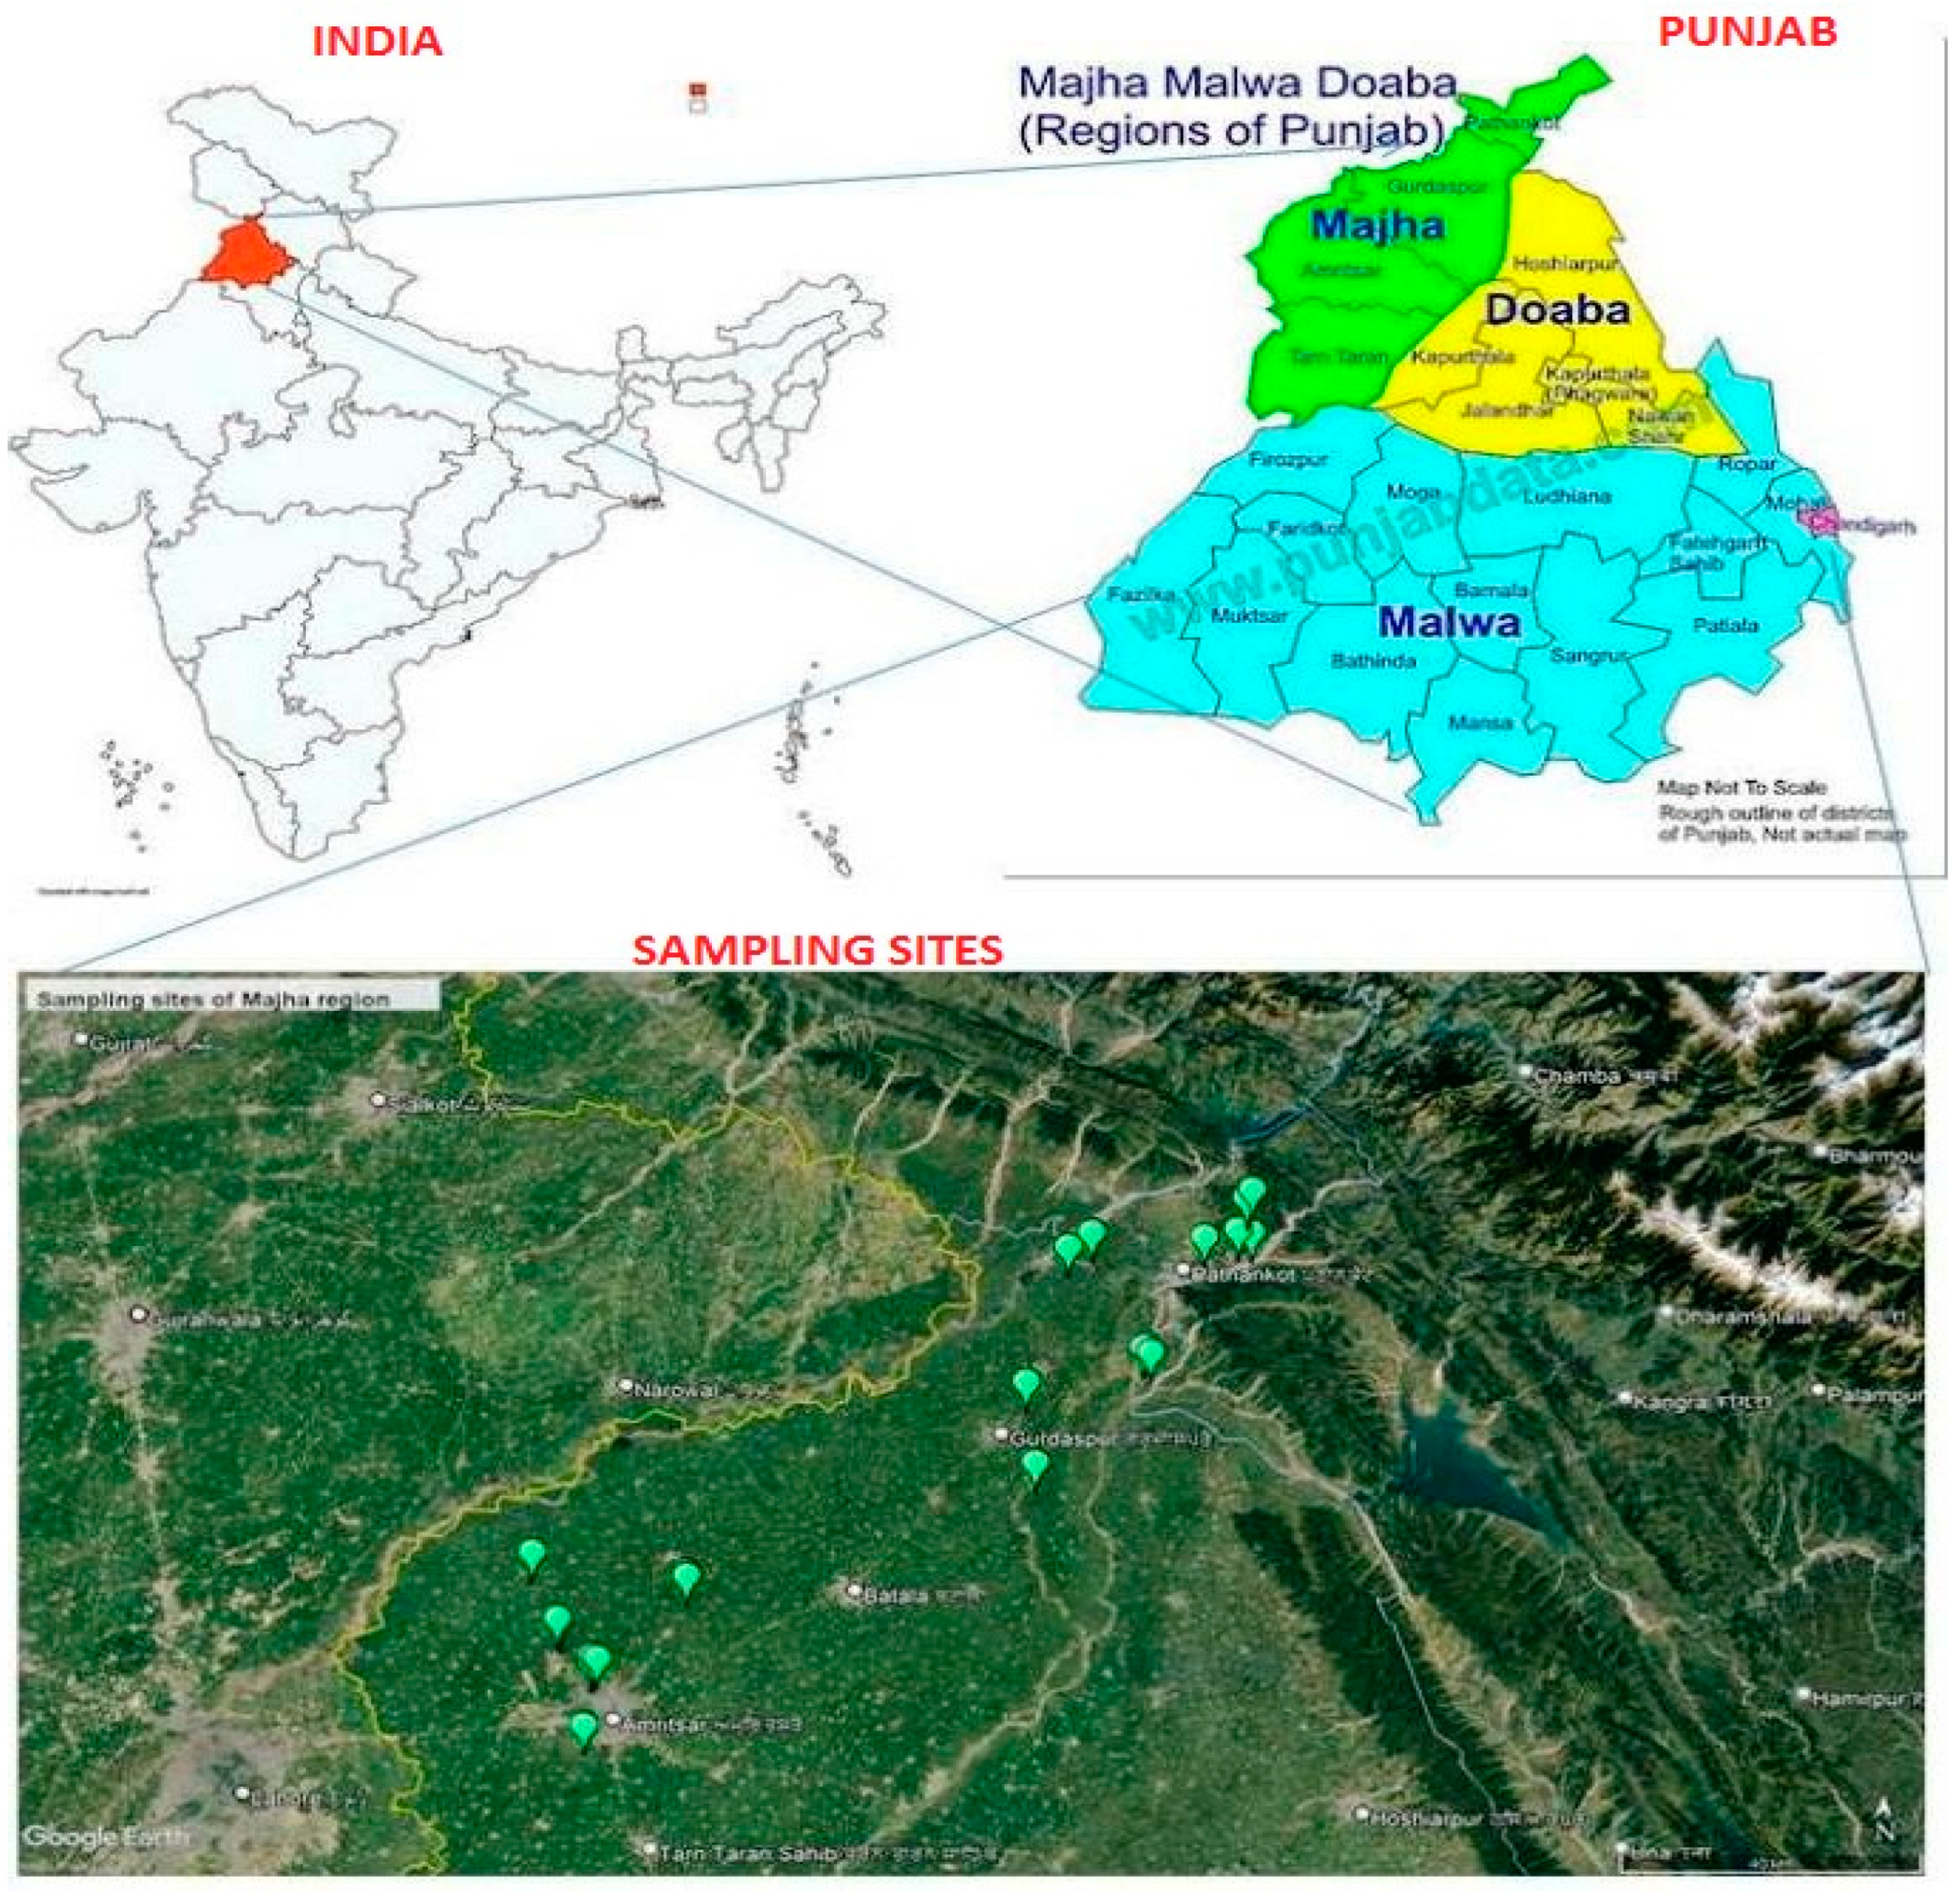
Figure 1. Locations for soil sampling in the Majha region of Punjab.
Sustainability 15 04779 g001
Figure 2. Classification of land use systems and soil orders in the Majha region of Punjab, India.
Sustainability 15 04779 g002
Figure 3. Variation in soil pH under different soil orders and land use systems in the Majha region of Punjab.
Sustainability 15 04779 g003
Figure 4. Variation in soil electrical conductivity (dS m−1) under different soil orders and land use systems in the Majha region of Punjab.
Sustainability 15 04779 g004
Figure 5. Variation of soil organic carbon (%) content under different soil orders and land use systems in the Majha region of Punjab.
Sustainability 15 04779 g005
Figure 6. Variation in calcium carbonate content (%) under different soil orders and land use systems in the Majha region of Punjab.
Sustainability 15 04779 g006
Figure 7. Variation in soil available phosphorus (kg ha−1) under different soil orders and land use systems in the Majha region of Punjab.
Sustainability 15 04779 g007
Figure 8. Variation in soil available potassium (kg ha−1) under different soil orders and land use systems in the Majha region of Punjab.
Sustainability 15 04779 g008
Figure 9. Principal component analysis for soil physico-chemical properties from different land use systems under distinct soil orders in the Majha region of Punjab.
Sustainability 15 04779 g009
Table 1. Linear correlation (Pearson) coefficient between soil physico-chemical properties of different land use systems under major soil orders in the Majha region of Punjab.
pHECOCCaCO3PK
pH1.00
EC0.151.00
OC−0.31 *0.38 *1.00
CaCO30.52 **0.01−0.35 *1.00
P−0.030.47 **0.66 **−0.38 **1.00
K−0.46 **0.260.46 **−0.35 *0.47 **1.00
**, * indicate correlation is significant at 1 and 5% significance level.
Table 2. Results depicting the factor loading values, eigenvalue, variance (%), cumulative variance (%) of principal component analysis.
Soil ParametersPC 1PC 2
Factor loading 1Contribution 1Factor Loading 2Contribution 2
pH0.5530.44−0.214.41
EC0.3210.310.5935.78
OC−0.172.940.6846.92
CaCO30.5025.420.267.14
P0.4722.37−0.050.29
K−0.298.480.235.43
F1 F2
Eigenvalue2.83 1.35
Variance (%)47.19 22.63
Cumulative variance (%)47.19 69.83
Disclaimer/Publisher’s Note: The statements, opinions and data contained in all publications are solely those of the individual author(s) and contributor(s) and not of MDPI and/or the editor(s). MDPI and/or the editor(s) disclaim responsibility for any injury to people or property resulting from any ideas, methods, instructions or products referred to in the content.