Article

Geochemical Characteristics and Factors of Transfer and Accumulation of Rare Earth Elements in Rock-Soil-Tea of the Mengku Tea Region in Yunnan Province, China

1
Faculty of Land and Resources Engineering, Kunming University of Science and Technology, Kunming 650093, China
2
Central Laboratory of Yunnan Geology and Mineral Exploration Development Bureau (Kunming Mineral Monitoring and Inspecting Center of Ministry of Land and Resources), Kunming 650218, China
*
Authors to whom correspondence should be addressed.
Sustainability 2023, 15(6), 4836; https://doi.org/10.3390/su15064836
Submission received: 13 February 2023 / Revised: 5 March 2023 / Accepted: 6 March 2023 / Published: 9 March 2023

Abstract

:
Rare earth elements (REEs) in tea are usually determined by the soil, but their transfer characteristics and influencing factors have been rarely studied and reported. In order to determine the transfer and accumulation characteristics of REEs, rock, soil, and tea samples were collected in the Mengku tea region. Levels of 15 REEs (La, Ce, Pr, Nd, Sm, Eu, Gd, Tb, Dy, Ho, Er, Tm, Yb, Lu, Y) in samples were determined by inductively coupled plasma atomic emission spectrometry (ICP-MS). The results showed that light rare earth elements (LREEs) were easily enriched in rock, soil, and tea. The average total concentration of REEs in investigated rocks was 199 mg·kg−1, which was lower than the element abundance of China’s continental crust but higher than the standard value of element abundance in the upper continental crust (UCC). The average total REE concentration in the investigated soil was 225 mg·kg−1, which was lower than the background value of soil in Yunnan Province. The chondrite-normalized levels of Ce and Eu in rocks and Eu in soil showed negative anomalies, while Ce levels in soil showed slightly positive anomalies. The total amount of REEs in tea was relatively low and the chondrite-normalized values of Eu in tea showed significantly positive anomalies. Eu anomalies in tea were closely correlated with soil pH (pH < 5, negative anomalies; pH > 5, positive anomalies). K, Na, Ca, and Mg were the main factors affecting the transfer of REEs. LREEs were mainly enriched in tea through Na+ channels. Mg and K affected the differentiation and enrichment of heavy rare earth elements (HREEs) in tea. Calcium showed a significantly positive correlation with Eu in tea. The human health risk assessment showed that the risk of drinking tea to the human body was far below the reference value. Ce, Y, and La in tea were the main elements that affected non-carcinogenic risk and carcinogenic risk.

Graphical Abstract

1. Introduction

The rare earth elements (REEs) are a group of 17 elements, including the lanthanide elements, scandium (Sc), and yttrium (Y). REEs can be divided into two groups: LREEs (La~Eu) and HREEs (Gd~Lu) [1]. REEs are widely used as additives in fertilizers. An appropriate amount of REEs can greatly improve the yield and quality of crops [2] by helping plant growth and enhancing disease resistance, plant photosynthesis, and plant seed germination [2,3,4,5]. REEs are thus an important part of the food chain closely related to human health and the economy [6]. However, when REEs exceed a certain content in plants, their toxicity can not only to inhibit plant growth [5] but also cause diseases and damage to the brain, liver, lung, kidney, and other organs [7]. Therefore, it is necessary to understand the geochemical behavior and accumulation of REEs in different matrices in order to put forward scientific and reasonable management measures [8].
The characteristics of REEs in tea are closely related to those of the soil. Previous studies have shown that REEs are obtained from soil by tea through absorption and accumulation [9]. The chondrite-normalized distribution pattern of REEs in Tie Guan Yin tea was similar to that of REEs in the soil [10]. Approximately 2.23% of REEs were transferred from the soil to tea in the study of an organic tea garden in Guangdong [11]. The uptake of REEs by tea is mainly related to the concentration and/or speciation forms in soil [12]. While the physical and chemical properties of soil are determined by the parent material [13], there is a certain degree of correlation between the elemental contents of rock, soil, and plants [14]. REEs are always enriched in plants growing in areas with high REE levels in bedrock [15]. The elements in tea have a significantly positive correlation with those in rock and soil [16].
As one of the most popular beverages, tea is consumed in many countries [17]. The health risk assessment of REEs in tea has become a hot topic in recent years [18]. Understanding the geochemical characteristics of REEs in tea is important to ensure the quality of tea and human health. At present, few studies have investigated the transfer and accumulation characteristics of REEs in tea. Therefore, rock, soil, and tea samples were collected in tea gardens in Yunnan Province, China. This paper aimed to reveal the accumulation characteristics and influencing factors of REEs in tea by comparing the distribution and transfer of REEs in rock, soil, and tea and assessing the human health risk. This work can provide a scientific basis for the protection and development of the tea industry.

2. Materials and Methods
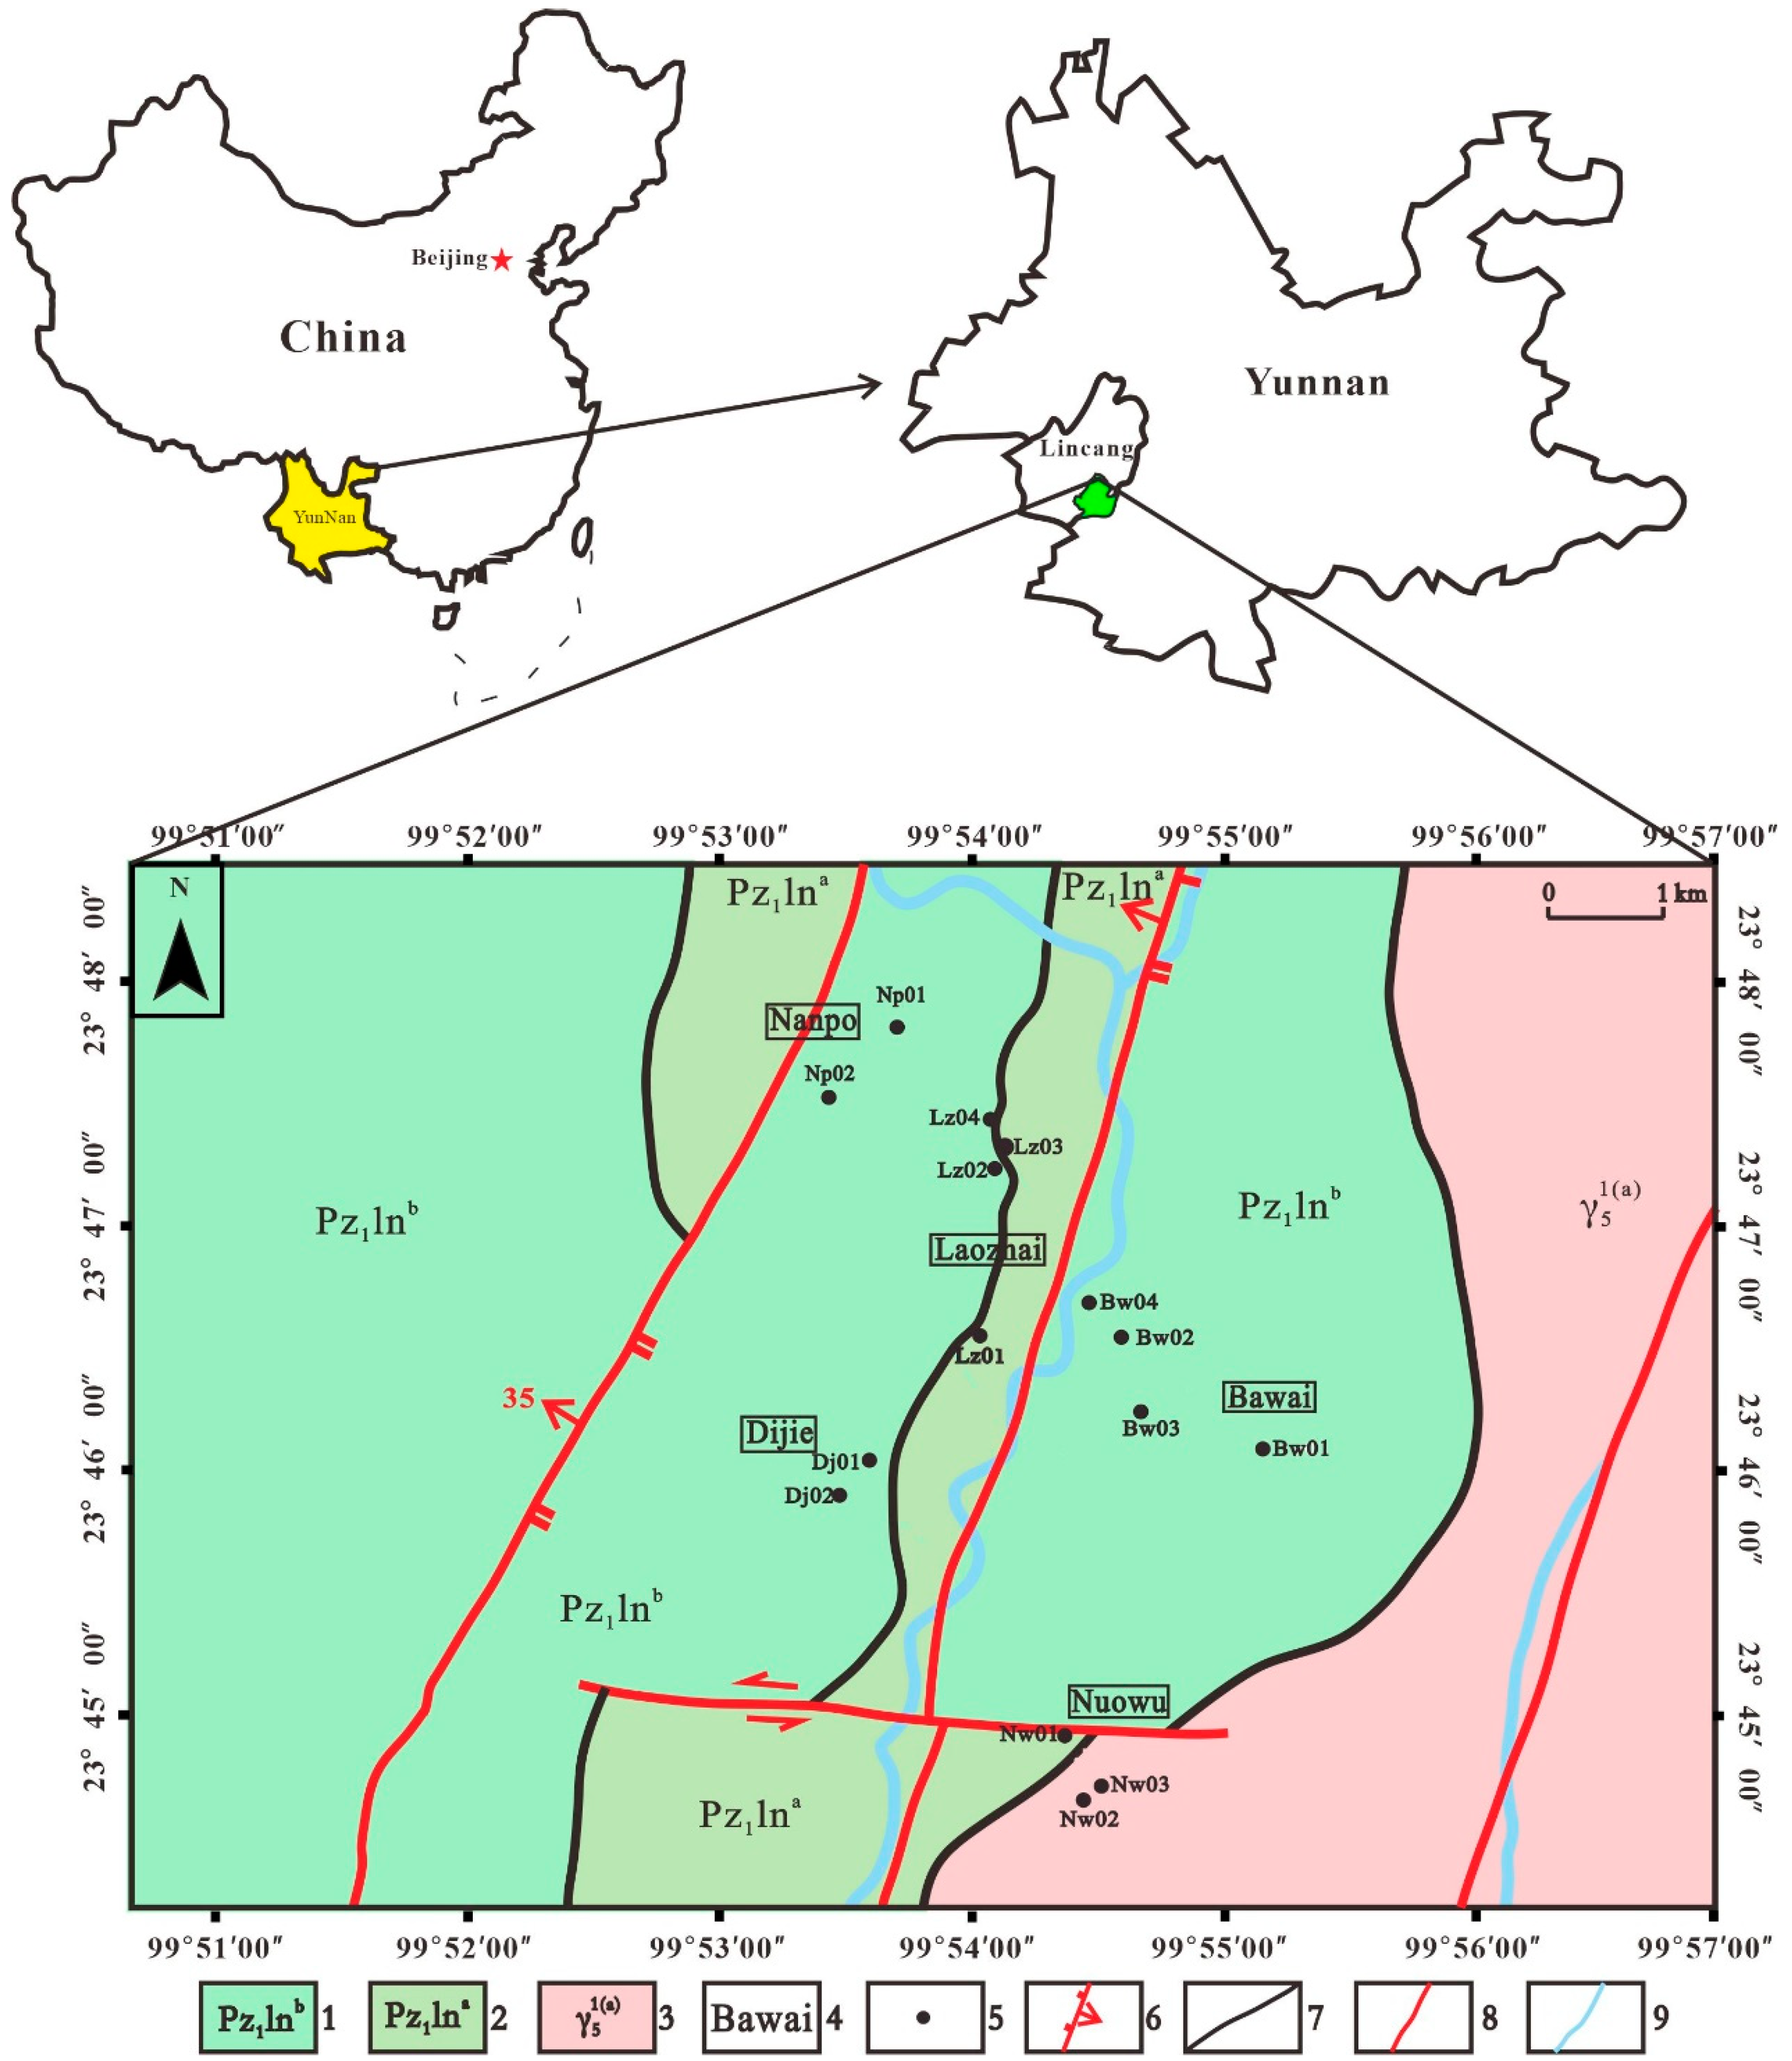
2.1. Study Area

Yunnan big-leaf tea is one of the typical plateau crops. The Mengku tea area, Shuangjiang County, Lincang City, Yunnan Province, is a high-quality production area of big-leaf tea. The area has a subtropical mountain monsoon climate with distinct dry and wet seasons. The average annual temperature of the study area was 18 °C, with an average annual precipitation of 1800 mm. The altitude is between 1600 and 2000 m. Five tea gardens were selected in this study (Figure 1).
Metamorphic rocks from the Paleozoic metamorphic strata, including the Lancang Group series strata A and B, and Triassic acid granite intrusion outcrops widely appear in the study area. The main lithology of strata A is schist, granulite, and garnet schist. Strata B is quartz schist, garnet schist, granulite, hornblende anorthosite, and garnet rock (rich in iron) [19]. The soil types are mainly yellow-brown soil and red soil. The Nanpo, Laozhai, Dijie, and Bawai sites are all located on metamorphic rocks, while the Nuowu site is located on granite stratum.

2.2. Samples Collection and Pretreatment

The rock, soil, and tea samples were collected at the end of November 2021. Fifteen sampling locations were selected based on the stratum of five tea gardens. Two soil profiles samples were collected in each tea garden. Bw01, Dj01, Lz01, Np01, and Nw01 were the profile samples of five tea gardens. Only rocks and soil were collected from other sampling points for comparison Therefore, 5 tea samples, 26 soil samples, and 12 rock samples were collected in total.
D, C, B, and A were used to represent the rock, deep soil, topsoil, and humus layers, respectively. A large hole approximately 3 m deep was dug next to the tea tree. The rocks were dug out by geological hammer from the bottom of the hole. The soil was sampled along the side of the hole with a shovel. The depths of the deep soil, topsoil, and humus layers were 2~2.5, 1~1.5, and approximately 0.5 m, respectively. Tea samples of one bud and two leaves were collected from the tea tree near the hole.
The tea samples were washed with distilled water in the laboratory, air-dried to constant weight, and weighed after grinding with an agate mortar. In order to avoid contamination with metal elements, a plastic shovel was used to collect the soil samples. Each sample was approximately 1.5 kg of a mixture of 3–5 sub samples. The samples were placed in a clean, cool, and ventilated location and dried to constant weight. The soil samples were passed through a 2 mm nylon sieve to remove debris such as stones and grass roots. Then, the samples were sealed in plastic bags. A quarter of the samples were ground with an agate mortar and passed through a 0.1 mm nylon sieve for element and physicochemical property analysis. The rock samples were washed with distilled water, dried, and ground to <2 mm for further chemical analysis.

2.3. Sample Test

REEs in tea samples were tested in accordance with the technical requirements for ecological and geochemical evaluation. A 0.2~0.5 g sample of tea was digested with HCl (ρ = 1.19 g/mL), HNO3 (ρ = 1.42 g/mL), and HClO4 (ρ = 1.68 g/mL) in a vessel at 120 °C in a microwave oven for 5 h under high pressure. After digestion, the solution was transferred to a 10 mL tube for dilution. Samples were analyzed using an inductively coupled plasma mass spectrometer (ICP-MS, Thermo Fisher Scientific, Waltham, MA, USA). GBW100106 (GSB-7) biological component reference materials were used for quality control. The detection limit of La, Ce, Eu, and Y was 0.02 mg∙kg−1. The detection limit of Pr, Nd, Sm, Gd, and Tb was 0.01 mg∙kg−1. The detection limit of Ho, Er, and Yb was 0.005 mg∙kg−1. The detection limit of Tm and Lu was 0.003 mg∙kg−1.
Soil and rock were measured according to the requirements of the regional geochemical sample analysis method. GBW07385 (GSS-29) soil reference material was used to monitor the quality of the results. Approximately 0.2 g of rock/soil sample was placed in a 50 mL tetrafluoroethylene beaker, to which 5 mL of HNO3, 2 mL of HF, 1 mL of H2SO4, and 5 mL aqua regia were added. Samples were digested on an electric heating plate. Then, samples were transferred and diluted into 10 mL tubes and analyzed by ICP-MS. The detection limit of La and Yb was 0.05 mg∙kg−1. The detection limit of Pr, Nd, Sm, Eu, Gd, Tb, Dy, Ho, Tm, and Y was 0.01 mg∙kg−1. The detection limits of Ce, Er, and Lu were 0.05, 0.02, and 0.1 mg/kg, respectively.
Major elements were measured by inductively coupled plasma atomic emission spectrometry (ICP-AES). The detection limits of Ca, Mg, K, and Na in tea were 100, 95, 90, and 100 mg∙kg−1, respectively. GBW100106 (GSB-7) biological component reference material was used for quality control. The detection limit of Ca, Mg, K, and Na in soil and rock was 100 mg∙kg−1. GBW07385 (GSS-29) soil reference material was used for quality control. Soil pH was determined using the potential method. GpH-5 soil reference material was used for quality control. Organic samples were processed according to the standard process of NY/T 1121.6-2006.
During chemical analysis, quality assurance and quality control (QA/QC) agreement was applied to ensure the reliability and accuracy of the results. The relative standard deviation (RSD) of repeated measurement was less than 5%. High-quality deionized water was used to clean glassware, prepare standards, and dilute samples.

2.4. Bioaccumulation/Transport Factor

The bioaccumulation factor (BF) is the ratio of REE concentration in plant to that in soil. It reflects the ability of plants to accumulate REEs from soil [20]. The transport factor (TF) is used to express the transfer ability of rare earth elements from rock to soil. The expression formulae are as follows:
B F = R E E s   i n   t e a R E E s   i n   s o i l
T F = R E E s   i n   s o i l R E E s   i n   r o c k

2.5. Health Risk Assessment Methods

The risk of drinking tea to the human body mainly occurs by the oral route. The content of REEs in tea was assessed using the health exposure risk assessment method. All assessment indicators were based on average daily intake (ADI) (mg/kg-day) [21,22].
A D I = C × I R × E F × E D B W × A T
where C is the content of REEs in tea (mg/kg); I R is the average daily intake of tea, assuming 11.4 g/day [23]; E F represents exposure frequency, assuming 365 days/year; E D is the duration of exposure, assuming 57 years [24]; A T is the time period, which can be calculated as:   A T = E D × 365 days; and B W is the body weight of the exposed population. In this study, the adult weight was assumed to be 61.75 kg [25].
The hazard quotient (HQ) is used to evaluate the non-carcinogenic risk of REEs in tea. The total non-carcinogenic risk (THQ) is the sum of the HQ values of all REEs.
H Q i = A D I i R f D i
T H Q = i = 1 n H Q i
where R f D i is the reference oral dose of specific ith REEs (mg/kg/day). The US EPA Integrated Risk Information System (IRIS) gives the values of La (2 × 10⁻²), Pr (5 × 10⁻¹), Nd (5 × 10⁻¹), Sm (5 × 10⁻¹), Eu (2 × 10⁻³), Lu (9 × 10⁻⁴), and Y (4 × 10⁻³) (Weber, 2012). According to the standards of the US Environmental Protection Agency, if the HQ and THQ are higher than 1, exposed persons are considered to be adversely affected. If HQ and THQ are below 1, the REEs in tea are considered to be safe for human health.
The cancer slope factor (SF) is used to assess the risk of carcinogenesis. Among them, R i s k i is the carcinogenic health risk of the ith rare earth element.
R i s k i = A D I i × S F i
R i s k T o t a l = i = 1 n R i s k i
According to the US EPA Integrated Risk Information System (IRIS), the cancer slope factor SF (kg/day/mg) is selected as La (1.10 × 10⁻¹¹), Ce (3.52 × 10⁻¹¹), Pr (7.92 × 10⁻¹²), Nd (5.44 × 10⁻¹³), Sm (3.74 × 10⁻¹¹), Eu (1.03 × 10⁻¹¹), Gd (1.52 × 10⁻¹²), Tb (4.88 × 10⁻¹²), Dy (4.14 × 10⁻¹³), Ho (9.21 × 10⁻¹²), Er (2.53 × 10⁻¹²), Tm (6.99 × 10⁻¹³), Yb (4.00 × 10⁻¹²), Lu (3.53 × 10⁻¹²), and Y (1.81 × 10⁻¹¹) [26]. R i s k T o t a l is the sum of the R i s k i values of all REEs. The carcinogenic risk of R i s k i or R i s k T o t a l is classified as: no significant risk (<10−6); acceptable/tolerable (10−6~10−4); unacceptable (>10−4) [27].

2.6. Statistical Analysis

Microsoft Excel 2019 and SPSS 26.0 were used for data analysis, statistics, and basic graphics. Corelkit was used to draw the chondrite-normalized REE distribution patterns. CorelDRAW 2020 was used for further drawing all graphics in the manuscript.

3. Results and Discussion

3.1. Geochemical Characteristics of REEs in Tea, Soil, and Rock

3.1.1. Levels of REEs in Tea, Soil, and Rock

The mean total amounts of rare earth elements (∑REE) and light rare earth elements (∑LREE) in the rock samples from the study area were 199 and 175 mg·kg−1, respectively (Table 1). These values were lower than the REE abundance of the continental crust in China [28] but higher than that of the UCC [29]. The average content of heavy rare earth elements (∑HREE) was 24 mg∙kg−1, which was lower than that of the UCC and the rare earth element abundance of China’s continental crust. As shown in Table 1, the Nw03 sample had the highest value of ∑HREE (62 mg·kg−1). Other rock samples had similar values of ∑HREE, with an average value of 20 mg·kg−1. According to previous studies, the ∑HREE value in igneous rock samples was higher than that in metamorphic rock samples [30]. The Nw03 sample was fine-grained biotite granodiorite, belonging to igneous rocks. Therefore, ∑LREE/∑HREE in the Nw03 sample was much lower than that in other rock samples (Table 1). The average ∑LREE/∑HREE value in all samples was 8.6, which implied a significant fractionation of LREEs and HREEs [31]. The (La/Sm)N values were 3.0~4.3, with an average value of 3.8, reflecting strong differentiation of LREEs in the rock samples [32,33]. The (Gd/Yb)N values were 1.6~6.8, with an average value of 4.1 [34]. Rock samples showed slight Ce negative abnormalities (δCe mean = 0.9) and Eu showed negative anomalies of moderate intensity (δEu mean = 0.7). The δEu was negatively related to HREE content [35]. Eu tends to be enriched in the crystalline phase [36]. Only the Nw03 sample was located on S-type granite with a high degree of crystallization differentiation. This was consistent with the minimum δEu (0.5) in the Nw03 sample.
The average values of ∑REE and ∑LREE in the soil samples were 225 and 190 mg·kg−1, respectively (Table 1). These values were lower than the background value of Yunnan soil but higher than the background value of Chinese soil [37]. The average value of ∑HREE was 35 mg·kg−1, which was slightly lower than the background values of Yunnan soil and Chinese soil. The value of ∑HREE in the Nw03 sample developed from igneous rock was significantly higher than that of metamorphic rock. The range of ∑LREE/∑HREE values was 1.7~12.3, with an average value of 7.7. This result was similar to that of the rock samples. The average values of (La/Sm)N and (Gd/Yb)N were 3.3 and 3.2, respectively. These values reflected that there were significant differences between LREEs and HREEs in the soil samples. δCe was 0.6~2.3, with an average value of 1.1. Generally, Ce showed a slightly positive anomaly and an enriched state. δEu was 0.5~0.8, with an average value of 0.7. The overall performance of Eu showed a negative anomaly and loss.
Table 1. REE content in rock and soil samples (mg∙kg−1), pH, organic matter (OM), and types of soil samples (g∙kg−1).
Rock R E E L R E E H R E E L R E E H R E E ( L a S m ) N * ( G d Y b ) N * δ C e * δ E u * pHOMSoil Type
Bw01-D309280309.53.94.71.10.6
Bw03194176189.94.13.21.00.7
Bw042762552112.13.86.81.00.6
Dj01-D2081951314.64.06.11.00.7
Dj021531411311.03.74.41.00.7
Lz01-D177160179.64.34.20.90.8
Lz02-D160145159.74.04.00.80.6
Lz0312297244.03.53.60.61.0
Lz04198179199.54.05.00.90.8
Np01-D238209297.23.33.81.00.6
Nw01-D132106264.03.41.60.70.6
Nw03225162622.63.01.60.90.5
Mean199175248.63.84.10.90.7
China a235185493.8
UCC b169134353.8
Soil
Bw01-B170149217.23.43.01.20.65.698.6Alfisols
Bw01-C161141207.23.63.51.10.65.423.4Ultisols
Bw02-B157140178.33.82.81.20.76.065.9Alfisols
Bw02-C189170199.13.93.01.20.75.913.45Ultisols
Bw02-D180158227.23.72.61.10.75.762.6Ultisols
Dj01-B1511371410.03.73.21.20.85.349.2Alfisols
Dj01-C2081891910.13.74.50.90.85.705.0Ultisols
Lz01-A189168218.03.54.11.00.75.4924.8Mollisols
Lz01-B204180247.53.44.11.00.75.4930.1Alfisols
Lz01-C211190219.23.74.41.00.75.888.5Ultisols
Lz02-A145128177.63.32.71.40.75.1249.1Mollisols
Lz02-B2041861810.43.12.22.30.75.328.4Alfisols
Lz02-C175155207.93.72.71.20.75.842.6Ultisols
Np01-B2121961612.33.84.91.00.65.072.6Alfisols
Np01-C1591461311.53.94.31.10.75.501.6Ultisols
Np02-B171153188.53.52.81.20.74.9818.0Alfisols
Np02-C1811651610.53.94.61.00.75.1210.9Ultisols
Np02-D183166179.93.94.81.00.75.233.5Ultisols
Nw01-A304252524.92.62.21.40.65.6515.2Mollisols
Nw01-B365293724.12.72.01.20.65.248.6Alfisols
Nw01-C327263214.12.72.01.20.65.458.4Ultisols
Nw02-A287252347.32.24.01.10.64.9012.8Mollisols
Nw02-B295249455.51.93.31.10.65.0412.2Alfisols
Nw02-C4062791272.22.81.31.10.75.941.2Ultisols
Nw02-D4002531471.72.61.70.60.55.931.3Ultisols
Mean225190357.73.33.21.10.7
Yunnan soil c248195533.8
China soil c187 148 393.8
Note: *: values were standardized to REEs in chondrite [38]; a: Element abundance of continental crust in China [28]; b: Element abundance of upper continental crust [29]; c: Soil background values of Yunnan and China [37]. R E E   = (La~Lu + Y), L R E E   = (La~Eu), H R E E = (Gd~Y), ( L R E E ) / ( H R E E ) is the ratio of both. ( L a / S m ) N is the value of chondrite-normalized La/Sm, it reflects the degree of fractionation between LREEs. ( G d / Y b ) N is the value of chondrite-normalized Gd/Yb, it reflects the degree of fractionation between HREEs. δ C e : anomalous value of Ce. δ E u : anomalous value of Eu.“—”: indicates that references are not given.
The total content of REEs in tea samples was relatively low, ranging from 0.407 to 0.924 mg∙kg−1 (Table 2). The values of ∑LREE and ∑HREE ranged from 0.290 to 0.715 mg∙kg−1 and 0.117 to 0.310 mg∙kg−1, respectively. The values of ∑LREE/∑HREE were higher than 1, indicating an enrichment of LREEs in tea. These results were similar to those in previous studies [39,40]. Ce, La, Nd, and Y were dominant REEs in tea. LREEs were enriched in tea due to fractionation by plants [41]. The ∑HREE and ∑REE values of tea grown on igneous rock are slightly higher than those grown on metamorphic rock.

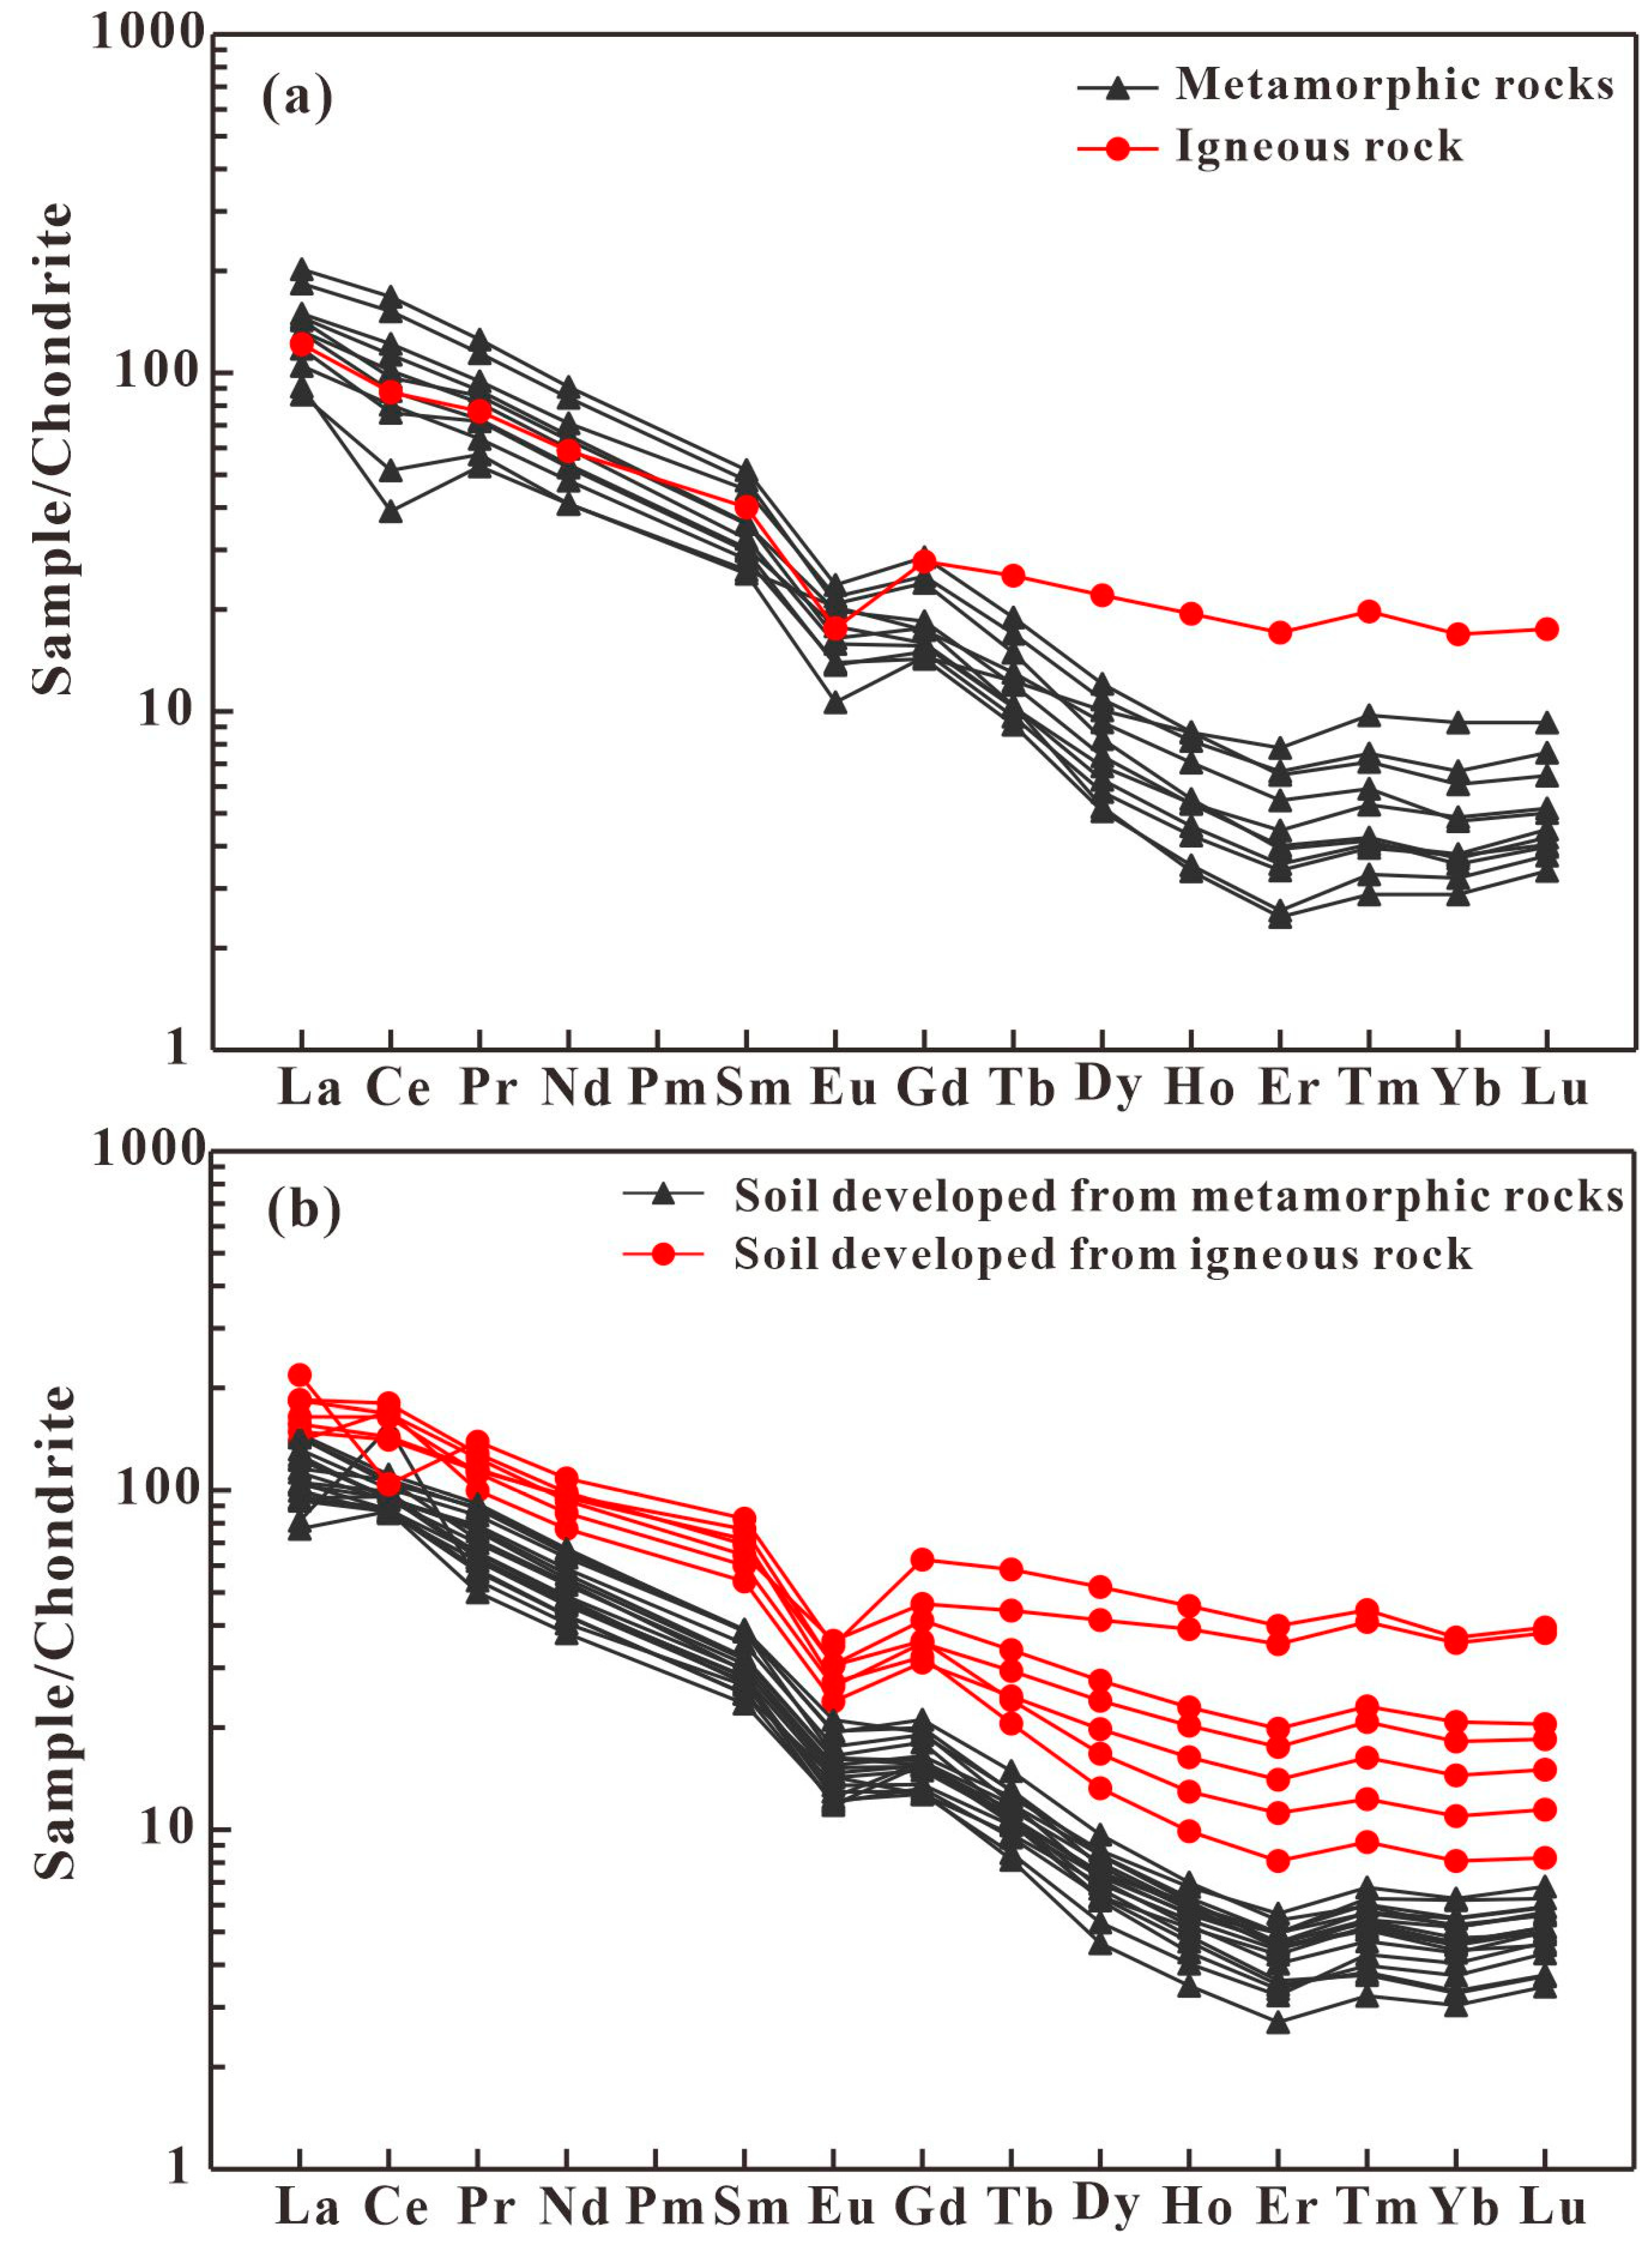
3.1.2. Distribution Patterns of REEs in Rock, Soil, and Tea Samples

The distribution patterns of chondrite-normalized REEs in rock and soil samples from the study area is shown in Figure 2. The distribution curve was inclined to the right, which was the type of light rare earth enrichment. The soil REE distribution curves were basically consistent with the rock distribution curves. LREEs were richer than HREEs. The REE content of soil from igneous rock was higher than that from metamorphic rock. This implied element transfer between rock and soil to a certain extent.
Ce showed slightly negative anomalies in rock samples, but slightly positive anomalies in soil samples. This was related to the geochemical behavior caused by the oxidation-reduction reaction of Ce [42]. Ce3+ is easily oxidized to Ce4+. Weathering facilitates the hydrolysis of Ce4+, where it remains in situ. With increasing plantation time of tea, the soil will gradually acidify [43,44]. In an acidic soil environment, H+ will promote the complexation of Ce4+, resulting in enrichment of Ce in soil [42,45]. Eu in the soil inherits the negative anomalous characteristics in bedrock. In a humid and warm environment, Eu3+ is reduced to Eu2+ with strong activity. This is different from the trivalent cations of other REEs. Eu2+ is leached out, resulting in the loss of Eu in soil [46,47].
The distribution patterns of chondrite-normalized REEs in tea samples from the study area and previous studies are shown in Figure 3 [10,48,49,50]. The distribution curves of REEs in tea were the same as those in rock and soil. Eu showed significantly positive anomalies in tea samples, in opposition to those in soil and rock samples. According to previous studies, divalent Eu could have a significantly different geochemical behavior from other REEs [51,52]. Positive Eu anomalies in plants were usually explained as the result of the reduction of Eu3+ to Eu2+ in a reducing environment and preferential uptake of Eu2+ through the roots of plants [53].
The pH value of surface soil in Fujian was approximately 4.27 [54], while the soil pH in Guizhou ranged from 3.92 to 5.45, with an average value of 4.49 [55]. Comparatively, the average pH values of soil were 5.5 in Guangxi [56] and 5.64 in Sichuan [57,58]. It was found that tea grown in soil pH < 5 generally showed negative Eu anomalies, whereas positive Eu anomalies were found in tea grown in soil pH > 5. Soil pH could affect the fractionation of Eu in tea.
The pH value of soil samples ranged from 4.90 to 6.06 in this study, with an average value of 5.46. Levels of chondrite-normalized Eu in tea increased linearly with soil pH (Figure 4a). Similar to the distribution of Eu, positive anomalies were shown in the chondrite partition map of tea (Figure 3). Additionally, the ratio of Eu content in tea to that in soil increased with increasing soil pH (Figure 4b). These results suggested that soil pH promoted Eu uptake by tea. This process might be related to the improvement of Eu absorption by Ca, according to the results of previous experiments [59,60]. As is well known, Ca can be leached and washed away under lower soil pH. Therefore, the soil pH value was one of the important factors affecting Eu anomalies in tea.

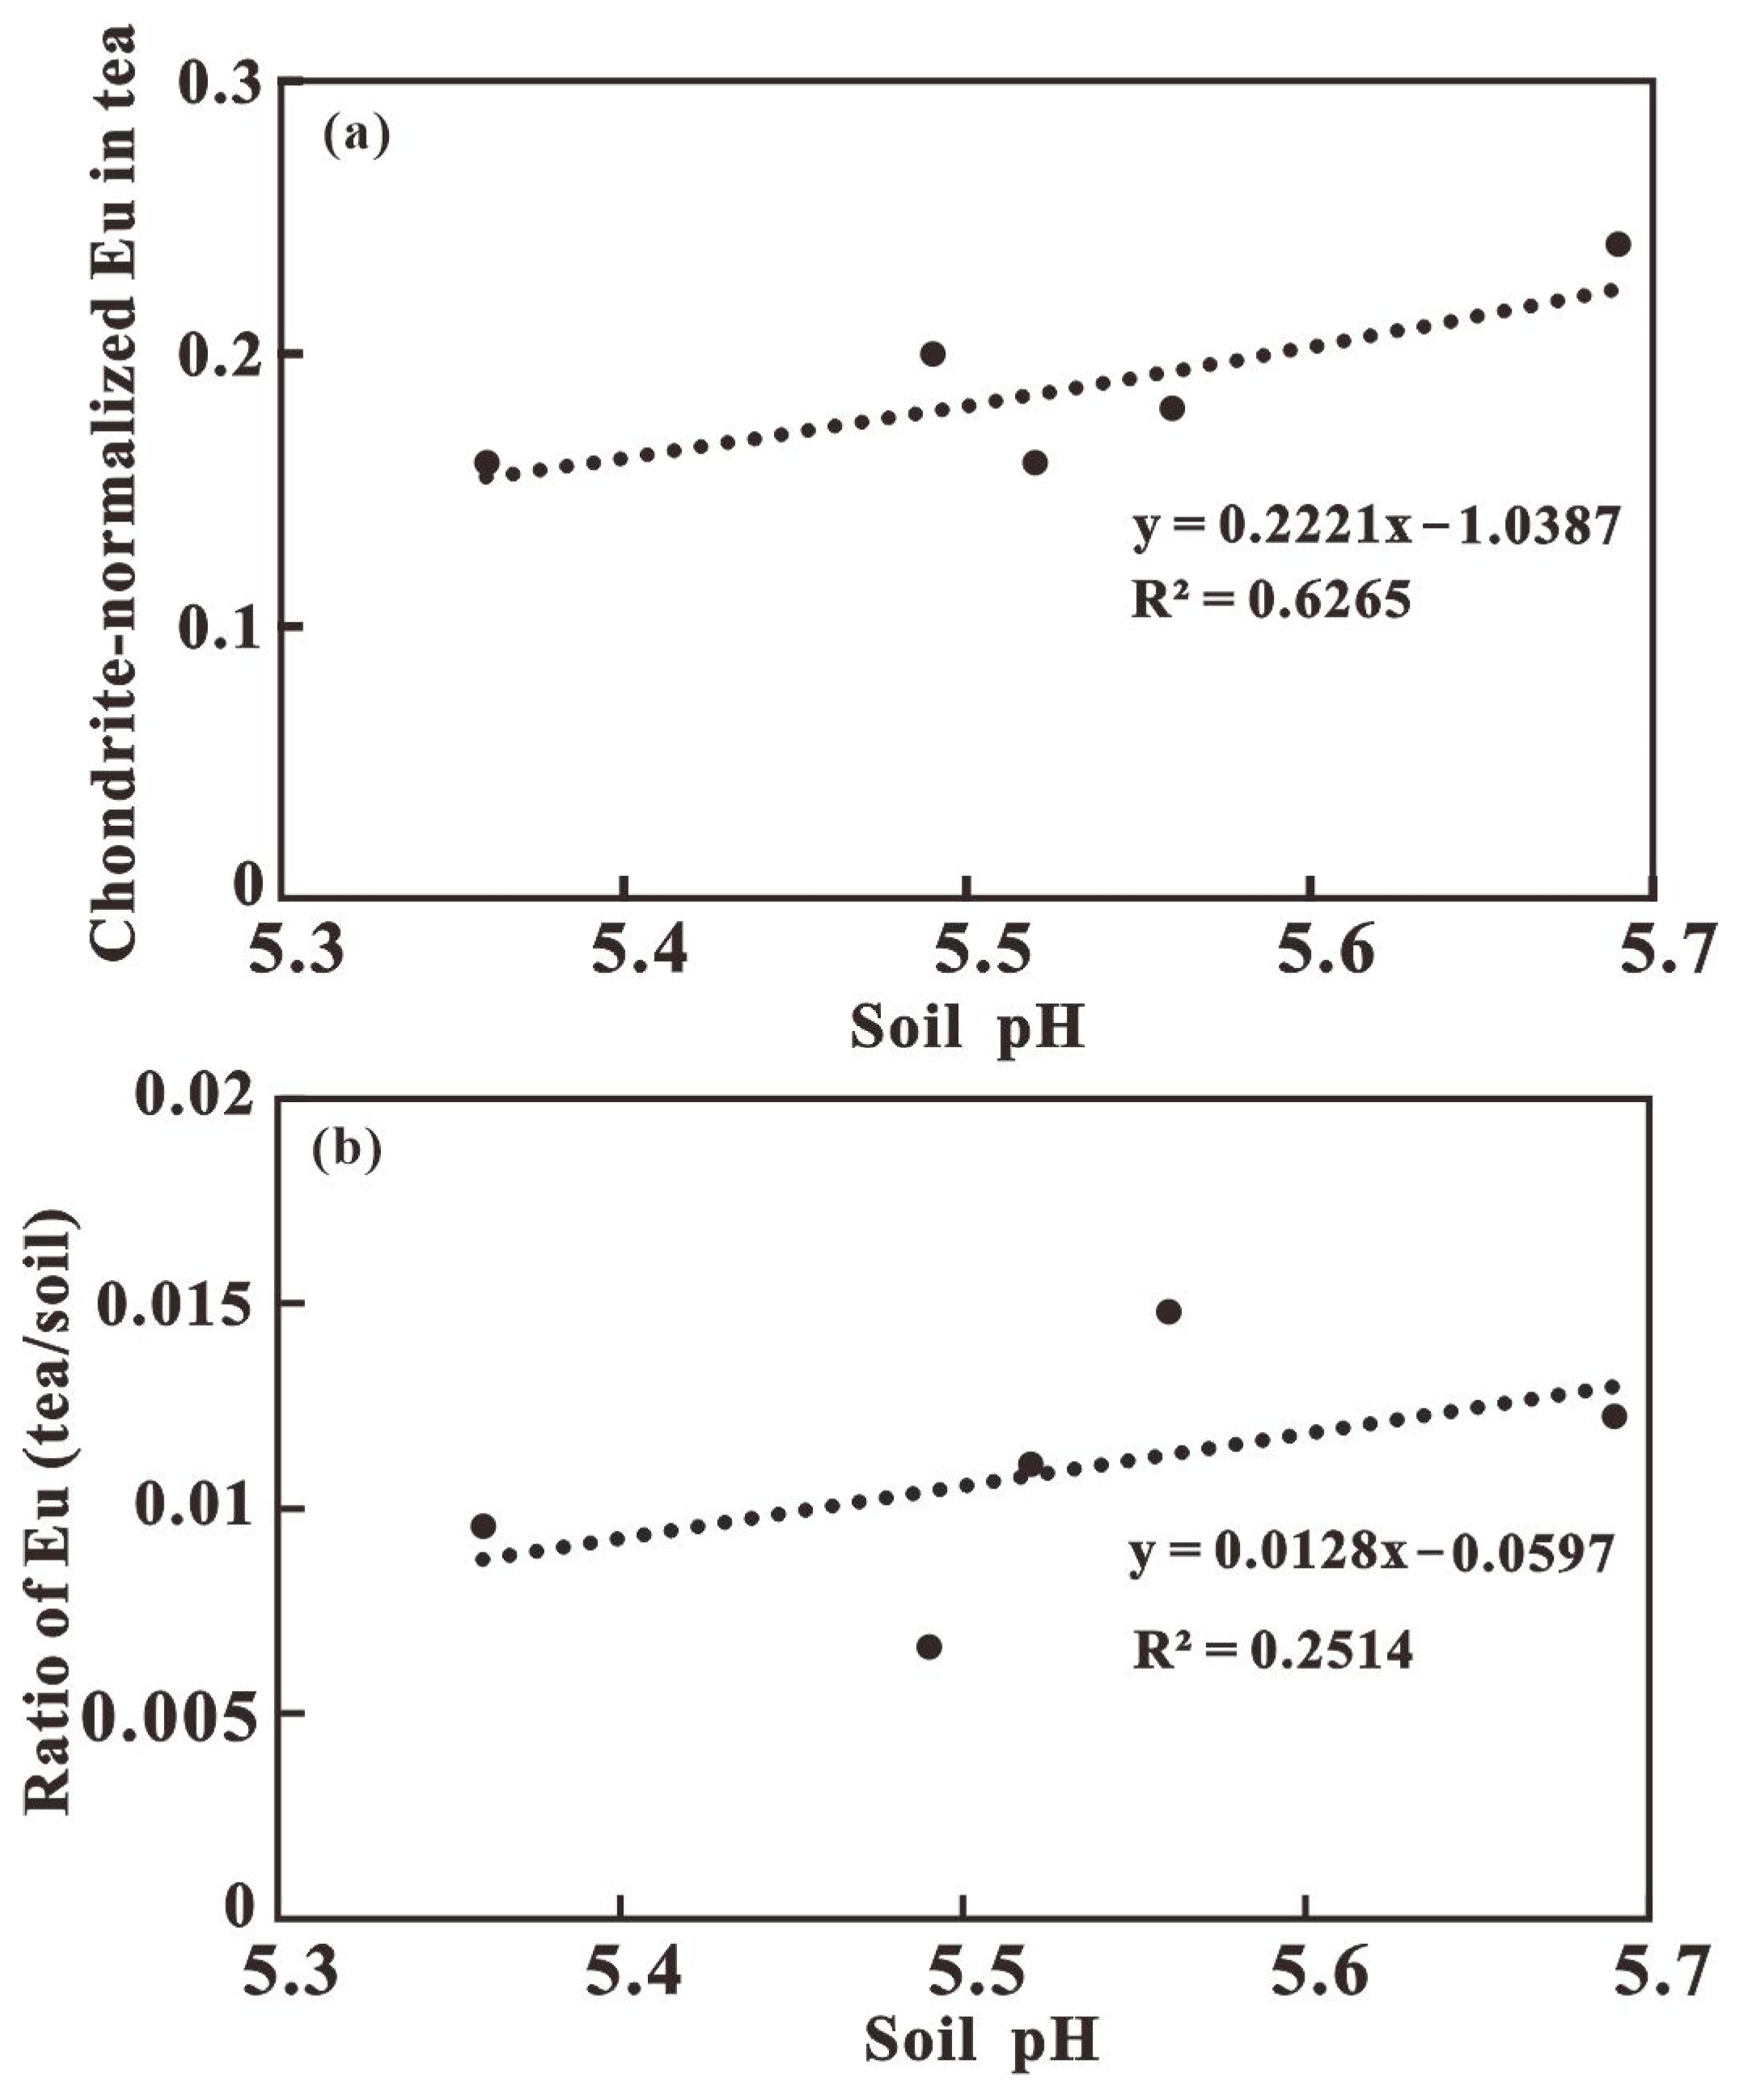
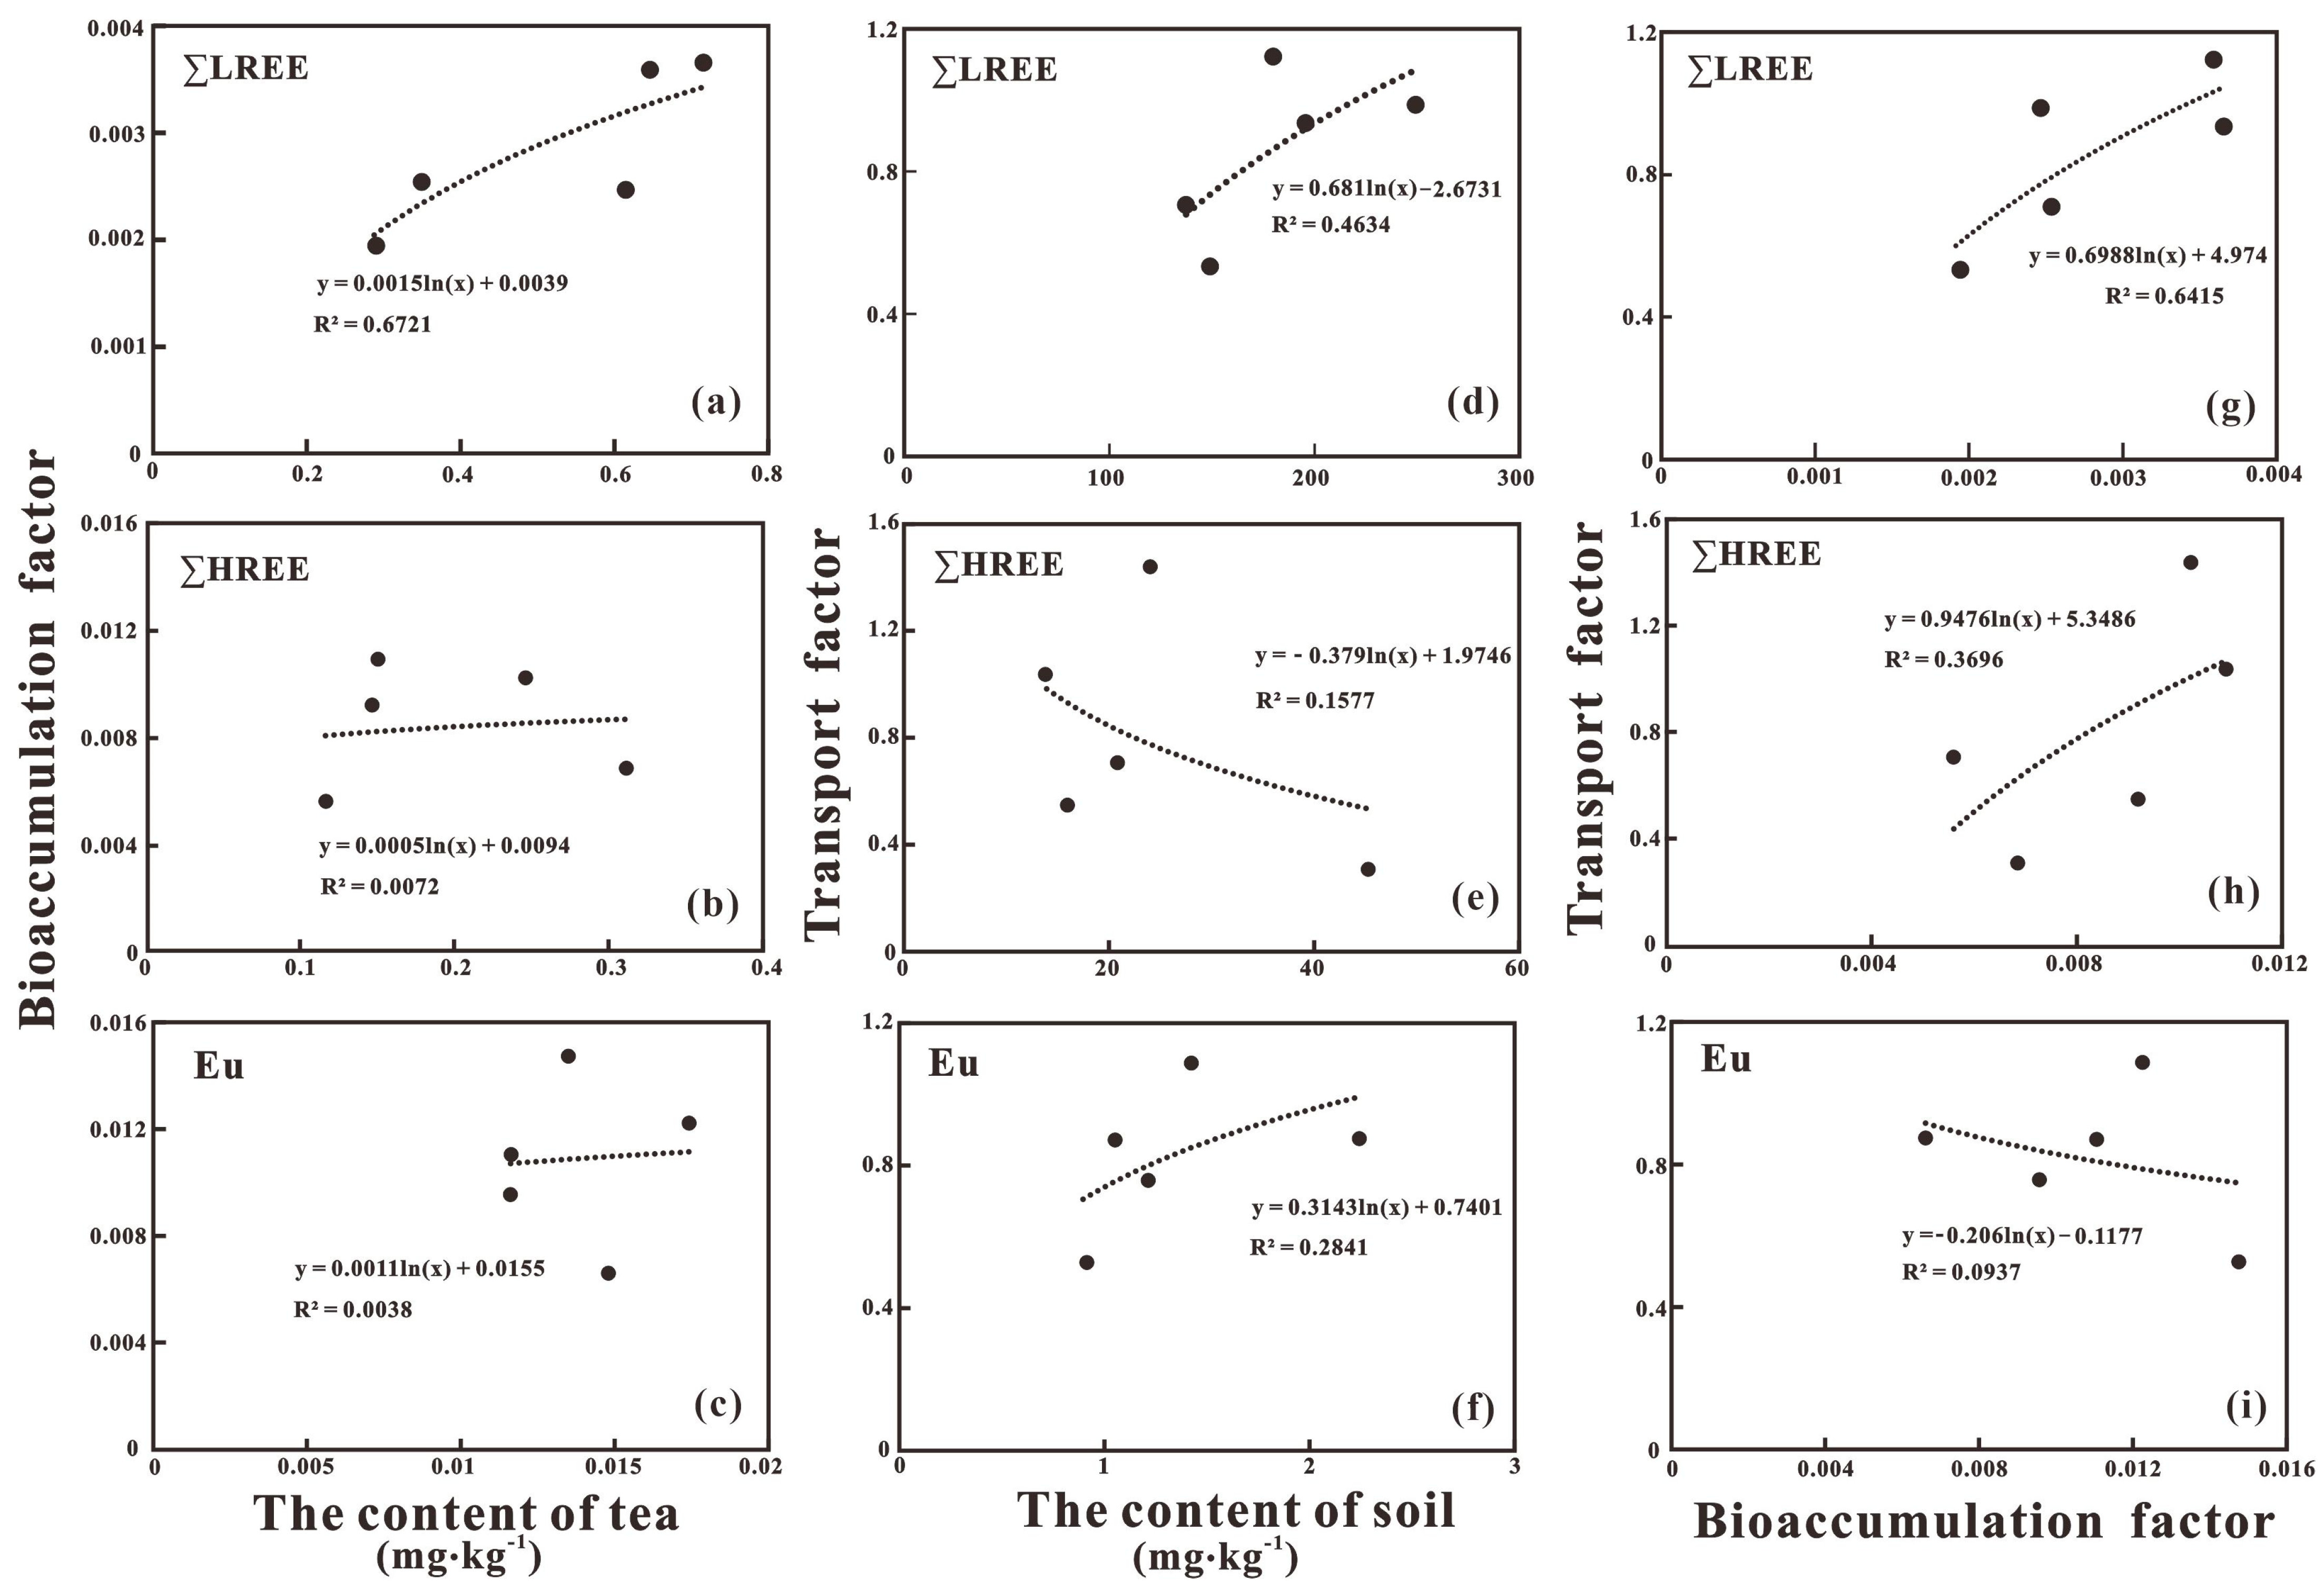
3.2. Transfer of REEs in Rock-Soil-Tea

The transport factor could characterize the behavior of REEs in rock-soil-tea. As shown in Figure 5, with increasing LREE concentration (in tea and/or soil), the bioaccumulation factor and transport factor of the LREEs increased logarithmically (Figure 5a,d). The higher the content, the larger the factor. The transport factor of LREE from rock to soil increased with increasing bioaccumulation factor (Figure 5g). Research has shown that LREEs are easily enriched in plants. Moreover, during rock weathering, LREEs are preferentially adsorbed by clay and enriched in soil due to the large radii of LREE ions and their strong adsorption capacities [61]. Therefore, Figure 5a,d,g supported LREE fractionation in soil to tea, as shown in Table 1 and Table 2 above.
The transfer process of HREEs was more complex than that of LREEs. The concentration of HREEs in tea changed significantly at 0.2 mg·kg−1. The bioaccumulation factor of HREEs gradually increased below 0.2 mg·kg−1 and decreased above 0.2 mg·kg−1 (Figure 5b). The absorption capacity of REEs by tea would be enhanced in an environment with low REE content but inhibited under high soil REE content. There are hormones in the plant to regulate the concentrations of elements so that the enrichment of REEs can be maintained within a certain range. With increasing soil HREE concentrations, the transport factor of HREEs decreased, which may be related to the immobilization of HREEs during metamorphism [62]. With increasing HREE bioaccumulation factor, the HREE transport factor increased logarithmically (Figure 5h).
Eu is one of the most active rare earth elements [59]. There are many factors affecting the absorption of Eu in tea, such as soil pH, Ca, and the regulation of hormones in tea [5,53,59]. Under the effects of multiple factors, there was no significant correlation between the Eu concentration in tea and the Eu transfer coefficient from soil to tea. The transfer coefficient of Eu from rock to soil had a logarithmic relationship with the content of Eu in soil.
Most plants discriminate between cations by their ionic radius and charge during uptake and transfer within plant tissues [63,64]. The absorption of REEs is mediated by Na+, Ca2+, and K+ channels in plant cells [65]. LREEs and Ca2+ have similar ion radii and physical and chemical properties in plants [60,66]. Eu can replace Ca in plants and/or replace Ca at cation binding sites in soil [59,67]. This also explains the preferential accumulation of LREEs (Table 2) [68,69]. This study found that Na and LREEs had similar biological characteristics (Table 3, principal component 1). Mg and K were related to the differentiation of HREEs (principal components 2 and 3). The competition between Ca and Eu was an important part of tea growth (principal component 4).
Soil weathering and plant metabolism are important processes that affect the transfer of REEs from soil to tea. There was a significantly negative correlation between soil K and tea Dy in the study area (Table 4). Previous experiments showed that the K+ content decreased and the Dy concentration increased with the release of H+ in plant roots during the process of soybean growth [70], but there was a significantly positive correlation between Ca and Eu. Ca promoted the accumulation of Eu. Organic matter also promoted the increase in Eu content under the action of Ca [59]. A significantly positive correlation occurred between Mg, Na, and HREEs in tea.

3.3. Assessment of Potential Risk to Human Health through Tea Drinking

The last step of the migration of rare earth elements in the food chain is entering the human body by oral intake, such as in drinking tea. The human health risk assessment of tea samples can quantitatively evaluate the safety of tea drinking for the human body. China and other countries all over the world have not yet formulated health guidance value for REEs. The daily allowable intake of rare earth oxides is 4.2 mg [71], which was the most common guidance value used in the current study to assess the health risk of REE exposure. If the study weight was 61.75 kg, the ADI value of the reference standard was 7.75 × 10⁻⁴ mg/kg·day. The maximum and minimum ADI values of REEs in this study were 2.09 × 10⁻⁴ and 7.31 × 10⁻⁵ mg/kg·day, respectively (Table 5). These values were far below the reference value and no health risk was found. The size order of ADI values was: Ce > La > Y > Nd > Pr > Sm > Gd > Dy > Eu > Er > Yb > Ho >Tb > Tm > Lu. Approximately 27.90% of Ce, 20.50% of La, and 16.06% of Y elements entered the human body through tea, which was within the safe range. According to the statistics, the average ADI values of REEs absorbed by tea drinkers in China, southern China, and northern China were 6.2 × 10⁻⁵, 7.7 × 10⁻⁵, and 4.8 × 10⁻⁵ mg/kg·day, respectively [72].
The HQ values of REEs were far less than 1 (Table 5), indicating no carcinogenic risk. The HQ values of Y and La accounted for the largest proportion, accounting for approximately 63.02% and 16.08% of the total HQ value, respectively (Figure 6a). The bioavailability of Y is the highest among REEs, but excessively high concentrations will have a negative impact on plant growth [73,74]. Reference doses (RfD) of Ce, Gd, Tb, Dy, Ho, Er, Tm, and Yb have not been officially reported. Thus, the information for assessing carcinogenic risk is insufficient [75]. The Risk and RiskTotal values of REEs in all tea samples were much less than 10−6 (Table 5), suggesting that long-term tea drinking will not cause cancer-related diseases. The proportions of element risk values were: Ce (57.49%) > Y (17.02%) > La (13.20%) > Sm (7.22%) > Pr (1.92%) > Eu (1.16%) > Nd (0.48%) > Yb (0.34%) > Ho (0.33%) > Gd (0.29%) > Er (0.24%) > Tb (0.17%) > Dy (0.07%) > Lu (0.06%) > Tm (0.01%) (Figure 6b). La and Ce generally appear at high levels in the mesophyll and leaves of plants [76] and are easily accumulated in crop plants [77]. Therefore, Ce, La, and Y in plants could have effects on human health [78].

4. Conclusions

The total content of REEs in tea samples was low. Ce, La, Nd, and Y were dominant REEs in tea. LREEs were more easily enriched than HREEs in tea. This study found that the soil pH affected the Eu content in tea. K, Na, Ca, and Mg were the main factors affecting the migration of REEs in tea. K was negatively correlated with REEs, whereas Na, Ca, and Mg were positively correlated with REEs. LREEs was considered to enter tea mainly through the Na+ channel. Mg and K jointly affected HREEs in tea. Ca can significantly promote the enrichment and transfer of Eu. The human health risk assessment proved the safety of tea in the study area. Ce, Y, and La in tea were the main elements that affected non-carcinogenic risk and carcinogenic risk. Tea gardens should pay attention to timely control.
The geological background affects the transfer and accumulation of REEs in soil and plants. Rock provides the initial content of REEs in soil and tea. The soil obviously inherited the characteristics of LREE enrichment from rock in this study. The characteristics of REEs in tea were both similar and different from those in rock and soil. Understanding the effects of the geological background on tea growth is essential for scientific planting and economic benefits.

Author Contributions

M.X.: Data curation, Writing—original draft, Formal analysis, Investigation. H.C.: Investigation, Software, Supervision, Project administration, Visualization. X.Z.: Resources, Funding acquisition. J.Z.: Supervision, Resources, Visualization. Z.C.: Methodology, Investigation, Validation, Software. T.Y.: Resources, Funding acquisition. K.L.: Investigation, Data curation. Y.S.: Investigation, Conceptualization, Methodology, Validation, Writing—Reviewing and Editing. All authors have read and agreed to the published version of the manuscript.

Funding

This work was supported by the National Natural Science Foundation of China (42167052), the Science and Technology Department of Yunnan Province (202101AT070277), the Basic research project-Youth Project of Yunnan Province (202201AU070091), Key Research and Development Project of the Ningxia Hui Autonomous Region, China (Grant No. 2022BEG03054).

Institutional Review Board Statement

Not applicable.

Informed Consent Statement

Not applicable.

Data Availability Statement

All datasets generated for this study are included in this paper. The data presented in this study are available on request from the corresponding author.

Conflicts of Interest

The authors declare no conflict of interest.

References

  1. Liu, Z.; Gu, X.; Lian, M.; Wang, J.; Xin, M.; Wang, B.; Ouyang, W.; He, M.; Liu, X.; Lin, C. Occurrence, geochemical characteristics, enrichment, and ecological risks of rare earth elements in sediments of “the Yellow river-Estuary-bay” system. Environ. Pollut. 2023, 319, 121025. [Google Scholar] [CrossRef]
  2. Tao, Y.; Shen, L.; Feng, C.; Yang, R.; Qu, J.; Ju, H.; Zhang, Y. Distribution of rare earth elements (REEs) and their roles in plant growth: A review. Environ. Pollut. 2022, 298, 118540. [Google Scholar] [CrossRef] [PubMed]
  3. Li, M.K.; Zhou, D.; Gao, Z.; Jiang, X.X.; Luo, X.P. Effect of rice husk biochar on bioavailability of rare earth elements in polluted soil. China Environ. Sci. 2018, 38, 3823–3832. [Google Scholar]
  4. Wang, Y.; Chen, M.; Li, Y.; Liu, Z.; Li, C. Effects of Lanthanum on Morphological and Physiological Characteristics of Tobacco Root under Drought Stress. J. Chin. Soc. Rare Earths 2018, 36, 319–327. [Google Scholar]
  5. Yang, X.; Liu, Z.; Hu, F.; Lin, Y.; Shen, C. Soil Rare Earth Element and Nitride Pollution on Plant Growth and Physiology. J. Chin. Soc. Rare Earths 2019, 37, 1–11. [Google Scholar]
  6. Kotelnikova, A.D.; Rogova, O.B.; Stolbova, V.V. Lanthanides in the Soil: Routes of Entry, Content, Effect on Plants, and Genotoxicity (a Review). Eurasian Soil Sci. 2021, 54, 117–134. [Google Scholar] [CrossRef]
  7. Li, P.W.; Li, J.H.; Chen, S.X.; Meng, X.L. Determination of 16 heavy metal elements and 16 rare earth elements in Ya’an tibet tea by ICP-MS. IOP Conf. Ser. Mater. Sci. Eng. 2018, 423, 012181. [Google Scholar] [CrossRef]
  8. Squadrone, S.; Brizio, P.; Stella, C.; Mantia, M.; Battuello, M.; Nurra, N.; Sartor, R.M.; Orusa, R.; Robetto, S.; Brusa, F.; et al. Rare earth elements in marine and terrestrial matrices of Northwestern Italy: Implications for food safety and human health. Sci. Total Environ. 2019, 660, 1383–1391. [Google Scholar] [CrossRef]
  9. Hong, T.; Xie, Y.Q.; Qin, X.M.; Kong, X.S.; Yu, Q.W. Geochemical characteristics and ecological interaction of earth elements in the soil-plant system in northwest Guizhou province. J. Ecol. Rural Environ. 2018, 34, 890–896. [Google Scholar]
  10. Huang, H.B.; Rui-Lian, Y.U.; Bian, K.; Gong-Ren, H.U.; Qiu, Q.J.; Yin-Jiao, W.U.; Wang, X.M. Geochemical Characteristics of Rare Earth Elements in the Soil-tea System in Tieguanyin Tea Gardens. J. Rare Earths 2018, 39, 141–147. [Google Scholar]
  11. Luo, X.Z.; Lin, S. Migration of rare earth elements in organic tea garden from soil through tea leaves to tea soup. J. Food Saf. Qual. 2017, 8, 265–269. [Google Scholar]
  12. Pourret, O.; Lange; Martinez, R.E.; Wiche, O.; Faucon, M.P. Relationships Between Soil Chemical Properties and Rare Earth Element Concentrations in the Aboveground Biomass of a Tropical Herbaceous Plant; Hal Open Science: Lyon, France, 2019. [Google Scholar]
  13. Turniški, R.; Zupančič, N.; Grčman, H. Geochemical evidence of illuvial processes in clay-rich soils on limestones in a humid temperate climate. Geoderma 2023, 429, 116266. [Google Scholar] [CrossRef]
  14. Li, Q.; Li, C.; Liu, L.; Heng, W.; Chen, C.; Long, J.; Wen, X. Geochemical characteristics of heavy metals of bedrock, soil, and tea in a metamorphic rock area of Guizhou Province, China. Environ. Sci. Pollut. Res. 2022, 30, 7402–7414. [Google Scholar] [CrossRef]
  15. Zhang, L.; Liu, J.; Zhang, Y.; Analysis, R. Distribution Characteristics of Rare Earth Elements in Plants and Soils from the Bayan Obo Mining Area. Rock Miner. Anal. 2019, 40, 871–882. [Google Scholar]
  16. Tong, C.; He, S.; Ding, H. Research progress of element and isotope identification technology for the origin and quality of tea. Chin. J. Ecol. 2018, 37, 10. [Google Scholar]
  17. Zheng, M.; Tang, D.; Xu, A. Attribute-Driven or Green-Driven: The Impact of Subjective and Objective Knowledge on Sustainable Tea Consumption. Foods 2023, 12, 152. [Google Scholar] [CrossRef] [PubMed]
  18. Kowalczyk, E.; Givelet, L.; Amlund, H.; Sloth, J.J.; Hansen, M. Risk assessment of rare earth elements, antimony, barium, boron, lithium, tellurium, thallium and vanadium in teas. EFSA J. 2022, 20, e200410. [Google Scholar] [CrossRef]
  19. Huang, X.G.; Dou, J.Z.; Wu, G.H.; He, J.; Chen, F. Source rocks control the geochemical diversity of granite: The Lincang pluton in the western Yunnan Tethyan belt, SW China. Lithos 2020, 382–383, 105950. [Google Scholar] [CrossRef]
  20. Sabir, M.; Baltrenaite-Gediene, E.; Ditta, A.; Ullah, H.; Kanwal, A.; Ullah, S.; Faraj, T.K. Bioaccumulation of Heavy Metals in a Soil-Plant System from an Open Dumpsite and the Associated Health Risks through Multiple Routes. Sustainability 2022, 14, 13223. [Google Scholar] [CrossRef]
  21. Environmental Protection Agency. Risk assessment guidance for superfund: Volume II environmental evaluation manual, interim final. Saúde Pública 1989, 804, 636–640. [Google Scholar]
  22. US EPA National Center for Environmental Assessment. Exposure Factors Handbook 2011 Edition (Final Report); U.S. Environmental Protection Agency: Washington, DC, USA, 2011.
  23. Peng, C.Y.; Zhu, X.H.; Hou, R.Y.; Ge, G.F.; Hua, R.M.; Wan, X.C.; Cai, H.M. Aluminum and Heavy Metal Accumulation in Tea Leaves: An Interplay of Environmental and Plant Factors and an Assessment of Exposure Risks to Consumers. J. Food Sci. 2018, 83, 1165. [Google Scholar] [CrossRef]
  24. Hartman, T.J.; Knight, C.A.; Teplansky, R.; Mitchell, D.C.; Hockenberry, J. Beverage caffeine intakes in the U.S. Food Chem. Toxicol. 2014, 63, 136–142. [Google Scholar]
  25. Tao, C.; Song, Y.; Chen, Z.; Zhao, W.; Frost, R.L. Geological load and health risk of heavy metals uptake by tea from soil: What are the significant influencing factors? Catena 2021, 204, 105419. [Google Scholar] [CrossRef]
  26. United States Environmental Protection Agency (EPA). Radionuclide Table: Radionuclide Carcinogenicity Slope Factors; United States Environmental Protection Agency (EPA): Washington, DC, USA, 2001.
  27. US EPA Office of Radiation and Indoor Air (ORIA), Radiation Protection Division. Radionuclide Carcinogenicity Slope Factors: Heast; US EPA Office of Radiation and Indoor Air (ORIA): Washington, DC, USA, 2001.
  28. Li, T. Element Abundances of China's Continental Crust and Its Sedimentary Layer and Upper Continental Crust. J. Geochem. 1995, 14, 7. [Google Scholar]
  29. Rudnick, R.L.; Gao, S. Composition of the Continental Crust; University of Maryland: College Park, MD, USA; China University of Geosciences: Xi’an, China, 2013; Volume 4. [Google Scholar]
  30. Morgenstern, R.; Turnbull, R.E.; Ashwell, P.A.; Horton, T.W.; Oze, C. Petrological and geochemical characteristics of REE mineralization in the A-type French Creek Granite, New Zealand. Miner. Depos. 2018, 54, 935–958. [Google Scholar] [CrossRef]
  31. Chen, X.; Wu, P.; Liu, J.; Deng, K.; Liu, Y.; Wei, T.; Ran, W. Geochemical characteristics and significance of trace elements in Caijiaba bauxite deposit, Guizhou Province. Chin. J. Geol. 2022, 57, 879–896. [Google Scholar]
  32. Li, C.; Zhang, C.; Qin, H.; Jiang, J. Geochemical characteristics of REE and trace elements compositions of Poyan antimony deposit in Guangxi. Miner. Resour. Geol. 2018, 32, 1035–1042. [Google Scholar]
  33. Chen, Z.Y.; Chen, Y.L.; Shang-Yi, G.U.; Zheng, C.Y.; Ji, L.I.; Long, W.U. Geochemical characteristics and significance of REE and trace elements compositions of Kengtou gold deposit in southwestern margin of Jiangnan orogenic belt. Miner. Explor. 2019, 10, 567–574. [Google Scholar]
  34. Yue, C.; Yu, F.; Zhang, X. Geochemical Characteristics of Igneous Rock around the Baihebu Reservoir in Yanqing, Beijing. Acta Geol. Sichuan 2022, 42, 282–287+295. [Google Scholar]
  35. Lu, L.; Liu, Y.; Liu, H.; Zhao, Z.; Xu, X. Research from Hefei University of Technology Has Provided New Data on Mineral Research (Geochemical and Geochronological Constraints on the Genesis of Ion-Adsorption-Type REE Mineralization in the Lincang Pluton, SW China). Minerals 2020, 10, 1116. [Google Scholar] [CrossRef]
  36. Zhao, F.; Li, G.; Zhang, P.; Wang, C.; Tang, X. Petrogenesis and tectonic implications of the Lincang batholith in the Sanjiang, Southwest China: Constraints by geochemistry, zircon U-Pb chronology and Hf isotope. Minerals 2018, 8, 516. [Google Scholar]
  37. China National Environmental Monitoring Centre. China Environmental Background Values of Soil; China Environmental Press: Beijing, China, 1990. [Google Scholar]
  38. Boynton, W.V. Cosmochemistry of the Rare Earth Elements: Meteorite Studies. Dev. Geochem. 1984, 3, 114. [Google Scholar]
  39. Wang, H.; Chen, X.; Ye, J.; Jia, X.; Zhang, Q.; He, H. Analysis of the absorption and accumulation characteristics of rare earth elements in Chinese tea. J. Sci. Food Agric. 2020, 100, 3360–3369. [Google Scholar] [CrossRef]
  40. Yuan, L.; Guo, X.; Wei, Y.; Tianhua, T.U.; Liao, Q.; Zhang, L.; Dong, Q.; Xiang, J. Compositions and health risk assessment of rare-earth elements in soil, animal and plant products around rare earth mining area in Southern Jiangxi Province. Environ. Chem. 2019, 38, 1850–1863. [Google Scholar]
  41. Miao, L.; Ma, Y.; Xu, R.; Yan, W. Environmental biogeochemical characteristics of rare earth elements in soil and soil-grown plants of the Hetai goldfield, Guangdong Province, China. Environ. Earth Sci. 2010, 63, 501–511. [Google Scholar] [CrossRef]
  42. Zhang, Q.; Chen, Z.; Chen, Z.; Feng, L. Distribution and Enrichment of Rare Earth Elements of Pinus massoniana in Ionic Type Rare Earth Mining Area, Southern China. J. Chiness Soc. Rare Earths 2020, 38, 564–572. [Google Scholar]
  43. Gao, S.; He, P.; Lin, T.; Liu, H.; Guo, B.; Lin, H.; Hu, Y.; Chen, Q.; Xiang, P.; Zou, L. Consecutive soybean (Glycine max) planting and covering improve acidified tea garden soil. PLoS ONE 2021, 16, e0254502. [Google Scholar] [CrossRef] [PubMed]
  44. Yu, X.L.; Yong, H. Tea saponins: Effective natural surfactants beneficial for soil remediation, from preparation to application. RSC Adv. 2018, 8, 24312–24321. [Google Scholar] [CrossRef]
  45. Zhang, Q.; Han, G.; Liu, M.; Wang, L. Geochemical Characteristics of Rare Earth Elements in Soils from Puding Karst Critical Zone Observatory, Southwest China. Sustainability 2019, 11, 4963. [Google Scholar] [CrossRef]
  46. Liu, Y.; Zhao, W.; Xue, Y.U.; Mengxi, Q.I.; Sun, C. The Space Distribution Characteristics Study of Rare Earth Elements in the Surface Soil of Urban Areas in Beijing. Ecol. Environ. Sci. 2017, 26, 1736–1746. [Google Scholar]
  47. Liu, Y.; Luo, K.; Yuan, Y. Content and Spatial Distribution Characteristics of Rare Earth of Surface Soil in Jiangjin District, Chongqing City. JOurnal Chin. Soc. Rare Earths 2020, 38, 10. [Google Scholar]
  48. Xie, Z.; Zhou, Z.; Quan, L.; Chu, G.; Wang, C.; Zhang, W.; Xu, Y. Content characteristics of rare earth elements in tea in Shiqian tea producing region, Guizhou province. Oper. Technol. 2020, 229, 72–73. [Google Scholar]
  49. Luo, C. Study on the Content of Rare Earth Elements in Tea in Mianyang City, Sichuan Province. Master’s Thesis, Sichuan Agricultural University, Ya’an, China, 2019. [Google Scholar]
  50. Yu, Y.-F.; Huang, L. Rapid Mass Spectrometric Analysis and Quality Control of 16 Rare Earth Elements in Broadleaf holly Leaf. Anhui Agric.Sci. 2019, 47, 4. [Google Scholar]
  51. Liu, X.-R.; Liu, W.-S.; Tang, Y.-T.; Wang, S.-Z.; Cao, Y.-J.; Chen, Z.-W.; Xie, C.-D.; Liu, C.; Guo, M.-N.; Qiu, R.-L. Effects of in situ leaching on the origin and migration of rare earth elements in aqueous systems of South China: Insights based on REE patterns, and Ce and Eu anomalies. J. Hazard. Mater. 2022, 435, 128959. [Google Scholar] [CrossRef]
  52. Lee, H.M.; Lee, S.G.; Kim, H.; Lee, J.I.; Mi, J.L. REE Tetrad Effect and Sr-Nd Isotope Systematics of A-Type Pirrit Hills Granite from West Antarctica. Minerals 2021, 11, 792. [Google Scholar] [CrossRef]
  53. Pourret, O.; Van der Ent, A.; Hursthouse, A.; Irawan, D.E.; Liu, H.Y.; Wiche, O. The 'europium anomaly' in plants: Facts and fiction. Plant Soil 2022, 476, 721–728. [Google Scholar] [CrossRef]
  54. Qiu, Q. Characteristics of Metals and Isotopic Tracing Research in Soil-Tea System from Typical Tea Gardens in Fujian Province; Huaqiao University: Quanzhou, China, 2018. [Google Scholar]
  55. Xie, Z.; Li, G.; Wang, X.; Wu, C.; Quan, L.; Wang, R.; Qiang, X. Monitoring and Pollution Assessment of Heavy Metals in Soil and Tea in Shiqiantai Tea Producing Area of Guizhou Province. J. Agric. Catastropholgy 2020, 10, 3. [Google Scholar]
  56. Zhao, S. Key Points of Kuding Tea Cultivation Technology. Agric. Technol. Ext. China 2002, 2, 44. [Google Scholar]
  57. Yang, J.; Hu, J.; Zhang, T.; Peng, B.; Deng, Z. A Preliminary Study of Physical and Chemical Properties of Davidia involucrata Soil in Beichuan Piankou Nature Reserve. J. Sichuan For. Sci. Technol. 2013, 3, 40–44. [Google Scholar]
  58. Luo, X.; Wu, J.; Jin, Y.; Wang, Y.; Gu, B. Soil Nutrient and Vegetation Restoration on Earthquake-stricken Slopes in Beichuan County, Sichuan Province. Bull. Soil Water Conserv. 2017, 37, 7. [Google Scholar]
  59. Shtangeeva, I.; Ayrault, S. Effects of Eu and Ca on yield and mineral nutrition of wheat (Triticum aestivum) seedlings. Environ. Exp. Bot. 2007, 59, 49–58. [Google Scholar] [CrossRef]
  60. Brioschi, L.; Steinmann, M.; Lucot, E.; Pierret, M.C.; Stille, P.; Prunier, J.; Badot, P.M. Transfer of rare earth elements (REE) from natural soil to plant systems: Implications for the environmental availability of anthropogenic REE. Plant Soil 2013, 366, 143–163. [Google Scholar] [CrossRef]
  61. Qian, Y.; Zheng, L.; Chen, Y.; Jiang, C.; Chen, X.; Chen, Y. Geochemical characteristics of rare earth elements in surface sediments from Huainan coal mining subsidence area, Anhui Province. Coal Geol. Explor. 2022, 50, 7. [Google Scholar]
  62. Zheng, Y.; Gu, L.; Tang, X.; Wu, C.; Li, H.; Liu, S. Element mobilization and mass-change quantification of highly metamorphosed footwall alteration zones in Hongtoushan voicanogenic massive sulfide deposit, Liaoning Province. Miner. Depos. 2010, 5, 25. [Google Scholar]
  63. Yuan, M.; Guo, M.N.; Liu, W.S.; Liu, C.; Ent, A.V.D.; Morel, J.L.; Huot, H.; Zhao, W.Y.; Wei, X.G.; Qiu, R.L. The accumulation and fractionation of Rare Earth Elements in hydroponically grown Phytolacca americana L. Plant Soil. 2017, 421, 67–82. [Google Scholar] [CrossRef]
  64. Yuan, M.; Chang, L.; Liu, W.; Guo, M.; Morel, J.L.; Huot, H.; Yu, H.; Tang, Y.; Qiu, R. Accumulation and fractionation of rare earth elements (REEs) in the naturally grown Phytolacca americana L. in southern China. Int. J. Phytoremediation 2018, 20, 415–423. [Google Scholar] [CrossRef]
  65. Han, F.; Shan, X.Q.; Zhang, J.; Xie, Y.N.; Pei, Z.G.; Zhang, S.Z.; Zhu, Y.G.; Wen, B. Organic acids promote the uptake of lanthanum by barley roots. New Phytol. 2005, 165, 481–492. [Google Scholar] [CrossRef]
  66. Latteo, V.; Cibella, F.; Censi, P.; Saiano, E.; Falcone, E. Rare earths and trace elements contents in leaves: A new indicator of the composition of atmospheric dust. Chemosphere: Environ. Toxicol. Risk Assess. 2017, 169, 342–350. [Google Scholar]
  67. Zeng, F.L.; Tian, H.E.; Wang, Z.P.; An, Y.; Gao, F.Y.; Zhang, L.J.; Li, F.M.; Shan, L. Effect of rare earth element europium on amaranthin synthesis in Amarathus caudatus seedlings. Biol. Trace Elem. Res. 2003, 93, 271–282. [Google Scholar] [CrossRef]
  68. Censi, P.; Saiano, F.; Pisciotta, A.; Tuzzolino, N. Geochemical behaviour of rare earths in Vitis vinifera grafted onto different rootstocks and growing on several soils. Sci. Total Environ. 2014, 473-474, 597–608. [Google Scholar] [CrossRef] [PubMed]
  69. Martinez, R.E.; Pourret, O.; Faucon, M.P.; Dian, C. Effect of rare earth elements on rice plant growth. Chem. Geol. 2018, 489, 28–37. [Google Scholar] [CrossRef]
  70. Shaban, G.; Idrus, A.; Fadlin, F.; Priadi, B.; Basuki, N.I. Saprolitization’s Characteristics of Rare Earth Elements in Volcanic Regolith on Drill Core #65 in Western Sulawesi, Indonesia. Asian J. Appl. Sci. 2019, 7, 435–450. [Google Scholar]
  71. Zhu, W.; Xu, S.; Shao, P.; Zhang, H.; Feng, j.; Wu, D.; Yang, W. Investigation on intake allowance of rare earth-A study on bio-effect of rare earth in South Jiangxi. China Environ. Sci. 1997, 17, 4. [Google Scholar]
  72. Zhou, Y. Characteristics of Rare Earth Elements in Tea from Chinese Market and Their Exposure Risk Assessment. Master’s Thesis, Huazhong University of Science and Technology, Huazhong, China, 2020. [Google Scholar]
  73. Loell, M.; Albrecht, C.; Felix-Henningsen, P. Rare earth elements and relation between their potential bioavailability and soil properties, Nidda catchment (Central Germany). Plant Soil 2011, 349, 303–317. [Google Scholar] [CrossRef]
  74. Thorsten, R.; Daus, B.; Saatz, J.; Vetterlein, D.; Richnow, H. Location and speciation of gadolinium and yttrium in roots of Zea mays by LA-ICP-MS and ToF-SIMS. Environ. Pollut. 2016, 216, 245–252. [Google Scholar]
  75. Weber, R.J. Rare Earth Elements: A Review of Production, Processing, Recycling, and Associated Environmental Issues. US EPA Region 2012, 8, 189–200. [Google Scholar]
  76. Tyler, G.; Olsson, T. Plant uptake of major and minor mineral elements as influenced by soil acidity and liming. Plant Soil 2001, 230, 307–321. [Google Scholar] [CrossRef]
  77. Tyler, G. Rare earth elements in soil and plant systems—A review. Plant Soil 2004, 267, 191–206. [Google Scholar] [CrossRef]
  78. Khan, A.M.; Abu Bakar, N.K.; Abu Bakar, A.F.; Ashraf, M.A. Chemical speciation and bioavailability of rare earth elements (REEs) in the ecosystem: A review. Environ. Sci. Pollut. Res. 2017, 24, 22764–22789. [Google Scholar] [CrossRef] [PubMed]
Figure 1. Geological map of tea garden distribution area. 1—Lancang group B; 2—Lancang group A; 3—granite marginal facies; 4—tea garden name; 5—sampling point; 6—measured reverse fault; 7—measured geological boundary; 8—inferred unknown fault; 9—river.
Sustainability 15 04836 g001
Figure 2. Chondrite-normalized REE distribution patterns of rock (a) and soil (b) samples.
Sustainability 15 04836 g002
Figure 3. Chondrite-normalized REE distribution patterns of tea samples, with differences in Eu content between various samples shown within the yellow elliptical line. (Data for green dashed line from Fujian and Guizhou [10,48]; data for gray area from Guangxi and Sichuan [49,50]; data for lines from this study).
Sustainability 15 04836 g003
Figure 4. Relationship between chondrite-normalized Eu content in tea and soil pH (a), and between Eu ratio in tea and soil and soil pH (b).
Sustainability 15 04836 g004
Figure 5. Relationship between the bioaccumulation factor of ∑LREE, ∑HREE, Eu, and corresponding content of tea (ac). Relationship between the transport coefficient of ∑LREE, ∑HREE, Eu, and corresponding content of soil (df). Relationship between the transport factor of ∑LREE, ∑HREE, and Eu and the corresponding bioaccumulation factor of ∑LREE, ∑HREEs, and Eu (gi).
Sustainability 15 04836 g005
Figure 6. Contribution percentage of REEs in THQ (a) and RiskTotal (b). THQ is the total amount of non-carcinogenic risks caused by tea drinking. RiskTotal is the total of carcinogenic risk caused by drinking tea.
Sustainability 15 04836 g006
Table 2. Content of REEs and major elements in tea samples (mg∙kg−1).
ElementsBwDjLzNpNwMean
Na45.34050.59080.49064.46049.16058.008
Mg258420742308238733022531
K15,42011,05013,83012,88016,04013,844
Ca435745364647426543524429
La0.0590.0810.2310.1570.2070.147
Ce0.1370.1620.1710.3430.1880.200
Pr0.0170.0170.0410.0360.0370.030
Nd0.0500.0640.1560.1390.1370.109
Sm0.0150.0130.0300.0290.0310.024
Eu0.0140.0120.0170.0120.0150.014
Gd0.0140.0150.0330.0230.0310.023
Tb0.0050.0030.0050.0030.0050.004
Dy0.0130.0150.0250.0170.0310.020
Ho0.0050.0030.0050.0030.0060.004
Er0.0080.0100.0140.0090.0180.012
Tm0.0040.0020.0020.0010.0030.002
Yb0.0080.0090.0110.0090.0160.011
Lu0.0030.0020.0020.0010.0020.002
Y0.0570.0920.1490.0800.1980.115
∑REE0.4070.4990.8910.8620.9240.717
∑LREEs0.2900.3490.6460.7150.6150.523
∑HREEs0.1170.1500.2450.1470.3100.194
∑LREEs/∑HREEs2.4872.3272.6344.8811.9842.863
Table 3. Principal component analysis between major elements and REEs in tea.
Principal Component
Elements1234
Ca0.1130.070−0.1670.977
K0.1740.2990.908−0.236
Mg0.0710.6770.588−0.437
Na0.869−0.166−0.2480.394
La0.8440.524−0.0060.111
Ce0.499−0.171−0.483−0.698
Pr0.9330.351−0.028−0.078
Nd0.9160.374−0.132−0.066
Sm0.8810.4190.023−0.218
Eu0.5730.2840.5080.577
Gd0.8190.5570.0980.099
Tb0.2360.2640.9230.154
Dy0.4960.8450.1820.089
Ho0.0620.6430.7580.092
Er0.2930.9300.1950.103
Tm−0.381−0.0990.9190.036
Yb0.2400.9590.152−0.002
Lu−0.3340.0470.941−0.005
Y0.3870.9000.1260.157
Cumulative variance contribution rate32.13%61.16%87.71%100.00%
Note: 1: First principal component, elements with larger values were Na and LREEs, explaining 32.13% of the experimental data. 2: Second principal component, explaining 29.03% of the data. 3: Third principal component, explaining 26.55% of the data. The values of Mg, K, and HREEs were large and distributed in principal components 2 and 3. 4: Fourth principal component, elements with larger values were Ca and Eu, explaining 12.29% of the data.
Table 4. Correlation analysis of soil pH, major elements, organic matter, and REEs in tea.
ElementspHKCaMgNaOrganic Matter
La−0.466−0.7850.6180.8530.6340.610
Ce−0.6780.072−0.495−0.193−0.136−0.454
Pr−0.511−0.7240.4620.7090.5060.464
Nd−0.563−0.6690.4390.6920.4890.446
Sm−0.597−0.7690.3570.7180.5910.346
Eu0.270−0.7650.946 *0.7870.4720.919 *
Gd−0.436−0.8500.6340.893 *0.6940.615
Tb0.314−0.8090.5600.6210.5680.486
Dy−0.488−0.886 *0.5660.982 **0.923 *0.516
Ho0.020−0.8460.4750.7740.8360.384
Er−0.470−0.8300.5050.957 *0.964 **0.444
Tm0.616−0.2440.0820.0020.1240.012
Yb−0.557−0.7960.3910.917 *0.978 **0.328
Lu0.504−0.3720.1150.1380.2810.034
Y−0.478−0.8240.5660.973 **0.926 *0.515
Note: **: Significant correlation at 0.01 level (two tailed). *: Significant correlation at the 0.05 level (two tailed).
Table 5. Acceptable daily intake of REEs (ADI) (mg/kg (body weight)∙day), non-carcinogenic risk (HQ) and carcinogenic risk (Risk).
ADI HQ Risk
MinMaxMeanMinMaxMeanMinMaxMean
La1.08 × 10−54.26 × 10−52.71 ×10−55.41 × 10−42.13 × 10−31.36 × 10−31.19 × 10−164.69 ×10−162.98 × 10⁻¹⁶
Ce2.52 × 10−56.33 × 10−53.69 ×10−58.88 × 10−162.23 × 10−151.30 × 10⁻¹⁵
Pr3.12 × 10−67.62 × 10−65.48 ×10−66.24 × 10−61.52 × 10−51.10 × 10−52.47 × 10−176.04 × 10−174.34 × 10⁻¹⁷
Nd9.19 × 10−62.87 × 10−52.01 ×10−51.84 × 10−55.75 × 10−54.03 × 10−55.00 × 10−181.56 × 10−171.10 × 10⁻¹⁷
Sm2.49 × 10−65.69 × 10−64.36 × 10−64.98 × 10−61.14 × 10−58.73 × 10−69.32 × 10−172.13 × 10−161.63 × 10⁻¹⁶
Eu2.14 × 10−63.21 × 10−62.54 × 10−61.07 × 10−31.61 × 10−31.27 × 10−32.21 × 10−173.31 × 10−172.62 × 10⁻¹⁷
Gd2.57 × 10−66.07 × 10−64.29 × 10−63.90 × 10−189.23 × 10−186.53 × 10⁻¹⁸
Tb4.98 × 10−79.60 × 10−77.75 × 10−72.43 × 10−184.68 × 10−183.78 × 10⁻¹⁸
Dy2.36 × 10−65.69 × 10−63.70 × 10−69.78 × 10−192.35 × 10−181.53 × 10⁻¹⁸
Ho5.72 × 10−71.13 × 10−68.16 × 10−75.27 × 10−181.04 × 10−177.52 × 10⁻¹⁸
Er1.55 × 10−63.32 × 10−62.19 × 10−63.92 × 10−188.41 × 10−185.53 × 10⁻¹⁸
Tm2.58 × 10−76.65 × 10−74.14 × 10−71.81 × 10−194.65 × 10−192.89 × 10⁻¹⁹
Yb1.40 × 10−62.88 × 10−61.93 × 10−65.61 × 10−181.15 × 10−177.71 × 10⁻¹⁸
Lu2.58 × 10−75.72 × 10−73.88 × 10−72.87 × 10−46.36 × 10−44.31 × 10−49.12 × 10−192.02 × 10−181.37 × 10⁻¹⁸
Y1.06 × 10−53.65 × 10−52.13 × 10−52.65 × 10−39.12 × 10−35.31 × 10−31.92 × 10−166.61 × 10−163.85 × 10⁻¹⁶
Total∑7.31 × 10−52.09 × 10−41.32 × 10−44.58 × 10−31.36 × 10−28.43 × 10−31.37 × 10−153.73 × 10−152.26 × 10⁻¹⁵
Disclaimer/Publisher’s Note: The statements, opinions and data contained in all publications are solely those of the individual author(s) and contributor(s) and not of MDPI and/or the editor(s). MDPI and/or the editor(s) disclaim responsibility for any injury to people or property resulting from any ideas, methods, instructions or products referred to in the content.

