Abstract
The Chinese government has been working hard to improve environmental performance. However, considering that public feedback is not always complimentary, there is still room for improvement in its protection work. In China, environmental planning is the dominant direction of the government’s environmental governance. Therefore, an analysis of environmental planning could explain the policy incentives that lead to inconsistent performance and satisfaction, and could enable us to explore how to improve planning to more effectively achieve environmental governance goals. This study classified 37 Chinese cities into four types based on consistency in performance and satisfaction. Taking environmental planning policy as the research object, the planning work arrangements of different cities to improve environmental performance and public satisfaction were analyzed through hand-coding. Our study found that environmental planning in these cities puts more emphasis on basic and engineering arrangements that can effectively improve environmental performance, while work arrangements that involve improving public environmental satisfaction are relatively few. Moreover, (1) cities with high environmental performance and high public satisfaction have made relatively substantial arrangements in improving environmental performance and satisfaction during environmental planning; (2) cities with high environmental performance and low public satisfaction have a certain foundation for environmental governance, but tough governance or high public expectations weaken environmental satisfaction; (3) cities with low environmental performance and high public environmental satisfaction have low environmental performance values due to the huge energy consumption of resources or a lack of pollution disposal capacity; and (4) most of the cities with low environmental performance and low public environmental satisfaction share common geographical and historical environmental problems that make it challenging to considerably enhance public satisfaction and environmental performance in the short term. Based on the above findings, this paper believes that greater environmental governance can be achieved by promoting a change in environmental planning from the existing “elite” planning paradigm to a “participatory” planning model.
1. Introduction
China’s current environmental governance has reached a stage of deepening governance. The fourth Plenary Session of the 19th Party Central Committee explicitly suggested supporting the modernization of the ecological and environmental governance system and governance ability, in line with the strategic goal of creating a beautiful China put forward in the 18th National Congress. Resolving intergenerational, regional, and inter-subject conflicts, improving ecological and environmental quality, and improving the environment to the satisfaction of the public are still a crucial issues that need to be addressed in China [1]. Environmental governance, however, faces numerous challenges such as time lag, spatial mobility, and complexity of social relationships. China’s environmental quality has improved in recent years. For example, the proportion of surface water cross-sections classified as Class III and above is as high as 84.9% nationwide, and the average concentration of fine particulate matter in China’s prefecture-level cities in 2021 was 34.8% lower than that in 2015 [2]. Contrary to expectations, according to the findings of a questionnaire survey carried out by the Chinese Academy of Social Sciences in key Chinese cities [3], the overall rise in public contentment with the ecological environment in the past ten years has been quite modest, and in some cities, has even decreased. Public satisfaction with the environment can, to some extent, represent the success of the government’s environmental efforts in China, where there is a lack of “accountability” [4]. Cities are inherently for citizens, who play an active role in cities and are not just passive beneficiaries that the city provides. City performance and citizen satisfaction are intertwined, and the objective ability of a city’s government and the citizens’ satisfaction with the local area are both important [5]. In other words, the public may not have a positive attitude towards the government’s investment in human and material resources. The mismatch between the government’s environmental performance and the public’s environmental satisfaction reflects an urgent need to improve the government’s environmental protection work.
Unlike western countries, where citizens often initiate environmental activities to advance the environmental agenda, China’s government plays a leading role in environmental governance [6,7]. In China, the Five-Year Plan outlines the governance state and the goals the government aspires to achieve [8]. The importance of environmental planning in China’s environmental policy system was reinforced in 2005 when binding targets were added to the country’s environmental plans [9], requiring strict regional targets to be met. Since the release of China’s first environmental protection planning document in the 1970s, environmental planning has gained some “Chinese experience” during the past 50 years and has significantly aided in the modernization of China’s environmental governance capabilities and system. Planning has dual “functional” and “normative” attributes in terms of its nature [10]. The so-called “functionality” focuses on the specific measures and methods used to implement the planning scheme [11]. The functionality of environmental planning is reflected in its binding targets and corresponding tasks and measures to improve the government’s environmental performance. Meanwhile, “normative” focuses on the values and theoretical system of planning [12,13], that is, the public policy attributes of environmental planning itself; this determines that the nature of environmental planning is a means of resource redistribution adopted by government departments centering on the relationships among people, the economy, resources, and the environment, and a policy tool to coordinate the contradictions among social subjects and improve the public’s environmental satisfaction. As a result, the development and execution of environmental planning significantly enhance the government’s environmental performance while resolving disputes pertaining to various issues and raising public satisfaction.
In general, “consistent” and “inconsistent” theories of the connection between performance and satisfaction can be distinguished. According to Stipak. B., there is no connection between public satisfaction and government performance, and public impressions of government activity are unreliable [14]. Satisfaction is a subjective evaluation of government performance by the public and is formed by combining various “public sentiments” such as public expectations of service quality [15,16] and the understanding of service characteristics [17]. Therefore, changes in objective government performance may not correspond to changes in subjective public evaluations, and policy makers should be cautious when referring to subjective public evaluations of government performance [18,19]. Scholars such as Parks [20] and Percy [21] contend that people may perceive and appropriately assess the government’s activity, which is in contrast to “inconsistency theorists”, who question the legitimacy of the public’s subjective assessment of government performance. In-Keun Shim et al. assessed indoor air in South Korea’s underground shopping districts, and found that the public was able to perceive changes in environmental quality [22].
The improvement of the environment still needs to come from the governmental body, given the public goods nature of the ecological environment and the current form of government-led environmental administration. As a key tool to guide and support the government’s environmental protection work, environmental planning can make reasonable provisions for urban economic and social development and resource allocation from an environmental perspective. This, meanwhile, makes it an important policy factor affecting the government’s environmental performance and public environmental satisfaction. Moreover, however “consistent” or “inconsistent” a theory may be, it is necessary to analyze environmental performance and satisfaction in connection with environmental planning as a policy factor. According to the above thinking, this paper seeks to answer the following question:
(1) What is the status of environmental governance in Chinese cities, and are citizens more satisfied in cities with superior environmental performance? For cities with poor environmental performance, are citizens just dissatisfied with the environment?
(2) How does environmental planning, as the “baton” of the Chinese government’s environmental protection work, affect the city’s environmental performance and public satisfaction? How can environmental planning be optimized so that both environmental performance and environmental satisfaction are improved?
Most academics evaluate the government’s environmental performance by establishing an indicator system, and this study, likewise, assesses environmental performance. The data of environmental satisfaction in this study were obtained from an open-source questionnaire survey. After the analysis of the current situation of environmental governance, policy text mining was considered to dig deeper into the internal logic and focus of government policies and the application of this method in the environmental field. Therefore, this paper coded and analyzed the environmental planning texts of cities, quantified the corresponding nodes, and explored the policy incentives behind the various states of governance by comparing the characteristics of the planning texts of different types of city.
2. Analysis Framework and Basic Ideas
Environmental performance is an “objective” assessment of the government’s environmental protection actions and the degree of improvement in environmental quality they bring about [23]; environmental satisfaction is the “subjective” feeling that the public forms based on how they perceive the quality of the environment [24]. Theoretically, different levels of environmental performance and public environmental satisfaction can form four states, including two instances in which the results are the same, i.e., “high environmental performance and high environmental satisfaction” or “low environmental performance and low environmental satisfaction”, and two instances in which the results are inconsistent, i.e., “high environmental performance and high environmental satisfaction” or “low environmental performance and low environmental satisfaction.” Obviously, the most desirable among them is “high environmental performance and high satisfaction”, which is the consequence of environmental management we aspire to accomplish through this in-depth study.
The environmental plan, as the “leader” of environmental protection by the government, determines the timing and location of its environmental management initiatives for the foreseeable future. As seen in Figure 1, an environmental governance system involving the government, enterprises, and the public is formed under its guidance [25,26]. Meanwhile, the operation process of the system causes changes in environmental performance and public environmental satisfaction. In turn, the results of government environmental performance and environmental satisfaction reflect, to some extent, the results of environmental governance and the effectiveness of environmental planning. It can be said that changes in performance and satisfaction are the result of planning and implementation, and the analysis of performance and satisfaction can guide the improvement of planning and environmental protection efforts.
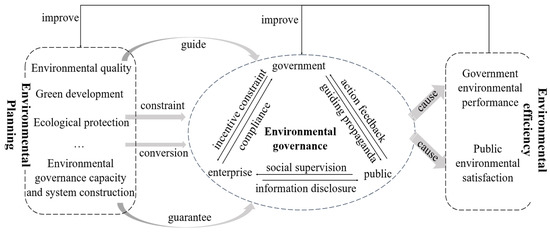
Figure 1.
Relationships between environmental planning, environmental performance, and environmental satisfaction.
The ideal environmental governance effect requires the cooperation of policies and institutional systems with environmental planning as the core, especially environmental planning, which needs to fully guide and constrain the environmental governance behavior of multiple subjects such as the government, enterprises, and society. Therefore, this paper first determines the theoretical relationships among environmental planning, environmental performance, and environmental satisfaction. The results of government environmental performance and environmental satisfaction are later adopted to understand the current status of the effectiveness of environmental protection in China through an analysis of both. Then, in order to increase environmental performance and environmental satisfaction, we choose environmental planning as the primary policy, analyze the work arrangement of environmental planning to improve environmental performance and improve environmental satisfaction, and explore the strategies for the improvement of planning.
3. Research Methods and Data Sources
The following two sections describe the research of this paper and its design, which included the following: (1) analyzing the data of 37 Chinese cities’ environmental performance and public satisfaction measures over the 2011–2020 period, and classifying cities based on the consistency of their environmental performance and public satisfaction; (2) gathering the texts of 37 Chinese cities’ environmental planning over the 2011–2020 period, using manual coding to identify the work arrangements for improving environmental performance and environmental satisfaction through planning, and then, conducting quantitative analysis and drawing conclusions. The specific research methods were as follows.
3.1. Measurement of Urban Environmental Performance
3.1.1. Data Sources
The research objects of this paper were 38 provincial capital cities, including cities specifically designated in the state plan and cities with special economic zones in the mainland of China. Lhasa City was removed from the list because of its considerable lack of data. The ecological environment observation data of 37 major cities in China from 2011 to 2020 were eventually selected, including environmental quality characterization data, environmental pollution characterization data, environmental public service characterization data, and urban scale characterization data. The specific data were collected from the statistical yearbooks of local governments over the past decade, the Environmental Quality Bulletin, the China Rural Statistical Yearbook, the China Environmental Statistical Yearbook, the China Urban Construction Statistical Yearbook, and other official statistical channels.
3.1.2. Establishing the Index System
The evaluation of environmental performance originally began using data from enterprises [27,28], but assessment objectives have been expanded from the micro-enterprise level to the macro-regional level after years of research [29,30]. Based on the research aims of this paper (to explore the consistency of government environmental performance and public environmental satisfaction and related policy incentives), the measurement of government environmental performance should evaluate the government’s actions pertaining to environmental protection and their corresponding effects in a professional context, and should measure the government’s work level through reasonable and objective measurements. Therefore, this paper focused on two dimensions when building the indicator system: the first was changes in environmental quality, such as environmental improvement and pollutant emissions, ecological resource destruction, etc.; the second was the government’s environmental governance efforts, such as the government’s environmental investment, work results, etc. Consequently, this research established an environmental performance assessment index system based on references to China’s environmental policies and associated studies (see Table 1).
Additionally, the entropy weight method can objectively assign weights to the indicator system by examining the discrepancies between observed indications, avoiding the influence of human judgment in the assignment process [31]. To determine the weights of government environmental performance evaluation indicators, this study used the entropy weighting method.

Table 1.
Government environmental performance evaluation index system.
Table 1.
Government environmental performance evaluation index system.
| Level I Index | Level II Index | Level III Index | Index Nature | Weight | References |
|---|---|---|---|---|---|
| Environmental quality | Water environment | Water quality compliance rate in functional areas (%) | Positive index | 1.4% | Zhang Y, Pu H [32], Zhou Y, Li W et al. [33] |
| Atmospheric environment | Number of days with air quality at or better than Grade 2 (days) | Positive index | 2.3% | Weng Q et al. [34], Ravina M, Pane pinto D et al. [35] | |
| Noise environment | Average traffic artery noise (dB) | Negative index | 1.0% | Dong Z, Hao C et al. [36], Bian J et al. [37] | |
| Equivalent sound level of regional ambient noise (dB) | Negative index | 1.0% | Hao C, Zhao Y Dong Z, Ge C. [38] | ||
| Waste management | Harmless treatment rate of domestic waste | Positive index | 4.2% | Shun L [39], Zhang Y, Pu H [32] | |
| Industrial solid waste disposal rate | Positive index | 2.9% | Meijering J V et al. [40], Zhang D, Chen Y. [41] | ||
| Pollution control and emission reduction | Pollutant emissions | Total industrial wastewater discharge (10,000 tons) | Negative index | 10.5% | Korkmaz C, Balaban O. [42], Chen Y et al. [43] |
| Industrial NOx emissions (tons) | Negative index | 9.5% | Zhang D, Chen Y. [41], Zhang M, Liu Y et al. [44] | ||
| Industrial SO2 emissions (tons) | Negative index | 8.3% | Fang X et al. [45], Chen Y et al. [43] | ||
| Industrial smoke (dust) emissions (tons) | Negative index | 9.2% | Tan J, Wang R. [46], Zhang M, Liu Y et al. [44] | ||
| Total industrial solid waste generation (10,000 tons) | Negative index | 7.5% | Tan J, Wang R. [46], Zhang M, Liu Y et al. [44] | ||
| Pollution control | Urban sewage treatment rate (%) | Positive index | 2.3% | Fan Y, Fang C, Zhang Q. [47], Zhang M, Liu Y et al. [44] | |
| Industrial exhaust emission compliance rate (%) | Positive index | 3.2% | Hou Y, Zhang K, Zhu Y et al. [48] | ||
| Ecological protection | Urban greenery | Green space rate in built-up areas | Positive index | 4.9% | Korkmaz C, Balaban O. [42], Zhou N et al. [49] |
| Green space per capita | Positive index | 3.2% | Moroke T, Schoeman C, Schoeman I. [50], Fan Y, Fang C, Zhang Q. [47] | ||
| Ecological protection | Forest cover | Positive index | 3.3% | Weng Q et al. [34], Zhongyu Z, Zhongxiang Z. [51] | |
| Rural land | Fertilizer application intensity | Negative index | 12.6% | Wang T, Yuan Z W. [52], Dong F, Pan Y et al. [53] | |
| Environmental governance capabilities | Resource utilization | Comprehensive utilization rate of industrial solid waste | Positive index | 3.7% | Cheng R, Li W et al. [54], Zhou N et al. [49] |
| Environmental investment | Proportion of energy conservation and environmental protection expenditure in local financial expenditure | Positive index | 8.9% | Shun L [39], Cheng R, Li W et al. [54] |
3.2. Data of Environmental Satisfaction
Since 2011, the Chinese Academy of Social Sciences (CASS) has been conducting satisfaction surveys in 38 provincial capitals, municipalities, and special economic zones across China. Moreover, it published the “Blue Book of Public Service 2011–2020” series, which is the first professional, independent, and social standard third-party government satisfaction survey in China.
The Likert scale, which has five levels, was adopted in this survey to investigate public satisfaction. When evaluating the public satisfaction index, alternatives are scored. One point was given for “extremely unsatisfied”, two for “dissatisfied”, three for “average”, four for “content”, and five for “satisfied”, and “unclear” was not calculated. Multiplying the total score of each option with the local selection ratio of the option in the city sample enabled us to obtain the total score of the city in each item. Then, converting the total score into a hundred-point system and summing the weights so that they were equal enabled us to achieve the final public service satisfaction index. Public environmental satisfaction in this paper was determined from the results of a survey released by the research group on public satisfaction with the urban environment and public services. The survey covered public satisfaction with the water environment, air quality, the green environment, street sanitation, the urban landscape, haze control, and livability, and overall environmental satisfaction.
3.3. Consistency Analysis of Performance and Satisfaction
3.3.1. Comparison of the Consistency of Indicators
City assessment indicators should enable the assessment and comparison of a city’s sustainability performance [55]. Prior to comparing the outcomes of environmental performance and public environmental satisfaction, it is important to assess the relevance and comparability of the two-evaluation metrics. In this paper, environmental factors were considered from the perspective of environmental factors, and the indicators of government environmental performance and public satisfaction were compared from that perspective. They were divided into eight groups, and all indicators were involved in the comparison, as shown in Table 2.
Table 2.
Comparison of environmental performance and public environmental satisfaction evaluation indicators.
Through the comparison of indicators, it can be seen that the evaluation object of environmental performance and public environmental satisfaction is environmental public service effectiveness. However, performance emphasizes changes in the monitoring results of environmental factors, while satisfaction focuses on the perceived results and environmental rights presented. The two groups of evaluation systems, like the front and back of a coin, are both a reflection of the effectiveness of government environmental public services.
3.3.2. Consistency Analysis of Environmental Performance and Public Satisfaction
According to the statistical results, the mean value of data used to measure environmental performance was 0.6726, the standard deviation was 0.085, and the coefficient of variation was 12.64%. In contrast, the mean value of data used to measure public environmental satisfaction was 63.69, the standard deviation was 6.39, and the coefficient of variation was 10.03%. The distribution of the two groups of data was relatively discrete. Therefore, this article divided cities into categories based on how well they performed in terms of the environment and how satisfied their residents were with this. If a city’s environmental performance ranked in the top 50% over ten years, it was categorized as having “high environmental performance”; otherwise, it was considered to have “low environmental performance”. Similarly, if a city’s public environmental satisfaction ranked in the top 50% over ten years, it was categorized as having “high public environmental satisfaction”. The four quadrants in the figure below represent the four different types of environmental performance and public satisfaction (Figure 2).
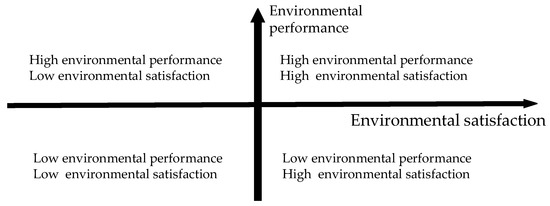
Figure 2.
Theoretical quadrant diagram of environmental performance and public satisfaction.
3.4. Policy Text Analysis of the Plan
3.4.1. Data Sources
A total of 37 provincial capitals, municipalities with independent plans, and special economic zones provided environmental management data for this study. As a result, the texts of the 12th and 13th Five-Year Plans were manually gathered for this study from the websites of the relevant cities’ governmental ecological environment bureaus. It should be noted that the Hohhot and Yinchuan cities’ 12th and 13th Five-Year Plans, as well as portions of their environmental planning documents, were not published. Thus, due to the lack of availability of these data, this article ultimately gathered 56 environmental planning papers from 28 cities, and Table 3 lists the texts that were evaluated.
Table 3.
“The 12th Five-Year” and “The 13th Five-Year” environmental planning policy text collections.
3.4.2. Policy Text Analysis
Academic circles refer to officially released documents known as “policy texts”, which are written records produced by the government on management activities, and are significant “cogs” that drive administrative management [56,57]. The restriction and guidance of environmental planning in human production and living behavior is realized through the implementation of planning texts. Furthermore, almost all government environmental governance behaviors can are based on policy texts. Therefore, using the scientific policy text analysis method to study the environmental planning documents of local governments could enable us to understand the key points in the process of policy formulation, as well as explore the reasons behind the consistency or inconsistency of the results of environmental performance and public environmental satisfaction.
A complex structure of related layers with many functions, including cognitive, normative, and regulatory functions, makes up policy text. According to the meaning of institutional design, Chang et al. classified the texts in their examination of institutional texts into concept, action, and safeguard layers from top to bottom [11]. The concept layer is the top-level design of the concept, the objectives, and the scope of the policy system [58]. Its sustainability has an impact on the institutional text’s scientific nature. The safeguard layer has a role in the efficient execution of policies, whereas the action layer specifies the behavioral actions that governmental institutions must perform in the governance process. Therefore, this paper divided environmental planning texts into a “concept layer”, an “action layer”, and a “guarantee layer”, and took them as the parent nodes of the coding structure of this paper. Based on work by H. Qin [59], this paper created the first-level sub-nodes by dividing the planning text under the parent node once more in accordance with the chapter division. The first parent node’s “concept layer” contained two first-level sub-nodes: guiding concepts and planning directives. Air, water, soil, noise, solid waste, industry, rural areas, environmental risk prevention, and ecological resource protection were among the first-level sub-nodes under the parent node’s action layer. Other first-level sub-nodes under the parent node’s action layer included water pollution prevention and control, noise pollution prevention and control, solid waste pollution prevention and control, and industrial pollution prevention and control. Environmental legal system construction, environmental economic system construction, environmental responsibility system construction, capacity enhancement for environmental science and technology, environmental culture publicity and education, and environmental public participation were among the first-level sub-nodes under the parent node guarantee layer. In addition, starting from the content of the planning, this paper established two secondary sub-nodes under each primary sub-node, namely environmental performance and public satisfaction; this formed the analysis framework for environmental planning texts, as shown in Figure 3.
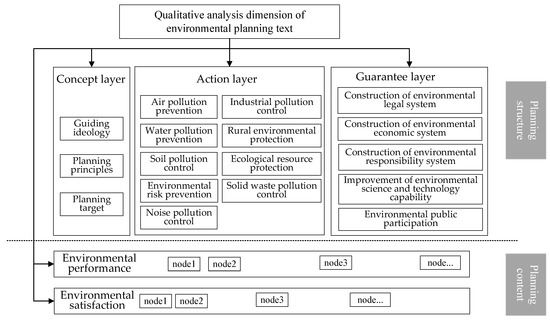
Figure 3.
Policy Text Analysis Framework for Environmental Planning.
Here, the work arrangement designed to improve environmental performance in the plan was listed under the environmental performance node as a coding reference point, while the work arrangement designed to improve public satisfaction in the plan was listed under the public satisfaction node as a coding reference point. According to this, the manual coding of “parent node–first-level sub-node–second-level sub-node–reference point” was completed.
Once the coding was complete, the coverage of various reference points under the parent node, first-level sub-node, and second-level sub-node was measured in order to comprehend how environmental planning could be organized in order to improve environmental performance and public satisfaction. We also contrasted and examined the traits of writings on environmental planning in various kinds of cities.
3.4.3. Testing for Reliability
In order to increase the validity of the study, two additional students were requested to participate in the coding process in addition to the authors of this paper. Each of them independently coded three randomly chosen sample plan texts. We determined the consistency of the three environmental plan coding samples, which was above 85%, using the “Query”—“Code Comparison” feature of the NVivo 11 plus program. Generally speaking, the coding results can typically be accepted if there is 80% agreement amongst the various coders [60]; hence, this study’s dependability meets the consistency standards.
4. Results
4.1. Findings from the Performance and Satisfaction Consistency Analysis
In this study, we assessed 37 cities’ environmental performance throughout the 2010–2020 period and gathered information on their residents’ environmental happiness over a ten-year period. These cities can be categorized into four groups based on the consistency between performance and satisfaction (as in Figure 4). Ten cities, including Xining and Tianjin, have worse environmental performance than other cities but higher public environmental satisfaction. Thirteen cities, including Beijing and Fuzhou, have higher environmental performance than other cities but local residents’ satisfaction with the environment is at a lower level. Nine cities, including Shenyang, Taiyuan, and Wuhan, had lower environmental performance and public happiness than other cities. Only five cities, Zhuhai, Hangzhou, Xiamen, Nanjing, and Qingdao, outperformed other cities in both the categories of environmental performance and public satisfaction.
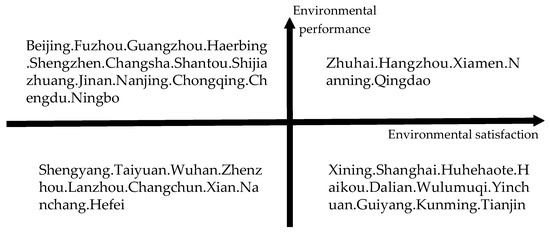
Figure 4.
Classification of actual cities based on the results of environmental performance and public environmental satisfaction.
4.2. Findings from the Planning Text Analysis
In terms of the policy texts’ connotations, the planning texts include various layers, such as the concept, action, and guarantee layers; in terms of the policy texts’ structure, the texts include the governance measures that the government intends to take in various areas, such as the atmosphere, the water environment, and ecological resources; in terms of the planning texts’ content, the texts include work arrangements that point to improving environmental conditions. The text coding results of this study are shown in Table 4, together with the related node coverage and the corresponding planned work arrangements coded as reference points under various node layers.
Table 4.
Environmental planning text coding results.
According to the content and coverage of the reference points of environmental performance and environmental satisfaction, the arrangement of environmental planning to improve environmental performance is biased towards engineering measures such as adding new pollutant treatment equipment and building disposal sites, and mainly re-lies on “command-and-control”-type measures. Moreover, the environmental planning texts have more work arrangements for improving environmental performance, with a nodal coverage of 69.29%, while the nodal coverage of texts targeting improved public environmental satisfaction is only 30.71%.
At the concept layer, with a coverage rate of 3.77%, the reference points related to environmental performance are primarily “environmental quality, total pollutant control, and sustainable development”; meanwhile, those related to public environmental satisfaction are primarily “environmentally friendly society, maintenance of people’s health, and people’s environmental rights”, and the code coverage rate is only 2.47%, which is slightly lower than the performance. In terms of planning principles, reference points with a 3.96% coding coverage include “quality core, prevention and control by legislation, absolute control, localization, and regional coordination” in relation to environmental performance; while “people-oriented, public participation” in relation to public environmental satisfaction are included in the reference points, with a coverage rate of only 2.93%, which is also less than the performance. Obviously, the planning principles are more closely tied to enhancing environmental performance, whereas the guiding ideas are more oriented to statements related to increasing public environmental satisfaction. Therefore, we believe that the planning texts’ guiding ideology has a more humanistic and human-centered focus, while the planning principles are more of a mechanism for putting the plan into action and have a weaker direct relationship to the feelings of the citizens.
The planning texts’ action layer primarily refers to the specific areas in which the government is taking action to protect the environment. These eight areas are: air pollution, water pollution, soil pollution, solid waste pollution, noise pollution, industrial pollution, the rural environment, and ecological resources. In terms of the coding coverage of the first-level sub-nodes, the four areas that the planning text focuses on the most are air pollution prevention and control, water pollution prevention and control, solid waste pollution prevention and control, ecological resource diversity, and environmental risk prevention. In terms of actions to improve environmental performance, the planning texts address many areas, such as air, water, soil, solid waste, and noise, and the relevant coverage rate is higher than 4%, with some nodes reaching a coverage rate of more than 5%. Looking back at the secondary sub-nodes related to public environmental satisfaction, we can see that only the reference points in the field of water pollution prevention and control, “black and smelly water, drinking water safety, inland river landscape”, have a coding coverage rate of more than 4%. The reference points in other fields are less than 3%, and are even as low as about 1%, which reveals a big gap compared with the coding coverage rate related to improving environmental performance.
The environmental working arrangement, which includes the development of an environmental rule-of-law system, an environmental economic system, an environmental responsibility system, the improvement of environmental science and technology capacity, environmental public participation, etc., is referred to as the guarantee layer in the planning text. In addition to fostering social supervision (3.6%) and encouraging public participation (3.26%), the government continues to place a priority on improving environmental performance at the safeguard level of the plan, and the coverage rate of the remaining secondary sub-nodes’ content is less than 2%, and even as low as 0.48%.
4.3. Characteristics of Various City Types as Described in Planning Texts
In accordance with Section 4.1, this section categorizes planning texts in an effort to comprehend the peculiarities of planning texts in various city types and identify the policy drivers of the current condition of environmental governance. Consequently, environmental planning texts from five cities with high performance and high satisfaction, thirteen cities with high performance and low satisfaction, thirteen cities with low performance and high satisfaction, and ten cities with low performance and low satisfaction were collected. Since comparing the overall number of nodes is meaningless due to the different types of city having varying numbers of planning documents, this paper calculated the average number of secondary nodes across all environmental planning texts for all city types (as in Table 5). In addition, in order to compare the differences between different cities more intuitively, Figure 5, Figure 6, Figure 7 and Figure 8 depict the average number of nodes in the planning texts for cities with “high performance and high satisfaction”, “high performance and low satisfaction”, “low performance and high satisfaction”, and “low performance and high satisfaction”, respectively. The average number of reference nodes for enhancing environmental satisfaction in each environmental plan text is shown as an orange line, while the average number of points for improving environmental performance is shown as a blue bar for each environmental plan text.
Table 5.
The average number of nodes for different types of urban environment planning text.
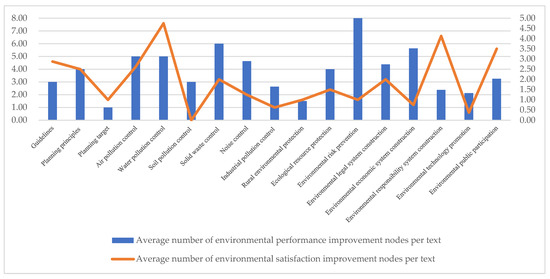
Figure 5.
Cities with high environmental performance and high environmental satisfaction.
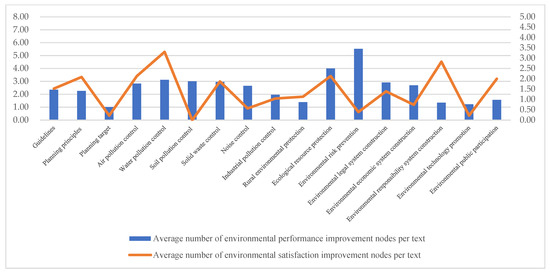
Figure 6.
Cities with high environmental performance and low environmental satisfaction.
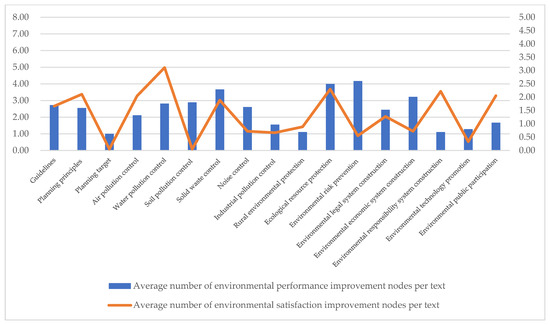
Figure 7.
Cities with low environmental performance and high environmental satisfaction.
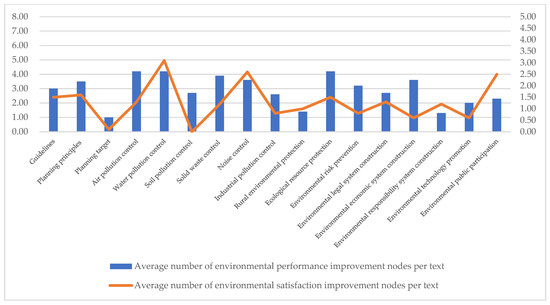
Figure 8.
Cities with low environmental performance and low environmental satisfaction.
Compared with the environmental plans of other three cities, the environmental plans of cities with high performance and high satisfaction have the most work arrangements for improving performance and satisfaction. Under the guidance and constraints of environmental planning, it can be considered that the environmental performance and public satisfaction of cities can be improved. When comparing cities with high environmental performance and low environmental satisfaction to those with low environmental performance and high environmental satisfaction, the former have more work arrangements in four categories: environmental risk prevention, water environment management, air environment management, and industrial pollution prevention. It is worth noting that cities with high performance satisfaction also pay great attention to the prevention of ecological environmental risks when preparing environmental plans. As the “eye” and “ear” of governance, environmental monitoring serves as the basis of all environmental protection work and is the most basic embodiment of urban governance capacity [61,62]. When comparing the distribution of planning nodes between cities with high environmental performance and low environmental satisfaction and cities with high environmental performance and high environmental satisfaction, we can see that there is a significant difference in public participation, which may help to explain why these cities are falling behind in terms of environmental performance. In addition, cities with low environmental performance and high environmental satisfaction place more emphasis on public-related work arrangements in the planning texts in environmental management areas (such as air, water, soil, and noise) compared to cities with high environmental performance and low environmental satisfaction. Finally, cities with low environmental performance and satisfaction place greater priority on the organization of work for improving environmental performance than the other three types of city, particularly in the areas of air pollution, water pollution, and industrial pollution management. Nevertheless, cities in this category fail to prioritize taking the public’s influence into account while managing the environment.
5. Discussion
Based on the analysis of the policy texts, it is evident that the environmental plan, which is considered to be the “baton” of the government’s environmental protection work, has established appropriate work arrangements in terms of planning concepts, action tasks, and work guarantees for enhancing environmental performance and raising public satisfaction with the environment. Regarding specific work tools, the plan tends to direct the government to improve environmental performance through engineering and technical means, such as improving pollutant treatment facilities and adding new pollutant disposal sites, and to improve environmental satisfaction by enhancing the public perception of environmental quality and encouraging public involvement in activities related to environmental protection. Additionally, there are comparatively fewer work arrangements in the planning texts that direct the government to increase public environmental satisfaction than those leading the government to improve environmental performance.
Based on the characteristics of the environmental planning texts of various cities, the planning texts of different types of city have no significant differences in guiding ideology and planning principles; this reveals that environmental planning has a high degree of conceptual consistency in the concept layer. This is because environmental governance in China is influenced by the overall guidance of the Party and the central government, and maintains a high degree of consistency with the higher cons, reflecting a very clear central demand origin [63,64]. However, certain differences exist in other aspects of the planning texts of different types of city, which explains the policy behind the current governance situation.
Cities with high environmental performance and satisfaction have prepared environmental plans with much higher work arrangements than other types of city for both improving environmental performance and increasing environmental satisfaction. Their well-developed and detailed planning arrangements provide strong support for doing so.
Cities with high environmental performance and low environmental satisfaction have many environmental monitoring devices arranged for environmental risk prevention, which, to a certain extent, assures basic environmental management capabilities [65]. Public expectations [66,67] and perceived environmental quality [68], which are both subjective emotional perceptions, have an impact on public environmental satisfaction. According to the results of our coding, these cities place an excessive amount of emphasis on tasks that can be seen as affecting environmental performance, such as controlling industrial pollution and the quality of the water and air. They also emphasize short-term, rapid improvements in environmental performance, while giving less attention to the creation and composition of a healthy urban environmental system. Although a significant financial outlay and a severe halt in production for a brief period of time can result in an improvement in environmental performance, they also have a certain impact on housing and public life, “hedging” the public’s satisfaction with the environment. Additionally, the per capita GDP and education levels in the cities of Beijing, Fuzhou, Guangzhou, and Shenzhen, for instance, are higher, and the public is generally more environmentally conscious, resulting in higher expectations for the ecological environment and the efficiency of governmental governance. The expectation inconsistency theory states that if the perceived environmental quality is lower than anticipated, so, too, will be the public’s contentment with the environment. Thus, combined with the work arrangements for improving public satisfaction in the plan, the environmental planning texts of such cities are found to have some gaps with benchmark cities in terms of ensuring the public’s right to environmental information and fostering public environmental participation, which is the cause of the low satisfaction of such cities.
Cities with high environmental satisfaction but poor environmental performance can be roughly divided into two categories. Cities with high resource consumption and sound environmental management, such as Shanghai and Dalian, fall into one category, whereas cities with weak management capabilities and abundant natural resources, such as Guiyang, Kunming, and Urumqi, fall into the other. According to the findings of the monitoring indicators, a population’s economic development places a significant burden on environmental work due to the former’s resource consumption and pollutant emissions [69]. Taking Shanghai as an example, its rapid urbanization development has delivered vitality to the urban economy, but has also increased the difficulty of environmental governance. This is also consistent with the research results of the Environmental Planning Institute of the Ministry of Environmental Protection in 2016, that is, Shanghai’s environmental performance values are low due to the city’s limited energy endowment, energy consumption, and emissions [70]. However, in order to ensure a safe and livable living environment, Shanghai has further made plain its intention to construct suburban industrial blocks in cooperation with urban spatial planning. Regarding the latter, Guiyang, Kunming, and other cities are geographically located in the less developed western region, and their environmental management facilities and management capacities are comparably inadequate. However, as well-known tourist cities, these cities have a large area of forest and green space, forming a very good natural and human settlement environment. Although their performance is mediocre in terms of pollutant emissions and disposal, such cities perform very well in terms of “number of days to meet air quality standards”, “harmless domestic waste treatment rate”, “green space rate in built-up areas”, and other metrics indicating the effectiveness of environmental management. This group of cities places high value on enhancing how the environment is viewed by the general public, together with planning arrangements. Numerous work agreements in areas directly related to public life, such as the control of heavily polluted atmospheres; black, smelly water remediation; social noise treatment; and ecological corridor building have been made. Therefore, the quality of living environments and changes to them that are immediately felt by the public depend greatly on the establishment of public environmental satisfaction. The improvement of the living environment and natural environment that these projects can deliver has a greater impact on public satisfaction than the construction of a sewage treatment plant and solid waste disposal facilities.
Cities with low environmental performance and low public environmental satisfaction prioritize improving environmental performance in their environmental planning, despite their relatively low environmental performance. This study hypothesizes that this may be because these cities lack enough resource endowments and environmental self-cleaning capacities. It is not easy to improve environmental quality, even if the government launches environmental protection initiatives. Additionally, for energy-dependent heavily industrial cities, the implementation of the development policy for industrial structure adjustment and transformation has a long way to go, and its environmental performance is difficult to significantly improve in the short term. The degree of improvement in environmental quality that the public can perceive is also weak, which will naturally lead to dissatisfaction.
This paper makes the case that current “elitist” environmental planning, which concentrates on finding solutions to environmental issues, cannot simultaneously increase environmental performance and public satisfaction. Environmental planning must be changed to “participatory” planning that takes stakeholder demands into account. Such planning can make use of the public policy aspects of planning and offer a forum for dialogue and consensus-building between the public, businesses, and the government [71,72,73]. For the different types of city mentioned in this article, formulating appropriate plans is quite necessary. For cities with “high environmental performance and low environmental satisfaction”, promoting public involvement in the preparation and implementation of environmental plans can help the government understand the true demands of the public and effectively adjust public expectations of the efficacy of environmental management, bridging the gap caused by inconsistent expectations. For cities with “low environmental performance and high environmental satisfaction”, promoting the degree of public participation can help create a good and positive cycle of environmental governance, which is also an inherent requirement for improving environmental performance. For cities with “low environmental performance and low environmental satisfaction”, guiding the public to participate in the preparation and implementation of planning can help build good environmental public spirit, and the government and enterprises can be forced to accelerate the pace of industrial structure transformation. Thus, it can be said that for most cities, the transition to participatory environmental planning is a necessary and beneficial trend.
6. Conclusions
This paper measured the environmental performance of 37 medium and large Chinese cities between 2011 and 2020 by establishing a government environmental performance evaluation index system. Combined with the findings of a government environmental public service satisfaction questionnaire survey conducted by the Chinese Academy of Social Sciences, this paper divided cities into four categories: “high environmental performance and high environmental satisfaction”, “high environmental performance and low environmental satisfaction”, “low environmental performance and high environmental satisfaction”, and “low environmental performance and low environmental satisfaction”. Then, we use the policy text analysis method to examine the planning work arrangements that are closely related to environmental performance and public environmental satisfaction from the perspective of environmental planning, which is the “baton” of the government’s work in environmental protection. It is found that there are relatively few plans to improve public perceptions, such as noise control, domestic waste control, urban greening, and other work related to improving public environmental satisfaction. Environmental planning places more emphasis on basic and engineering measures that can effectively improve environmental performance. Moreover, there is a lack of concern for the public during the preparation and implementation of environmental planning, with no effort to construct a residential environment that the public cares about, strengthen communication with the public to optimize the relationship between the public and the government, or encourage the public to participate in environmental governance. Finally, the characteristics of planning texts in various types of city were examined, and we discovered that encouraging the transition from “elite” to “participatory” environmental planning can aid governments in enhancing both environmental performance and public satisfaction.
This article has some limitations, and future research should be conducted with different viewpoints. First, the implementation of the environmental system represented by environmental planning—which also incorporates other synergistic policies such as municipal environmental legislation—has led to changes in environmental performance and public satisfaction. Follow-up research could start with the whole institutional system and explore the impact of collaborative systems on the effectiveness of environmental governance. Second, this paper takes the text content of environmental planning, the precursor of government behavior, as its research object. Interviews could be conducted with the heads of relevant departments in future research to figure out how planning texts are actually implemented so as to supplement the research on this issue from the perspective of policy implementation. Third, this work only gathered 56 publicly released environmental planning documents from 27 cities due to a lack of data availability, which is the result of inadequate environmental communication channels during the 12th and 13th Five-Year Plans. According to the Ministry of Ecology and the Environment’s requirements, announced at the end of February 2022, governments at all levels have been required to follow the protocols and release environmental planning documents to the public since the 14th Five-Year Plan. As a result, from the standpoint of environmental planning, more comprehensive information could be acquired to explain the reasons behind the disparity between environmental performance and public environmental satisfaction.
Author Contributions
Conceptualization, C.B. and W.M.; methodology, C.B.; software, N.W.; validation, N.W.; formal analysis, N.W.; investigation, N.W.; resources, N.W.; data curation, N.W.; writing—original draft preparation, N.W.; writing—review and editing, C.B.; visualization, N.W.; supervision, W.M.; project administration, N.W. All authors have read and agreed to the published version of the manuscript.
Funding
This research received no external funding.
Institutional Review Board Statement
Not applicable.
Informed Consent Statement
Not applicable.
Data Availability Statement
The data presented in this study are available on request from the corresponding author.
Conflicts of Interest
The authors declare no conflict of interest.
References
- Jia, W. Research topics and evolutionary trends in domestic environmental governance-Quantitative analysis of CSSCI source journal papers. J. Arid. Land Resour. Environ. 2019, 33, 10. [Google Scholar]
- Chinese Government Website. Bulletin on China’s Ecological Environment. 2021. Available online: http://www.gov.cn/xinwen/2022-05/28/content_5692799.htm (accessed on 28 May 2022).
- Liu, Z.; Liu, X. Evaluation of Chinese Cites’ Basic Public Service Capability; Social Sciences Academic Press (CHINA): Beijing, China, 2021; pp. 97–103. [Google Scholar]
- Wei, Y.; Guo, Y.; Su, J. Dancing on a tightrope: The reputation management of local governments in response to public protests in China. Public Adm. 2021, 99, 547–562. [Google Scholar] [CrossRef]
- Nakamura, H.; Managi, S. Effects of subjective and objective city evaluation on life satisfaction in Japan. J. Clean. Prod. 2020, 256, 120523. [Google Scholar] [CrossRef]
- Li, W.; de Oliveira, J.A.P. Environmental governance for sustainable development in Asia. J. Environ. Manag. 2021, 290, 112622. [Google Scholar] [CrossRef] [PubMed]
- Chen, Y.; Zhang, J.; Tadikamalla, P.R.; Gao, X. The relationship among government, enterprise, and public in environmental governance from the perspective of multi-player evolutionary game. Int. J. Environ. Res. Public Health 2019, 16, 3351. [Google Scholar] [CrossRef] [PubMed]
- Ma, B.; Zheng, X. Biased data revisions: Unintended consequences of China’s energy-saving mandates. China Econ. Rev. 2018, 48, 102–113. [Google Scholar] [CrossRef]
- Xie, Z. China’s historical evolution of environmental protection along with the forty years’ reform and opening-up. Environ. Sci. Ecotechnol. 2020, 1, 100001. [Google Scholar] [CrossRef]
- Faludi, A. (Ed.) Part II: The Idea of Planning. A Reader in Planning Theory; NDREAS FALUDI Pergamon Press: Oxford, UK, 1973; pp. 41–44. [Google Scholar]
- Chang, D. Connotation, Process, Function and Improvement of Institutional Design of Chinese Ecological Civilization Construction. Environ. Protection 2021, 49, 47–51. [Google Scholar]
- Jin, T.; Lu, B. Institutional Construction: Reflections on How to Resolve Collective Action Dilemmas. J. Nanjing Norm. Univ. (Soc. Sci. Ed.) 2016, 2, 12. [Google Scholar]
- Ostrom, E. Chapter 1—Reflections on the commons. In Governing the Commons: The Evolution of Institutions for Collective Action; Cambridge University Press: Cambridge, UK, 1990; pp. 23–34. [Google Scholar]
- Stipak, B. Citizen satisfaction with urban services: Potential misuse as a performance indicator. Public Adm. Rev. 1979, 39, 46–52. [Google Scholar] [CrossRef]
- Zhu, J.; Lu, C.; Wei, Z. Perception of Air Pollution and the Evaluation of Local Governments’ Environmental Governance: An Empirical Study on China. Atmosphere 2023, 14, 212. [Google Scholar] [CrossRef]
- Axelrod, L.J.; Lehman, D.R. Responding to environmental concerns: What factors guide individual action? J. Environ. Psychol. 1993, 13, 149–159. [Google Scholar] [CrossRef]
- Swami, V.; Chamorro-Premuzic, T.; Snelgar, R.; Furnham, A. Egoistic, altruistic, and biospheric environmental concerns: A path analytic investigation of their determinants. Scand. J. Psychol. 2010, 51, 139–145. [Google Scholar] [CrossRef] [PubMed]
- Bouckaert, G.; Van de Walle, S. Comparing measures of citizen trust and user satisfaction as indicators of ‘good governance’: Difficulties in linking trust and satisfaction indicators. Int. Rev. Adm. Sci. 2003, 69, 329–343. [Google Scholar]
- Brown, K.; Coulter, P.B. Subjective and objective measures of police service delivery. Public Adm. Rev. 1983, 43, 50–58. [Google Scholar] [CrossRef]
- Parks, R.B. Linking objective and subjective measures of performance. Public Adm. Rev. 1984, 44, 118–127. [Google Scholar] [CrossRef]
- Percy, S.L. In defense of citizen evaluations as performance measures. Urban Aff. Q. 1986, 22, 66–83. [Google Scholar] [CrossRef]
- Shim, I.K.; Kim, J.; Won, S.R.; Hwang, E.S.; Lee, Y.; Park, S.; Ryu, J.; Lee, J. Prevalence of sick building syndrome symptoms and subjective–objective indoor air quality of stores in underground shopping districts of Korea. Build. Environ. 2023, 228, 109882. [Google Scholar] [CrossRef]
- Brudney, J.L.; England, R.E. Urban policy making and subjective service evaluations: Are they compatible? Public Adm. Rev. 1982, 42, 127–135. [Google Scholar] [CrossRef]
- Omri, A.; Omri, H.; Slimani, S.; Belaid, F. Environmental degradation and life satisfaction: Do governance and renewable energy matter? Technol. Forecast. Soc. Chang. 2022, 175, 121375. [Google Scholar] [CrossRef]
- Shi, W.; Shen, J.; Liu, B. Formation and Evolution of the “Element-Field-Task” System for National Eco-Environment Planning. China Environ. Manag. 2020, 12, 65–70. [Google Scholar]
- Wang, J.; Jiang, H. National “Twelfth Five-Year” environmental protection planning system and key tasks. Environ. Prot. 2012, 1, 51–55. [Google Scholar]
- Majid, A.; Yasir, M.; Yasir, M.; Javed, A. Nexus of institutional pressures, environmentally friendly business strategies, and environmental performance. Corp. Soc. Responsib. Environ. Manag. 2020, 27, 706–716. [Google Scholar] [CrossRef]
- Wu, J.; Ding, Y.; Zhang, F.; Li, D. How to improve environmental performance of heavily polluting companies in China? A cross-level configurational approach. J. Clean. Prod. 2021, 311, 127450. [Google Scholar] [CrossRef]
- Kraus, S.; Rehman, S.U.; García, F.J.S. Corporate social responsibility and environmental performance: The mediating role of environmental strategy and green innovation. Technol. Forecast. Soc. Chang. 2020, 160, 120262. [Google Scholar] [CrossRef]
- Rios, A.M.; Picazo-Tadeo, A.J. Measuring environmental performance in the treatment of municipal solid waste: The case of the European Union-28. Ecol. Indic. 2021, 123, 107328. [Google Scholar] [CrossRef]
- Wang, M.; Zhou, T. Does smart city implementation improve the subjective quality of life? Evidence from China. Technol. Soc. 2023, 72, 102161. [Google Scholar] [CrossRef]
- Zhang, Y.; Pu, H. Environmental indicators of sustainable computing applications for smart city. Concurr. Comput. Pract. Exp. 2019, 31, e4751. [Google Scholar] [CrossRef]
- Zhou, Y.; Li, W.; Yi, P.; Gong, C. Evaluation of city sustainability from the perspective of behavioral guidance. Sustainability 2019, 11, 6808. [Google Scholar] [CrossRef]
- Weng, Q.; Qin, Q.; Li, L. A comprehensive evaluation paradigm for regional green development based on “Five-Circle Model”: A case study from Beijing-Tianjin-Hebei. J. Clean. Prod. 2020, 277, 124076. [Google Scholar] [CrossRef]
- Ravina, M.; Panepinto, D.; Zanetti, M. District heating networks: An inter-comparison of environmental indicators. Environ. Sci. Pollut. Res. 2021, 28, 33809–33827. [Google Scholar] [CrossRef]
- Dong, Z.; Hao, C.; Li, H.; Ge, C.; Yuan, Z.; Sheng, H.; Xu, H.; Weng, J.; Xu, Y.; Wang, H. Analysis of Provincial Environmental Performance Trend in China. Environ. Strategy Plan. China 2022. [Google Scholar] [CrossRef]
- Bian, J.; Ren, H.; Liu, P. Evaluation of urban ecological well-being performance in China: A case study of 30 provincial capital cities. J. Clean. Prod. 2020, 254, 120109. [Google Scholar] [CrossRef]
- Hao, C.; Zhao, Y.; Dong, Z.; Ge, C. Provincial environmental performance evaluation in China based on principal component analysis. Resour. Dev. Mark. 2016, 32, 26–30. [Google Scholar]
- Shun, L. Research on performance evaluation of urban low-carbon management: A case study in Foshan. Int. J. Low-Carbon Technol. 2022, 17, 1207–1215. [Google Scholar] [CrossRef]
- Meijering, J.V.; Tobi, H.; Kern, K. Defining and measuring urban sustainability in Europe: A Delphi study on identifying its most relevant components. Ecol. Indic. 2018, 90, 38–46. [Google Scholar] [CrossRef]
- Zhang, D.; Chen, Y. Evaluation on urban environmental sustainability and coupling coordination among its dimensions: A case study of Shandong Province, China. Sustain. Cities Soc. 2021, 75, 103351. [Google Scholar] [CrossRef]
- Korkmaz, C.; Balaban, O. Sustainability of urban regeneration in Turkey: Assessing the performance of the North Ankara Urban Regeneration Project. Habitat Int. 2020, 95, 102081. [Google Scholar] [CrossRef]
- Chen, Y.; Zhu, M.; Lu, J.; Zhou, Q.; Ma, W. Evaluation of ecological city and analysis of obstacle factors under the background of high-quality development: Taking cities in the Yellow River Basin as examples. Ecol. Indic. 2020, 118, 106771. [Google Scholar] [CrossRef]
- Zhang, M.; Liu, Y.; Wu, J.; Wang, T. Index system of urban resource and environment carrying capacity based on ecological civilization. Environ. Impact Assess. Rev. 2018, 68, 90–97. [Google Scholar] [CrossRef]
- Fang, X.; Shi, X.; Phillips, T.K.; Gao, W. Comparative Urban Performance Evaluation of Sustainable Urbanization in Four Typical Megalopolises in China. Buildings 2022, 12, 1422. [Google Scholar] [CrossRef]
- Tan, J.; Wang, R. Research on evaluation and influencing factors of regional ecological efficiency from the perspective of carbon neutrality. J. Environ. Manag. 2021, 294, 113030. [Google Scholar] [CrossRef]
- Fan, Y.; Fang, C.; Zhang, Q. Coupling coordinated development between social economy and ecological environment in Chinese provincial capital cities-assessment and policy implications. J. Clean. Prod. 2019, 229, 289–298. [Google Scholar] [CrossRef]
- Hou, Y.; Zhang, K.; Zhu, Y.; Liu, W. Spatial and temporal differentiation and influencing factors of environmental governance performance in the Yangtze River Delta, China. Sci. Total Environ. 2021, 801, 149699. [Google Scholar] [CrossRef] [PubMed]
- Zhou, N.; He, G.; Williams, C.; Fridley, D. ELITE cities: A low-carbon eco-city evaluation tool for China. Ecol. Indic. 2015, 48, 448–456. [Google Scholar] [CrossRef]
- Moroke, T.; Schoeman, C.; Schoeman, I. Developing a neighborhood sustainability assessment model: An approach to sustainable urban development. Sustain. Cities Soc. 2019, 48, 101433. [Google Scholar] [CrossRef]
- Zhongyu, Z.; Zhongxiang, Z. The Construction and Empirical Study on Evaluation Index System of International Low-Carbon Economy Development. Front. Energy Res. 2021, 9, 761567. [Google Scholar] [CrossRef]
- Wang, T.; Yuan, Z.W. Environmental performance evaluation in Jiangsu Province based on pressure-state-response model. Chin. J. Environ. Manag. 2017, 9, 59–65. [Google Scholar]
- Dong, F.; Pan, Y.; Zhang, X.; Sun, Z. How to evaluate provincial ecological civilization construction? The case of Jiangsu province. Int. J. Environ. Res. Public Health 2020, 17, 5334. [Google Scholar] [CrossRef]
- Cheng, R.; Li, W.; Lu, Z.; Zhou, S.; Meng, C. Integrating the three-line environmental governance and environmental sustainability evaluation of urban industry in China. J. Clean. Prod. 2020, 264, 121554. [Google Scholar] [CrossRef]
- Mori, K.; Christodoulou, A. Review of sustainability indices and indicators: Towards a new City Sustainability Index (CSI). Environ. Impact Assess. Rev. 2012, 32, 94–106. [Google Scholar] [CrossRef]
- Muganyi, T.; Yan, L.; Sun, H.-P. Green finance, fintech and environmental protection: Evidence from China. Environ. Sci. Ecotechnol. 2021, 7, 100107. [Google Scholar] [CrossRef] [PubMed]
- Joss, S.; Sengers, F.; Schraven, D.; Caprotti, F.; Dayot, Y. The smart city as global discourse: Storylines and critical junctures across 27 cities. J. Urban Technol. 2019, 26, 3–34. [Google Scholar] [CrossRef]
- Yang, L. Product-Institutional Analysis (PIA) framework. In Participatory Governance by Experts and Scholars: A New Model for Solving the Dilemma of Desertification and Other Collective Action; Zhen, W., Yang, L., Eds.; Peking University Press: Beijing, China, 2015; pp. 102–115. [Google Scholar]
- Qin, H. Attention allocation in local government environmental governance: NVivo analysis based on 20 provincial ecological environmental protection policies. Environ. Prot. Circ. Econ. 2020, 40, 77–84. [Google Scholar]
- Dalkin, S.; Forster, N.; Hodgson, P.; Lhussier, M.; Carr, S. Using NVivo to enhance transparency in a realist evaluation. QSR Int. Retrieved Febr. 2015, 14, 2020. [Google Scholar]
- Grennfelt, P.; Engleryd, A.; Forsius, M.; Hov, Ø.; Rodhe, H.; Cowling, E. Acid rain and air pollution: 50 years of progress in environmental science and policy. Ambio 2020, 49, 849–864. [Google Scholar] [CrossRef] [PubMed]
- Tmušić, G.; Manfreda, S.; Aasen, H.; James, M.R.; Gonçalves, G.; Ben-Dor, E.; Brook, A.; Polinova, M.; Arranz, J.J.; Mészáros, J.; et al. Current practices in UAS-based environmental monitoring. Remote Sens. 2020, 12, 1001. [Google Scholar] [CrossRef]
- Zhang, J.; Liu, M.; Zhang, B. Environmental policy integration and performance: The effectiveness of China’s one permit management reform. Environ. Impact Assess. Rev. 2023, 98, 106951. [Google Scholar] [CrossRef]
- Cheng, S.; Fan, W.; Chen, J.; Meng, F.; Liu, G.; Song, M.; Yang, Z. The impact of fiscal decentralization on CO2 emissions in China. Energy 2020, 192, 116685. [Google Scholar] [CrossRef]
- Indrajit, A.; Van Loenen, B.; Van Oosterom, P. Assessing spatial information themes in the spatial information infrastructure for participatory urban planning monitoring: Indonesian cities. ISPRS Int. J. Geo-Inf. 2019, 8, 305. [Google Scholar] [CrossRef]
- Lee, C.P.; Hung, M.J.; Chen, D.Y. Factors affecting citizen satisfaction: Examining from the perspective of the expectancy disconfirmation theory and individual differences. Asian J. Political Sci. 2022, 30, 35–60. [Google Scholar] [CrossRef]
- Sun, Z.; Li, J. Citizens’ satisfaction with air quality and key factors in China—Using the anchoring vignettes method. Sustainability 2019, 11, 2206. [Google Scholar] [CrossRef]
- Ranjan, P.; Church, S.P.; Floress, K.; Prokopy, L.S. Synthesizing conservation motivations and barriers: What have we learned from qualitative studies of farmers’ behaviors in the United States? Soc. Nat. Resour. 2019, 32, 1171–1199. [Google Scholar] [CrossRef]
- Pan, H.; Zhuang, M.; Geng, Y.; Wu, F.; Dong, H. Emergy-based ecological footprint analysis for a mega-city: The dynamic changes of Shanghai. J. Clean. Prod. 2019, 210, 552–562. [Google Scholar] [CrossRef]
- Ge, L.; Zhao, H.; Yang, J.; Yu, J.; He, T. Green finance, technological progress, and ecological performance—Evidence from 30 Provinces in China. Environ. Sci. Pollut. Res. 2022, 29, 66295–66314. [Google Scholar] [CrossRef]
- Evers, J.; Douven, W.; Van der Stroom, J.; Hasan, S.; Seijger, C.; Phi, H. A framework to assess the performance of participatory planning tools for strategic delta planning. J. Environ. Plan. Manag. 2019, 62, 1636–1653. [Google Scholar] [CrossRef]
- De Blust, S.; Devisch, O.; Vandenabeele, J. Learning to reflect collectively: How to create the right environment for discussing participatory planning practice? Eur. Plan. Stud. 2022, 30, 1162–1181. [Google Scholar] [CrossRef]
- Hossu, C.A.; Oliveira, E.; Niță, A. Streamline democratic values in planning systems: A study of participatory practices in European strategic spatial planning. Habitat Int. 2022, 129, 102675. [Google Scholar] [CrossRef]
Disclaimer/Publisher’s Note: The statements, opinions and data contained in all publications are solely those of the individual author(s) and contributor(s) and not of MDPI and/or the editor(s). MDPI and/or the editor(s) disclaim responsibility for any injury to people or property resulting from any ideas, methods, instructions or products referred to in the content. |
© 2023 by the authors. Licensee MDPI, Basel, Switzerland. This article is an open access article distributed under the terms and conditions of the Creative Commons Attribution (CC BY) license (https://creativecommons.org/licenses/by/4.0/).