Article

Equalization Measurement and Optimization of the Public Cultural Facilities Distribution in Tianjin Central Area

1
School of Architecture, Tianjin Chengjian University, Tianjin 300380, China
2
Department of Architecture, Faculty of Environmental Engineering, The University of Kitakyushu, Kitakyushu 808-0135, Japan
3
Tianjin Chengjian University of Architectural Design and Research Co., Ltd., Tianjin 300074, China
*
Author to whom correspondence should be addressed.
Sustainability 2023, 15(6), 4856; https://doi.org/10.3390/su15064856
Submission received: 24 December 2022 / Revised: 1 March 2023 / Accepted: 6 March 2023 / Published: 9 March 2023

Abstract

:
In the context of urban stock renewal, the spatial arrangement of public cultural facilities (PCFs) should follow the principles of equity and efficiency to ensure that residents have equitable access to and quality of public cultural services. The aim of this article is to study the spatial distribution of PCFs and the coupling of supply and demand of cultural resources in Tianjin’s central area. By building a supply-demand coupling coordination model and other methods, the equalization of the spatial distribution of PCFs is measured from various perspectives, and the results suggest that more than half of the sub-districts are in a situation of supply and demand imbalance. To fulfill the purpose of meeting residents’ actual needs, balancing supply and demand for cultural resources, and coordinating the increase in stock, these sub-districts’ facilities enter the step of optimization. Depending on the circumstances, the quality and scale of these facilities are optimized, or new facility points are added based on the maximized coverage model. The optimization is shown to be beneficial in terms of updating design and coverage quantity using two real-world cases. Finally, the coverage of facilities in the study area is maximized, facility utilization is made more efficient, and residents’ needs for public cultural services are satisfied.

1. Introduction

PCFs are an important part of urban public resources and bear the important responsibility of displaying the achievements of cultural construction and safeguarding the cultural rights and interests of residents. The level of equalization of their spatial distribution is directly related to the opportunities and quality of public cultural services enjoyed by residents. Museums, monuments, public libraries, art museums, and cultural centers are PCFs with fundamental, equitable, public welfare, and social character. These facilities represent the overall level of spatial distribution and equalization of PCFs in Tianjin in a more comprehensive way, so the above cultural facilities were selected as the research subjects. At present, Chinese residents have gradually changed from basic material needs to spiritual and cultural pursuits, and there is an urgent need for convenient and high-quality public cultural services. Spatial planning guidance: community life unit for 2021 [1] emphasizes the importance of addressing inhabitants’ fundamental necessities and cultural experiences within a 15 min pedestrian scale. The 14th Five-Year Plan for Public Services [2] proposes that the level of equalization of basic public services will be significantly higher by 2025 and basically achieved by 2035. In 2015, the Implementation Opinions of Tianjin on Accelerating the Construction of Modern Public Cultural Service System [3] stated that it was necessary to integrate Tianjin’s cultural resources, coordinate the distribution of cultural facilities, and promote the comprehensive, coordinated, and sustainable development of cultural undertakings and cultural industries. In 2020, Tianjin set the goal of building a culturally strong city [4].
Hansen established the concept of accessibility [5] in 1959, which has been frequently used to assess the quality of public services. Since then, many researchers have proposed a public facility coverage model for facility siting [6,7,8,9]. The Huff model, developed by American economist D.L. Huff, was also used to calculate the service coverage of public facilities [10]. Cooper introduced the LA model, which is based on industrial location theory and attempts to make public service facility distribution more efficient, practical, scientific, and reasonable [11]. Powell and Boyne use the ratio of public service expenditures to local demand to measure equalization, arguing that equalization is only considered when the ratio is equal across regions [12]. So far, residents’ needs have been assessed as a factor in the calculation of parity in facilities. Research has been initiated to measure the equalization of public service facilities from a supply and demand perspective [13]. Chinese research on the equalization of PCFs is based on Western ways to measure the equalization of PCFs, mostly using ArcGIS and SPSS, and focuses on the degree of service provision inside the facilities themselves [14,15,16]. Fewer studies take into account the demand factor of the population and measure accessibility with the level of supply and demand coordination [17].
In the optimization of the spatial distribution of facilities, most of the studies formulated the optimization objectives and principles according to the characteristics and policies of each location based on the problems that emerged from the previous study. An optimization model was built to calculate the optimization scheme and verify the results [18,19,20,21].
Current research mainly has the following problems and shortcomings. As far as research content is concerned, existing research focused mainly on the quantity of PCFs, while neglecting the quality of services and the impact of factors such as facility level, area, number of activities, and collections on the attractiveness of PCFs, which affects the comprehensiveness and reliability of the research results. From a research perspective, most of the research has been at the top-down planning level, with little consideration of bottom-up influencing factors such as resident demand [22]. In terms of research scales, there are more studies conducted on medium- and large-scale spaces, such as the city as the basic unit, but there are relatively few studies on the spatial allocation of PCFs at the sub-district size. In the research methods, there is a lack of quantitative models for equalization studies to conduct diverse studies on supply and demand coordination.
PCFs differ from other public service facilities in that they are in lower demand in China’s urbanization than facilities such as education and medical care. As a result, there are no corresponding indicators or norms to guide its configuration requirements in cities. Tianjin, as a megacity, has a high demand for PCFs in its central city, and it has proposed to prioritize PCFs. The equalization measurement and optimization of facilities in the Tianjin central area by using the requirement of the 15 min pedestrian scale to measure and optimize facility equalization can effectively compensate for a lack of quantitative research on the spatial distribution of PCFs. As a result, it is scientific and comprehensive to build a supply-demand coupling coordination model to assess the level of equalization of facilities.
This study used PCFs in the Tianjin central area as the observed object, and data were collected from a variety of sources. Based on the spatial analysis of ArcGIS (v.10.7) and SPSS (v.25.0), a spatial database of PCFs in central Tianjin was established to analyze the spatial distribution of PCFs. Then we created a supply-demand coupling coordination model to measure the level of equalization of PCFs. Finally, we proposed optimizing the quality of existing facilities and adding new facilities to meet the maximum coverage of PCFs in the 15 min pedestrian scale for sub-districts with uncoordinated supply and demand and inadequate coverage. To demonstrate the effect of optimization, a detailed before-and-after optimization comparison analysis of specific cases is also performed (Figure 1).
The objectives of this paper are: (1) To derive the characteristics and problems of the spatial distribution of existing facilities in the study area through mathematical statistics and spatial analysis. (2) To construct a supply-demand coupling coordination model to measure the degree of coordination between the supply level of facilities and the demand level of residents in the district. (3) To find out the optimization method for the facilities for different scenes in order to achieve sufficient quantity, high quality, and wide coverage.

2. Materials and Methods

2.1. Study Area

More than half of Tianjin’s PCFs are located in central urban areas. The quantity and quality advantages of PCFs are obvious, and the spatial distribution of high-end PCFs is highly concentrated. Therefore, the study area of this paper is the central area of Tianjin, including the 6 districts of Heping, Hedong, Hexi, Nankai, Hebei, and Hongqiao, with a total of 62 sub-districts (Figure 2). The central city is the birthplace of Tianjin and the center of political, cultural, economic, and commercial development. After the opening of Tianjin Port, many foreign settlements were established here, and after the 1920s, the settlements entered a period of large-scale construction. In the 1930s, the settlements were littered with high-rise buildings, and Tianjin already had modern urban infrastructure. In the area of the central city, the layout of PCFs has been formed with Haihe, the Grand Canal, and historical and cultural districts formed by the settlements as the main bodies. There are a large number of cultural facilities, whose subjects include ancient Chinese history, modern Chinese history, people’s memorials, scientific and technological development, nature, and modern cultural services.

2.2. Data Collection and Spatial Database

2.2.1. PCFs

The PCFs information was obtained from the National Museum Directory on the National Cultural Heritage Administration’s official website [23], the Museum Directory of the Tianjin Municipal Bureau of Culture and Tourism [24], the Tianjin Museum Public Service Platform [25], and other websites. The coordinates, level, address, and building area of the facilities were compiled through a combination of internet research and on-site research. The facility coordinates were retrieved by querying the Baidu map coordinate picking system [26] using the facility names and exact addresses, and the results were adjusted and converted. The ratings of residents’ satisfaction with the facilities on the Dianping website [27] were crawled using a crawler tool. By June 2022, the data from 96 PCFs in the central city of Tianjin were fully covered (Table 1).

2.2.2. Road Network and Administrative Boundary

The road network data was obtained using OpenStreetMap [28] and augmented with some of the branch road data that could not be captured by using Baidu Map to reflect the actual situation. The road network data was imported into ArcGIS for topology processing, which included deleting duplicate lines and combining nodes.
The administrative zoning data were retrieved from the 2022 national basic geographic information data within the National Catalogue Service for Geographic Information [29] and were used after screening, format conversion, and transforming to the WGS1984 coordinate system.

2.2.3. Population Data of Sub-Districts

Population data of sub-districts include the number of permanent residents in sub-districts and their age distribution, education level, and number of males and females. Detailed data were collected using the Baidu Huiyan platform [30], a commercial geographic intelligence data platform launched by Baidu Maps, combined with data from the seventh national census. The information was last updated in April 2022.

2.2.4. Points of Interest (POI) Data for Transit and Residential Areas

In the study of urban geography, a point of interest (POI) is a physical substance in space that is conceptualized as a point that contains information such as facility category, name, address, and coordinates. POI data of bus and subway stations, as well as residential areas in the Tianjin center area, were collected in order to scientifically optimize facility equalization. Based on the name and address information of bus and subway stations and residential areas, we checked their latitude and longitude coordinates in the Baidu coordinate picking system and converted their coordinate systems to the WGS1984.

2.2.5. Demand Data of Residents

The demand data came from the data related to facility users. In this study, user data were collected by delineating the collection area by the site contour of each facility to be collected on the Baidu Huiyan platform. Given the influence of the COVID-19 closure, seasonal reasons, holidays, and Monday closures on data collection, this paper chose the first and second Wednesdays to Sundays of April, July, September, and November 2021 as the collection times. The data will be aggregated, and the gender, age group, and education level of users will be counted separately.

2.3. Spatial Distribution Analysis Methods

Kernel density analysis is used to calculate the density of point elements around each output raster image element [31]. In recent years, it has been widely used in the spatial study of urban public facilities to visually reveal and describe the spatial clustering characteristics of the study object in the study area [32].
The spatial distribution state of a large number of points in a certain location is described using average nearest neighbor (ANN), which includes uniform, random, and aggregated distributions [33]. In this study, the ANN was used to describe the level of aggregation of PCFs in the study area.
The spatial characteristics of geographic elements can be summarized in ArcGIS by creating a standard deviational ellipse (SDE) [34]. The SDE analysis was performed separately for the sub-district center points with the number of populations as the weight value and the PCF points with the facility area as the weight value to compare the misalignment, trend, and coverage of their spatial distribution.
According to Tobler’s first law of geography [35], spatial autocorrelation is a spatial statistical method whose global and local spatial autocorrelation can better describe the relationship between geographic things and measure the degree of aggregation or dispersion among the attributes of spatial elements [36]. Moran’s I index was used in this study to examine the relationship between the spatial distribution of PCF and their own level and service capacity in Tianjin’s central area.

2.4. Calculations for Facility Supply

2.4.1. Accessibility

In this study, accessibility is calculated using a modified potential model that focuses on spatial interactions. The accessibility level is reflected by aggregating the potential possibilities for street residents to access PCF supply [7,32,37].
A i = i = 1 n S i j M j D i j β V j
V j = k = 1 m S k j P k D k j β
S i j = 1 D i j D j 2
The spatial accessibility of sub-districts point i to all facilities is denoted by A i . The spatial accessibility of sub-districts point i to facility point j is denoted by A i j . The size class coefficient of facility j is denoted by S i j . M j is the service capacity of facility j . The time cost of sub-districts point i is denoted by D i j . D j is the facility point j ’s maximum journey time. D k j is the distance cost of sub-district point k to reach facility j . n and m signify the number of facility points and sub-district points, respectively. β is the travel friction coefficient. and in this paper β takes a value of 2 [38].

2.4.2. Attractiveness

In this study, the Huff model was developed to calculate the attractiveness index and the probability of being selected for PCF, and the sum of the attractiveness of each street facility was obtained.
A i j = M j D i j λ
P i j = A i j j = 1 n A i j
The value of facility j floor space. D i j represents the cost of distance from sub-districts point i to facility j , and A represents the friction factor, which is set to 2 [39]. The probability of accessing facility location j for each sub-districts point i is given by P i j , while the total number of facilities is given by n .

2.4.3. Coverage Model

Coverage models are often used to study the service capacity and service efficiency of public facilities [40]. The coverage of PCF in this study is the ratio of the total area of the sub-district actually covered by the facilities within walking distance of 15 min to the area of the sub-district, and the part of repeated coverage is calculated only once.

2.5. Supply-Demand Coupling Coordination Model

PCF is a social resource with obvious spatial attributes. The supply of public cultural services and the demand of residents are in an interactive relationship. Whether they can balance each other is an important criterion for measuring the rational allocation and layout equalization of PCF. The measurement of supply-demand coupling coordination requires full consideration of the supply capacity of facilities and the demand structure of residents.
Theoretically, there exists a dynamic balance between supply and demand. The coordination of supply and demand is gradually reached in the process of development. In order to measure the interrelationship and coordination between supply and demand of PCF, this paper introduced the coupled supply and demand coordination model.

2.5.1. Construction of Supply and Demand Indicators Evaluation System

The system is constructed on four levels. The first level is the objective level (A), which is the general objective of the evaluation of PCF distribution; the second level is the system level (B), which is divided into two subsystems: facility supplies and resident demand; the third level is the element level (C), which is the explanation and refinement of the higher system level; and the fourth level is the indicator level (D), which needs to assign values to each indicator and directly reflect the situation of each subsystem through all the indicators, and then integrate the evaluation results of the subsystem to get the final overall target level (A).
The indicators evaluation system is established based on the principles of accessibility, hierarchy, and applicability. By reviewing norms [41] and summarizing previous studies [42,43,44], appropriate supply indicators were selected to constitute the facility supply indicator system. Then a hierarchical structure model and a composition judgment matrix were formed. Some relevant experts and scholars were invited to rank the importance of indicators, and the ranking results were used to determine the weights of each indicator using the Analytic Hierarchy Process (AHP). Finally, an evaluation system for facility supply indicators was formed.
In order to ensure the objectivity and authenticity of the resident demand indicator evaluation system, information data from facility users are used to form the indicators. The data acquired by Baidu Huiyan on users of PCF was aggregated. The ratios for gender, each age group, and education level were calculated independently. It was decided that these three indicators were equally important in the resident demand study and that their ratios were calculated separately. Then the sub-weights and final weights were calculated to form the resident demand indicator evaluation system. In the classification of educational level, non-higher education refers to high school and below, and higher education refers to college, undergraduate, and above.
Finally, the supply and demand indicators evaluation system shown in Table is obtained (Table 2).

2.5.2. Calculating the Supply-Demand Coupling Coordination Model

The calculation is as follows:
ρ x , y = i = 1 n X i X ¯ Y i Y ¯ i = 1 n X i X ¯ 2 Y i Y ¯ 2
In the formula, X , Y denote the supply index and demand index separately. are the correlation coefficients of variables X , Y . n is the number of samples, are the values of i -space cells corresponding to variables X , Y . X ¯ is the mean of sample X , Y ¯ is the mean of sample Y . The value of ρ is between −1 and 1.
C = X i × Y i × X i + Y i 2 2 k
C is the supply-demand coupling degree, and X i and Y i are the supply and demand indices of the i -space unit separately. k is the adjustment coefficient.
D = C × T 1 / 2
T = α × X i + β × Y i
C is the supply-demand coupling degree, D is the supply-demand coordinated development degree, and T is the comprehensive evaluation index of supply and demand, which reflects the contribution of both supply and demand to the degree of coordination. They are the supply index and demand index of spatial unit i , respectively, and α and β are coefficients to be determined and α + β = 1 . In this paper, the supply and demand of PCFs are considered equally important, so the values of α and β are both 0.5. The level of coordination between supply and demand that can be determined based on the value of the coordinated development degree. Combined with the interrelationship between supply and demand, the types of coordinated development can be classified [45].

2.6. Facility Equalization Optimization

Based on the evaluation results of the coordinated development degree, the optimization roadmap is designed with the goal of satisfying the actual demand of residents and mutual coordination of stock and increment. To balance supply and demand in the sub-districts and maximize coverage of residential neighborhoods, specific optimization measures used include upgrading the quality and scale of existing facilities and calculating the location of new facilities.

2.6.1. Optimization Model for Adding Facility Points

The location-allocation model in ArcGIS is used to optimize facility distribution by selecting the facility site with the best service capability from a large number of candidates specified by the user based on a specific optimization model. The maximized coverage model can maximize the effective coverage within a set value of impedance time. Therefore, the maximized coverage model is used in this study to achieve a certain level of total coverage of new and existing facility points within a 15 min impedance time.
The districts that need new facilities can be obtained in the subsequent equalization analysis, and we operated in these areas. Using the fishing net tool in ArcGIS, a square grid with 200 m side length was generated, and its center point was taken. Overlay the center mass point of the grid with the Baidu map and delete the center mass point within the sub-district that does not need to add facility points and the center mass point that falls within the transportation facilities, waters, green areas, campuses, and factories to ensure the accuracy and scientific validity of the candidate points. Using 15 min as the impedance time, the service area of the bus and subway station is established in ArcGIS, and the service area is overlaid with the grid mass points. The grid mass points located outside the service area were deleted to ensure that the candidate points have the advantages of convenient use and convenient public transportation. The 96 existing PCFs and facility points in the six districts of the city are also used as mandatory points in the calculation.

2.6.2. Facility Quality and Scale Optimization Strategy

As China’s urbanization enters a transformative stage with the renewal of stock space resources, there is a need to increase the supply of currently existing facilities in order to improve the equalization of public cultural services. With fixed transportation conditions, facility attractiveness and coverage must be improved. The primary focus is on improving the level, scale, and service level of facilities to ensure resident satisfaction. Meanwhile, Tianjin has rich historical and cultural resources. Many facilities have retained their historical appearance. It is very important to protect urban and historical heritage in the optimization program.
  • Expanding the Scale of Facilities
The expansion of the building and land area can improve the service level of facilities. The total construction of the Tianjin center area has essentially reached the stock stage. On this basis, it is required to assess the functions of the existing PCF and renovate or extend them. By focusing on the mix of functions on the land, they can improve their level of integration with the surrounding environment. To improve the usage rate and attractiveness of PCFs, mixed-cultural gathering areas should be created in conjunction with commercial, office, and residential plots.
2.
Improve the Quality of Facilities
Some related businesses can be developed in conjunction with the actual needs of residents in order to enrich the functions of PCFs and strengthen their functional compounds. For example, libraries can be combined with bookstores and reading cafes, and museums and exhibition halls can be combined with commerce to develop local cultural products and increase venue usage during non-event periods.

3. Results

3.1. Quantity Statistics

Facilities density and the number of facilities per capita were computed using data from the Tianjin Statistical Yearbook 2021 [46], such as the districts’ area and population (Table 3).

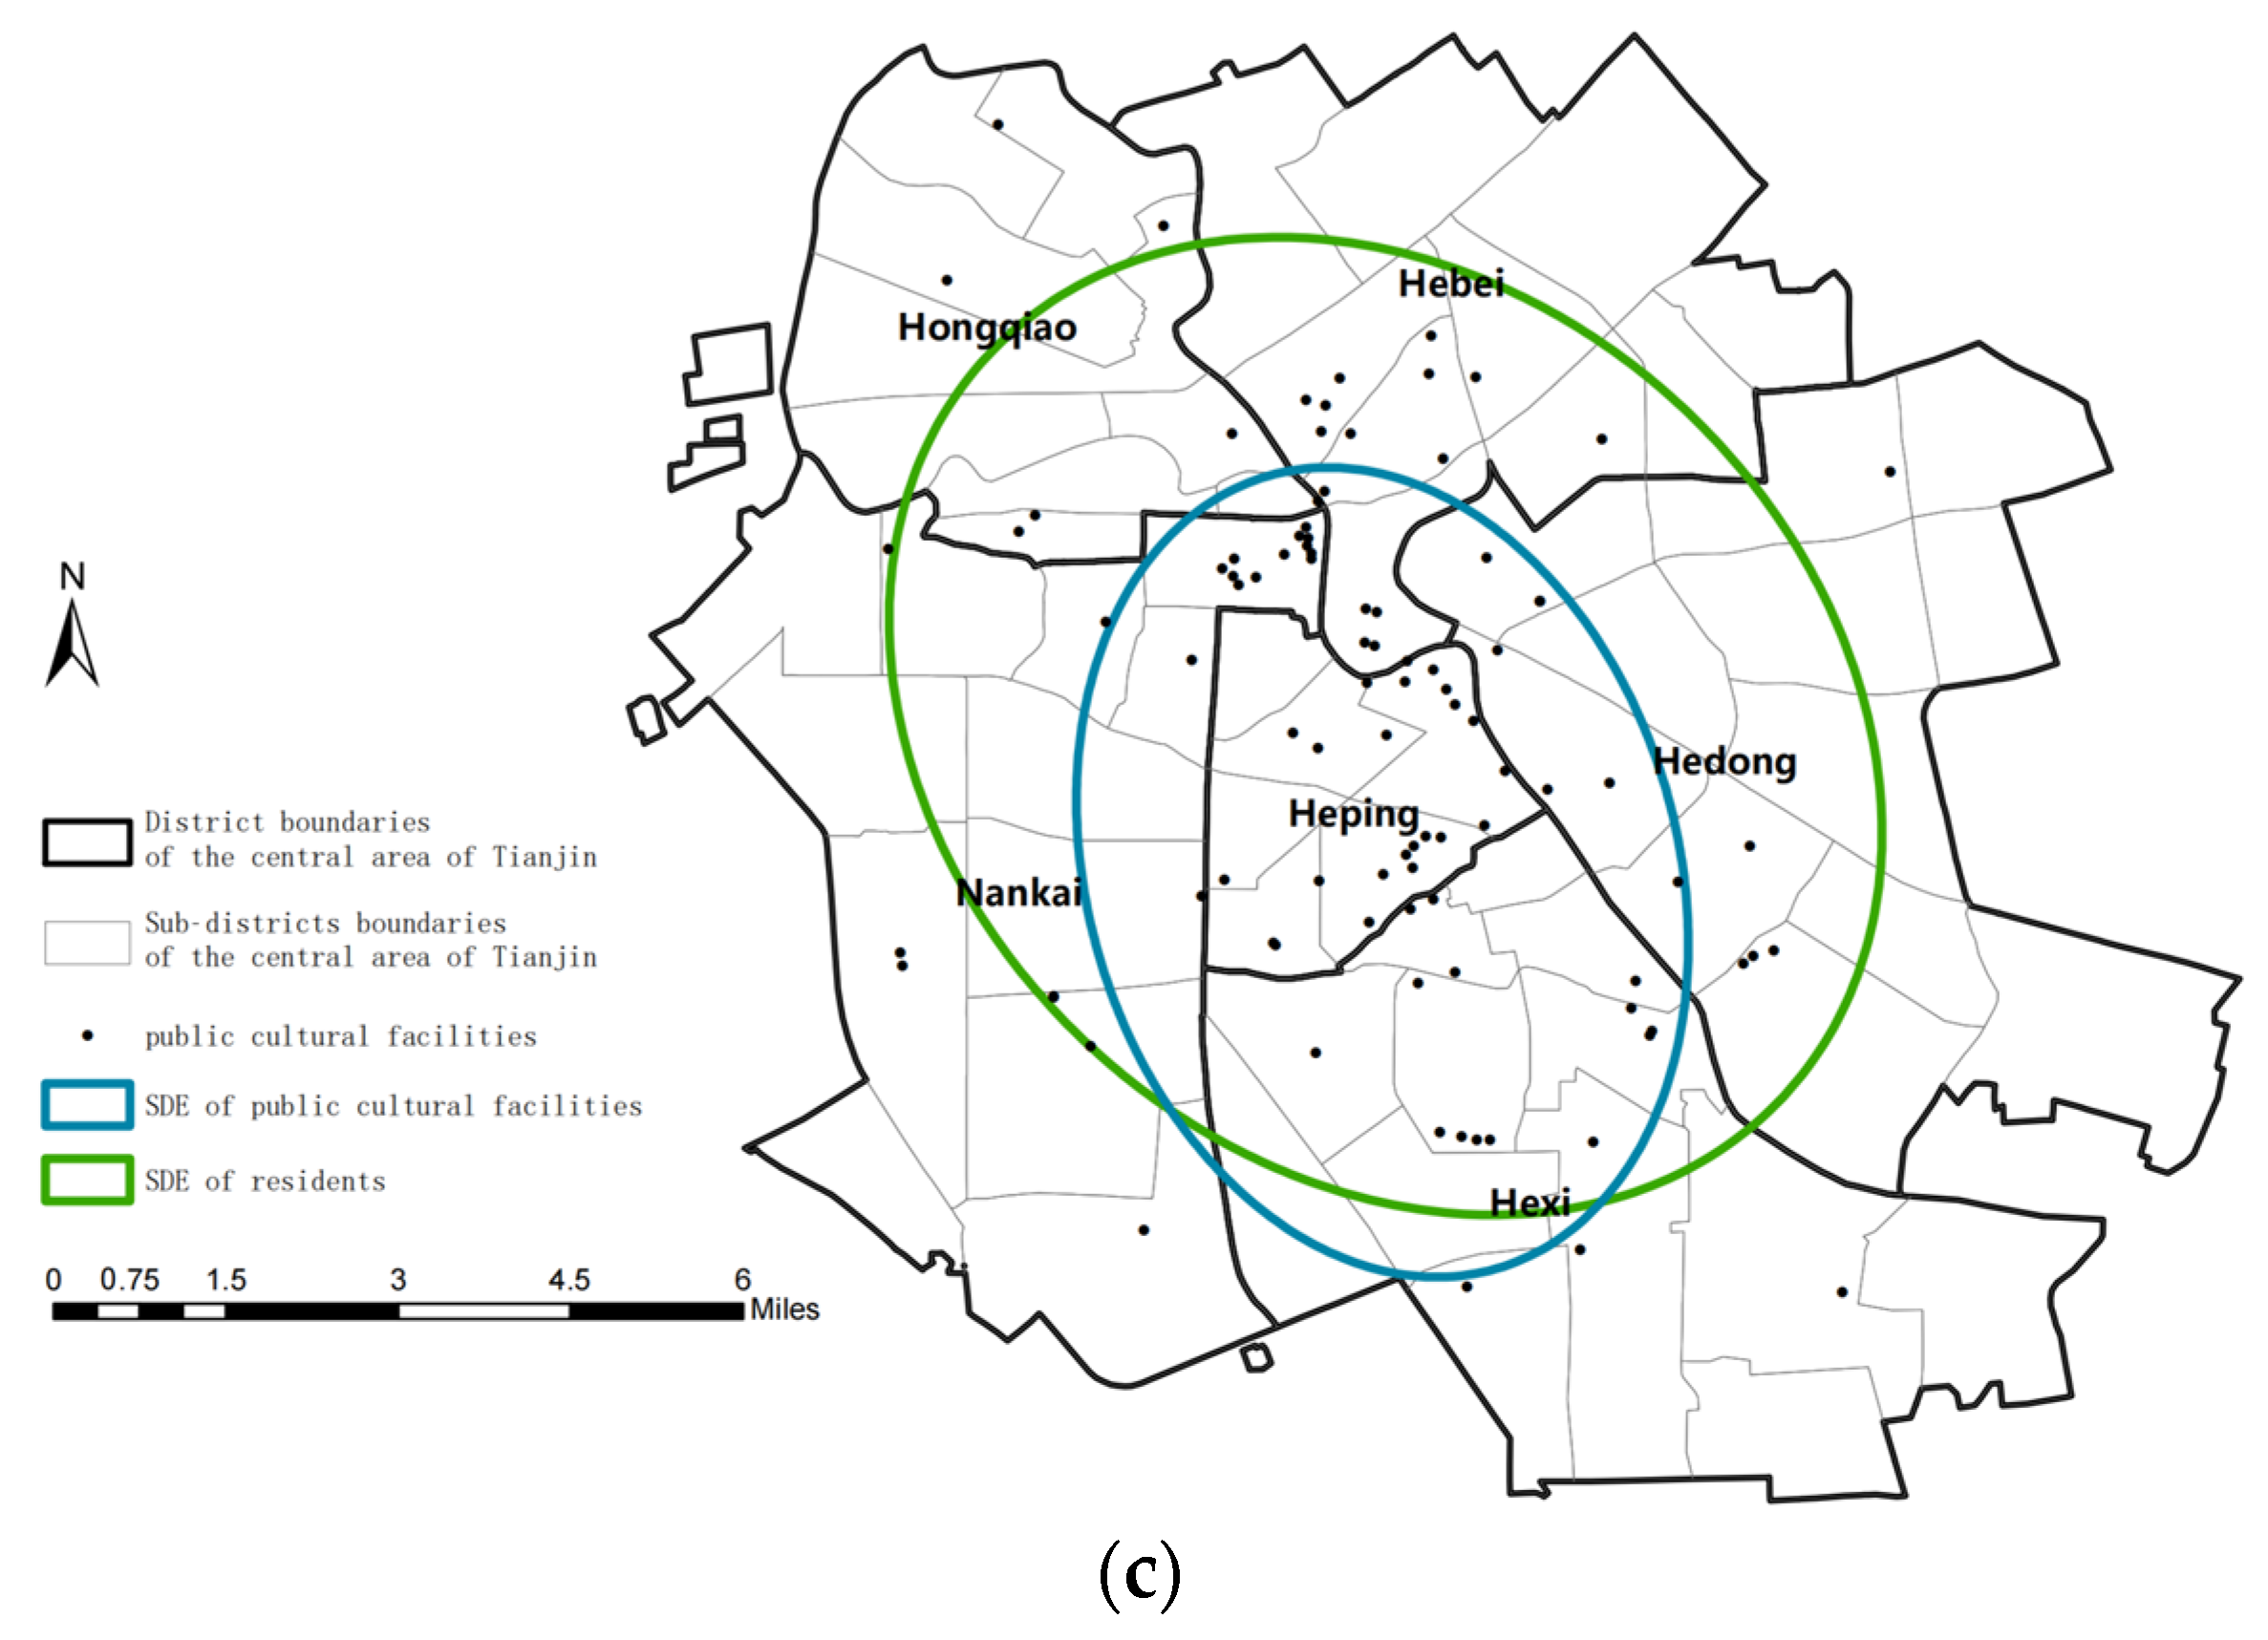
3.2. Analysis of the Spatial Distribution

In this study, the correlation between the distribution of facilities and the aggregation of sub-district populations is described more accurately by kernel density correlation analysis. Kernel density maps of facility distribution and street population numbers were generated and rectangular basic units with 100-m-long sides were generated within the central area. Kernel density values were extracted from the central points of each unit, and the kernel density values of the two groups of facilities and populations were fed into SPSS as variables for Spearman correlation analysis.
The correlation coefficient between the facility and the population distribution kernel density value was 0.891 (Table 4), with a significance level of 0.01, showing a significant positive correlation between them.
The ANN of PCFs revealed that in terms of spatial distribution, PCFs showed a high degree of clustering (Figure 3a).
Spatial autocorrelation analysis of PCFs shows that the spatial distribution of PCFs is weakly correlated with their own levels and building area. There was no obvious spatial clustering pattern of PCFs at each level and building area, and they were randomly distributed in the central area (Figure 3b).
The SDE analysis results showed that the spatial distribution of PCFs and sub-districts’ populations is misaligned, and the direction of their distribution deviates. The distribution of facilities has a tendency to expand in a positive north-south direction more than the population does. When their SDE are compared, the population of sub-districts has a considerably bigger SDE area than PCFs, showing that the distribution of facilities does not cover all residential areas (Figure 3c).

3.3. Evaluation of Spatial Equalization of PCF

3.3.1. PCF Supply Indicators and Weights

Based on the results of ranking the importance of indicators by relevant experts and scholars, the weights of each indicator were determined by AHP. The classification of each indicator is shown in Table 5.
The Huff model was used to calculate the attractiveness index and the probability of being chosen for PCFs, and the sum of the attractiveness of each sub-district’s was obtained. The attractiveness of facilities in the north side of Heping, the center part of Nankai, and the area along the Haihe is calculated to be higher, and the probability of being picked by inhabitants is higher (Figure 4a).
After standardizing the facility level and resident satisfaction statistics, the data was visualized. They all show better facility level and satisfaction in the central and southern parts, and lower rank and satisfaction in the edge areas of Hedong and Hebei (Figure 4b,c).
The Kriging interpolation tool was used to depict the trend of accessibility change for each sub-public district’s cultural facilities, and the accessibility of different levels was represented graphically by different colors using the natural breakpoint approach.
The accessibility trend chart suggests that the highest accessibility is in the southwest of the central area, with Nankai typically being higher. The accessibility in the south of Hedong and central Hebei District is bad (Figure 5a). Analyzing the reasons, the majority of national cultural facilities are distributed in Nankai and Hexi districts, which have large areas, high grades, and high service capacities. Moreover, more facilities in Nankai, Hongqiao, and Hedong are located near subway stations, which greatly reduces transportation costs.
The coverage calculation results are standardized and visualized. It was discovered that Heping and its surrounding core urban area have the highest coverage, while the edges of Hebei and Hedong have the lowest coverage (Figure 5b).
By examining the supply index of PCFs in each sub-district in the Tianjin center area, we can observe that the level of cultural service supply is higher in the central region, and the overall tendency is higher in the west and lower in the east (Figure 6).

3.3.2. Resident Demand Indicators and Weights

Since the gender, age, and education level of users of PCFs are equally important in calculating the demand index, the weights of all three categories of indicators are set at 0.33 in this study, while the sub-weights are taken according to their user distribution, as indicated in Table 6.
By multiplying the weights of users of PCFs with the corresponding population numbers in each sub-district, the number of people in demand for PCFs in each sub-district is obtained. The numbers are normalized and dimensionless and then summed to obtain the demand index of public cultural services for residents in each sub-district, and the results are shown in Figure 7. The demand for public cultural services in the central area of Tianjin shows a decreasing trend from the surrounding area to the center, with the least demand in Heping and higher demand in the central and western parts of Hedong and Nankai.

3.4. Equalization Evaluation Results

The correlation analysis reveals that the correlation coefficient value between the demand index and the supply index is 0.33, with a significance level of 0.01 (Table 7), indicating that there is a significant positive correlation between the demand index and the supply index. Which indicates that the higher the degree of demand for PCFs, the higher the level of supply of PCFs in the sub-district.
Judging the degree of supply-demand coordination of each sub-district based on the level of coordination from the supply-demand coupling coordination model, the calculated results are visualized in Figure 8.
The results showed a generally average degree of coordination of sub-districts in the central area, whereas the degree in the majority of Hexi and Hedong outlying areas is poor.
The 62 sub-districts are grouped into three degrees: supply-demand coordination, near-disorder, and disorder for thorough investigation based on the computed degree of supply-demand coordination (Table 8). The supply and demand difference index is also calculated to graphically compare the size of supply and demand (Table 9).
Among the 62 sub-districts in the study area, there are 31 sub-districts with coordinated supply and demand, accounting for 50%. A total of 27 sub-districts are near-disorder, accounting for 44%, and 4 sub-districts are disorderly in supply and demand, accounting for 6%. In general, about half of the sub-districts have a shortage of public cultural resources, and most of the sub-districts are in a stage of coordination or near-disorder between supply and demand. As a result, the degree of spatial equalization of PCFs needs to be further adjusted and optimized.

4. Discussion

4.1. Existing Problems

4.1.1. Uneven Spatial Distribution of Facilities

In quantitative terms, more facilities were distributed in the core areas of the central city and fewer in the peripheral areas, mainly in Heping District and Nankai. Hedong and Hongqiao have the fewest, each with fewer than ten, while the distribution of public cultural institutions was unequal. Some sub-districts lacked facilities, so the number and type of PCFs varied widely throughout districts. According to the statistics chart of facility density and number per capita, the supply of public cultural services is unequal, with a wide discrepancy (Figure 9).
The correlation coefficient analysis reveals that the density of PCFs is extremely consistent with population density and that the dense area of population distribution correlates to the dense area of PCF distribution too.
In general, the spatial distribution of PCFs in Tianjin’s central area shows a high aggregation centered on the Heping and a decreasing aggregation in the surrounding areas, which generally coincides with the aggregation of population distribution but shows a relatively uneven spatial distribution. Simultaneously, there is little correlation between the aggregation of facilities and the detailed parameters of the facilities themselves.
Due to their early development, Heping and Nankai had earlier urban construction and complete infrastructure. Based on this, a large number of facilities were converted from historical and cultural buildings. However, as urbanization progressed and the population in other districts increased dramatically, the construction of PCFs lagged behind, resulting in a differentiation in the enjoyment of cultural resources per capita.

4.1.2. Low Level of Facilities Equalization

Among the central areas, Heping and Hebei have a higher level of spatial equalization of PCFs, with supply-demand coordination sub-districts accounting for approximately 60% of the total. The reasons for this are mainly the small demand population, the large number of facilities in a relatively small area, and the high level of facilities and satisfaction. The demand population and the number of facilities in Hebei are comparatively medium among the six districts, and they are radiated by a large number of facilities in the center area and enjoy a higher quality of public cultural services. As a result, the supply and demand for PCFs in Heping and Hebei are relatively balanced.
The level of equalization in Nankai and Hongqiao is about average, and that in Hedong and Hexi is low. Due to the large population and area but a small number of facilities, there is low accessibility and high demand. There is less radiation from facilities in other districts too, so there is a large gap between supply and demand among sub-districts, and most marginal districts are in a state of supply and demand imbalance.
Most of the sub-districts still reflect the situation where the supply of public cultural services is smaller than the demand. By further analyzing the relationship between supply and demand of PCFs and identifying the weak points, we can lay the foundation for future planning of the increase or stock of PCFs and gradually realize the equalization of the allocation of public cultural resources.

4.2. Optimization Process and Cases

4.2.1. Optimization Roadmap

There are three steps that were taken (Figure 10):
  • For the evaluation results of the supply-demand coupling coordination type, the sub-districts with lagging supply are screened out among the supply-demand near-disorder and disorder sub-districts for the next optimization step. For the sub-districts with coordination supply and demand as well as lagging demand, their facility distribution status quo is maintained;
  • If the coverage is higher than 57% of the average coverage of sub-districts in the six districts, the distribution is acceptable, and no new facilities are required. A quality scale optimization strategy for the current facilities in these sub-districts is offered. Otherwise, the next optimization step is carried out;
  • If the coverage of the facilities in the sub-districts chosen in the previous step is insufficient, the location assignment model in ArcGIS is used to calculate a reasonable location for the additional facility.
After screening, a total of 12 sub-districts were selected for quality and scale optimization, while 17 sub-districts were selected to add new facilities.

4.2.2. Adding Facility Points in the Study Area

Using the fishing net tool and a series of operations, all candidate points are obtained for subsequent operations within the boundaries of the districts selected in the previous step that require new facilities (Figure 11).
Using ArcGIS to create a location assignment model, we used 96 existing PCFs and 1094 candidate points as mandatory and candidate points, and 3343 residential communities as request points, and built a 15-min walking distance as the maximum coverage model for impedance interruption time, increasing the number of selected points in turn, and counting the changes in service connectivity with different numbers of new facilities.
When 20 new PCFs are added, a total of 2763 connection lines are generated, which means that residents of 2763 residential areas can reach PCFs within a 15 min pedestrian scale, covering an area greater than 70% of the total area of the 6 districts in the city and more than 80% of the total population. It basically meets the planning requirements of the 15-min living circle and ensures that most residents in the central city can enjoy public cultural services within a 15-min walking time (Figure 12).

4.2.3. Optimization Case

Tianjin Electric Power Science and Technology Museum is used as a case of facility quality optimization. It was once the old office building of Bishang Electric Light and Trolley Company, but now it has been transformed into the Tianjin Electric Power Science and Technology Museum, which has witnessed the vicissitudes of Tianjin’s industry while the first light here also illuminated great changes in the city’s energy development. The base is adjacent to tourist attractions such as Tianjin Italian Style Street, the Century Clock, and the Haihe sightseeing belt, and it has a wealth of tourism resources. The frequency and quality of exhibition activities can be improved, and the complex functions of the facilities, such as resting and tea drinking, can be expanded. The quality of facility services can be improved by adding shared bicycle docking points. Business development can be varied by selling cultural and creative products, for example. Both fully utilize tourist resources and attract more nearby residents in order to increase the attractiveness of the facilities and strengthen the service level and supply capacity (Figure 13).
As shown in Figure 14, the site before optimization has only two entrances, and there are ancillary rooms next to the entrances that block the view of visitors along the street, and the openness is poor, resulting in a low possibility of visitors coming into contact with the museum and generating interest. The site’s openness will be substantially increased if the ancillary rooms along the street are converted into open spaces and the shrub landscape is changed into a small square. It is simple to set up many supplementary functions, such as a bazaar selling power culture souvenirs and a resting spot for residents. In urban centers where land resources are scarce, as well as in cultural and tourist areas, preserving the original appearance of facilities for renovation is of great significance for the preservation of the city’s historical heritage, resource conservation, and sustainable development.
Take the new facility site in the Erhaoqiao sub-district as an example. Its available land area is 4500 m2, which is a public facility site, and it is located on the west side of the Erhaoqiao Sub-district Party Service Center. It is also close to public transportation stations such as Zhangguizhuang subway station and Yirangyuan bus station. The newly constructed, integrated, functional PCFs better cover the surrounding communities and meet the diverse needs of residents (Figure 15).
After the optimization of the new facility, the capacity of public cultural services in the Erhaoqiao sub-district has been significantly improved. The coverage population increased by 47,195 people, covering 21 neighborhoods within the sub-district, with a coverage rate of 37.0% (Figure 16, Table 10).
Considering the issue of saving land resources and construction costs, we believe that sharing the building with the existing party service center or adding on top of it is also an economical way to maintain the same coverage. Similarly, other districts that need additional facilities can be considered for integration with existing public buildings nearby.

5. Conclusions

5.1. Study Innovations and Significance

This paper measures the equalization of the spatial distribution of PCFs and optimizes it. Compared with similar studies in China and other countries, it has the following innovations: (1) The measurement of facility service level is more comprehensive. The potential model and the Huff model include the scale and level of facilities in the calculation and add the subjective evaluation of residents’ satisfaction to laterally respond to the attractiveness level of facilities. (2) The research perspective considers not only planning factors but also resident demand factors. Unlike the commonly used questionnaire to obtain data, this paper used real passenger flow data collected from commercial platforms, which objectively reflects the demand level. (3) The supply-demand coupling coordination model is constructed to quantify the equalization measure. (4) The optimization method is discussed and validated by classification. These innovations are important for improving the fairness and efficiency of the study of public service facilities and efficient land use in urban renewal.

5.2. Main Findings

Through spatial distribution research and the supply-demand coupling coordination model, this paper highlighted the imbalance in the spatial arrangement of PCFs in Tianjin central area. Aiming at the weak parts of the existing PCF supply system and guided by the actual public cultural needs of residents, the quality of facilities was improved in terms of stock, and the strategy to meet the maximum coverage of public cultural services was calculated in terms of increment. Increased supply capacity of facilities It will improve the spatial distribution of urban public culture, enhance the allocation of public cultural resources, and serve as a brick for the study of the spatial optimization of urban public facilities. This study has come to the following conclusions: (1) The construction of a supply-demand coupling coordination model can make up for the shortcomings of traditional ArcGIS spatial analysis, compare the differences in the supply and demand of facilities in the study area, and objectively describe the level of equalization of the layout of facilities. (2) The problem of uneven development has emerged in the study area, responding to the high level of supply in the district developed first. With the further development of the city, there is a population influx in the central city. Unlike medical or educational facilities, which have strong demand, PCFs are often built behind schedule. (3) In the era of urban stock renewal, improving the quality and scale of existing PCFs can also improve their service level. PCFs dependent on existing buildings for renovation and expansion are more land and material efficient than additions and have important implications for sustainable development.

5.3. Prospects and Shortcomings

The spatial distribution of PCFs should be balanced so that the majority of residents have access to the same cultural services with equal opportunities. As a result, a focused and balanced PCFs system based on the Tianjin Cultural Facilities Layout Plan (2015–2030) [41] and integrated with Tianjin’s own development pattern should be constructed. Meanwhile, residents’ diverse needs should be prioritized.
This paper mainly studied the spatial distribution characteristics and equalization level of PCFs in the central city of Tianjin from a spatial perspective. Some of them involve the subjective evaluation of residents’ use, and it has not formed a systematic study of the whole social, economic, and cultural system. Therefore, whether it is possible to establish a coupling evaluation system of supply and demand composed of spatial and social perspectives, whether it is possible to form a long-term evaluation mechanism, and whether it is possible to upgrade the optimization of the space of PCFs to the creation of urban cultural space all require further research.
In the follow-up study, the scope of the study can be extended to the whole area of Tianjin or compared with other cities in China.
At the same time, with the development of computer network technologies such as smart wearables, big data, and artificial intelligence, PCFs are increasingly advocating for the promotion of digital platforms during the COVID-19 pandemic. By introducing digital cultural innovations for display, the lack of accessibility to traditional cultural displays can be compensated, resulting in the development of cultural innovation industries, the attraction of residents and foreign visitors, and an increase in the level of equalization of public cultural services. This will affect the service level of PCFs and expand the participation of residents. In the future, we will try to incorporate digital cultural innovation into the evaluation system.

Author Contributions

Conceptualization, S.Z. and L.Z.; methodology, S.X. and J.R.; software, S.X. and L.Z.; validation, H.L. and D.W.; formal analysis, S.X. and L.Z.; investigation, L.G.; resources, S.Z. and S.X.; data curation, L.Z. and S.X.; writing—original draft preparation, S.X.; writing—review and editing, S.X. and D.W.; visualization, S.X. and L.Z.; supervision, H.L. and S.Z.; project administration, D.W.; funding acquisition, S.Z. All authors have read and agreed to the published version of the manuscript.

Funding

This work was supported by the National Key Research and Development Program of China (grant number 2019YFD1100402), the Key Technology Research and Development Program of Shandong (grant number 2019GSF110004), and the Building Physical Environment Simulation (grant number 2021H0_0076).

Institutional Review Board Statement

Not applicable.

Informed Consent Statement

Not applicable.

Data Availability Statement

Data available on request due to restrictions, e.g., privacy or ethics.

Acknowledgments

We are very grateful to the DAMlab (Digital Architecture and Manufacture Laboratory) Tianjin Sector at Tianjin Chengjian University for providing excellent equipment support during this study.

Conflicts of Interest

The authors declare no conflict of interest.

References

  1. Ministry of Natural Resources of the People’s Republic of China. Spatial Planning Guidance: Community Life Unit. Available online: http://gi.mnr.gov.cn/202105/t20210526_2633012.html (accessed on 9 October 2022). (In Chinese)
  2. National Development; Reform Commission; Other Departments. The 14th Five-Year Plan for Public Services. Available online: https://www.gov.cn/zhengce/zhengceku/2022-01/10/5667482/files/301fe13cf8d54434804a83c6156ac789.pdf (accessed on 9 October 2022). (In Chinese)
  3. General Office of the CPC Tianjin Municipal Committee and General Office of the Tianjin Municipal People’s Government. Opinions on the Implementation of Accelerating the Construction of Modern Public Cultural Service System. Available online: http://hhjyy.tjl.tj.cn/zwxx/zwgk/1507/150722-zgtj.html (accessed on 9 October 2022). (In Chinese).
  4. Tianjin Proposed a Strong Cultural City Construction Goals. Available online: https://www.mct.gov.cn/whzx/qgwhxxlb/tj/202012/t20201204_904995.htm (accessed on 5 March 2023). (In Chinese)
  5. Hansen, W.G. How Accessibility Shapes Land Use. J. Am. Inst. Plann. 1959, 25, 73–76. [Google Scholar] [CrossRef]
  6. The Location and Siting of Public Libraries in Australian Capital Cities with Special Reference to Melbourne. Available online: https://eric.ed.gov/?id=ED150978 (accessed on 9 October 2022).
  7. Zhang, D.; Zhang, G.; Zhou, C. Differences in Accessibility of Public Health Facilities in Hierarchical Municipalities and the Spatial Pattern Characteristics of Their Services in Doumen District, China. Land 2021, 10, 1249. [Google Scholar] [CrossRef]
  8. Du, M.; Zhao, S. An Equity Evaluation on Accessibility of Primary Healthcare Facilities by Using V2SFCA Method: Taking Fukuoka City, Japan, as a Case Study. Land 2022, 11, 640. [Google Scholar] [CrossRef]
  9. Zhou, C.; Zhang, D.; He, X. Transportation Accessibility Evaluation of Educational Institutions Conducting Field Environmental Education Activities in Ecological Protection Areas: A Case Study of Zhuhai City. Sustainability 2021, 13, 9392. [Google Scholar] [CrossRef]
  10. Zhang, P.; Ren, X.; Zhang, Q. Spatial analysis of rural medical facilities using huff model: A case study of Lankao county, Henan province. Int. J. Smart Home 2015, 9, 161–168. [Google Scholar] [CrossRef]
  11. Cooper, L. Location-allocation problems. Oper. Res. 1963, 11, 331–343. [Google Scholar] [CrossRef]
  12. Powell, M.; Boyne, G. The spatial strategy of equality and the spatial division of welfare. Soc. Policy Adm. 2001, 35, 181–194. [Google Scholar] [CrossRef]
  13. Andrews, R. Civic Culture and Public Service Failure: An Empirical Exploration. Sage Publ. 2007, 44. [Google Scholar] [CrossRef]
  14. Zhang, J. Unscrambling Planning Design of Urban Public Space in Terms of City Culture. Planners 2004, 12, 20–22. (In Chinese) [Google Scholar]
  15. Zhao, S.; Zhang, W. Characteristics of Spatial-Temporal Evolution and Accessibility of Public Cultural Facilities in Beijing. Urban Dev. Stud. 2020, 27, 7–12. (In Chinese) [Google Scholar]
  16. Zhang, D.; Zhou, C.; Xu, W. Spatial-Temporal Characteristics of Primary and Secondary Educational Resources for Relocated Children of Migrant Workers: The Case of Liaoning Province. Complexity 2020, 2020, 7457109. [Google Scholar] [CrossRef]
  17. Wang, Y.; Nian, F. Study on Spatial Optimization of Public Cultural Facilities of Population in Kunshan under the Condition of Equalization. Jiangsu Constr. 2020, 2, 25–28. (In Chinese) [Google Scholar]
  18. Liu, W.; Zhu, Z.; Wang, L. Spatiotemporal Heterogeneity of Primary and Secondary School Student Distribution in Liaoning Province, China from 2010 to 2020. Front. Earth Sci. 2022, 10. [Google Scholar] [CrossRef]
  19. Chen, Y.; Lin, N.; Ding, L.; Qu, J.; Zhou, Q. Spatial Evolution and Influencing Factors of Religious Places from a Socio-Spatial Perspective: An Empirical Analysis of Christianity in China. PLoS ONE 2022, 17. [Google Scholar] [CrossRef] [PubMed]
  20. Ji, X.; Sun, L.; Gong, Y. Spatial Evaluation of Villages and Towns Based on Multi-Source Data and Digital Technology: A Case Study of Suining County of Northern Jiangsu. Sustainability 2022, 14, 7603. [Google Scholar] [CrossRef]
  21. Li, M. Optimization of Suzhou Garden Infrastructure Layout Based on Federal Learning. Math. Probl. Eng. 2022, 2022, 6076453. [Google Scholar] [CrossRef]
  22. Li, Y.; Zhang, J.; Bi, Y. “Human Oriented” Public Service Facilities Configuration. Planners 2022, 38, 64–69. (In Chinese) [Google Scholar]
  23. National Museum Directory. Available online: http://www.ncha.gov.cn/col/col2267/index.html (accessed on 9 October 2022). (In Chinese)
  24. Tianjin Museum Directory. Available online: http://whly.tj.gov.cn/GLLLM2036/TZGG_20201208/202012/t20201212_4926207.html (accessed on 9 October 2022). (In Chinese)
  25. Tianjin Museum Public Service Platform. Available online: http://www.tjcmps.com/web/index.html#/province/detail?id=1187 (accessed on 9 October 2022). (In Chinese).
  26. Baidu Coordinate Pickup System. Available online: https://api.map.baidu.com/lbsapi/getpoint/index.html (accessed on 9 October 2022). (In Chinese).
  27. Dianping. Available online: https://www.dianping.com/tianjin/ch0 (accessed on 9 October 2022). (In Chinese).
  28. OpenStreetMap. Available online: https://master.apis.dev.openstreetmap.org/#map=4/36.96/104.17 (accessed on 9 October 2022).
  29. National Catalogue Service for Geographic Information. Available online: https://www.webmap.cn/commres.do?method=dataDownload (accessed on 9 October 2022). (In Chinese).
  30. Baidu Huiyan. Available online: https://huiyan.baidu.com/contactme (accessed on 9 October 2022).
  31. Zhou, X.; Zhang, X.; Dai, Z.; Hermaputi, R.L.; Hua, C.; Li, Y. Spatial Layout and Coupling of Urban Cultural Relics: Analyzing Historical Sites and Commercial Facilities in District III of Shaoxing. Sustainability 2021, 13, 6877. [Google Scholar] [CrossRef]
  32. Wan, D.; Liu, H.; Guo, J.; Guo, L.; Qi, D.; Zhang, S.; Li, P.; Fukuda, H. Spatial Distribution and Accessibility Measurements for Elderly Day Care Centers in China’s Urban Built-up Area: The Case of Tianjin Nankai District. Buildings 2022, 12, 1413. [Google Scholar] [CrossRef]
  33. Clark, P.J.; Evans, F.C. Distance to Nearest Neighbor as a Measure of Spatial Relationships in Populations. Ecology 1954, 35, 445–453. [Google Scholar] [CrossRef]
  34. Shang, X. Analysis of rural settlement distribution characteristics based on the standard deviation ellipse method—An example of Panji District, Huainan City. Rural Econ. Technol. 2018, 29, 244–246. [Google Scholar]
  35. Tobler, W.R. A Computer Movie Simulating Urban Growth in the Detroit Region. Econ. Geogr. 1970, 46, 234. [Google Scholar] [CrossRef]
  36. Fan, Q.; Mei, X.; Zhang, C.; Yang, X. Research on Gridding of Urban Spatial Form Based on Fractal Theory. ISPRS Int. J. Geo-Inf. 2022, 11, 622. [Google Scholar] [CrossRef]
  37. Koźlak, A. The Use of Potential Models in Research on Transport Accessibility of Knowledge and Innovation Centers on the Example of Poland. In Proceedings in Business and Economics; Springer International Publishing: Cham, Switzerland, 2017. [Google Scholar]
  38. Tang, P.; Xiang, J.; Luo, J.; Chen, G. Spatial accessibility analysis of primary schools at the county level based on the im-proved potential model: A case study of Xiantao City, Hubei Province. Prog. Geogr. 2017, 36, 697–708. (In Chinese) [Google Scholar]
  39. Wang, Y.; Zhang, C. GIS and Gravity Polygon Based Service Area Analysis of Public Facility: Case Study of Hospitals in Pudong new Area. Econ. Geogr. 2005, 6, 800–803. (In Chinese) [Google Scholar] [CrossRef]
  40. Almohamad, H.; Knaack, A.; Habib, B. Assessing Spatial Equity and Accessibility of Public Green Spaces in Aleppo City, Syria. Forests 2018, 9, 706. [Google Scholar] [CrossRef] [Green Version]
  41. Tianjin City Cultural Facilities Layout Plan (2015–2030). Available online: http://hhjyy.tjl.tj.cn/zwxx/zwgk/1602/160205-tjsw-1.pdf (accessed on 9 October 2022). (In Chinese).
  42. Tahmasbi, B.; Mansourianfar, M.H.; Haghshenas, H.; Kim, I. Multimodal Accessibility-Based Equity Assessment of Urban Public Facilities Distribution. Sustain. Cities Soc. 2019, 49, 101633. [Google Scholar] [CrossRef]
  43. Neutens, T.; Schwanen, T.; Witlox, F.; de Maeyer, P. Evaluating the Temporal Organization of Public Service Provision Using Space-Time Accessibility Analysis. Urban Geogr. 2010, 31, 1039–1064. [Google Scholar] [CrossRef]
  44. Wang, Z.Y.; Jia, Y.W.; Jia, H.F.; Li, C.B. Layout Planning and Evaluation Method of Urban Passenger Transport Station. AMM 2013, 295–298, 2592–2599. [Google Scholar] [CrossRef]
  45. Fang, Z.J. Study on Optimal Allocation of Medical Service Facilities in Small Towns of Wuhan from the Perspective of Supply and Demand. Master’s Thesis, Huazhong University of Science and Technology, Wuhan, China, 2018. Available online: https://kns.cnki.net/kcms/detail/detail.aspx?dbname=CMFD2019&filename=1018785093.nh&dbcode=CMFD (accessed on 9 October 2022). (In Chinese).
  46. Tianjin Statistical Yearbook 2021. Available online: https://stats.tj.gov.cn/nianjian/2021nj/zk/indexch.htm (accessed on 9 October 2022). (In Chinese)
Figure 1. Study framework.
Sustainability 15 04856 g001
Figure 2. Study area location and sub-districts.
Sustainability 15 04856 g002
Figure 3. (a) ANN result. (b) Spatial autocorrelation result. (c) SDE result.
Sustainability 15 04856 g003aSustainability 15 04856 g003b
Figure 4. (a) Facility attractiveness distribution map. (b) Facility level distribution map. (c) Residents’ satisfaction with facilities distribution map.
Sustainability 15 04856 g004
Figure 5. (a) Facility accessibility trend chart. (b) Facility coverage distribution map.
Sustainability 15 04856 g005
Figure 6. Facility supply index distribution chart.
Sustainability 15 04856 g006
Figure 7. Residents Demand Index distribution chart.
Sustainability 15 04856 g007
Figure 8. Distribution of coupling coordination levels.
Sustainability 15 04856 g008
Figure 9. Statistical chart of facility density and number per capita.
Sustainability 15 04856 g009
Figure 10. Optimization route.
Sustainability 15 04856 g010
Figure 11. Candidate site distribution map.
Sustainability 15 04856 g011
Figure 12. Optimization results after adding new facilities.
Sustainability 15 04856 g012
Figure 13. Case of facility quality optimization.
Sustainability 15 04856 g013
Figure 14. Comparison before and after optimization.
Sustainability 15 04856 g014
Figure 15. Case of new facility.
Sustainability 15 04856 g015
Figure 16. After the addition of new facility points.
Sustainability 15 04856 g016
Table 1. Statistical table of the number of PCFs.
DistrictMuseum &
Monuments
LibraryArt
Museum
Cultural
Center
Public
Cultural
Facilities
Percentage of
Facilities
Heping143812627.1%
Hedong330399.4%
Hexi64421616.7%
Nankai96802324.0%
Hebei52531515.6%
Hongqiao411177.3%
Total4119261096100%
Table 2. Supply and demand indicators evaluation system.
Objective Level (A)System Level (B)Element Level (C)Indicator Level (D)
Supply and
Demand Indicators Evaluation System
Facility suppliesAttractivenessFacility
Attractiveness
Facility level
Resident
Satisfaction
AccessibilityFacility
Accessibility
Coverage
Resident
demand
GenderMale
Female
Age<18
18–65
>65
Education
level
Non-Higher
Education
Higher
Education
Table 3. Density statistics of PCFs.
DistrictArea
(km2)
PopulationNumber of FacilitiesPercentage of FacilitiesFacility
Density
(/100 km2)
Number of Facilities per
10,000 Capita
Heping9.98446,1002627.1%261 0.58
Hedong39.63767,70099.4%23 0.12
Hexi42898,3001616.7%38 0.18
Nankai40.64894,2002324.0%57 0.26
Hebei29.62639,8001515.6%51 0.23
Hongqiao21.31509,50077.3%33 0.14
Total183.184,155,60096100.00%52 0.23
Table 4. Population and facility distribution kernel density correlation.
Population Distribution
Kernel Density Values
Facility distribution
kernel density values
0.891 **
** p < 0.01.
Table 5. Facility supplies indicator weights.
First-Level
Indicator
WeightsSecond-Level
Indicators
Sub-
Weights
Final Weights
Facility
supplies
Attractiveness0.4995Facility
Attractiveness
0.35460.1771
Facility level0.33640.1680
Resident
Satisfaction
0.30900.1543
Accessibility0.5005Facility
Accessibility
0.68460.3426
Coverage0.31540.1579
Table 6. Residents demand indicator weights.
First-Level
Indicator
WeightsSecond-Level
Indicators
Sub-
Weights
Final
Weights
Resident
demand
Gender0.33Male0.4854 0.1618
Female0.5146 0.1715
Age0.33<180.0333 0.0111
18–650.9644 0.3215
>650.0023 0.0008
Education level0.33Non-Higher
Education
0.4356 0.1452
Higher
Education
0.5644 0.1881
Table 7. Facility supplies and demand index correlation analysis.
Demand Index
Supply IndexCorrelation coefficient0.332 **
p-value0.008
** p < 0.01.
Table 8. Facility spatial equalization evaluation results.
DistrictSub-
Districts
CoordinationNear-DisorderDisorder
QuantityPercentageQuantityPercentageQuantityPercentage
Heping6467%233%00%
Hedong12542%650%18%
Hexi13431%969%00%
Nankai12758%433%18%
Hebei10660%330%110%
Hongqiao9556%333%111%
Total623150%2744%46%
Table 9. Difference between supply and demand index.
DistrictSub-
Districts
Lagging SupplyLagging Demand
QuantityPercentageQuantityPercentage
Heping6117%583%
Hedong121192%18%
Hexi13862%538%
Nankai12975%325%
Hebei10550%550%
Hongqiao9444%556%
Total623861%2439%
Table 10. Comparison before and after optimization.
Population
Covered
Residential
Neighborhoods Covered
Coverage
Before000%
After47,1952137.0%
Disclaimer/Publisher’s Note: The statements, opinions and data contained in all publications are solely those of the individual author(s) and contributor(s) and not of MDPI and/or the editor(s). MDPI and/or the editor(s) disclaim responsibility for any injury to people or property resulting from any ideas, methods, instructions or products referred to in the content.

