Article

Developing Flood Risk Zones during an Extreme Rain Event from the Perspective of Social Insurance Management

National Research Institute for Earth Science and Disaster Resilience (NIED), Tsukuba 305-0006, Japan
*
Author to whom correspondence should be addressed.
Sustainability 2023, 15(6), 4909; https://doi.org/10.3390/su15064909
Submission received: 31 January 2023 / Revised: 28 February 2023 / Accepted: 8 March 2023 / Published: 9 March 2023

Abstract

:
Recently, Japan has been hit by more frequent and severe rainstorms and floods. Typhoon Hagibis caused heavy flooding in many river basins in central and eastern Japan from 12–13 October 2019, resulting in loss of life, substantial damage, and many flood insurance claims. Considering that obtaining accurate assessments of flood situations remains a significant challenge, this study used a geographic information system (GIS)-based analytical hierarchy process (AHP) approach to develop flood susceptibility maps for the Abukuma, Naka, and Natsui River Basins during the Typhoon Hagibis event. The maps were based on population density, building density, land-use profile, distance from the river, slope, and flood inundation. A novel approach was also employed to simulate the flood inundation profiles of the river basins. In addition, a crosscheck evaluated the relationship between flood insurance claims and the developed flood risk zones within the river basins. Over 70% of insurance claims were concentrated in high to very high risk zones identified by the flood susceptibility maps. These findings demonstrate the effectiveness of this type of assessment in identifying areas that are particularly vulnerable to flood damage, which can be a useful reference for flood disaster management and related stakeholder concerns for future extreme flood events.

1. Introduction

Local or national governments and consultants conduct various types of disaster risk assessments for flood events, including warnings, responses, mitigation, and the evaluation of water-related disasters. These assessments can be invaluable for planning strategies, quantifying needs, and allocating resources during flood events. For instance, flood insurance risk guidelines have been defined and implemented during flood disaster events in many countries [1,2,3], providing private companies and local organizations with a key reference for managing stakeholders during flood events. In general, government organizations issue various types of risk information related to flood disasters during extreme rain events, and research organizations may also publish their research findings, such as rapid flood inundation mapping [4]. These assessments can help to identify potential impacts and their severity before a flood event, while close monitoring and continuous updates can ensure that prompt action and precautions are taken. However, many assessments focus on post-event recovery and evaluation, often requiring time-consuming field surveys to produce valuable results. Additionally, complex societies and artificial infrastructure increase the uncertainties in flood risk assessments, particularly in a developed country like Japan. As a result, obtaining and disseminating accurate assessments of flood situations remains a significant challenge in such a changing environment.
Flood disasters can significantly impact socio-economic welfare, rendering insurance an essential consideration for improving resilience to flood events and promoting recovery while providing incentives for investments in hazard mitigation [2,5,6]. As flood insurance claims are often made immediately after a flood event, social insurance companies must collect timely and accurate information on losses and damages to life and infrastructure throughout the disaster to effectively manage claims and support clients in the aftermath. Such information could also help estimate the damage cost and allow insurance companies to offer recovery funds to affected communities. Therefore, from a social insurance perspective, a quick and reliable assessment of flood events is crucial to accurately evaluate and promptly process all claims. Although new technologies can improve disaster monitoring and warning capabilities, anthropogenic activities (e.g., urbanization, land use planning, complex construction, embankments along rivers, and encroachment of river courses) can present challenges for flood risk assessments during extreme rain events. Moreover, modern societies’ unpredictable nature and complexity make quick assessments of flood events challenging, particularly in urban areas [7].
Japan has experienced frequent extreme rain events and the associated floods in recent years [8,9,10,11,12,13,14,15], leading to property damage and loss of life, which is becoming increasingly common every year. Catastrophic flooding occurred in the Kanto region in 2015 [10], the Kyushu region in 2017 [11], the western region of Japan in 2018 [12], the central northern region of Japan in 2019 [13], and recent flood events occurred in the Kyushu region in July 2020 [14]. These events all caused substantial loss of life and property damage [15]. The total damage costs have increased in Japan owing to highly unpredictable events, with climate change projections indicating that the frequency of extreme rain and the associated flood events will continue to rise in the coming years [7,8,9]. Consequently, flood insurance claims are also expected to increase, leading governments and private organizations to become increasingly concerned about flood risk and its impact on society. One notable case is a social insurance company that had to pay a large amount of money, drawing attention from academics and non-governmental agencies. Although each flood disaster has specific characteristics and cannot be fully controlled, managing, preventing, and predicting flood risks through daily efforts is possible.
Managing flood events is a complex and uncertain process due to multiple factors. This complexity can lead to decision-makers facing a range of intervention options that are not suitable in terms of assessment criteria. To address this, mapping flood susceptibility has become a critical strategy for identifying the most vulnerable areas based on the geomorphological characteristics of the investigated area [16,17,18,19,20,21,22,23,24,25,26,27,28]. Flood susceptibility is closely related to disaster-causing factors (hazards), vulnerable environments, and management measures [17]. Previous studies have used historical rain events to define hazard maps [17,21,22,23,24] and other influential factors, such as population, building, land use, slope, and river characteristics to define potential flood susceptibility maps. Influential factors may vary depending on the situation and objectives. While flood susceptibility maps based on hazard maps can aid in the development of potential early warning systems or strategies for the prevention and mitigation of future flood events, they have limitations in their ability to capture the full complexity of flood events.
Different multi-criteria decision methods have been used to develop flood susceptibility maps [17,18,21,22,23,24,26]. The most common technique, the analytical hierarchy process (AHP), has been used to create a particular decision-making framework for flood susceptibility mapping [20]. It supports decision-makers in making the best decision by reducing complex decisions to a series of comparative pairs and synthesizing the results. The AHP disaggregates a complex decision problem into different hierarchical levels. This method facilitates the quantification of opinions and transforms them into a coherent decision model, which has been widely used by many authors worldwide [16,17,19,20,22,26,28]. In this study, we developed a flood susceptibility map for a specific extreme rain event. This study aimed to develop a new approach to delineate flood risk areas by incorporating the results of hydrological simulation analysis data instead of historical analyses of rainfall events and other fundamental influencing factors from the social insurance perspective. Therefore, the objective of this study was to answer the following scientific questions:
  • How effective are hydrological simulations in creating flood risk zones that meet the requirements of flood-related insurance policies during extreme rainfall events?
  • Is it possible to create flood susceptibility maps using a simulated flood inundation extent instead of hazard maps based on historical rain data?
  • Lastly, can flood susceptibility mapping products be used by social insurance companies as a reliable guide or reference during specific heavy-rain events?
On 12–13 October 2019, Typhoon Hagibis caused extreme rain resulting in heavy flooding in Japan. It was the strongest typhoon to strike mainland Japan in decades, and it resulted in the collapse of 140 embankments along more than 70 rivers across the country [29], as well as 98 fatalities and severe damage to over 80,000 homes [30]. It also substantially damaged the Tohoku, Kanto, Hokuriku, and Chubu regions, with a population of approximately 43 million, representing one-third of Japan’s total population. Several areas of the river basins were severely flooded during the event. As a case study to answer the above-mentioned questions, we selected the Abukuma, Naka, and Natusi River basins in Japan (Figure 1), which were flooded during the heavy-rain event of Typhoon Hagibis. The total rainfall from 2019-10-10 0000UTC to 2019-10-14 2300UTC is presented in Figure 2. The total rainfall was up to 600 mm in some portions of the river basins. Flood inundation was widespread during this event, resulting in many insurance claims being reported (Figure 1).

2. Materials and Methods

2.1. Study Area

During Typhoon Hagibis, many river basins in northeastern Japan were severely flooded, resulting in loss of life, significant damage, and numerous flood insurance claims. As part of our study objectives, we collected various types of data, the most crucial being flood insurance claim data submitted by individuals in the affected areas to social insurance companies. Despite the challenges of collecting personal data, Tokio Marine & Nichido Fire Insurance Co., Ltd., Tokyo, Japan. provided us with limited flood insurance claim data that covered some parts of northeastern Japan. After analyzing the data, we found that they fully covered the Abukuma, Naka, and Natsui River Basins. Therefore, we focused on these three river basins, which experienced severe flooding during Typhoon Hagibis.
Abukuma is the sixth longest river in Japan, originating from the Nasu Mountains and flowing through the Fukushima and Miyagi Prefectures. The lowland area of the Abukuma River Basin, where ~1.2 million people reside, was severely affected by the collapse of levees at 47 locations along the river and 16 of its tributaries, resulting in flooding that covered over 1000 km2 of the basin [29,30]. The Naka River Basin, with a population of ~0.9 million people, is located in the eastern Honshu region of Japan and flows through the Tochigi and Ibaraki Prefectures [31,32]. The Natsui River Basin, with a population of ~0.16 million, is smaller than the other two river basins and was also flooded, especially at the lower part of the basin [33]. The Ministry of Land, Infrastructure, Transport, and Tourism (MLIT) categorizes the Abukuma and Naka Rivers as class-A-type rivers. Therefore, gauging stations are available in the Abukuma and Naka River Basins on the MLIT website, whereas gauging stations for the Natsui River Basin are not available.
The overflow and collapse of embankments were common in several channels within the selected river basins [29,30,31,32,33]. It is important to note that other river basins not considered in this study also experienced flooding during the same period. However, we collected all the necessary data for the selected three basins, and we believe that the results obtained from these basins can effectively address our objectives. We anticipate that this approach can be applied to other river basins for further verification in future studies.

2.2. Data

Each river basin has unique characteristics based on its size and physiographic features. As previously mentioned, the objective of this study was to develop flood risk zoning for river basins and evaluate their accuracy using the social insurance claim data of the extreme rain event. Various datasets were used to accomplish this, and this section will discuss them in detail.

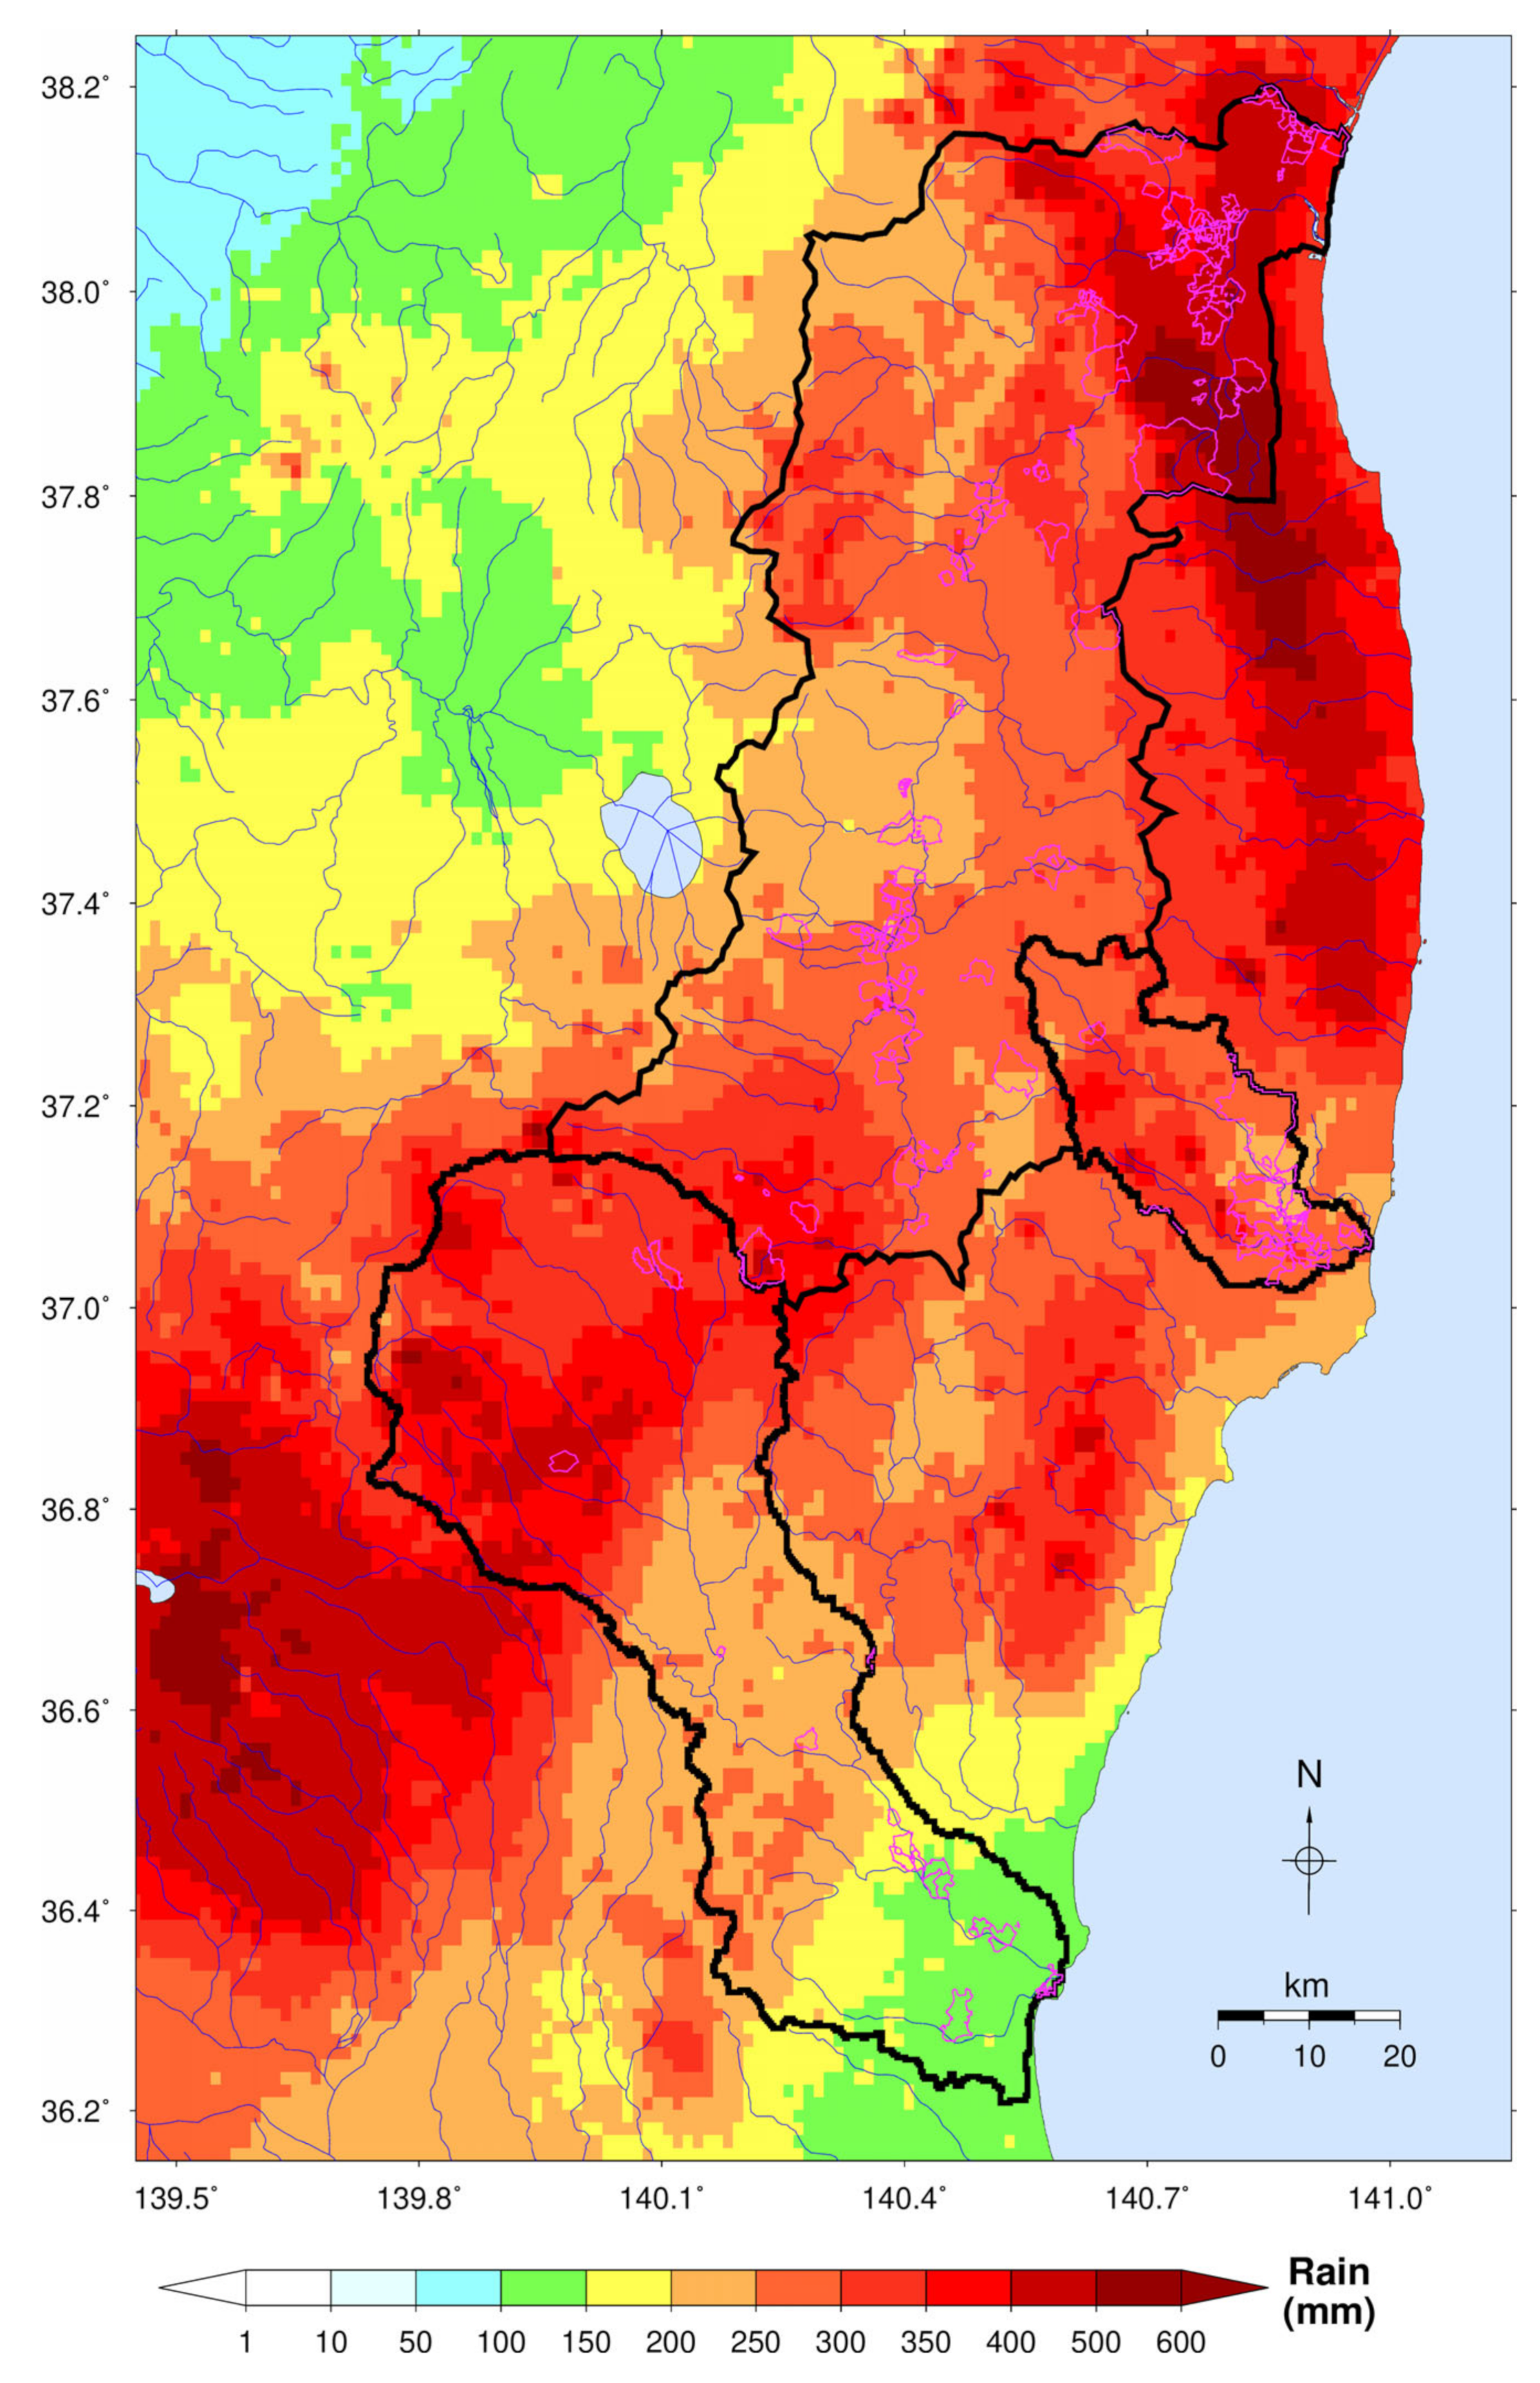
2.2.1. Rainfall Data

Various types of radar observations in Japan are used to record, monitor, and forecast precipitation for operational and research purposes. The Japan Meteorological Agency (JMA) issues real-time radar rainfall data (JMA radar) derived from more than 20 C-band radars distributed across the country. The JMA radar data have varying spatiotemporal resolutions. To reduce errors in rainfall estimates, JMA updates radar data with rain gauge data from the Automated Meteorological Data Acquisition System (AMeDAS) [34].
In this study, we used JMA radar rainfall data with a spatial resolution of 500 m and a temporal resolution of 1 h from 2019-10-10 0000UTC to 2019-10-14 2300UTC. Figure 2 shows the total radar rainfall distribution in the study area. The spatial distribution of the radar rainfall varied within the selected river basins. We used these data as the primary input for the hydrological simulation of the river basin.

2.2.2. Topographic Data

The Digital Elevation Model (DEM) served as the key dataset for generating other essential data for hydrological simulation. The DEM data were obtained from the Japan Flow Direction Map, developed by the University of Tokyo and the Kyoto University, and were primarily based on national elevation data and water maps [35]. Hydrologically adjusted DEM data at a 1-s resolution (~30 m) can be downloaded freely by all of Japan for research purposes. To enable a quick hydrological simulation of large river basins, such as those studied in this research, the default grid size was increased eightfold during the model setup. Based on the study area and model properties, the resulting topographic data grid size was ~250 m spatial resolution. Additionally, hydrographic features, such as flow accumulation (ACC), flow direction (DIR), and river channels, were prepared separately for each river basin, which is critical for setting up the hydrological model in the study area.

2.2.3. River Discharge Data

Water level data with an hourly resolution are commonly available for Japanese rivers. They can be accessed on the water information system of the Ministry of Land, Infrastructure, Transport, and Tourism (MLIT) website. The MLIT estimates discharge data at each station using water level data, and makes the information available to the public on its website. While observed river discharge data were available at some points in the selected river basins, the availability and continuity of the data varied among the stations. To ensure data availability, we selected two gauging stations along the Abukuma River (302011282206080—Senba; 302011282206090—Yamada) located near the outlet of the Abukuma River Basin. Similarly, two more stations (303021283322020—Nemotomachi; 303021283322040—Noguchi) were selected for the Naka River Basin. However, no observed river discharge data were available for the selected event in the Natsui River Basin.

2.2.4. Social Data

Social data played a critical role in this study; therefore, different types of social data types were used. The first was population data, downloaded in Geotiff format at a resolution of 3 arc (approximately 100 m) from the WorldPop mapping website (https://www.worldpop.org (accessed on 25 May 2022)), which is based in the School of Geography and Environmental Sciences at the University of Southampton. This dataset provided gridded estimates of the population count.
Additionally, building data were collected from NTT Infrastructure Network Corporation (https://www.nttinf.co.jp/ (accessed on 26 May 2022)). The default distribution of the building data was in shape format, which was then converted into density using the zonal distribution tool of ArcGIS10.6. A high-resolution land-use map for Japan was published by the Japan Aerospace Exploration Agency (JAXA) Earth Observation Research Center (EORC) ALOS/ALOS-2 Science Project, and Earth Observation Priority Research: The Ecosystem Research Group (https://www.eorc.jaxa.jp (accessed on 30 May 2022)). The default land-use data had a spatial resolution of ~30 m. A more detailed explanation of these datasets and their processing is provided in Section 2.3.1.

2.3. Methods

To achieve the objectives of this study, various methods were employed using the data discussed in the previous section. The study framework was divided into two main steps: the first involved a hydrological simulation [11,12,13,36,37,38,39,40] and the second focused on developing flood risk using the analytic hierarchy process (AHP). This classic approach has been used in many studies [16,20,23,25,26,28].

2.3.1. Hydrological Simulation

Hydrological modeling is integral to understanding flood processes in various river basins. As a result, numerous studies have focused on hydrological simulations of flood-affected river basins during extreme rainfall events, with a particular emphasis on the inundation extent [11,12,13,36,37,38,39,40]. Different types of hydrological models are widely available, including HEC-HMS [41], VIC [42], and TOPMODEL [43], among others. However, these models must be combined with a hydraulic model to analyze flood inundation over a river basin [36,44]. There is also an ongoing debate about which models are appropriate for the hydrological analysis of a river basin. The selection of a hydrological model depends on the study’s objectives. In this study, we employed the rainfall-runoff-inundation (RRI) model, a two-dimensional, distributed-parameter, structured grid, hydrological model that can simultaneously model both runoff and flood inundation [36,44]. The RRI model calculates the hydrological response in a grid cell at the river channel location, assuming that both the slope and the river are located within the same grid cell. The channel was discretized as a single line along the centerline of the overlying slope-grid cell. Detailed mathematical explanations of the RRI model have been provided in previous studies [12,36,37,38,39,40], and the RRI user manual [44] offers a comprehensive overview and technical references for the model. Other studies have also applied this model to simulate flooding in various river basins [12,13,36,37,38,39,40].
To set up the model for the selected river basins, we first prepared the hydrographic features. The DIR and DEM data were separately fixed for each selected river basin and applied to the model setup. River geometry, including river width, depth, and embankment height, is a critical parameter that needs to be specified during the model setup. Previous studies have used empirical equations for river geometries as inputs for the RRI model in different river basins [12,13,33,35,37]. P. C. et al. (2020) [12] proposed a simple approach for extracting river geometries in river basins in Japan. In previous studies, empirical equations were defined for the Kuji River Basin, a neighboring basin of the three selected river basins (next to the Naka River Basin) [13]. Thus, in this study, we employed the reference empirical equation of the Kuji River Basin for the model setup.
We also used land-use data in the model setup, which was resampled into four classes: water, urban, agriculture, and forest. Furthermore, the radar rainfall data from 10–14 October 2019, were the key input for the model simulation. Observed discharge data collected at different points in the Abukuma and Naka River Basins were compared with simulated discharge data for those points. The hydrological simulation method for ungauged river basins proposed by P.C. et al. (2018) [45] was used for the Natsui River Basin, as it was ungauged. The same model setup used for the nearby gauged river basins with satisfactory results was adopted for the Natsui River Basin without changing the model parameters.
The RRI model is capable of simulating rainfall-runoff and flood inundation simultaneously [36]. Once the simulation was completed, the inundation depth at each grid of the selected basins was extracted for each time step within the entire time period. Frequency analysis of flood inundation depths was then performed at each grid of those basins, considering the peak time periods of the event. A detailed analysis and technical procedures for developing the required flood inundation profiles for all the river basins are explained in the Results section. An overall flow chart of the methodology is shown in Figure 3.

2.3.2. Analytic Hierarchy Process (AHP)

The AHP is used to support multi-criteria decision-making and was initially developed by Saaty (1980) [46]. Although various multi-criteria decision-making methods are available, we used AHP in this study as it derives ratio scales from paired comparisons of criteria and allows for minor inconsistencies in judgments. This method enables decision-makers to make informed decisions based on results combined with various types of information, including actual measurements and subjective opinions. It helps to better understand complex decision problems by thoroughly considering possible decision criteria and selecting the most significant criteria for the respective decision objectives. Furthermore, this method facilitates the translation of subjective opinions, such as preferences or feelings, into measurable numeric relations. Using AHP assists in making more rational decisions, ensuring transparency, and improving project management understanding [47]. The results of the pairwise comparisons were arranged in a matrix, and the first (dominant) normalized right eigenvector of the matrix provides the ratio scale (weighting), with the eigenvalue determining the consistency ratio (less than 10%). The mathematical explanation of the AHP has been described in many studies [16,20,23,25,26,28], and online tools and examples of AHP are available [48].
When applying the AHP method, we considered the following: frequency of flood inundation (INU), population density (POP), building density (BLD), land-use profile (LU), distance from rivers (DIS), and slope distribution (SLP). Section 3 provides a detailed explanation of these data.

3. Results

In this section, we present the results of the hydrological analysis and the development of the flood susceptibility map. We provide a detailed discussion of the hydrological model’s performance and present the flood susceptibility map, including identifying high-risk areas based on the AHP decision-making method.

3.1. Simulated Discharge

Rainfall data are the primary input for the hydrological modeling of extreme rain events. This study used only rainfall data as inputs to the model; other meteorological data were not considered. To ensure the stability of the simulation, we fixed the time control of the simulation output to cover the period from 2019-10-10 0000UTC to 2019-10-14 2300UTC. The RRI model was adopted separately for the Abukuma and Naka River Basins. Three major components, including river water discharge, river water level, and inundation depth, were simulated for each grid of the river basins. We compared the results of our simulations with observed and estimated data from gauging stations within the river basins to evaluate the model’s performance (Figure 1). Figure 4 and Figure 5 show the relationship between the observed and simulated discharge at the two stations of the Abukuma and Naka River Basins, respectively. Overall, we observed a strong correlation between the simulated and observed discharge, but an overestimation of the simulated discharge was observed at both Abukuma River Basin stations. This could have been caused by physical properties and model uncertainties [49]. Some data were missing at the selected Naka River Basin gauging stations, which is common during flood events, but the missing data are not discussed in this study.
We obtained high correlation values of 0.92 and 0.94 for the observed and simulated discharge at the Senba and Yamada stations in the Abukuma River Basin, respectively, with corresponding Nash-Sutcliffe efficiency (NSE) values of 0.84 and 0.87, indicating a close match between simulated and observed discharge in the Abukuma River Basin. In the Naka River Basin, data were missing mainly during peak periods at the Nemotomachi and Noguchi stations, preventing statistical assessment. However, the trend of the simulated and observed discharge at the Naka River Basin stations showed realistic results. The same model parameters used for the Abukuma and Naka River Basins were applied to the Natsui River Basin, and the simulated results for all three river basins were found to be acceptable.

3.2. Flood Inundation Depth Analysis

The maximum possible inundation depth over the river basins during the rain event is essential in hydrological simulations. Figure 6 displays the maximum flood inundation depth profiles of the river basins. The maximum inundation depth varied significantly among the basins, with maximum modeled inundation depths of 4.7 m, 5.7 m, and 2.1 m for the Abukuma, Naka, and Natsui River Basins, respectively. The inundation areas were primarily limited to the lower reaches of the major rivers but also extended upstream in those basins.
An important aspect of flood risk analysis is understanding the duration and depth variation of flood inundation within river basins. Such information cannot be derived by only using the maximum inundation depth profile of the river basins (Figure 6). Instead, we calculated the flood inundation profile at the hourly time step of the entire simulation for each basin grid. Therefore, the analysis of these time steps can be an important reference to identify the effective flood depth and its variation (above a certain depth) in the basins. Such information is closely related to losses and damage to infrastructure and property. To address the duration and frequency of flood inundation depth during the peak rain event, the frequency of flood inundation depth within the selected river basins was investigated. We believe that flood inundation depths greater than 0.5 m can damage properties and result in life loss. Our intention was to count the number of inundation grid depths greater than 0.5 m of the entire river basin. Then, we calculated the spatial distribution of the absolute frequency of flood inundation (>0.5 m) in the selected river basins from the time period of 2019-10-11 1500UTC to 2019-10-14 1500UTC. Hence, among the 72-time steps, the frequency of flood inundation depth (>0.5 m) was up to 57 times in some grids. This information is the key reference for generalizing possible risk areas or zones within the basins.
During the model setup, river geometries were defined based on a reference empirical equation [13]. The spatial grid for the flood inundation mapping was set to a spacing of approximately 250 m throughout the simulation. Although it is possible to perform simulations with finer spatial resolutions by adjusting the temporal scale, the accurate simulation of large river basins at fine spatiotemporal scales can be challenging and may not be common [33]. In addition, flood scenarios [12], such as embankment failure and backwater effects, are unknown in the early stages of the simulation, and predicting the time and location of such failures remains challenging. Several studies have discussed the optimal scales for DEM, hydrometeorological input data, and flood scenarios [12,34,50]. Running hydrological simulations that incorporate all these issues at once are still challenging, especially for rapid simulations after a flood event.
We utilized the kriging interpolation method to visualize the spatial distribution of flood depth frequency in each river basin and account for uncertainties and unobserved scenarios such as embankment failure and backwater effect. This method assumes that the distance or direction between sample points reflects a spatial correlation that can be used to explain variations in depth. The result was a flood inundation profile (INU) map based on the output of the hydrological simulation.
Notably, a single output from each selected dataset was used to develop the susceptibility map during the GSI-AHP process. Based on the results of the hydrological analysis, a single output was summarized by addressing the depth, duration, and uncertainties of the simulated flood inundation profile. This is considered a realistic and innovative approach for targeting potential flood disaster risks. Finally, the relative frequency of the INU profile was calculated during peak time periods, highlighting the possible areas that may inundate during the selected period of the rain event. The relative frequency was reclassified into four categories (0–0.25, 0.25–0.50, 0.50–0.75, and 0.75–1.0), and it is shown in Figure 7 as key input data for the AHP process.

3.3. Influential Data Processing

We focused on identifying the most influential datasets in the data-processing stage to determine realistic flood susceptibility within the three river basins. The primary dataset used was the INU data obtained from the hydrological analysis of flood events. In addition, we considered three important social datasets and two physiographic datasets, which were selected based on their importance in achieving our research objectives. It should be noted that in some studies, data are divided into different groups and analyzed separately before producing the final risk map [16,28]. However, in this study, we selected only the most significant influential datasets to achieve our objectives. The five selected influential datasets are described in the following subsections.

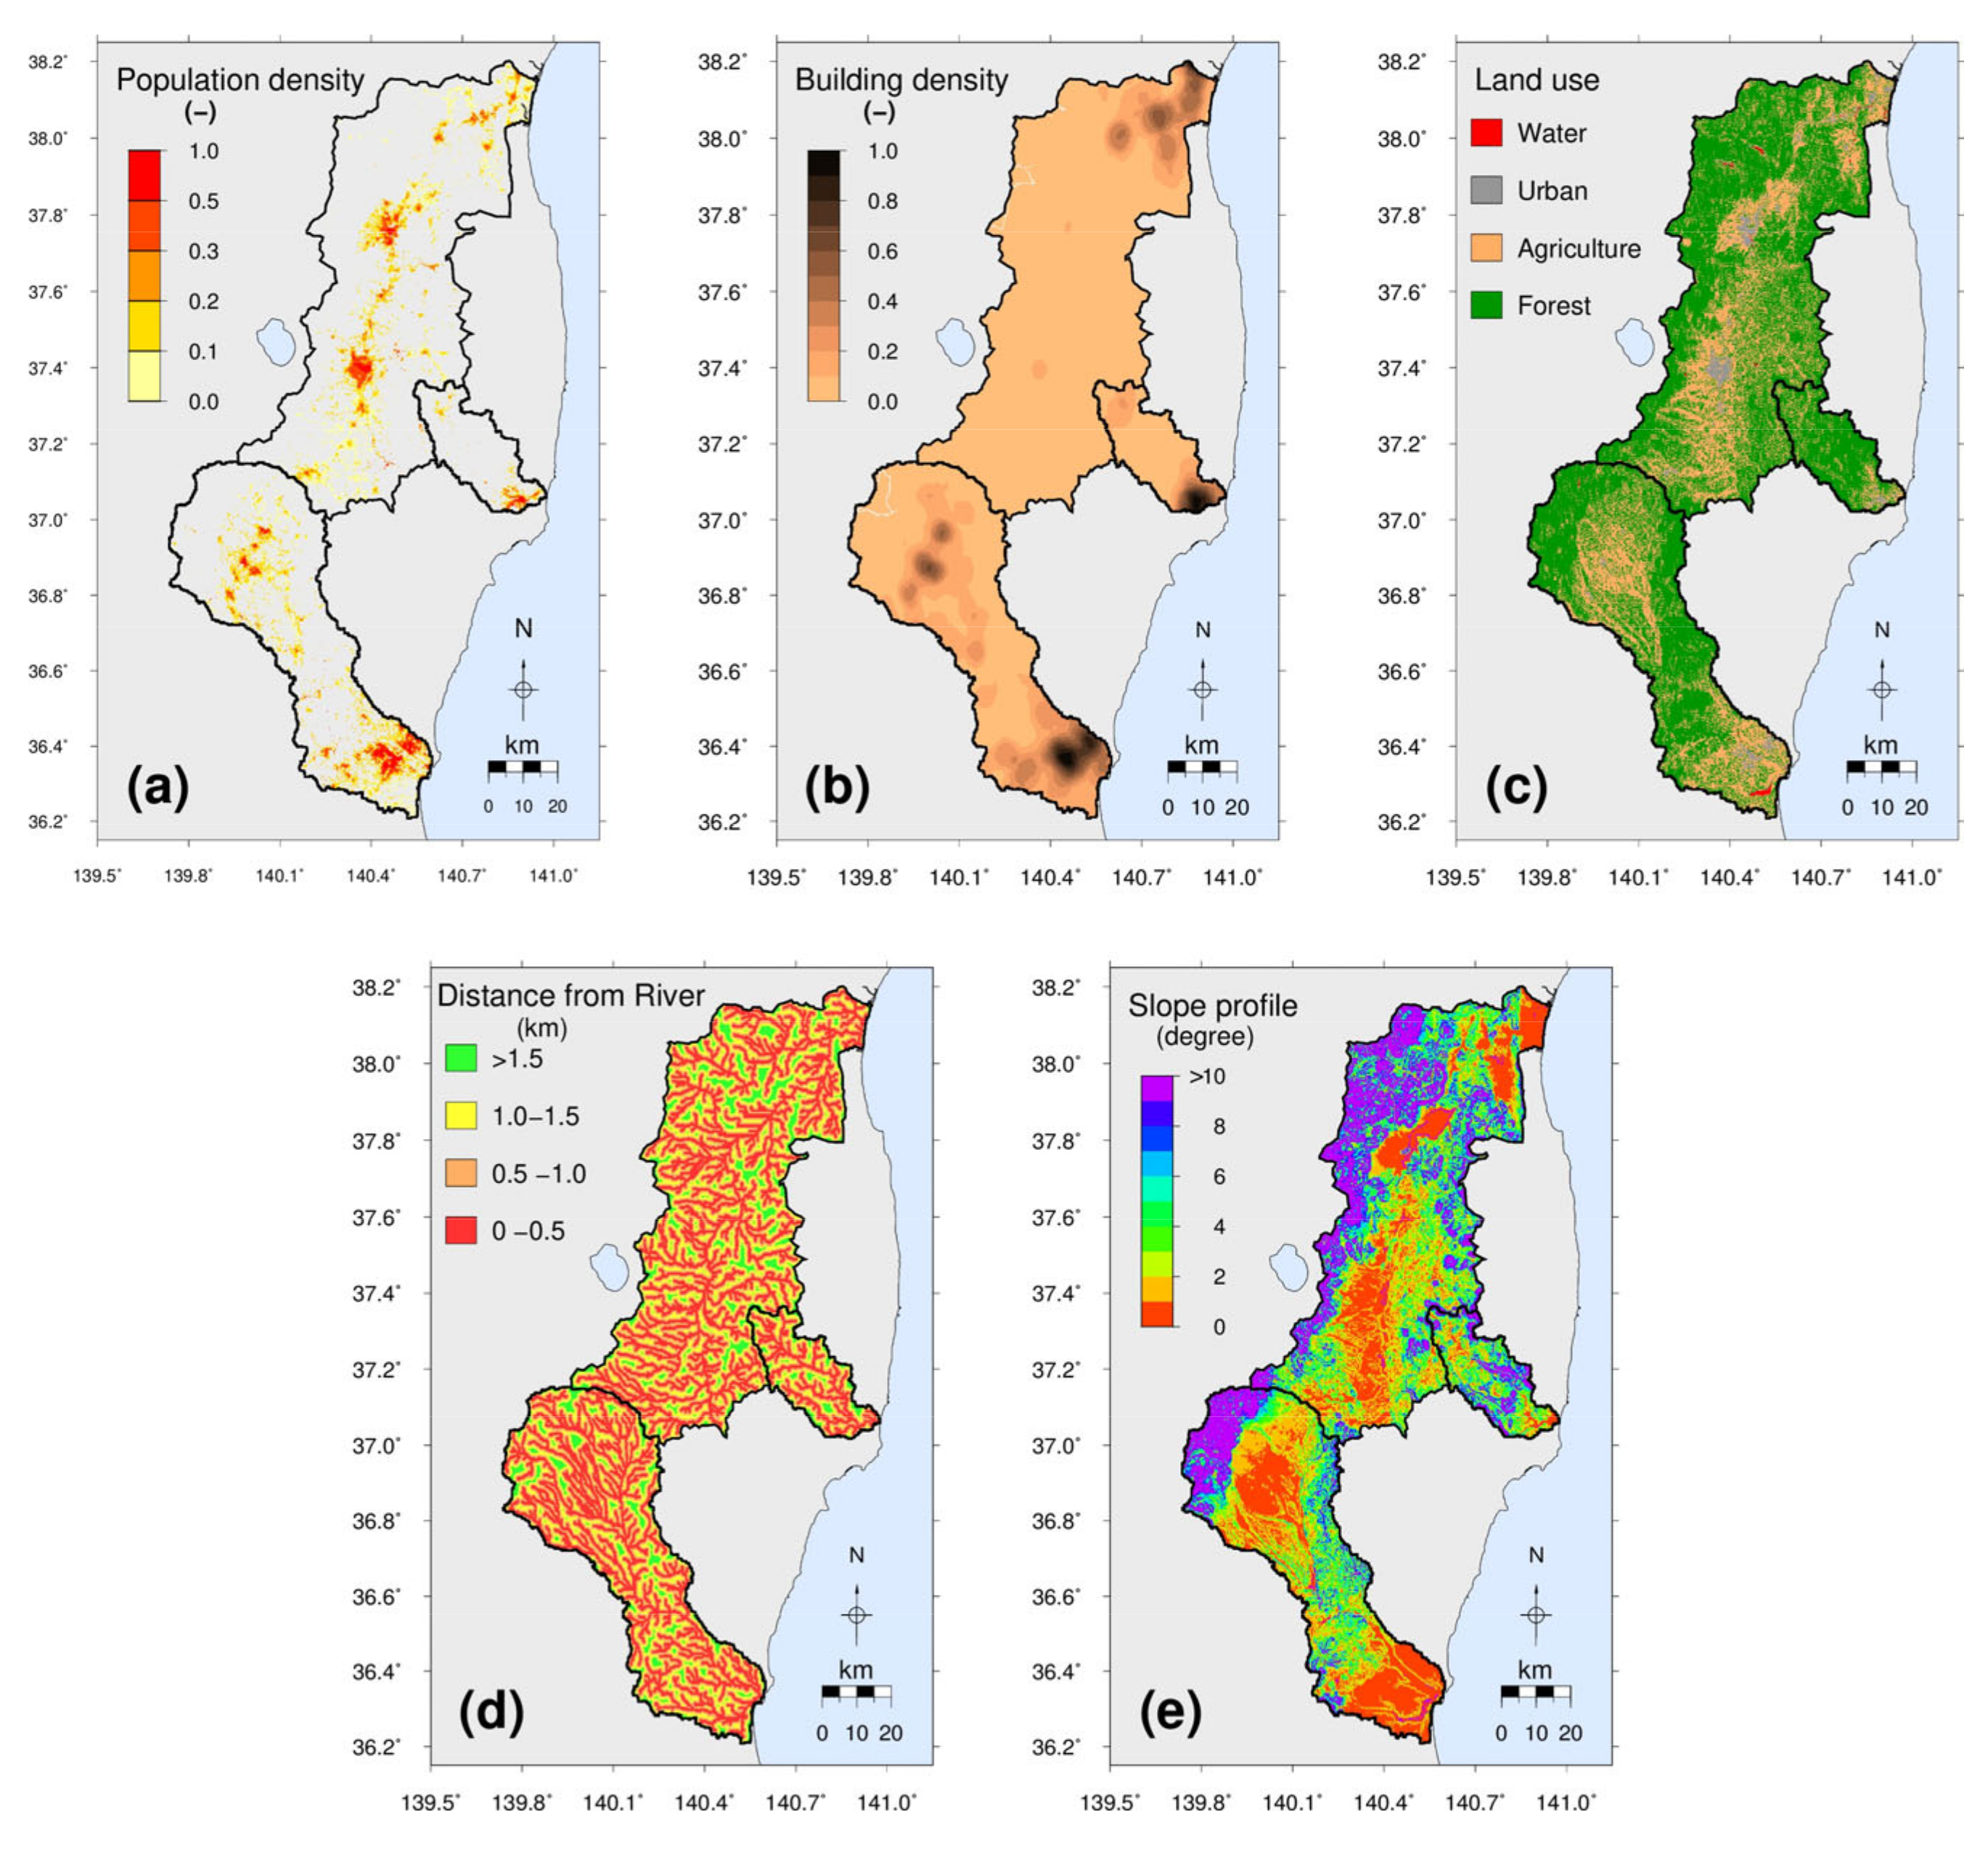
3.3.1. Population Density (POP)

The population directly impacted by extreme flood events is an essential consideration in this study. The default spatial resolution of the population data is 100 m. The default data presents the population as the number of people per grid cell. We calculated the relative frequency of this distribution to identify possible high-density population areas within the basins, as shown in Figure 8a. The relative frequency was then reclassified into four categories (0–0.05, 0.05–0.15, 0.15–0.30, and 0.30–1.0) to represent low, moderate, high, and very high population densities, respectively, in the input raster data for the AHP process.

3.3.2. Building Density (BLD)

BLD data are crucial in flood risk mapping as they indicate the potential impact of floods on buildings. The BLD data used in this study were initially in shape format and were subsequently converted to point data, which were then interpolated to obtain the distribution of building density within the basins. The relative density of the distribution was then calculated to identify areas with a high density of buildings, as depicted in Figure 8b. The relative density data were then reclassified into four categories, namely low, moderate, high, and very high statuses (0–0.05, 0.05–0.15, 0.15–0.30, and 0.30–1.0), for use in the AHP process as input raster data.

3.3.3. Land-Use Profile (LU)

The different nomenclature of the land-use profile presented in the default data from JAXA clearly indicates the status of the land-use profile. It is common to reclassify these nomenclatures into a certain group. We divided them into four categories based on the objectives. The four categories were urban, agriculture, forest, water, and other. The reclassification of the land-use profiles is shown in Figure 8c, and this information was used in the AHP process.

3.3.4. Distance from River (DIS)

River networks were considered in this study for hydrological simulations. The small river channels originating from the mountainous areas of the selected basins have a higher risk of flooding during extreme rainfall. Flood inundation may easily occur along the main tributaries of rivers in the basins. The distance from the rivers was calculated and classified into four categories: 500 m, 1000 m, 1500 m, and >1500 m. Figure 8d shows the spatial distribution of the distances from the river.

3.3.5. Slope Profile (SLP)

The slope profile is an important factor to consider in flood inundation. Additionally, it is important to acknowledge that each dataset included in the study was chosen for its relevance and importance in achieving the study’s objectives. The slope at each grid of the selected basins was calculated using the DEM data (Figure 8e). The main purpose of this study was to identify lowland flat lands. In general, the slope profile shows a low degree for the flat area, while a higher degree indicates mostly mountainous regions where the chance of flood inundation is always low. The classification of risk slopes is not the same in many studies [16]. Based on several previous references and the topographic characteristics of the basins, we reclassified the slope of those basins into four categories, which represent flat, gentle, moderate, and steep profile (0–2, 2–5, 5–10, and 10–100).

3.4. Flood Susceptibility Mapping

After processing the six key influential datasets from various sources, it was important to categorize them based on their significance and objectives to utilize them in AHP, which is based on spatial multi-criteria analysis through a weighted overlay. A GIS-based AHP approach was used to identify potential flood occurrences in the study. The six datasets, INU, POP, BLD, LU, DIS, and SLP, were categorized into the first through sixth orders, respectively. Although the selected elements were all considered to be of equal importance, moderate importance was preferred between INUN vs. DIST and INUN vs. SLOP, considering the higher priority of social indicators in this study. The weightages for INU, POP, BLD, LU, DIS, and SLP were 25%, 16%, 16%, 16%, 14%, and 13%, respectively. The consistency ratio was 3.3%, indicating acceptable inconsistency. If the consistency ratio exceeds 10%, subjective judgment needs to be reviewed [47,48].
The flood susceptibility mapping of the Abukuma, Naka, and Natsui River basins was developed based on the relative weight and priority of individual factors and sub-factors causing flood inundation, as defined above. The flood susceptibility was divided into four zones: low, moderate, high, and very high. Figure 9 shows the spatial distribution of flood susceptibility across the three basins during the flood event. The maps revealed a very high flood susceptibility downstream of all the river basins, while high flood risk was also identified in many areas within these basins. In contrast, the mountainous region near the boundary of the selected river basins had a very minimal flood risk. It is important to note that the INU data were the primary factor in the combination of other vulnerable factors, such as population and buildings, to generate the susceptibility map, which was based on this single flood event (i.e., Typhoon Hagibis). Therefore, this flood susceptibility map should only be used for this specific event, and different events may produce different results.

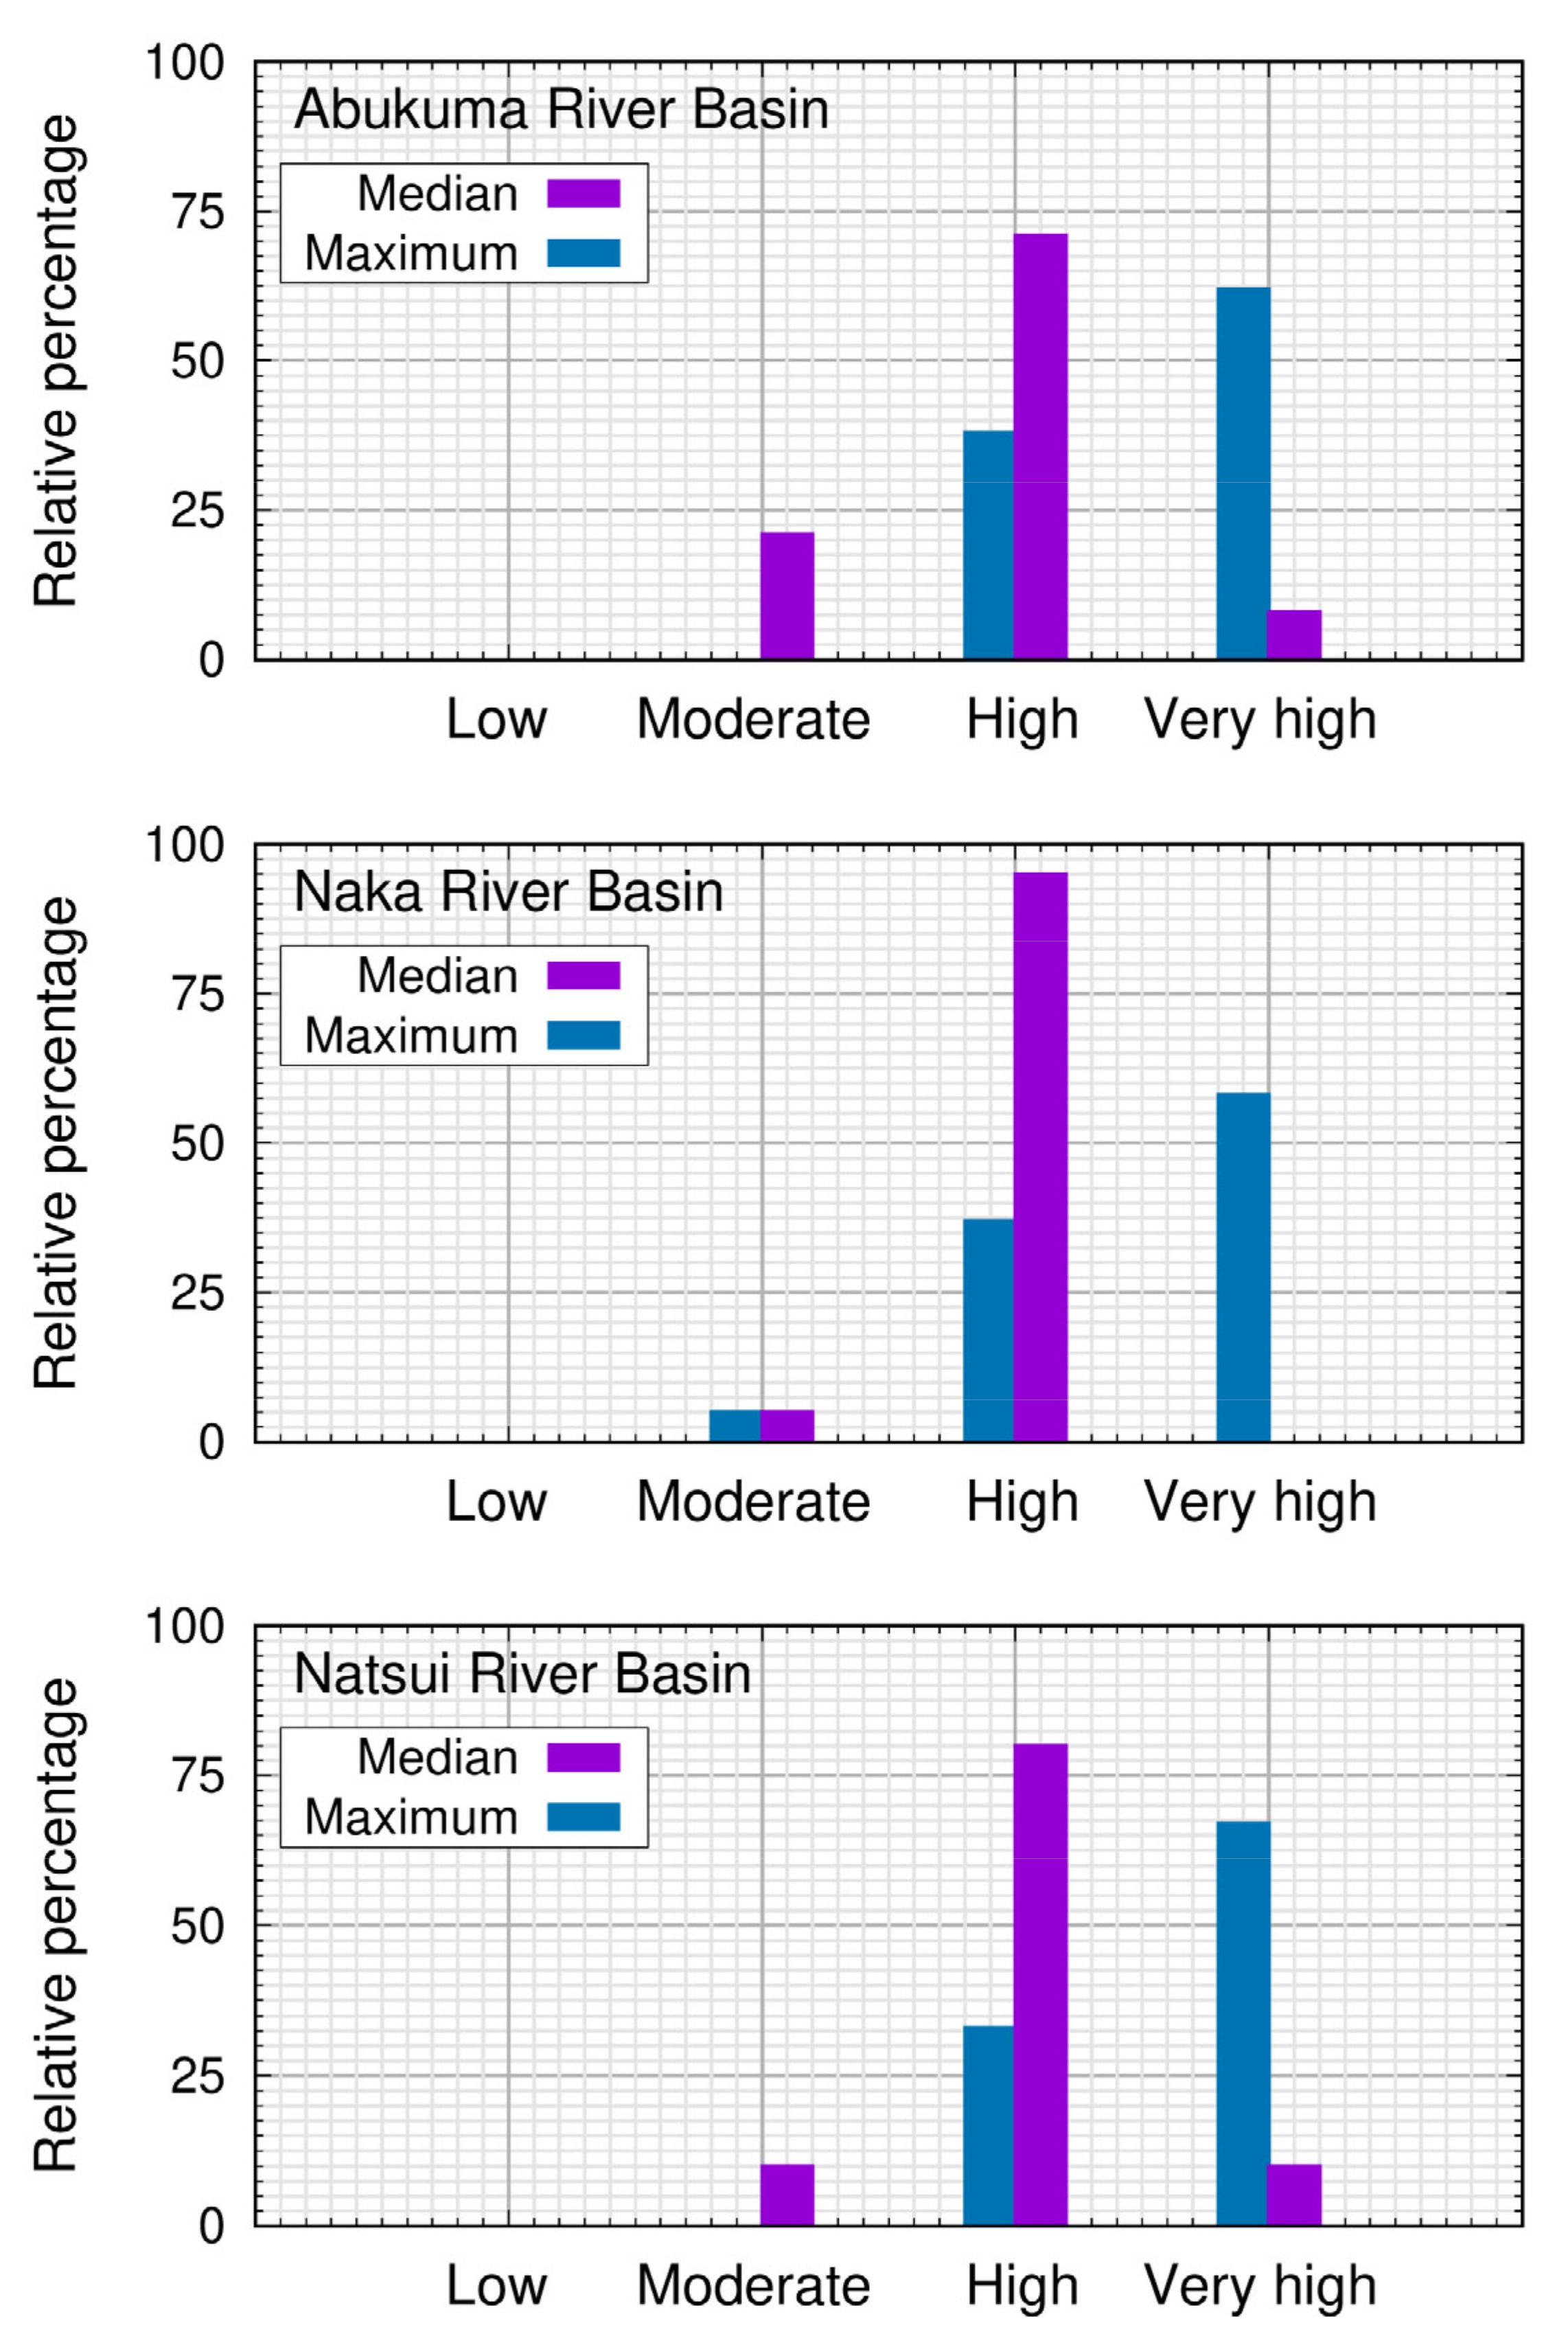
3.5. Validation of Flood Risk Map

After Typhoon Hagibis in 2019, residents in flood-affected areas submitted claims for flood disaster insurance payments to social insurance companies. These claims were referred to as flood insurance claims data and were provided by Tokio Marine & Nichido Fire Insurance Co., Ltd. for the selected three river basins (Figure 1). The flood insurance claims data represent the payout ratio, which is the payout amount divided by insurance premiums and is associated with the ZIP code level. These data enabled us to identify flood risk zones across the basins. We hypothesized that a good relationship exists between the developed flood susceptibility map and the insurance-claimed data for this event. However, comparing the insurance-claimed data and flood susceptibility mapping was not straightforward due to their mapping characteristics. The collected insurance claim data were based on postal addresses and were not defined at specific points due to social security concerns. Therefore, the data were in a polygon format (combining the postal address area), which does not indicate specific points on the map. Collecting point data on social insurance claims is not common in Japan due to personal information security concerns. After reviewing the insurance claims data, we found multiple insurance claims within a single polygon area. However, we did not analyze the number of insurance claims within each polygon area in this study.
The flood susceptibility map for the three river basins was developed at a grid resolution of about 250 m (Figure 10). As there were multiple flood risk zones within each polygon of the insurance claim data, there were several ways to compare the flood risk categories. In this study, we extracted the maximum and median values of the flood risk category within each insurance claim data polygon. Figure 10 illustrates the flood risk status over the insurance claim data polygons for all three river basins based on each polygon’s maximum flood risk category. The results showed that high and very high flood risks were prevalent in the social insurance claims polygons. However, the results are slightly different if the median value of flood risk from the polygon data is considered.
To provide a more quantitative assessment, we calculated each river basin’s relative percentage of flood risk categories. Figure 11 illustrates the relative percentage of flood risk categories within each river basin polygon based on the median and maximum values. As shown, high and very high flood risks were found in most cases. In the Abukuma and Natsui River Basins, over 70% of insurance loss data were associated with high flood risk. The results were more favorable in the case of the Naka River Basin, although a small percentage of loss insurance data was still linked to low flood risk. It is important to note that the insurance loss data are based on postal addresses, and the boundaries of the claimed areas may not always correspond with the actual flood-prone locations.

4. Discussion

This study developed flood susceptibility mapping for the Abukuma, Naka, and Natsui River basins for a specific extreme rain event, using flood inundation depth profiles from hydrological simulations as key hazard data. The study also considered the role of other influential factors in vulnerability environments and management measures. To assess the usefulness of the mapping products in social insurance, the developed map was compared with social insurance claims data under certain conditions and assumptions. The application of simulated hydrological data for developing flood susceptibility maps, and the importance of considering the social insurance business, were raised in the introduction and will be discussed in the following section.

4.1. Application of Inundation Depth to the Flood Susceptibility Mapping

In this study, the uncertainties associated with the physiographic data used in the hydrological model setup were not analyzed, as they are beyond the scope of this study. However, several studies have discussed the optimal scales for DEM and hydrometeorological input data [12,13,34,50]. It is possible to find the best DEM with high resolution for a river basin in a specific area or region. A finer spatial resolution simulation with varying temporal scales can also provide good results. A hydrological simulation of a large river basin at a fine spatiotemporal scale may not be common [36], but spatial resolution and accuracy improvements are needed.
Notably, radar rainfall data were used as a meteorological parameter in the RRI model for this extreme flood event. However, there is a potential for biased rainfall data during heavy-rain events, which was not the focus of this study. An accurate estimation of rainfall during intense rainfall periods can be challenging, as shown in a previous study [10], which compared radar rainfall with point rainfall data and found both overestimation and underestimation during extreme rainfall events. In this study, we assumed that the radar rainfall data were close to reality. One of the challenges of flood inundation analysis in river basins is the defining of river geometries. In this study, a reference empirical equation defined for a neighboring river basin was used. Another challenge is accounting for flood scenarios, such as embankment failure and backwater effects, which were excluded from the simulation. During the Typhoon Hagibis case, 140 embankments along over 70 rivers throughout the country broke, and there were backwater effects in many areas due to record rain. In the Abukuma River Basin, levees collapsed at 47 locations along the Abukuma River and 16 along its tributaries. Collecting all this information and implementing its time and location in the model setup is a significant challenge during disaster events. Furthermore, the model did not account for some tributaries in the river basin, which may impact the flood inundation extent in certain areas.
Although shallow flood inundation was observed in some parts of the river basins, it was not visible in specific areas due to the limited spatial resolution of the topographic data and other uncertainties in the model setup. To minimize uncertainties in the simulation, the flood inundation profile of each time step of the river basins was reanalyzed. In this study, we interpolated the frequency of the flood inundation depth (>0.5 m) to better understand the flood impact during the entire period of the flood event. However, there could be a chance to cover the bias area in some parts of the interpolation, which is a limitation of this study. A more detailed analysis of the realistic interpolation of the flood inundation depth of a specific event will be conducted in a future study to address this limitation.
It is important to note that uncertainties are inherent in any simulation, and there is a need to minimize them to obtain more realistic results. Despite the limitations, the hydrological simulation of the river basins was effective in developing flood risk zones during an extreme event. The validation of the flood risk zones with the flood insurance claim data shows that the approach adopted in this study is acceptable for flood-related insurance policies. The developed flood risk zones can serve as a reference for managing flood-related risks and for making appropriate decisions to support clients promptly after the flood event.

4.2. Flood Susceptibility Mapping for Social Insurance Business

Developing a flood susceptibility map based on an AHP is a well-established approach that has been used in many studies for various purposes. However, the critical aspect of this method is how to select and prioritize the appropriate data relevant to the study’s objectives. In this study, the primary goal was to define flood risk zones for specific flood events relevant to flood insurance claims. Therefore, a careful consideration of data selection and prioritization was crucial. The insurance industry heavily relies on hazard maps, and the historical dataset was an essential part of the map development in this study. By incorporating the flood insurance claims data, the flood susceptibility map produced in this study can be a valuable tool for social insurance companies in managing risks and supporting their clients during and after flood events.
Previous studies have typically used historical rainfall data to create hazard maps. However, high rainfall grids in a given area do not necessarily correspond to flooded areas, as the hydrological characteristics of the region heavily influence flooding. To address this limitation, we employed a novel approach in this study. Specifically, we analyzed flood inundation depth maps from each time step of the simulated flood event, considering the hydrological characteristics of the selected river basins. This new approach enabled us to develop a more accurate and reliable hazard map for the river basins.
In this study, our focus was on the devastating Typhoon Hagibis, which hit Japan from 12–13 October 2019, causing extensive damage to the Tohoku, Kanto, Hokuriku, and Chubu regions. The typhoon affected over 70 river systems and resulted in the loss of more than 90 lives in eastern Japan [30]. This event has contributed significantly to the record-high damage claims by flood disasters in recent years, thereby straining emergency reserves held by top insurers. The estimated losses from Typhoon Hagibis alone were expected to exceed USD 10 billion, with many flood insurance claims filed during the event (Figure 1).
Previous studies have used flood susceptibility mapping to estimate the risk and provide warnings before any extreme events. However, these approaches did not focus on a specific flood event, so they may not offer a comprehensive assessment of flood risk. Our study, on the contrary, focused on a particular event, Typhoon Hagibis, and found a strong relationship between flood insurance claims and high flood risk zones in the selected river basins. Field observation and investigation during a flood event can be challenging, which highlights the importance of using our proposed method to develop flood risk zones based on a particular extreme flood event. This would be particularly helpful to insurance-related businesses. Future studies should consider using finer resolution data to improve flood risk mapping.

5. Conclusions

Flooding is a widespread issue that affects thousands of people and causes significant annual losses in Japan. The increasing trend of flood disasters in the coming days will likely lead to even more significant losses. Therefore, it is crucial to understand and find ways to manage the financial impacts of flood risk effectively. Various approaches have been applied to understand the flood risk zone during flood events, focusing on the financial aspect. Developing a flood susceptibility map of extreme events is an essential strategy for characterizing flood risk zones during extreme rain events. It can be a valuable reference for post-disaster management, such as the quick assessment of damaged properties and loss of life in flood-affected areas.
In this study, we attempted to develop a flood susceptibility map of the Abukuma, Naka and Natsui river basins using the GIS-based AHP approach for Typhoon Hagibis 2019. The selection and proper use of data are fundamental in developing flood susceptibility mapping for a river basin. First, we conducted hydrological simulations of all three river basins using the RRI model. The simulated river discharge was validated with the observed river discharge of the Abukuma and Naka River Basins, and the hydrological simulations performed well for the selected river basins. We then extracted and analyzed the maximum flood inundation depth over the river basins and reanalyzed the flood inundation extent of these basins at each time step. The relative frequency of the flood inundation depth (>0.5 m) was extracted from each grid over those basins. To ensure the visible spatial distribution of the relative frequency of the flood inundation duration, which was a key influential data factor in developing the flood susceptibility map, we interpolated the relative frequency of the extracted maps. In contrast to the approach used in previous studies, such a hazard map was entirely based on hydrological simulations, which was a new approach used in this study. In addition, we considered other key influential factors, such as population, building, land use, distance from rivers, and slope profile. With the help of all six selected influential data, we developed the flood susceptibility map over the Abukuma, Naka, and Natsui River Basins for Typhoon Hagibis.
In conclusion, the strong agreement that was found between flood insurance claims data and the developed flood risk categories suggests that the flood susceptibility map could be a valuable tool for flood management and recovery efforts in the aftermath of a flood event. Developing a flood susceptibility map focusing on a specific event could provide practical economic guidance for insurance companies and related industries. Our new approach, which combines hydrological simulation results and other flood causative factors based on the financial aspects within river basins, has shown promising results for the Abukuma, Naka, and Natsui River Basins for the extreme flood event brought by Typhoon Hagibis. The developed flood risk mapping product could serve as a valuable reference for future flood-related planning and decision-making. Additionally, if forecasted rain data, such as 36 h ahead, were available, flood susceptibility mapping could be issued earlier. Future work should improve uncertainties in hydrological analysis and consider finer resolution data for river basins.

Author Contributions

Conceptualization, methodology, and formal analysis, S.P.C.; Investigation, S.P.C., K.H. and K.I.; Validation, S.P.C. and K.I.; Writing—original draft preparation, S.P.C.; Writing—review and editing, S.P.C., K.H. and K.I. All authors have read and agreed to the published version of the manuscript.

Funding

This research was funded by the internal project under the Storm, Flood and Landslide Research Division, National Research Institute for Earth Science and Disaster Resilience (NIED), Tsukuba, Japan.

Institutional Review Board Statement

Not applicable.

Informed Consent Statement

Not applicable.

Data Availability Statement

Data are available from the authors upon request. Due to their confidential and protected nature, insurance data are not publicly available.

Acknowledgments

The authors are grateful to the Ministry of Land, Infrastructure, Transport, and Tourism (MLIT), the Japan Meteorological Agency (JMA), WorldPop mapping website, Japan Aerospace Exploration Agency (JAXA) and Dai Yamazaki’s website for publishing and updating important information and related datasets on their webpages. The authors are thankful to the Tokio Marine & Nichido Fire Insurance Co., Ltd. for providing the social insurance claim data for the event of typhoon Hagibis 2019. The authors want to thank the anonymous reviewers for their comments, which considerably improved this paper.

Conflicts of Interest

The authors declare no conflict of interest.

References

  1. Chan, F.K.S.; Yang, L.E.; Mitchell, G.; Wright, N.; Guan, M.; Lu, X.; Wang, Z.; Montz, B.; Adekola, O. Comparison of Sustainable Flood Risk Management by Four Countries—The United Kingdom, the Netherlands, the United States, and Japan—And the Implications for Asian Coastal Megacities. Nat. Hazards Earth Syst. Sci. 2022, 22, 2567–2588. [Google Scholar] [CrossRef]
  2. Jiang, Y.; Luo, Y.; Xu, X. Flood Insurance in China: Recommendations Based on a Comparative Analysis of Flood Insurance in Developed Countries. Environ. Earth Sci. 2019, 78, 93. [Google Scholar] [CrossRef]
  3. Fan, J.; Huang, G. Evaluation of Flood Risk Management in Japan through a Recent Case. Sustainability 2020, 12, 5357. [Google Scholar] [CrossRef]
  4. NIED. Flood Inundation in Kurume-shi on 14–15 August 2021. (In Japanese). Available online: https://mizu.bosai.go.jp/key/20210814Inun (accessed on 17 October 2022).
  5. Surminski, S.; Thieken, A.H. Promoting Flood Risk Reduction: The Role of Insurance in Germany and England. Earth’s Future 2017, 5, 979–1001. [Google Scholar] [CrossRef] [Green Version]
  6. Surminski, S.; Oramas-Dorta, D. Flood Insurance Schemes and Climate Adaptation in Developing Countries. Int. J. Disaster Risk Reduct. 2014, 7, 154–164. [Google Scholar] [CrossRef] [Green Version]
  7. Alifu, H.; Hirabayashi, Y.; Imada, Y.; Shiogama, H. Enhancement of river flooding due to global warming. Sci. Rep. 2022, 12, 20687. [Google Scholar] [CrossRef]
  8. Hirabayashi, Y.; Mahendran, R.; Koirala, S.; Konoshima, L.; Yamazaki, D.; Watanabe, S.; Kim, H.; Kanae, S. Global Flood Risk Under Climate Change. Nat. Clim. Chang. 2013, 3, 816–821. [Google Scholar] [CrossRef]
  9. Kundzewicz, Z.; Kanae, S.; Seneviratne, S.; Handmer, J.; Nicholls, N.; Peduzzi, P.; Mechler, R.; Bouwer, L.M.; Arnell, N.; Mach, K.; et al. Flood risk and climate change: Global and regional perspectives. Hydrol. Sci. J. 2013, 59, 1–28. [Google Scholar] [CrossRef] [Green Version]
  10. P.C., S.; Misumi, R.; Nakatani, T.; Iwanami, K.; Maki, M.; Maesaka, T.; Hirano, K. Accuracy of Quantitative Precipitation Estimation Using Operational Weather Radars: A Case Study of Heavy Rainfall on 9–10 September 2015 in the East Kanto Region, Japan. J. Disaster Res. 2016, 11, 1003–1016. [Google Scholar] [CrossRef]
  11. P.C., S.; Nakatani, T.; Misumi, R. Analysis of Flood Inundation in Ungauged Mountainous River Basins: A Case Study of an Extreme Rain Event on 5–6 July 2017 in Northern Kyushu, Japan. J. Disaster Res. 2018, 13, 860–872. [Google Scholar] [CrossRef]
  12. P.C., S.; Kamimera, H.; Misumi, R. Inundation Analysis of the Oda River Basin in Japan During the Flood Event of 6–7 July 2018 Utilizing Local and Global Hydrographic data. Water 2020, 12, 1005. [Google Scholar] [CrossRef] [Green Version]
  13. P.C., S.; Hirano, K.; Iizuka, S. Flood Inundation Mapping of the Hitachi Region in the Kuji River Basin, Japan, During the October 11–13, 2019 Extreme Rain Event. J. Disaster Res. 2020, 15, 712–725. [Google Scholar] [CrossRef]
  14. P.C., S.; Hirano, K.; Iizuka, S.; Misumi, R. Quick Exposure Assessment of Flood Inundation: A Case Study of Hitoyoshi City in Kumamoto Prefecture, Japan. Res. Rep. NIED 2020, 85, 13–23. [Google Scholar] [CrossRef]
  15. Shao, J.; Hoshino, A.; Nakaide, S. How Do Floods Affect Insurance Demand? Evidence from Flood Insurance Take-up in Japan. Int. J. Disaster Risk Reduct. 2022, 83, 103424. [Google Scholar] [CrossRef]
  16. Aydin, M.C.; Sevgi, B.E. Flood Risk Analysis Using GIS-based Analytical Hierarchy Process: A Case Study of Bitlis Province. Appl. Water Sci. 2022, 12, 122. [Google Scholar] [CrossRef]
  17. Al-Aizari, A.R.; Al-Masnay, Y.A.; Aydda, A.; Zhang, J.; Ullah, K.; Islam, A.R.M.T.; Habib, T.; Kaku, D.U.; Nizeyimana, J.C.; Al-Shaibah, B.; et al. Assessment Analysis of Flood Susceptibility in Tropical Desert Area: A Case Study of Yemen. Remote Sens. 2022, 14, 4050. [Google Scholar] [CrossRef]
  18. Pham, B.T.; Phong, T.V.; Nguyen, H.D.; Qi, C.; Al-Ansari, N.; Amini, A.; Ho, L.S.; Tuyen, T.T.; Yen, H.P.H.; Ly, H.-B.; et al. A Comparative Study of Kernel Logistic Regression, Radial Basis Function Classifier, Multinomial Naïve Bayes, and Logistic Model Tree for Flash Flood Susceptibility Mapping. Water 2020, 12, 239. [Google Scholar] [CrossRef] [Green Version]
  19. Hu, S.; Cheng, X.; Zhou, D.; Zhang, H. GIS-based flood risk assessment in suburban areas: A case study of the Fangshan District, Beijing. Nat. Hazards 2017, 87, 1525–1543. [Google Scholar] [CrossRef]
  20. Vojtek, M.; Vojteková, J. Flood Susceptibility Mapping on a National Scale in Slovakia using the Analytical Hierarchy Process. Water 2019, 11, 364. [Google Scholar] [CrossRef] [Green Version]
  21. Hadian, S.; Afzalimehr, H.; Soltani, N.; Tabarestani, E.S.; Karakouzian, M.; Nazari-Sharabian, M. Determining Flood Zonation Maps, Using New Ensembles of Multi-criteria Decision-making, Bivariate Statistics, and Artificial Neural Network. Water 2022, 14, 1721. [Google Scholar] [CrossRef]
  22. Ighile, E.H.; Shirakawa, H.; Tanikawa, H. Application of GIS and Machine Learning to Predict Flood Areas in Nigeria. Sustainability 2022, 14, 5039. [Google Scholar] [CrossRef]
  23. Parsian, S.; Amani, M.; Moghimi, A.; Ghorbanian, A.; Mahdavi, S. Flood Hazard Mapping Using Fuzzy Logic, Analytical Hierarchy Process, and Multi-source Geospatial Datasets. Remote Sens. 2021, 13, 4761. [Google Scholar] [CrossRef]
  24. Askar, S.; Zeraat Peyma, S.; Yousef, M.M.; Prodanova, N.A.; Muda, I.; Elsahabi, M.; Hatamiafkoueieh, J. Flood Susceptibility Mapping Using Remote Sensing and Integration of Decision Table Classifier and Metaheuristic Algorithms. Water 2022, 14, 3062. [Google Scholar] [CrossRef]
  25. Swain, K.C.; Singha, C.; Nayak, L. Flood Susceptibility Mapping through the GIS-AHP Technique Using the Cloud. ISPRS Int. J. Geo-Inf. 2020, 9, 720. [Google Scholar] [CrossRef]
  26. Karymbalis, E.; Andreou, M.; Batzakis, D.-V.; Tsanakas, K.; Karalis, S. Integration of GIS-based Multicriteria Decision Analysis and Analytic Hierarchy Process for Flood-hazard Assessment in the Megalo Rema River Catchment (East Attica, Greece). Sustainability 2021, 13, 10232. [Google Scholar] [CrossRef]
  27. Alarifi, S.S.; Abdelkareem, M.; Abdalla, F.; Alotaibi, M. Flash Flood Hazard Mapping Using Remote Sensing and GIS techniques in Southwestern Saudi Arabia. Sustainability 2022, 14, 14145. [Google Scholar] [CrossRef]
  28. Danumah, J.H.; Odai, S.N.; Saley, B.M.; Szarzynski, J.; Thiel, M.; Kwaku, A.; Kouame, F.K.; Akpa, L.Y. Flood risk assessment and mapping in Abidjan district using multi-criteria analysis (AHP) model and geoinformation techniques, (cote d’ivoire). Geoenviron. Disasters 2016, 3, 10. [Google Scholar] [CrossRef] [Green Version]
  29. NHK (NHK WORLD-JAPAN). Typhoon Hagibis Aftermath. 2019. Available online: https://www3.nhk.or.jp/nhkworld/en/news/special/typhoon201919 (accessed on 20 November 2022).
  30. Das, S.; Alexander, J.; Ishiwatari, M.; Komino, T.; Shaw, R. Lessons from Hagibis: Learning to Cope with Intensifying Disasters in the Age of New Normal; CWS: Tokyo, Japan, 2020. [Google Scholar]
  31. Ma, W.; Ishitsuka, Y.; Takeshima, A.; Hibino, K.; Yamazaki, D.; Yamamoto, K.; Kachi, M.; Oki, R.; Oki, T.; Yoshimura, K. Applicability of a nationwide flood forecasting system for Typhoon Hagibis 2019. Sci. Rep. 2021, 11, 10213. [Google Scholar] [CrossRef]
  32. Liu, W.; Fujii, K.; Maruyama, Y.; Yamazaki, F. Inundation Assessment of the 2019 Typhoon Hagibis in Japan Using Multi-Temporal Sentinel-1 Intensity Images. Remote Sens. 2021, 13, 639. [Google Scholar] [CrossRef]
  33. Moya, L.; Mas, E.; Koshimura, S. Learning from the 2018 Western Japan Heavy Rains to Detect Floods during the 2019 Hagibis Typhoon. Remote Sens. 2020, 12, 2244. [Google Scholar] [CrossRef]
  34. Sugiura, I. Very-short-range Forecast of Precipitation in Japan. In Proceedings of the 14th Annual WRF Users’ Workshop, Boulder, CO, USA, 25–27 June 2013. [Google Scholar]
  35. Yamazaki, D.; Togashi, S.; Takeshima, A.; Sayama, T. High-resolution Flow Direction Map of Japan. J. JSCE 2020, 8, 234–240. [Google Scholar] [CrossRef]
  36. Sayama, T.; Ozawa, G.; Kawakami, T.; Nabesaka, S.; Fukami, K. Rainfall-runoff-inundation Analysis of the 2010 Pakistan Flood in the Kabul River Basin. Hydrol. Sci. J. 2012, 57, 298–312. [Google Scholar] [CrossRef]
  37. Saksena, S.; Merwade, V. Incorporating the Effect of DEM Resolution and Accuracy for Improved Flood Inundation Mapping. J. Hydrol. 2015, 530, 180–194. [Google Scholar] [CrossRef] [Green Version]
  38. Nguyen, T.T.; Nakatsugawa, M.; Yamada, T.J.; Hoshino, T. Flood Inundation Assessment in the Low-Lying River Basin Considering Extreme Rainfall Impacts and Topographic Vulnerability. Water 2021, 13, 896. [Google Scholar] [CrossRef]
  39. Sayama, T.; Yamada, M.; Sugawara, Y.; Yamazaki, D. Ensemble Flash Flood Predictions Using a High-resolution Nationwide Distributed Rainfall-Runoff Model: Case study of the Heavy Rain Event of July 2018 and Typhoon Hagibis in 2019. Prog. Earth Planet Sci. 2020, 7, 75. [Google Scholar] [CrossRef]
  40. Yoshimoto, S.; Amarnath, G. Applications of Satellite-Based Rainfall Estimates in Flood Inundation Modeling—A Case Study in Mundeni Aru River Basin, Sri Lanka. Remote Sens. 2017, 9, 998. [Google Scholar] [CrossRef] [Green Version]
  41. Scharffenberg, W. Hydrological Modeling System HEC-HMS. User’s Manual; Publication of US Army Corps of Engineers: Davis, CA, USA, 2016. [Google Scholar]
  42. Beven, K.J.; Lamb, R.; Quinn, P.F.; Romanowicz, R.; Freer, J. Top model. In Computer Models of Watershed Hydrology; Singh, V.P., Ed.; Water Resources Publications: Littleton, CO, USA, 1995; pp. 627–668. [Google Scholar]
  43. Liang, X.; Lettenmaier, D.P.; Wood, E.F.; Burges, S.J. A Simple Hydrologically Based Model of Land Surface Water and Energy Fluxes for General Circulation Models. J. Geophys. Res. 1994, 99, 14415–14428. [Google Scholar] [CrossRef]
  44. Sayama, T. Rainfall-Runoff-Inundation (RRI) Model. In Disaster Prevention Research Institute (DPRI); Kyoto University: Kyoto, Japan, 2017. [Google Scholar]
  45. P.C., S.; Nakatani, T.; Misumi, R. Hydrological Simulation of Small River Basins in Northern Kyushu, Japan, during the Extreme Rainfall Event of July 5–6, 2017. J. Disaster Res. 2018, 13, 396–409. [Google Scholar] [CrossRef]
  46. Saaty, T.L. The Analytic Hierarchy Process; McGraw-Hill: New York, NY, USA, 1980. [Google Scholar]
  47. Al-Harbi, K.M.A.S. Application of the AHP in Project Management. Int. J. Proj. Manag. 2001, 19, 19–27. [Google Scholar] [CrossRef]
  48. Goepel, K.D. Implementation of an Online Software Tool for the Analytic Hierarchy Process (AHP-OS). Int. J. Anal. Hierarchy Process 2018, 10, 469–487. [Google Scholar] [CrossRef] [Green Version]
  49. Moges, E.; Demissie, Y.; Larsen, L.; Yassin, F. Sources of Hydrological Model Uncertainties and Advances in their Analysis. Water 2021, 13, 28. [Google Scholar] [CrossRef]
  50. Bates, P.D.; Marks, K.J.; Horritt, M.S. Optimal use of High-resolution Topographic data in Flood Inundation Models. Hydrol. Process. 2003, 17, 537–557. [Google Scholar] [CrossRef]
Figure 1. Topographic map showing the altitudinal profile of the Abukuma, Natsui and Naka River Basins. Purple polygons show the insurance claimed during the extreme rain event of September 2019, Typhoon Hagibis.
Sustainability 15 04909 g001
Figure 2. Total accumulated rainfall from 2019-10-10 0000UTC to 2019-10-14 2300UTC over the Abukuma, Natsui and Naka River Basins.
Sustainability 15 04909 g002
Figure 3. Flow chart to define the flood risk zones in river basins.
Sustainability 15 04909 g003
Figure 4. Comparison of the observed and simulated discharge by RRI at the two gauging stations (Senba and Yamada) of Abukuma River Basin for the typhoon Hagibis 2019 case.
Sustainability 15 04909 g004
Figure 5. Comparison of the observed and simulated discharge by RRI at the two gauging stations (Nemotomachi and Noguchi) of Naka River Basin for the typhoon Hagibis 2019 case.
Sustainability 15 04909 g005
Figure 6. Maximum flood inundation depth profile by RRI over the river basins for the typhoon Hagibis 2019 case.
Sustainability 15 04909 g006
Figure 7. Spatial distribution of relative frequency of flood inundation (>0.5 m) from the period of 2019-10-11 1500UTC—2019-10-13 1400UTC.
Sustainability 15 04909 g007
Figure 8. Selected influential factors for flood susceptibility: (a) Population density; (b) Building density; (c) Land use; (d) Distance from rivers; and (e) Slope.
Sustainability 15 04909 g008
Figure 9. Flood susceptibility map of the three river basins.
Sustainability 15 04909 g009
Figure 10. Flood risk status within insurance claim polygons of the three river basins.
Sustainability 15 04909 g010
Figure 11. Flood risk status and relative percentage based on the insurance claimed data of the three river basins during the typhoon Hagibis.
Sustainability 15 04909 g011
Disclaimer/Publisher’s Note: The statements, opinions and data contained in all publications are solely those of the individual author(s) and contributor(s) and not of MDPI and/or the editor(s). MDPI and/or the editor(s) disclaim responsibility for any injury to people or property resulting from any ideas, methods, instructions or products referred to in the content.

