Article

Effect of Aggregates Packing with the Maximum Density Methodology in Pervious Concrete

1
MAC—Grupo de Pesquisa em Materiais Alternativos de Construção, Universidade Estadual Paulista (UNESP), Campus de Ilha Solteira, Ilha Solteira 15385000, Brazil
2
GIQUIMA Group—Grupo de Investigación en Química de los Materiales de Construcción, ICITECH—Instituto de Ciencia y Tecnología del Hormigón, Universitat Politècnica de Valencia, 46022 Valencia, Spain
*
Author to whom correspondence should be addressed.
Sustainability 2023, 15(6), 4939; https://doi.org/10.3390/su15064939
Submission received: 2 February 2023 / Revised: 3 March 2023 / Accepted: 8 March 2023 / Published: 10 March 2023
(This article belongs to the Special Issue Innovations in Durability of Sustainable Concrete Materials)

Abstract

:
The granulometric distribution of the aggregates used in pervious concrete can significantly impact its mechanical and hydraulic properties by modifying granular skeleton and pore distribution. The unit weight increases when single-sized aggregates are combined, which results in improved mechanical properties. In this study, the maximum density methodology was applied to enhance pervious concrete’s mechanical strength by using three narrow-sized basaltic aggregates and their combination. The experimental results showed that the mechanical performance of the samples created with packed aggregates improved compressive strength by up to 81.2% and the energy support impact was higher than 225 J (50% higher than the reference sample) after curing for 28 days. Although the densification of packing aggregates increased, the greatest reduction in porosity was 24.3%. The lowest infiltration rate was 0.43 cm/s, a satisfactory value according to the literature. These findings suggest that the aggregates packing methodology is effective in producing optimized and sustainable pervious concretes.

1. Introduction

As the world’s population and urbanization rates grow, more materials are used for building construction purposes, which has reduced permeable areas and consequent soil sealing [1,2,3]. This phenomenon can cause social, economic and environmental problems, including flooding caused by stormwater [1,4,5,6]. To address this issue, environmental protection agencies worldwide have proposed various alternative solutions. One promising solution is to use pervious concrete (PC) in pavements, which can help to mitigate the negative impacts of heat islands and flooding in urban areas. Infiltrating rainwater facilitates groundwater recharge while minimizing the pollution of water bodies [3,5,6,7,8,9].
PC is a type of concrete made up of cementitious materials (i.e., Portland cement), water, open-graded coarse aggregates, and sometimes small amounts of fine aggregates [10]. Its mechanical and hydraulic properties are strongly influenced by the presence of interconnected pores, which typically range from 15% to 35% [4,5,10,11]. PC has an infiltration rate that normally ranges from 0.2 to 2.64 cm/s [7,12,13] and its compressive strength falls within the 2–30 MPa range [7,9,14,15].
PC’s mechanical and hydraulic properties are affected by various factors, such as the amount of Portland cement, the water-to-binder ratio (w/b), the use of supplementary cementitious materials, the compaction process, and the type and grading of aggregates [5,10,16,17]. Aggregate size can impact PC’s mechanical properties because it influences both pore formation and the thickness of the paste that interconnects aggregates [18,19,20,21].
Granulometric aggregates distribution also plays a crucial role in determining the balance between porosity and the solid phase, which directly affect PC’s physical, mechanical, and hydraulic properties [7,15]. The effect of combining different aggregates in PC can depend on aggregates’ characteristics, such as their type, size, granulometric range and angularity. Most studies have found that blended coarse aggregates can reduce porosity and improve mechanical properties in PC [21]. Table 1 summarizes various mixtures designed in the literature using combined aggregates. The results have shown that depending on the employed aggregates, PC’s mechanical properties can be improved by up to 150.8%, porosity can be reduced by 48% and the infiltration rate can be lowered by up to 94%.
Neithalath, Sumanasooriya and Deo (2010) [26] report an increase in PC porosity when employing blended single-sized aggregates. This increase is attributed to loss of larger aggregates packing, caused by a different size particle being incorporated.
All of the above-mentioned studies were performed using empirical approaches to combine aggregates, and not all the aggregate combinations resulted in improvements in PC’s granular skeleton, as demonstrated.
This study aims to improve PC’s efficiency and sustainability by utilizing O’Reilly’s maximum density methodology for aggregate packing [27]. This approach is preferred to the empirical method for combining aggregates because it is more efficient. This study specifically, compares the physical (density, porosity), mechanical (compressive strength, drop-weight impact resistance) and hydraulic (infiltration rate) properties of PC prepared using packed aggregates to those employing narrow-sized aggregates. In addition, a digital image analysis was applied to characterize the pore structure, and a multiple regression statistical model was used to establish correlations between mechanical and physical properties. These findings can provide valuable insights to develop high-performance PC that is both efficient and sustainable.

2. Materials and Methods

2.1. Materials

PC was prepared using the Brazilian Portland cement classified by ABNT NBR 16697 [28] as type V (equivalent to type III in Standard ASTM C150 [29]). This cement has a density of 3.0 g/cm3 and its composition can present up to 10 wt.% of calcareous filler [28]. Table 2 shows the chemical Portland cement composition, determined thorugh X-ray fluorescence (XRF-7000 from Shimadzu, Kyoto, Japan). Local available natural basaltic coarse aggregates (supplied by Mineração Grandes Lagos, Itapura, Brazil) were used to produce PC. Three narrow-sized aggregates (A, B, and C) were combined in this study.

2.2. Experimental Procedure

2.2.1. Aggregates Characterization and Packing Procedure

The physical characterization of each basaltic aggregate (named A, B and C) was performed following the instructions of ASTM C127 [30] and ASTM C29 [31]. To determine both the unit weight and % of voids, the same compaction procedure used during the production of PC samples was followed: compaction was carried out on a vibration table in two layers (10 s per layer); simultaneously, 10 blows (approx. 1 per second) were made with a steel rod to accommodate aggregates in the cylindrical mold (100 mm × 200 mm). Finally, five more seconds were spent on the vibration table. The procedure was repeated three times. This modification in relation to ASTM C29 [31] in the compaction procedure was performed to guarantee the same conditions to accommodate aggregate particles while producing PC.
The packing procedure, which applied the maximum density methodology proposed by O’Reilly [27], was performed by combining two near narrow-sized aggregates (A and B or B and C). The maximum density methodology is based on the refinement of pores and, consequently, the increase in unit weight from optimizing the packing of the employed aggregates (see Figure 1).
According to O’Reilly, the unit weight (kg/m3) of the largest aggregate should be first determined. Then, a small amount of the larger aggregate (usually around 10% per weight) is replaced with a smaller aggregate, and the unit weight is measured again. The replacement percentage should be incrementally increased to observe its effect on unit weight. The unit weight was obtained using the compaction procedure described above and calculated according to ASTM C29 [31]. By graphing the replacement percentage versus unit weight, a maximum value can be determined to indicate the optimal arrangement of aggregates.
This procedure was run by combining narrow-sized aggregates A–B and B–C. The A–B–C combination was performed using the previous results obtained via the above-mentioned combinations (A–B and B–C).

2.2.2. Pervious Concrete Production

A cement:aggregate mass ratio of 1:5 and an effective water/cement ratio of 0.26 were set for all the PC mixtures. Six PC mixtures were assessed, as previously mentioned, with three selected different narrow-sized aggregates (named A, B, and C), and three combinations of packed aggregates (named AB, BC, and ABC) designed using the maximum density methodology for aggregates packing. The nomenclature adopted for the different PC is related to the employed aggregate: PC-Z, where “Z” is the used aggregate size (A, B, C, AB, BC, or ABC). For all the mixtures, aggregates were utilized by considering the saturated surface dry (SSD) condition. The PC mix proportions are presented in Table 3.
The PC mixtures were prepared in a mechanical drum mixer following these steps: first, the aggregate was added to the mixer along with 50% of the water, and the mixture was stirred for 30 s. Next, 100% Portland cement was added, and the mixture was stirred for another 30-s period. Finally, the remaining water was added, and the mixture was stirred for 60 s. Cylindrical specimens (100 × 200 mm) were then molded for compressive strength tests (five specimens), and also for density, porosity, infiltration rate and pore characterization by an image analysis (three specimens). Specimens were molded in two layers by following the same compaction process to measure the unit weight for aggregates (see Section 2.2.1).
To conduct the drop-weight impact resistance test, hexagonal samples were molded with a side length of 145 mm and a height of 60 mm (5 samples for each mixture). The molding process of the hexagonal specimens involved the following steps: first, the mold was filled to the top and placed on a vibrating table for 15 s, while 20 blows were applied simultaneously with a steel rod to accommodate concrete. Next, 5 s on the vibrating table were applied to finish compaction.
All the specimens were demolded after 24 h and transferred to a curing room with a relative humidity of approximately 95% for 28 days until the age test. After this period, physical, hydraulic and mechanical tests were run.

2.2.3. Porosity and Density of Pervious Concrete

The PC samples’ porosity and density were tested in accordance with ISO 17785-2 [32]. Three samples from each mixture were tested. Samples were dried in an oven until their mass was constant. The samples’ dry mass (kg), denoted as “md”, was then recorded. Next, the samples were immersed in water at a temperature of 20 °C ± 2 °C and left for 30 min. To eliminate entrapped air in voids, samples were tapped 10 times around the specimen’s circumference with a rubber mallet. Finally, the immersed mass (kg) of samples, denoted as “ms”, was recorded.
Porosity was calculated using Equation (1), where “ρw” is the density of water at the water bath temperature and “Vd” is the specimen’s volume. Density (kg/m3) can be calculated using Equation (2).
Porosity   ( % ) = { 1 ( m d m s ) / ρ w V d } × 100 %
Density   ( % ) = m d V d

2.2.4. Infiltration Rate

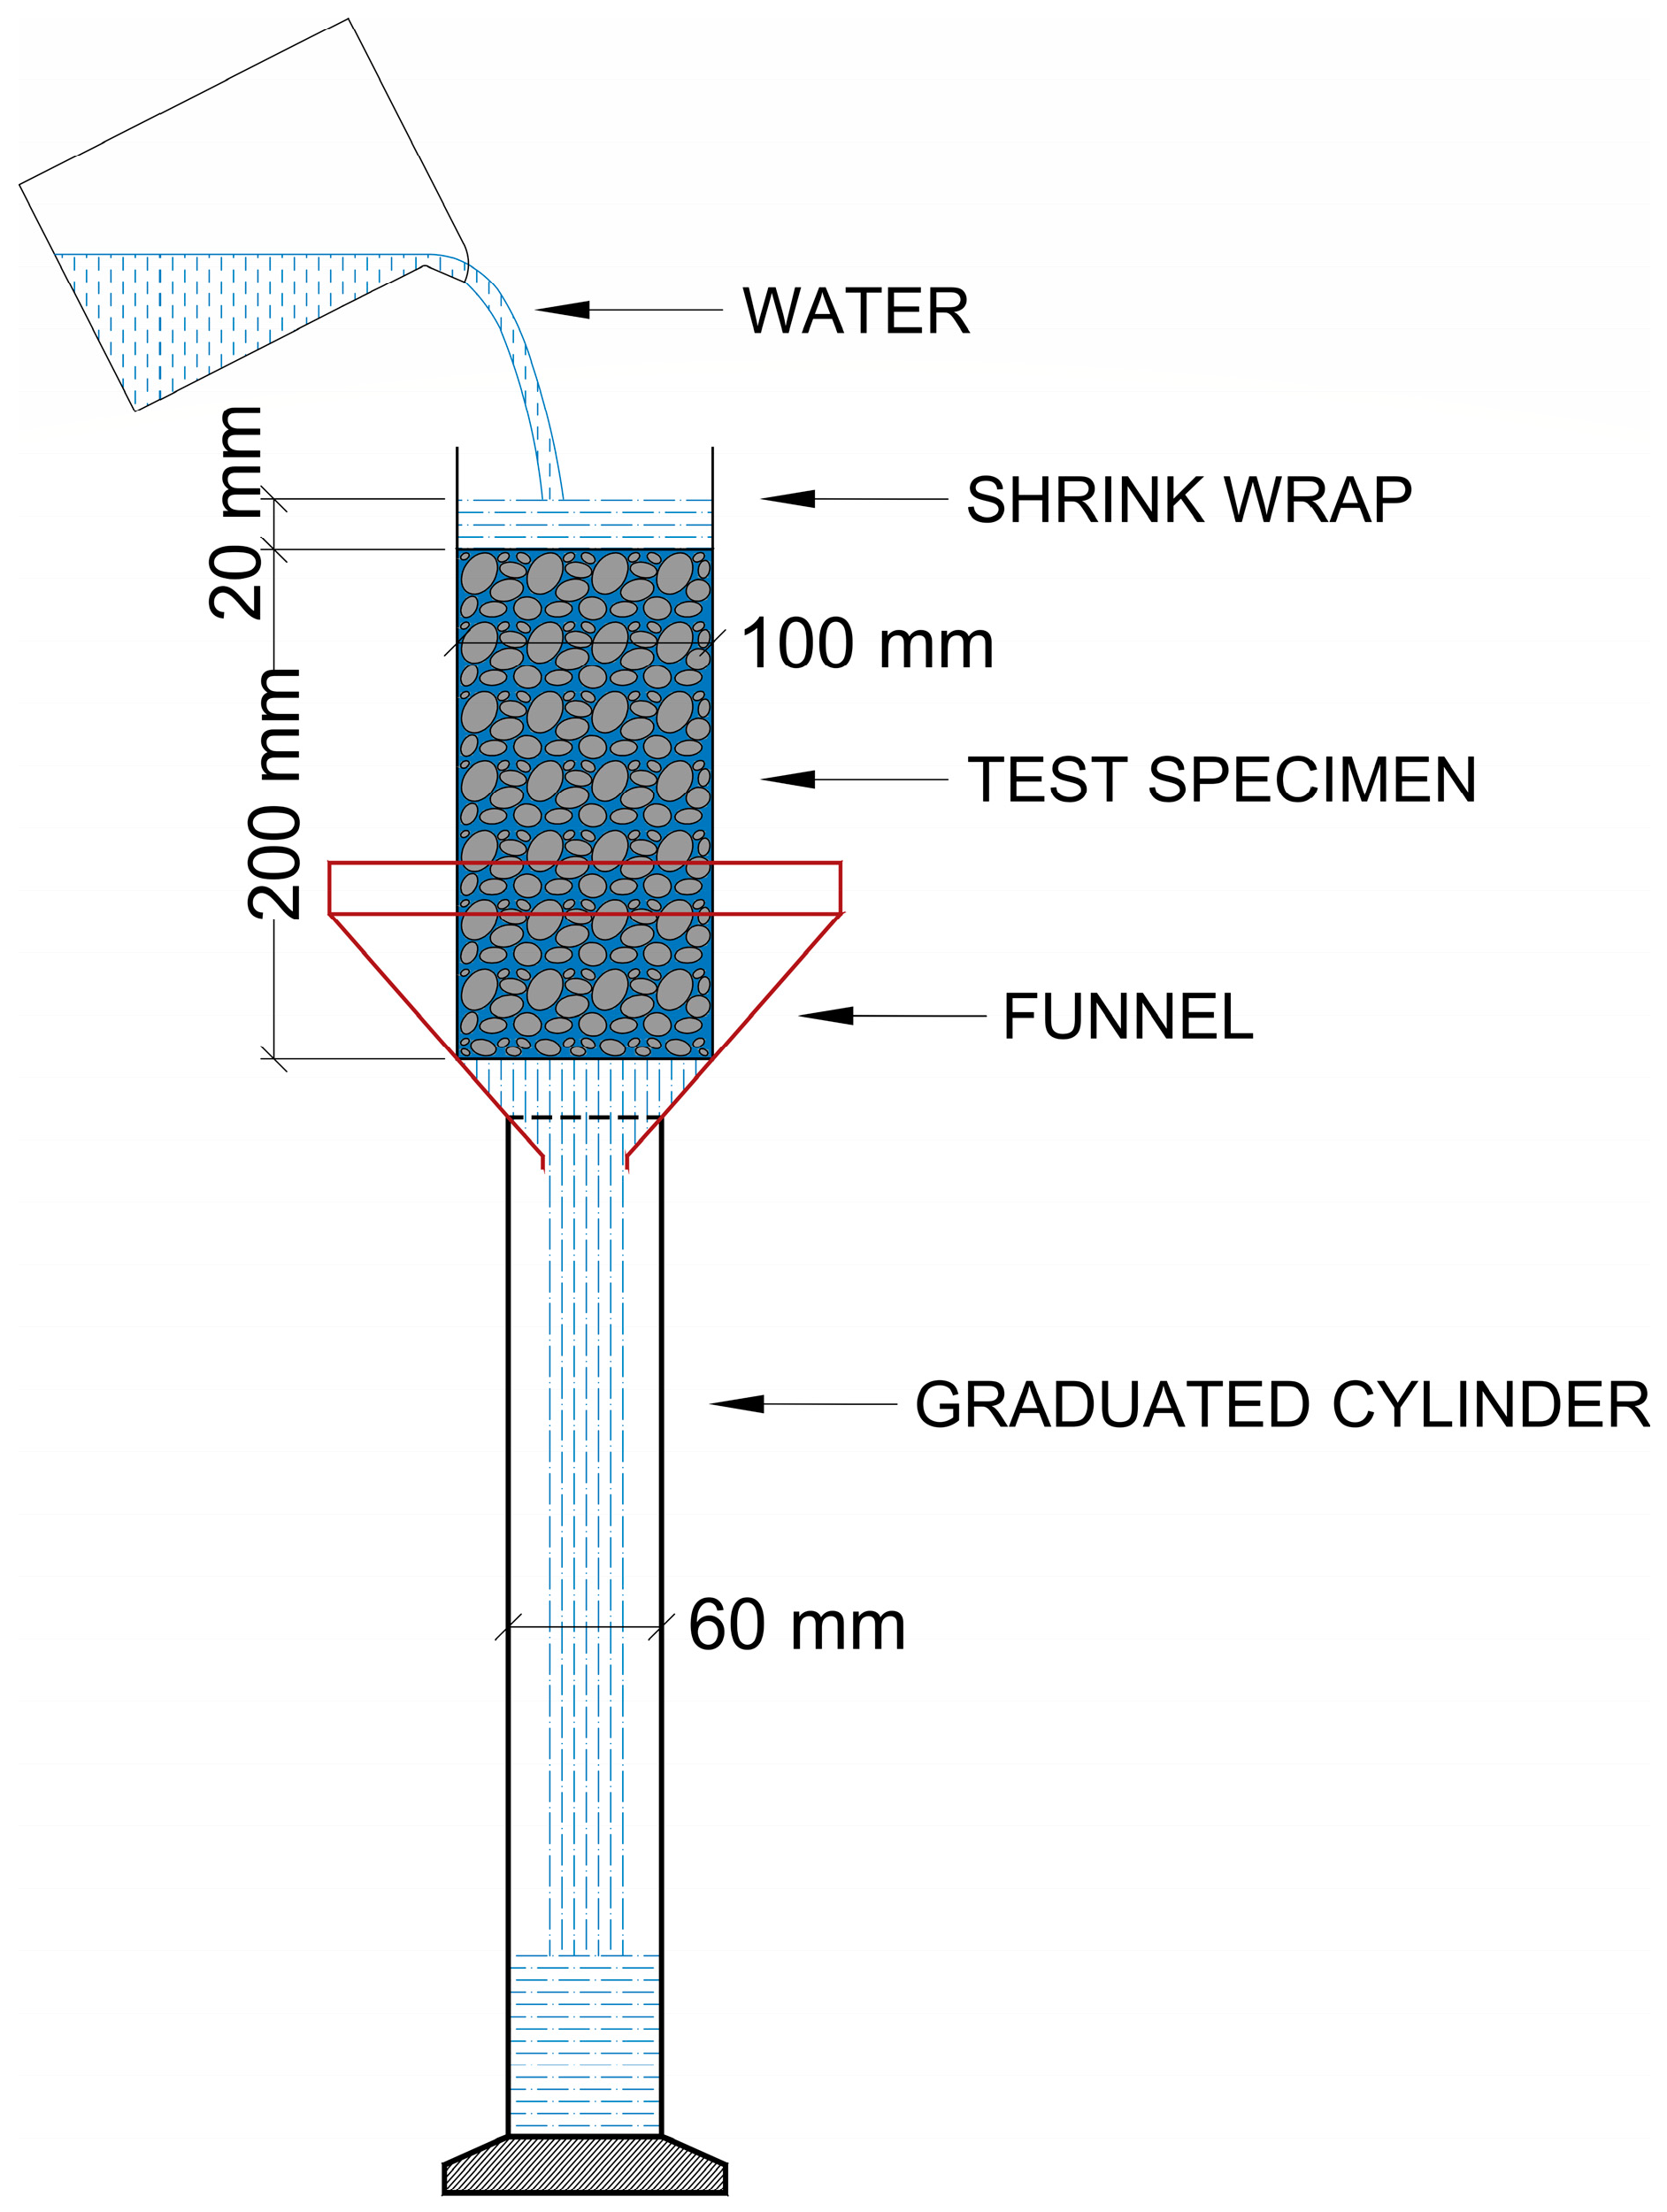
The infiltration rate test was conducted in the laboratory following the recommendations proposed by ISO 17785-1 [33] (see Figure 2). Three samples of each mix proportion were analyzed, and infiltration rate “k” was determined via Equation (3).
Specimens were wrapped along their length with three layers of plastic film, and a 50 mm lip was left above the top surface. To prevent water percolation on the sides and to adjust shrink wrap to sample surfaces, shrink wrap was heated with a heat gun. Specimens were then placed in a funnel to leave the bottom face free.
Infiltration rate “k” was calculated based on the time “t” required for the percolation of 2000 mL of water “V”, poured while maintaining a head of water of approximately 20 mm at the top of the specimen with a known cross-sectional area “A”.
k = V A × t

2.2.5. Compressive Strength

Compressive strength was evaluated by testing five samples for each mix proportion using a universal testing machine (EMIC) with a maximum capacity of 200 tons at a load rate of 0.45 MPa/s, as described in NBR 5739 [34].

2.2.6. Drop-Weight Impact Resistance Test

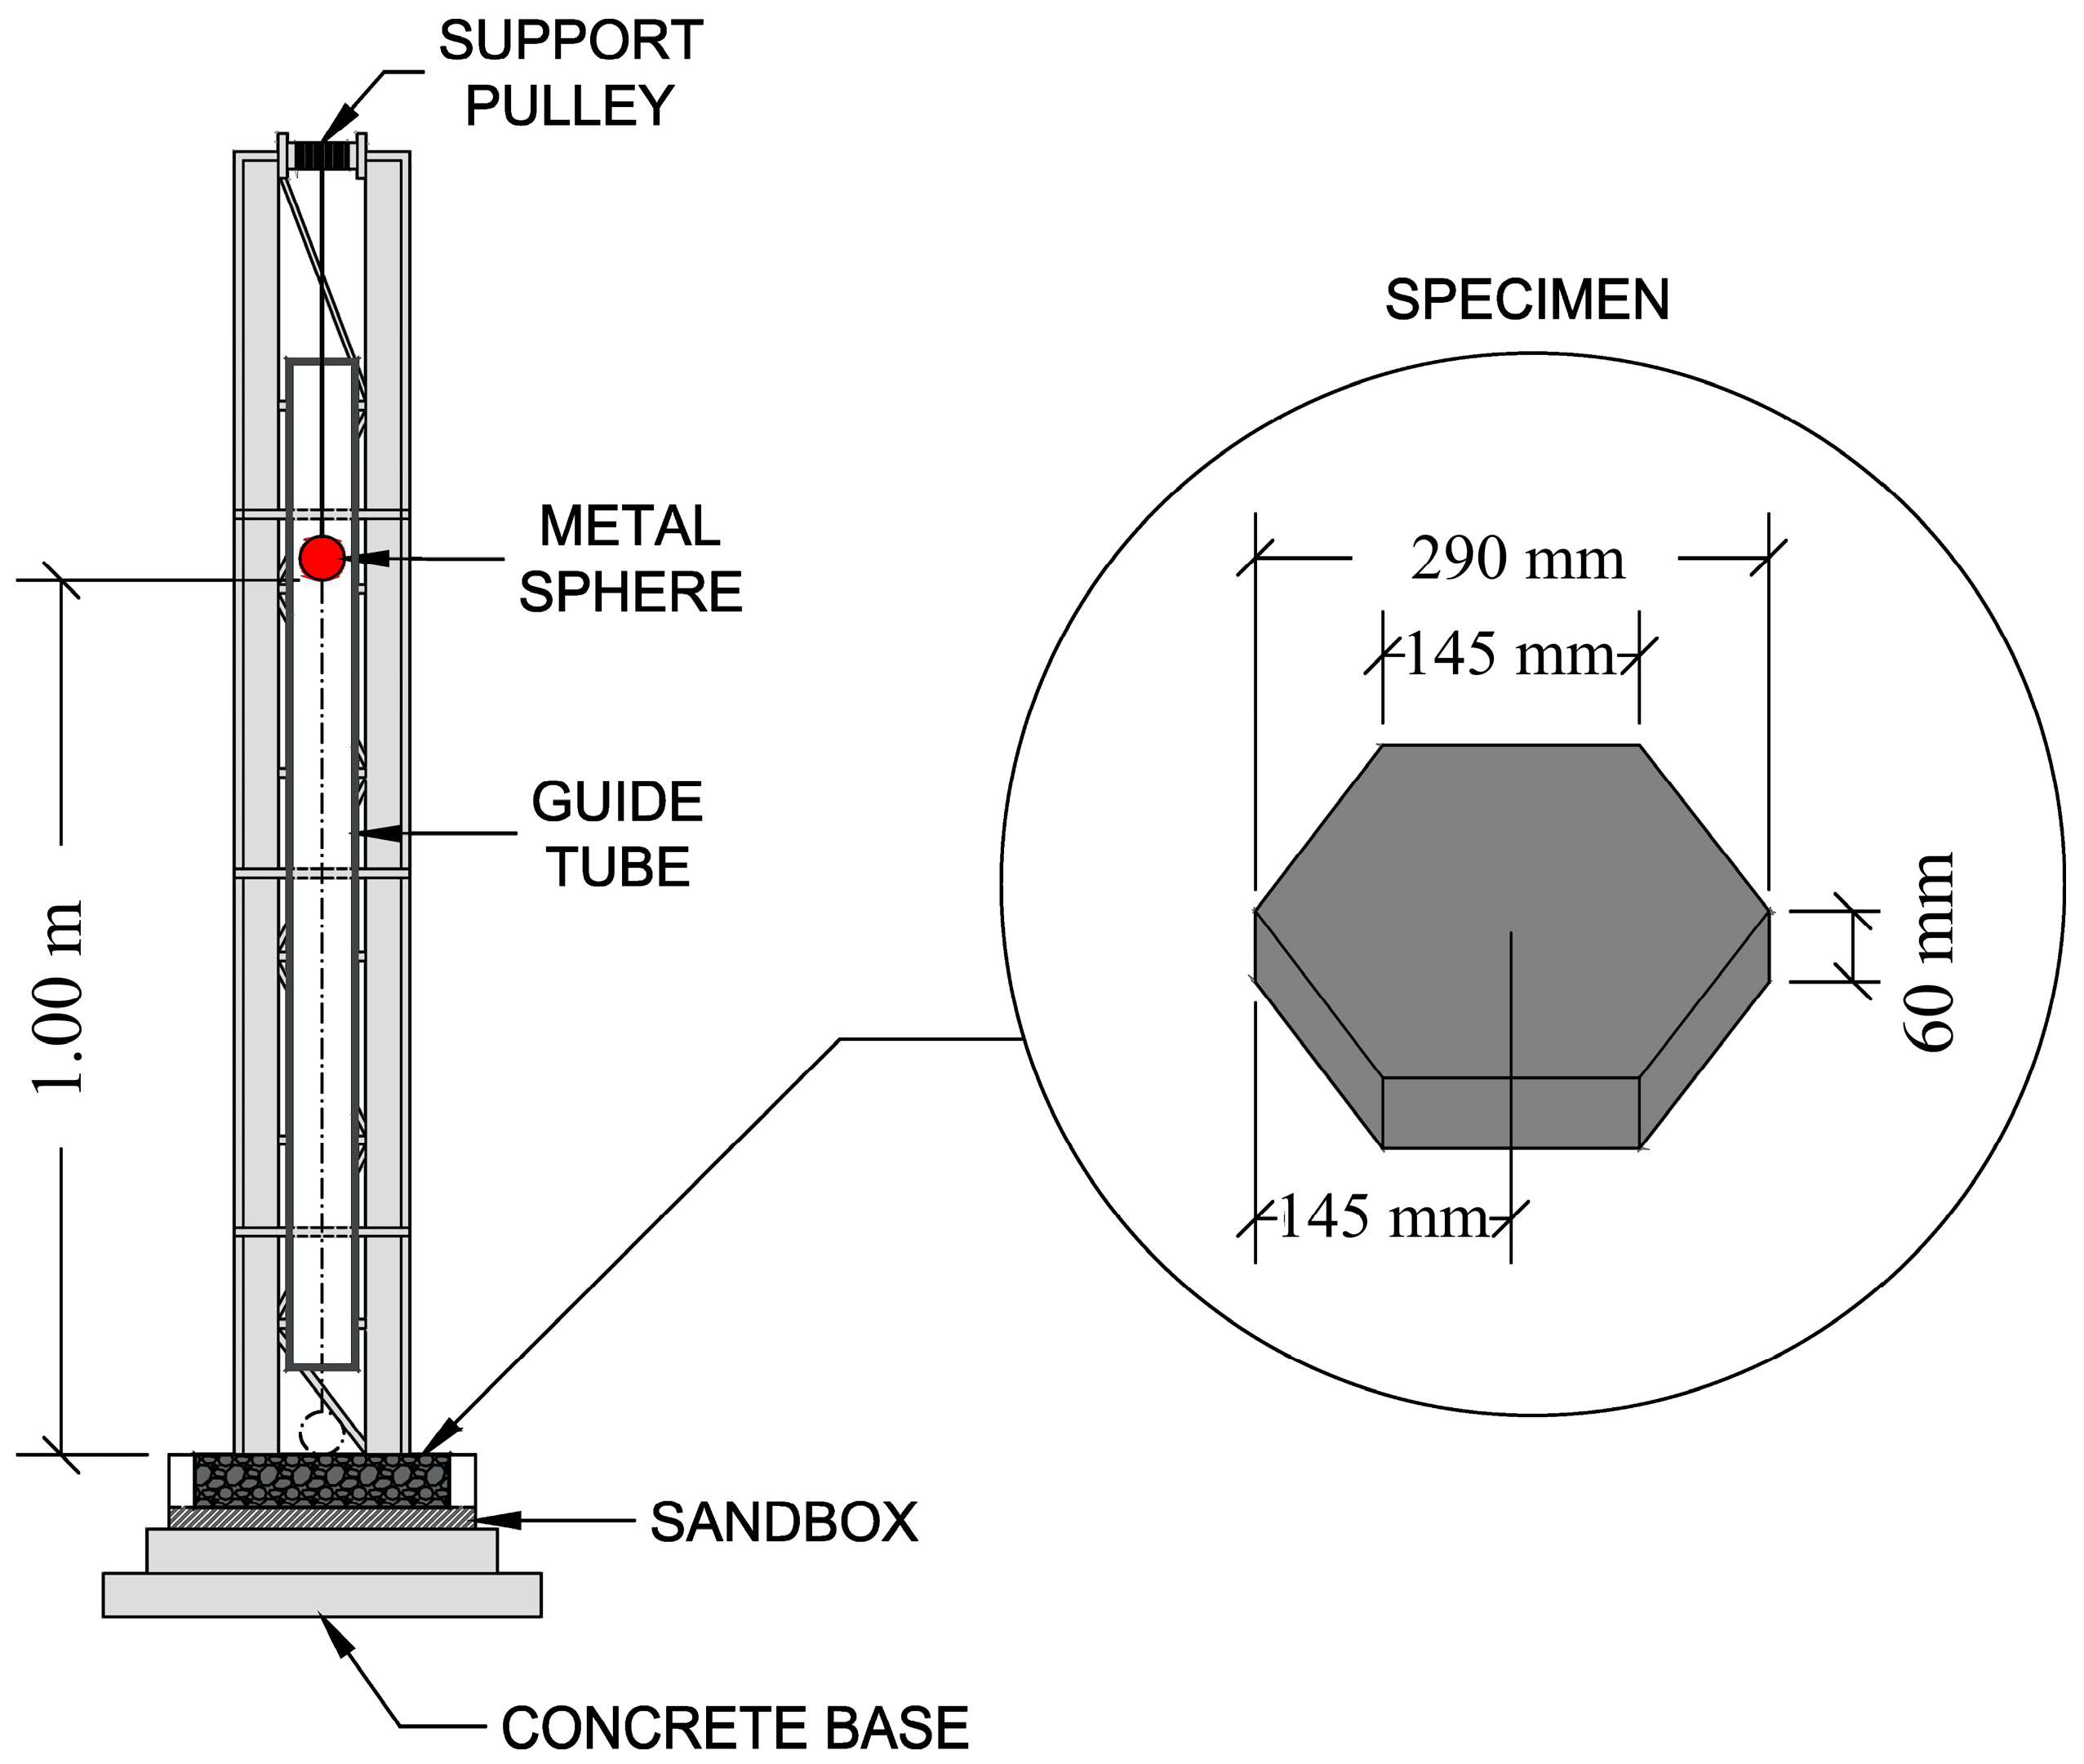
The drop-weight impact resistance test is quantified by the number of blows required to cause a certain level of damage. This test provides an estimate of the energy absorbed by a sample at various load levels. To perform the test, a hexagonal sample is supported by a bed of sand, and a steel ball (63 mm diameter, 1.06 kg mass) is dropped onto the sample from a height of 1.0 m (see Figure 3). The test is repeated several times until the sample fractures. The energy of each impact is calculated using Equation (4), which takes into account the height of the drop, the steel ball’s mass and the gravitational constant. This test was used to evaluate the drop-weight impact resistance of the samples in this study. According to the literature [35,36], the energy absorbed by each sample during the drop-weight impact resistance test can be calculated using Equation (4), where “IE” is the impact energy (J), “h” is the drop height (m), “m” is the steel ball’s mass (kg) and “g” is the gravity constant (9.81 m/s2).
IE = h × m × g

2.2.7. Pore Structure Characterization

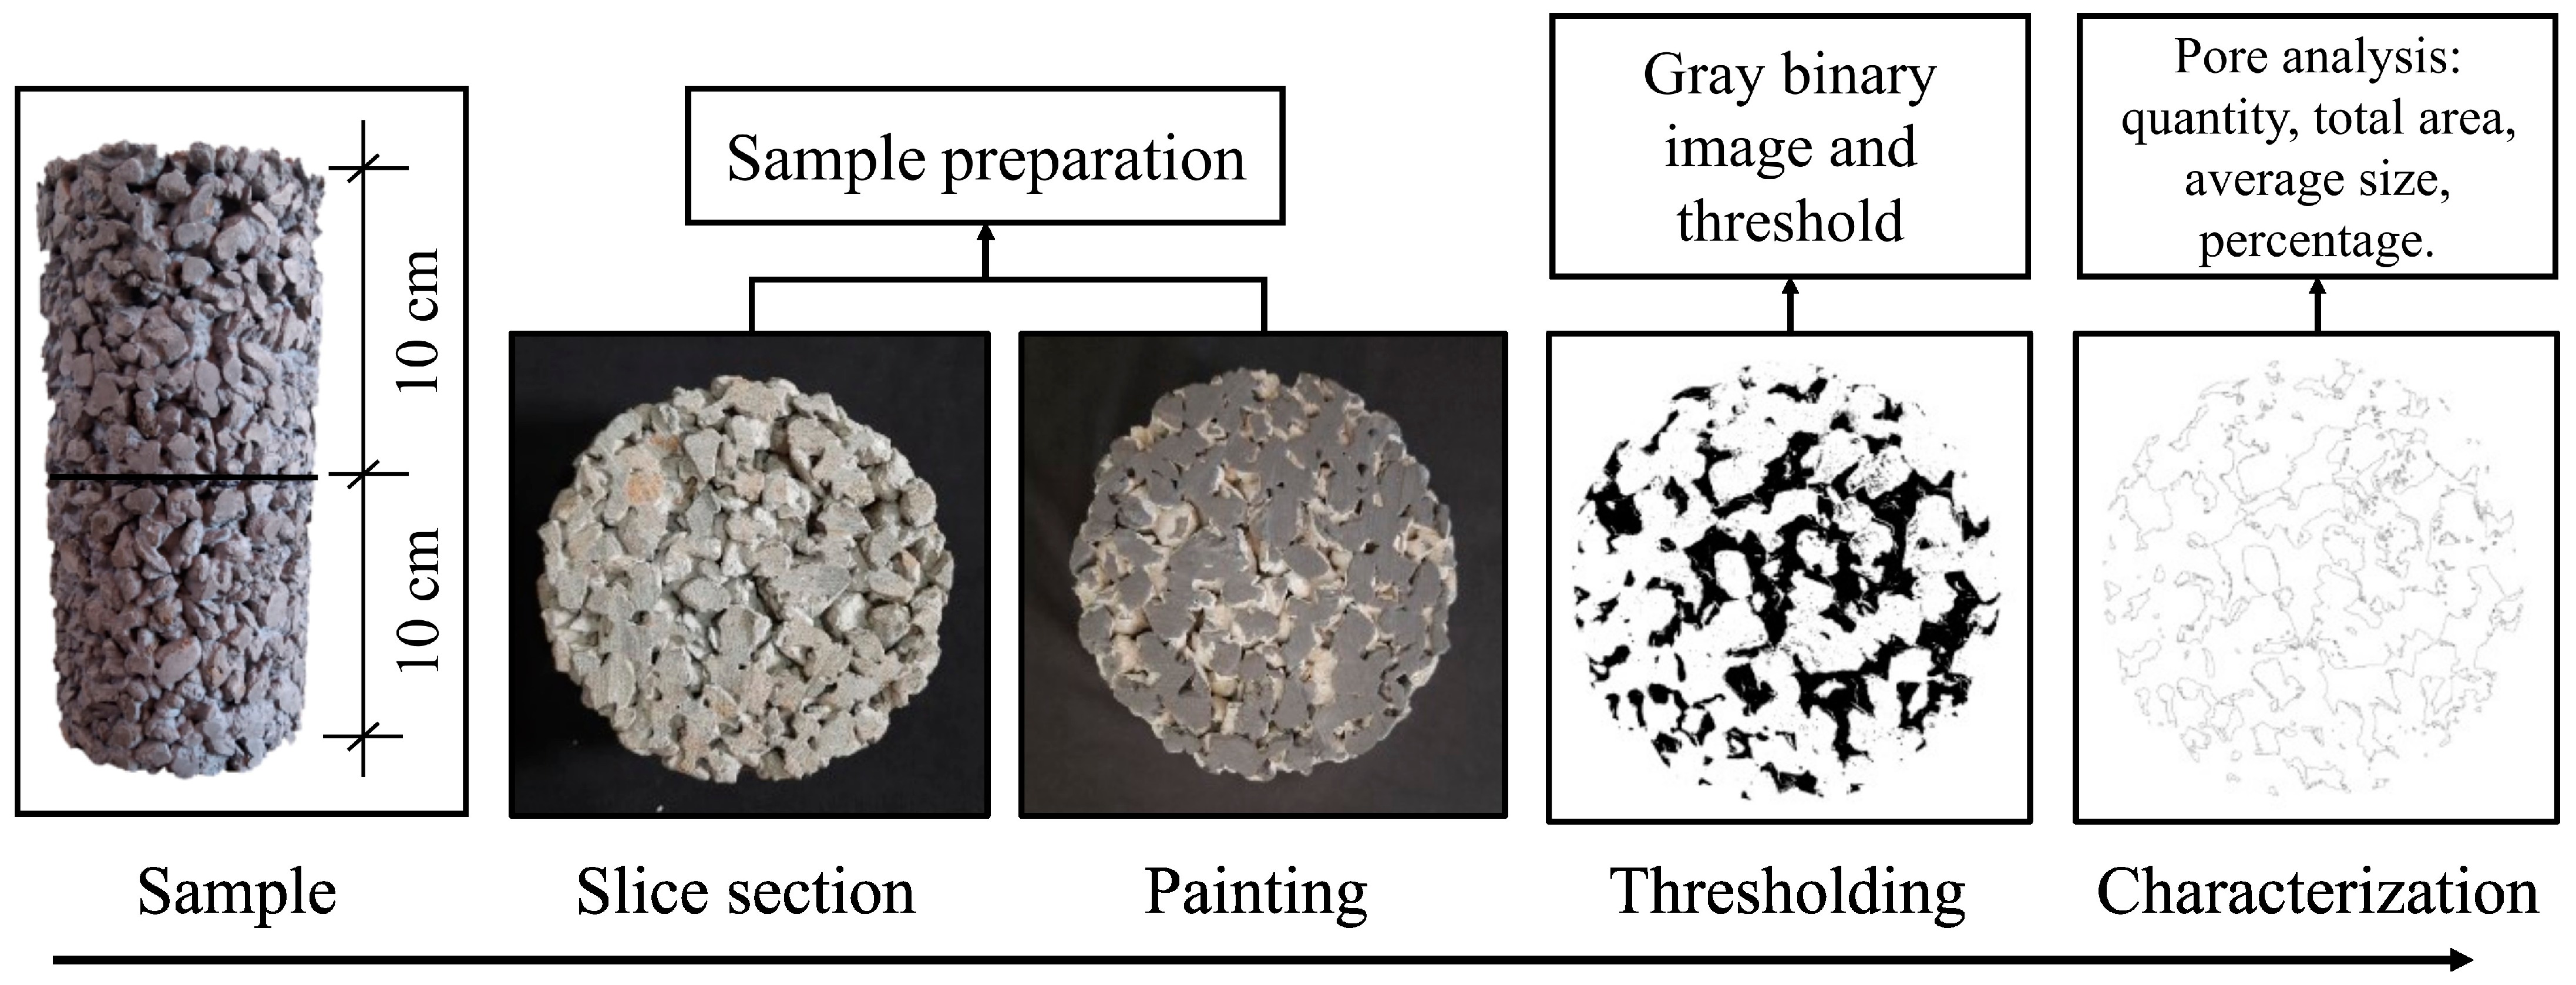
A digital image analysis is a powerful tool for obtaining detailed information about materials’ internal pore structure. The procedure described in Figure 4 involves half-sectioning specimens and painting each PC face to improve contrast. High-quality two-dimensional optical images are captured and then analyzed with the ImageJ software to determine parameters such as total porosity, total number of pores, average pore diameter and average pore area. This approach provides a more detailed understanding of the pore structure than traditional methods such as method ISO 17785-2 [32].

2.2.8. Correlations among Pervious Concrete Properties

Multiple regression is a statistical method used to explore the relation between a dependent variable and two independent variables or more by determining the coefficients that best fit the data [37]. In this study, a multiple regression analysis with a 95% confidence level was performed to investigate the relation between the compressive strength and impact resistance of PC and its physical properties, including density, porosity and aggregate size.
The model is expressed by Equation (5), where y represents the predicted values (compressive strength or impact resistance), x1, x2, x3, and xn denote the independent variables (density, porosity, aggregate size), and a1, a2, a3 refer to the regression coefficients. The model’s accuracy can be assessed by calculating the coefficient of determination (R-squared value), which measures the proportion of total variation in the dependent variable that can be explained by the independent variables. A higher R-squared value indicates the model’s better data fit.
y ( x 1 , x 2 , x 3 , x n ) = β 0 + a 1 × x 1 + a 2 × x 2 + a 3 × x 3 + + a n × x n

3. Results and Discussions

3.1. Aggregates Characterization and Packing Results

Three different narrow-sized aggregates, as well as their combination, were utilized in the study. Figure 5a,b depicts the morphological characteristics and the single-sized particle distributions, respectively. Table 4 outlines their physical properties. According to previous studies [38,39], a coefficient of uniformity below 2.0 is desirable for achieving higher porosity in PC. Of the tested aggregates, “B” and “C”, respectively, demonstrated coefficients of uniformity of 1.5 and 1.4, which indicate a narrow particles range. However, aggregate “A” displayed a coefficient of 2.4, which suggests a slightly wider particle size range.
The results obtained from the maximum density methodology for the evaluated aggregates are presented in Figure 5c. The maximum unit weight was achieved when 50% of aggregate “A” was substituted for “B”, which resulted in a 10.7% increase in unit weight compared to employing aggregate “B” alone. This outcome can be explained by the smaller particle size and higher coefficient of uniformity exhibited by aggregate “A”, which can significantly broaden particle size distribution when combined with “B”.
With the packed aggregate “BC”, optimal replacement was determined as 40% of aggregate “B”. This resulted in a density of 1762.2 kg/m3, which corresponds to a 4.1% increase in unit weight compared to using aggregate “C” alone. To produce the packed aggregate “ABC”, 60% of aggregate “C”, 20% of “B”, and 20% of “A” were mixed in line with the results previously obtained for “BC” and “AB”. This combination gave a density of 1835.8 kg/m3, which represents an 8.9% increase in the unit weight compared to using aggregate “C” alone. Table 4 presents the physical parameters for the packed aggregates.

3.2. Pervious Concrete Properties

3.2.1. Porosity and Density

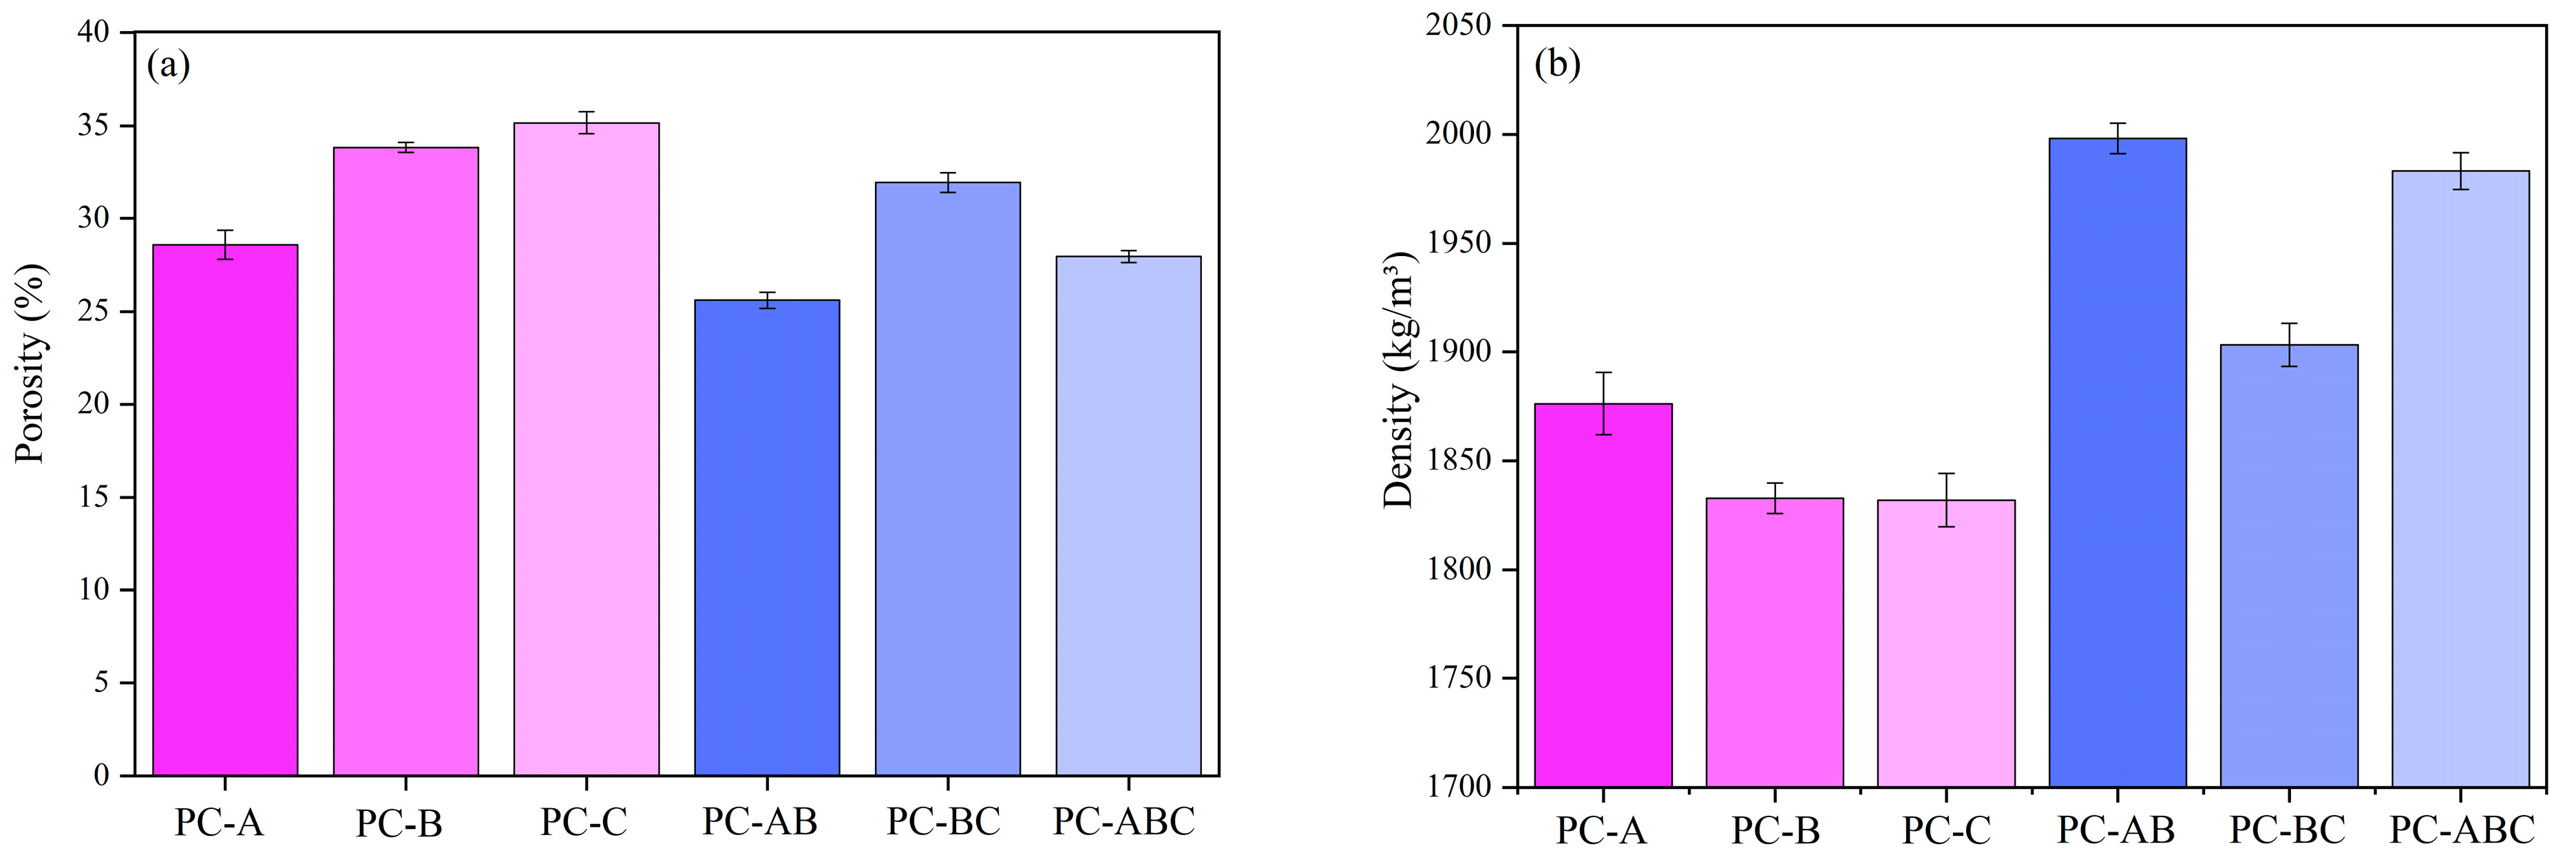
Figure 6a,b displays the porosity and density of all the produced PCs. An increase in porosity and a decrease in density took place in the PCs containing only a narrow-sized aggregate (A, B, or C) when aggregate size was increased. In contrast, PC-A, which was prepared with aggregate “A”, had lower porosity and higher density, likely because its unit weight and coefficient of uniformity values were, respectively, higher. Additionally, previous research has indicated that smaller coarse aggregates generally lead to denser and less porous PCs [21].
Despite having different size range distributions, PC-B and PC-C obtained similar porosity and density values (roughly 34% and 1830 kg/m3, respectively). This result can be attributed to the presence of the comparable voids content and unit weight of aggregates, which are the predominant factors that influence PCs’ porosity and density [40].
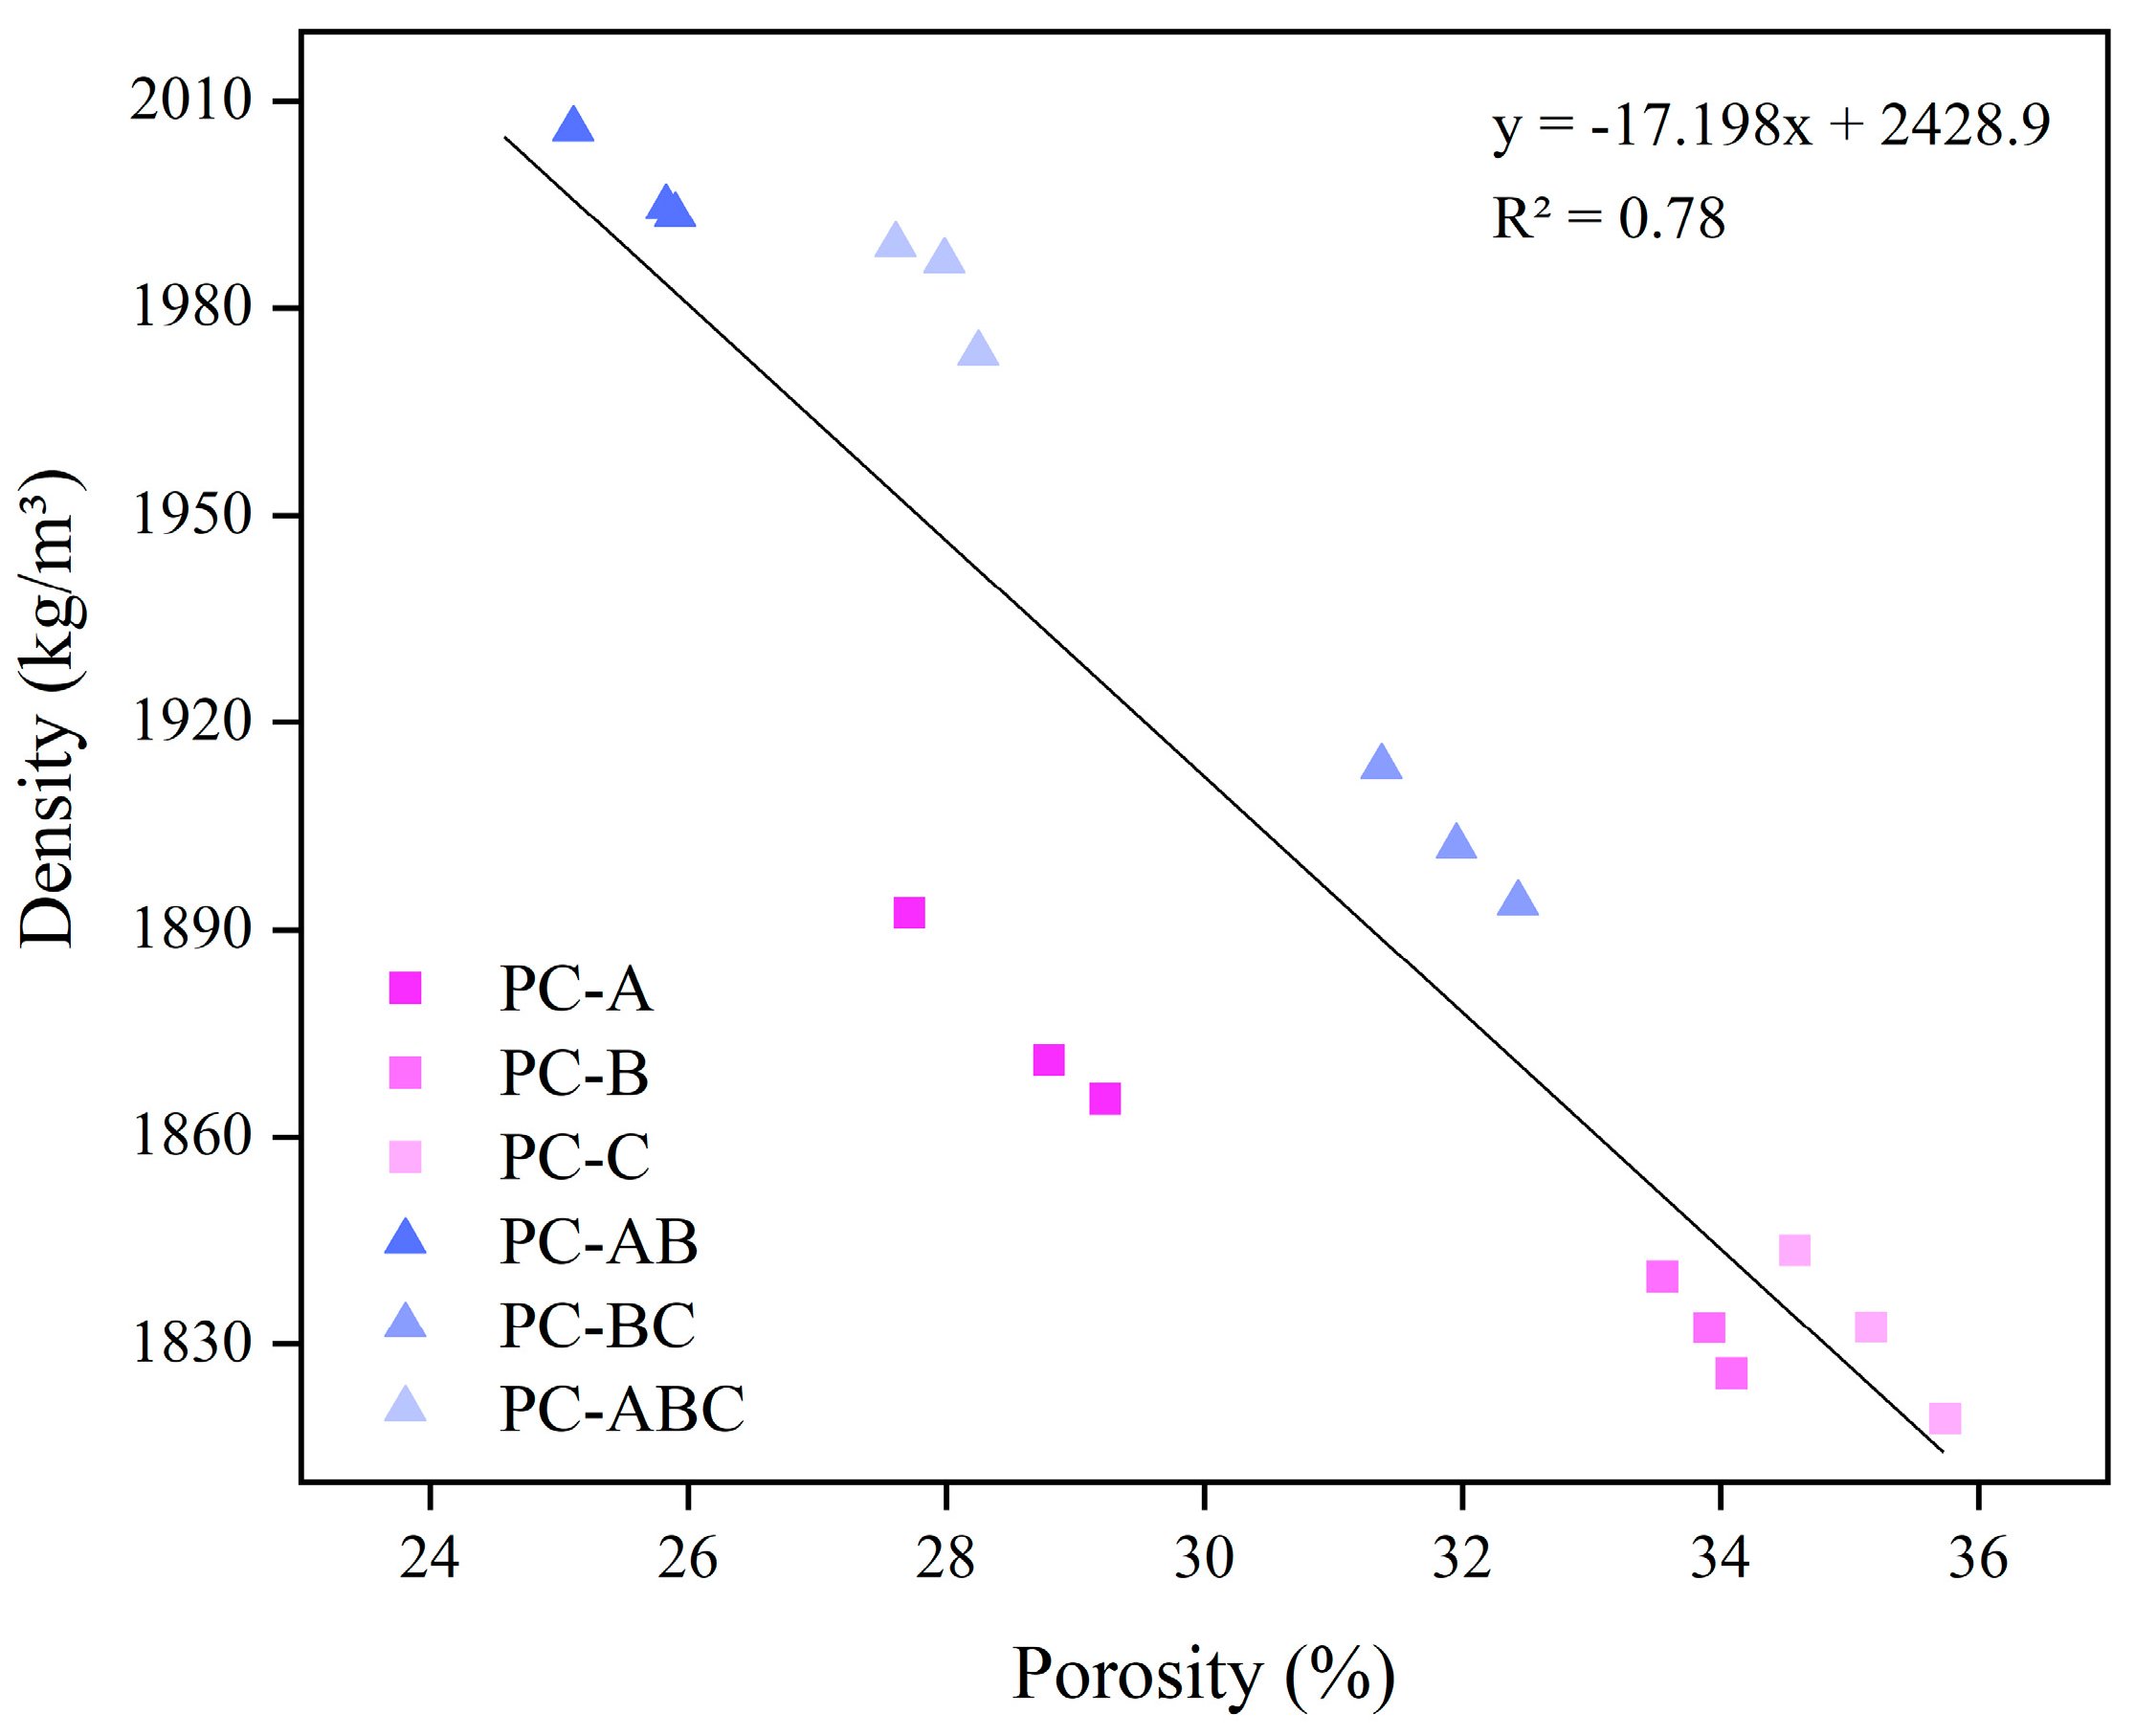
The maximum density methodology was applied to combine aggregates, and resulted in PC’s decreased total porosity and increased density. The incorporation of aggregate A with aggregate B (PC-AB) reduced total porosity by 24.3% and increased density by 9.0% compared to the mixture created solely with aggregate B. Similarly, the combination of aggregate B with C (PC-BC) reduced porosity by 9.2% and increased density by 3.9% compared to the concretes created only with aggregate C. The inclusion of aggregate A (PC-ABC) further enhanced the particles packing of aggregate C, reduced porosity by 20.5% and increased density by 8.3% compared to PC-C. These findings are consistent with the literature, which reports porosity ranging from 25.6% to 31.9% and density falling within the 1903.2 kg/m3 to 1998.0 kg/m3 range [7,12,35]. Wu [25] obtained similar results, with a reduction in porosity from 13.9% to 35.7% by combining basalt aggregates (2–5 mm) with steel slag aggregates (1–2 mm). Figure 7 presents the correlation between density and porosity, where a good correlation was obtained (R2 = 0.78).

3.2.2. Infiltration Rate

The results of the hydraulic conductivity tests for the infiltration rate are presented in Figure 8. Standard NBR 16416 [41] states that the minimum infiltration rate for PC should be 0.1 cm/s if used for paving. The infiltration rate for the PC created with narrow-sized aggregates (PC-A, PC-B, and PC-C) ranged from 0.46 to 2.62 cm/s. Coarser narrow-sized aggregates led to higher infiltration rates due to the presence of larger interconnected pores [9,42]. Conversely, smaller coarse aggregates tend to decrease PC’s drainage capacity by creating smaller pores, which impede water flow [20,43]. Yu et al. [43] found that the number of seepage flow paths lowered and became thinner in a PC created with smaller aggregates, which led to reduced hydraulic efficiency.
As expected, the narrow-sized aggregates combination resulted in a lower infiltration rate. PC-AB had the lowest infiltration rate (0.43 cm/s) of all the assessed PCs, which is a reduction of 67.6% compared to PC-B. The reduction of PC-BC was 36.3% compared to PC-C. It is interesting to note that the PCs created with two packed aggregates had a similar infiltration rate to those prepared with smaller sized aggregates. Only PC-ABC had a higher infiltration rate compared to the PC created with the smallest aggregate (PC-A). The decrease observed in the infiltration rate was similar to that reported by other authors, who combined smaller sized aggregates (10–94%) [2,26,28]. In all cases, however, the observed reduction in the infiltration rate did not block the seepage flow. Samples met the minimum requirements set out by the standard and the data found in the literature [14,44].

3.2.3. Compressive Strength and Drop-Weight Impact Resistance

The results of the 28-day compressive strength tests of the PC made with different aggregate sizes are presented in Figure 9a. Of the mixtures prepared with narrow-sized aggregates, PC-A exhibited the highest compressive strength. In contrast, PC-B and PC-C mixtures obtained a reduction of 23.8% and 32.6%, respectively, compared to PC-A. The heavier unit weight and the lower aggregate A porosity likely contributed to better compressive strength. It is noteworthy that using a coarser aggregate led to lower compressive strength, as reported by previous studies [9,15]. This trend could be attributed to smaller aggregates’ larger surface area, which creates more binder bonds in the internal structure, thus improving compressive strength [20].
Employing combined aggregates in PC resulted in a significantly improved compressive strength compared to the PCs made solely with narrow-sized coarse aggregates. Specifically, a 74.4% increase was observed for the PC-AB mix compared to PC-B. A slight increase of 16.4% was also recorded for the PC-BC mix compared to PC-C. When the smallest particle size aggregate was combined in the PC-ABC mix, the increase in compressive strength was 81.2%, and the resulting compressive strength was 16.76 MPa, which came very close to that of the PC-AB mix. Increased compressive strength can be attributed to greater aggregates packing, which densifies concrete. Although the literature reports that combinations of aggregates can either reduce or increase compressive strength depending on the amount of each aggregate to be incorporated, the increase herein observed is consistent with other reported values that range from 14.3 to 18.4 MPa (yielding increments up to 150%) [2,24,25]. It is important to note that no harmful reduction in the infiltration rate took place, which suggests that enhanced PC could be produced by combining narrow-sized aggregates with the maximum density methodology.
Figure 9b illustrates the influence of aggregate size on PC’s impact energy for hexagonal-shaped samples. For narrow-sized aggregates, an increase in aggregate size is associated with a slight decrease in impact energy: PC-A, PC-B and PC-C required 144.7 J, 141.2 J, and 117.1 J, respectively. However, the combination of two narrow-sized aggregates significantly increased impact resistance. The PC-AB mix required 227.3 J for rupture, which represents a 61.0% increase compared to PC-B. Similarly the PC-BC mix required 141.2 J, a 20.6% increase compared to the PC-C mix. The incorporation of the finer narrow-sized aggregate “A” resulted in a more significant increment in impact resistance with energy rising to 189.4 J in the PC-ABC mixture, which is the equivalent to a 61.8% increase compared to the PC-C mix. This may be due to the presence of finer aggregates, which promote enhanced bridging connections and support greater impact energy. Although there is a gap in the literature about applying impact resistance tests in PC, the results of this study came close to those obtained by Mastali and Dalvad [45] in self-compacting concrete reinforced with 1.25% recycled carbon fiber-reinforced polymer, with maximum absorbed energy to the first and ultimate crack impact resistance of 223 J and 293 J, respectively.
The combination of aggregates in PC leads to a significant increase in both compressive strength and impact resistance. The smallest aggregate’s packing ability is more efficient in improving mechanical properties by being more effective in filling pores [25]. Therefore, the packaging methodology can be a useful tool for optimizing aggregate mixtures to obtain more resistant PC mixes without having to resort to trial-and-error testing.

3.2.4. Pore Structure Characterization by Digital Image Analyses

In addition to total porosity, analyzing the pore structure can provide valuable insights into the behavior of the materials used in mixtures and how they influence PC properties [17,46]. In this study, two-dimensional optical images were used to determine the total porosity, average diameter and pore area for the various evaluated mix proportions. The digitized and thresholded images of samples appear in Figure 10.
The total porosity obtained through the digital image analysis can be compared to the value calculated according to ISO 17785-2 [32]. Both results are presented in Figure 11, and a similar trend and a linear fit with an R2 of 0.85 were obtained. These findings are consistent with previous research by Chandrappa and Biligiri [11], who reported similar results.
Table 5 presents the pore structure analysis results obtained with image analysis software. Employing coarser aggregates in PC resulted in a small number of total pores in a slice section compared to the finer aggregate, which ranged from 61 to 263 pores. This trend is consistent with the findings of Sumanasooriya and Neithalath [47] for recycled aggregates. Furthermore, the average pore diameter and pore area also reduced when finer aggregates were used, and PC-A obtained values of 2.52 mm and 7.39 mm2, respectively, which represent 61.7% and 18.4% of the values for PC-C. The smaller pore diameters in PC-A and their lesser connectivity were responsible for the lower infiltration rate compared to PC-C [20,47].
The packing methodology had a notable impact on the PC pore structure. PC-AB showed an increased number of pores compared to PC-B, which ranged from 89 to 144. However, the average pore diameter and pore area decreased from 3.45 to 3.03 mm and from 25.79 to 13.45 mm2, respectively. These results represent a reduction of 12.2% and 47.8% in the average pore diameter and average pore area, respectively.
When comparing PC-BC to PC-C, no difference in the total number of pores and average pore diameter was seen. However, the average pore area showed a reduction of 16.6% due to the fine aggregates filling the voids of coarser aggregates during the packing process. This reduction in pore area is supported by the lower total porosity obtained for PC-BC vs. PC-C using ISO 17785-2 (see Figure 11) [32].
PC-ABC had a larger total number of pores than PC-C (77 vs. 61). However, the reductions in the average pore diameter and average pore area were 11.5% and 34.0%, respectively, which indicate pore structure refinement. This result explains the lower infiltration rate and the increase in the mechanical properties of the PCs with a combination of aggregates. The packing process provided by the finer aggregate combined with the larger particles reduced pores, as herein observed and by other authors [20,43].

3.3. Correlations among Pervious Concrete Properties

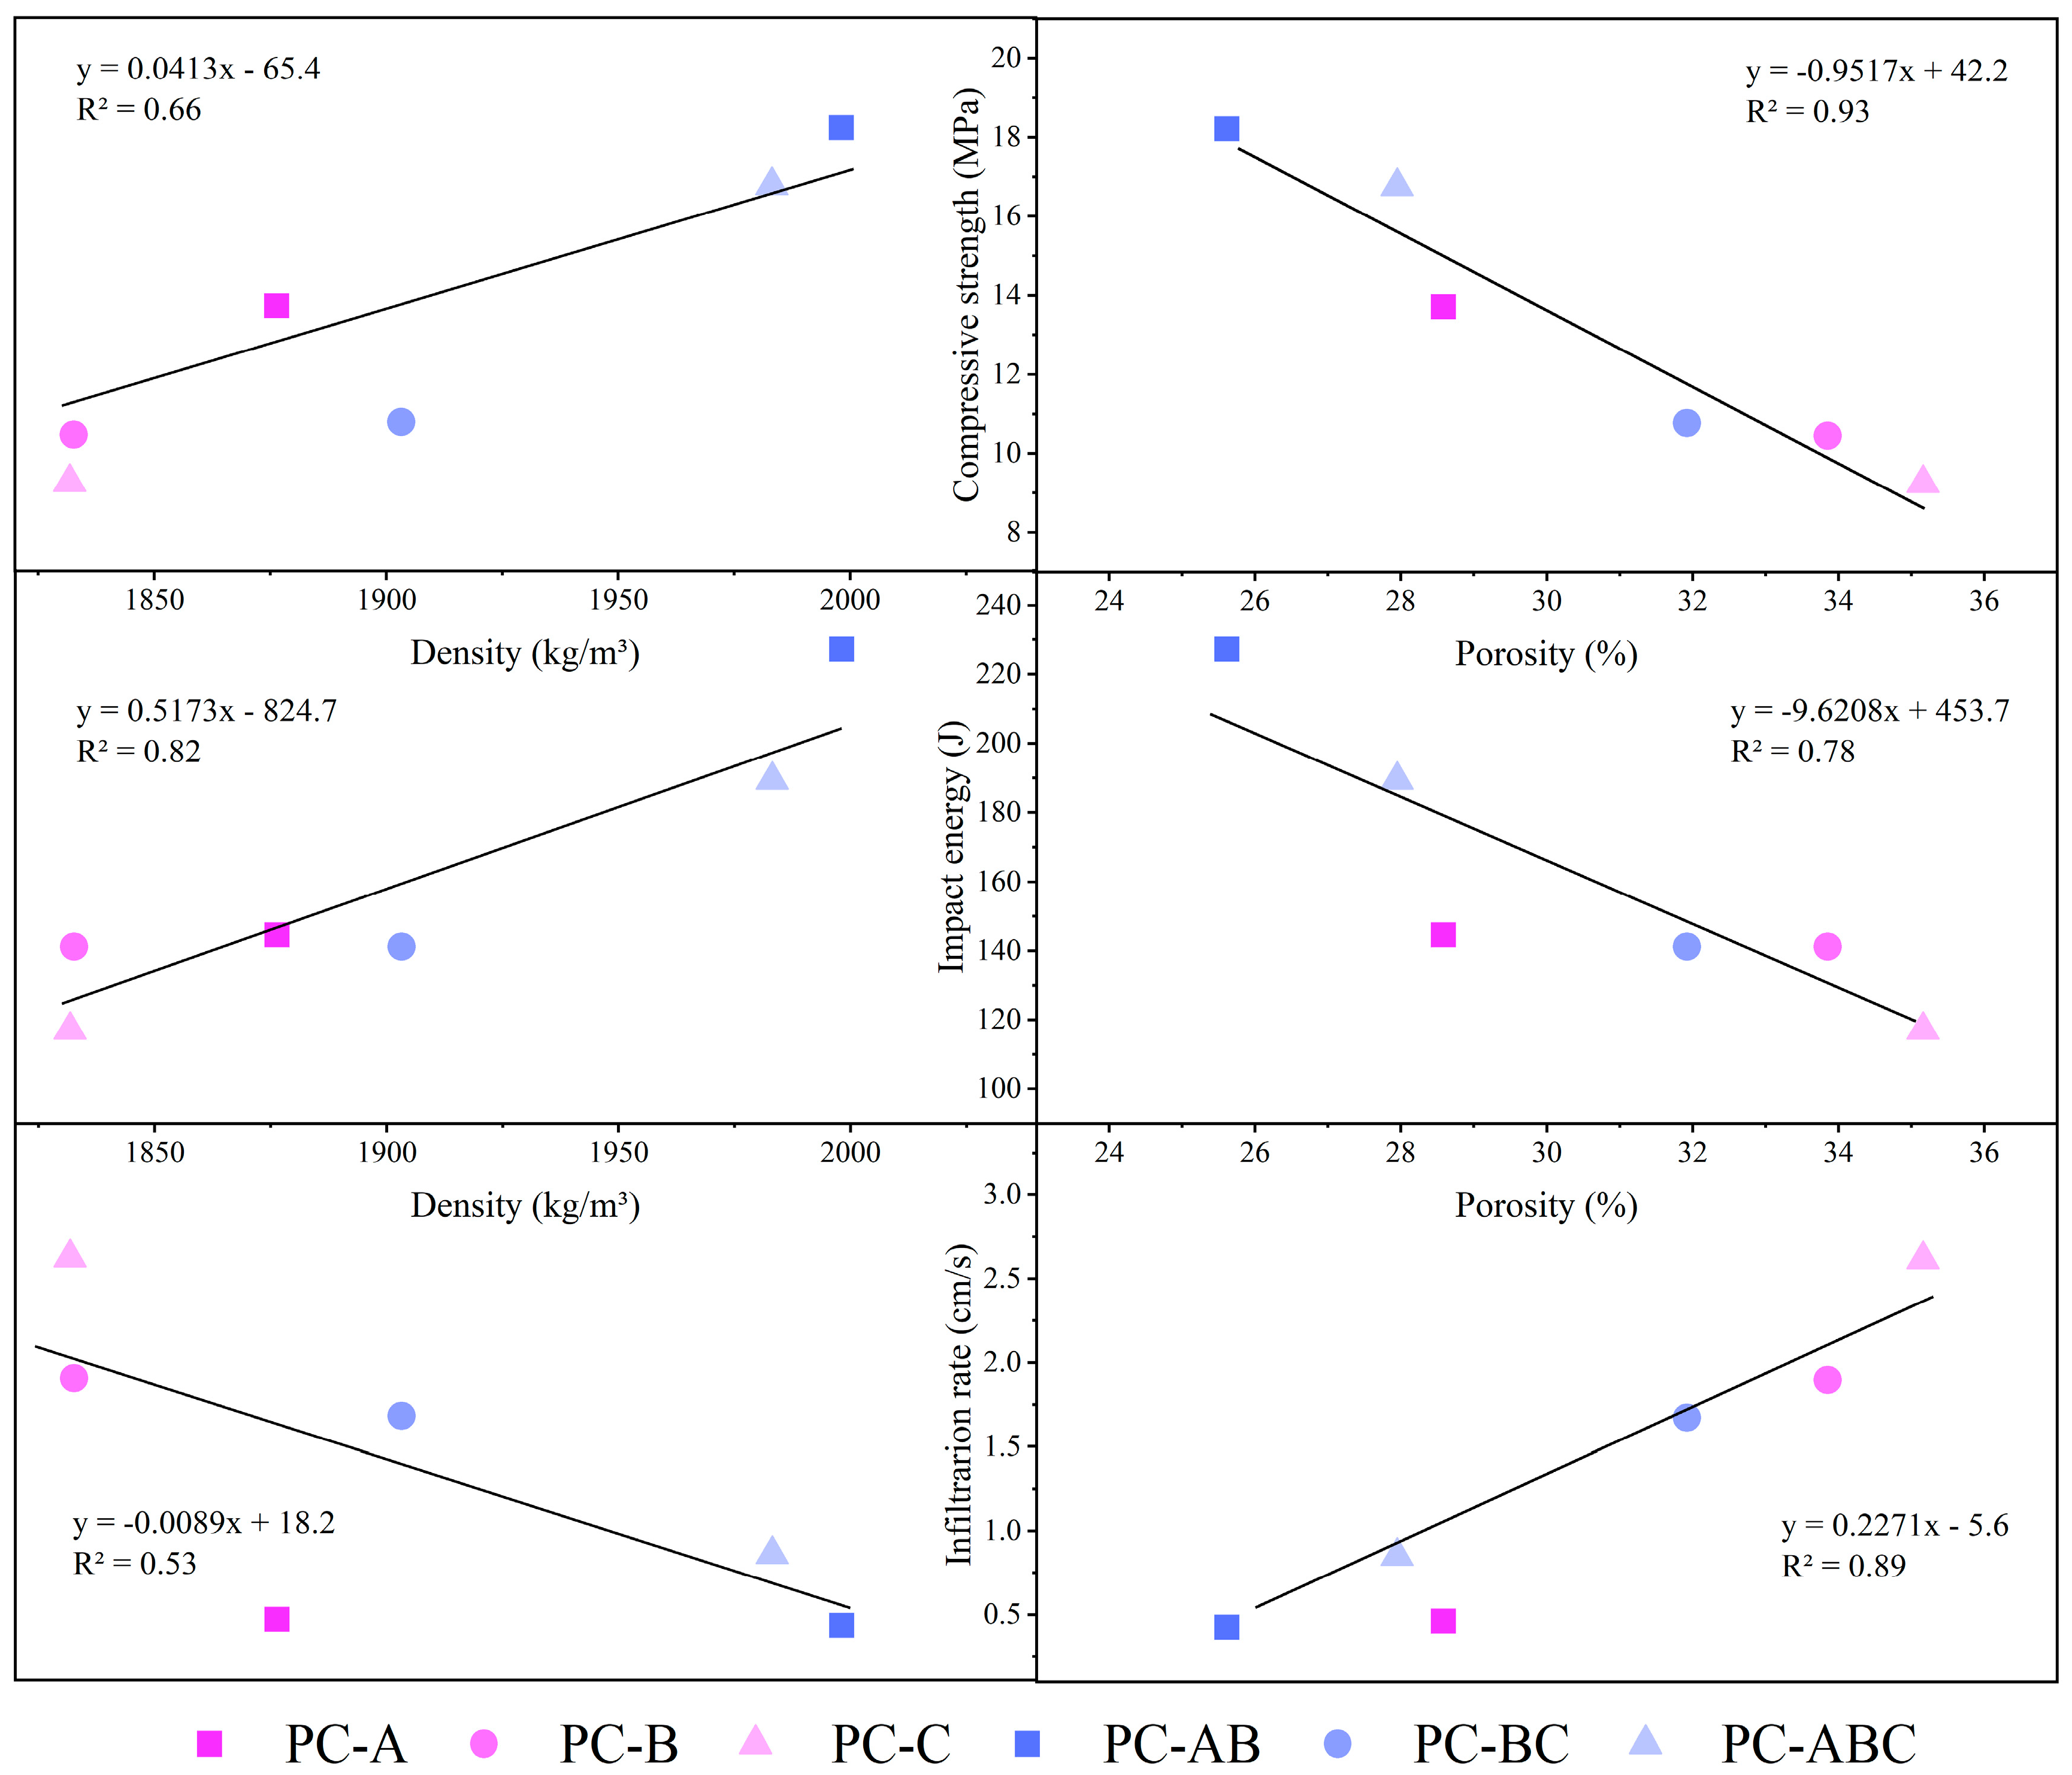
The relation among PCs’ density, porosity, infiltration rate and mechanical properties is generally linear or exponential [16,18,22]. Figure 12 illustrates the relation among compressive strength, impact energy and infiltration rate concerning the density and porosity of the PC mixtures for which different sized aggregates were used.
The compressive strength showed a linear increase with rising density and a decrease with increasing porosity (R2 = 0.66 and R2 = 0.93, respectively). The impact energy for rupture exhibited similar behavior when related to density (R2 = 0.82) and porosity (R2 = 0.78). Conversely for the infiltration rate, an increase in density and a decrease in porosity gave a lower infiltration rate (R2 = 0.53 and R2 = 0.89, respectively). These findings agree with the literature [9,15,19,48], and suggest a close relation between the infiltration rate and porosity.
A multiple regression model (using 18 experimental data) was conducted using a statistical program (Statgraphics Centurion) to establish the correlation among compressive strength, impact energy, density, porosity and aggregate size. With the linear regression model (Equation (5)), this analysis identified the parameters (density, porosity, aggregate size) that most significantly affected the assessed PC mixtures’ compressive strength and impact energy.
Table 6 summarizes the coefficients obtained for a1 (density), a2 (porosity), a3 (aggregate size) and β0 (interception), the p-values significance, and an analysis of variance (ANOVA) at the 95% confidence level. According to the ANOVA, there was a statistically significant relation between the assessed parameters (p-value < 0.05). The multiple regression model for compressive strength showed that density was the most crucial parameter to affect PC’s compressive strength (p-value 0.014). However, aggregate size was also a variable with a strong influence in the regression model (p-value 0.056). For impact energy, all the variables strongly impacted the regression model with p-values below 0.05. Although all the variables were influential, density and aggregate size were the prominent influencers. For both compressive strength and impact resistance, density was the main influencing variable, followed by aggregate size.
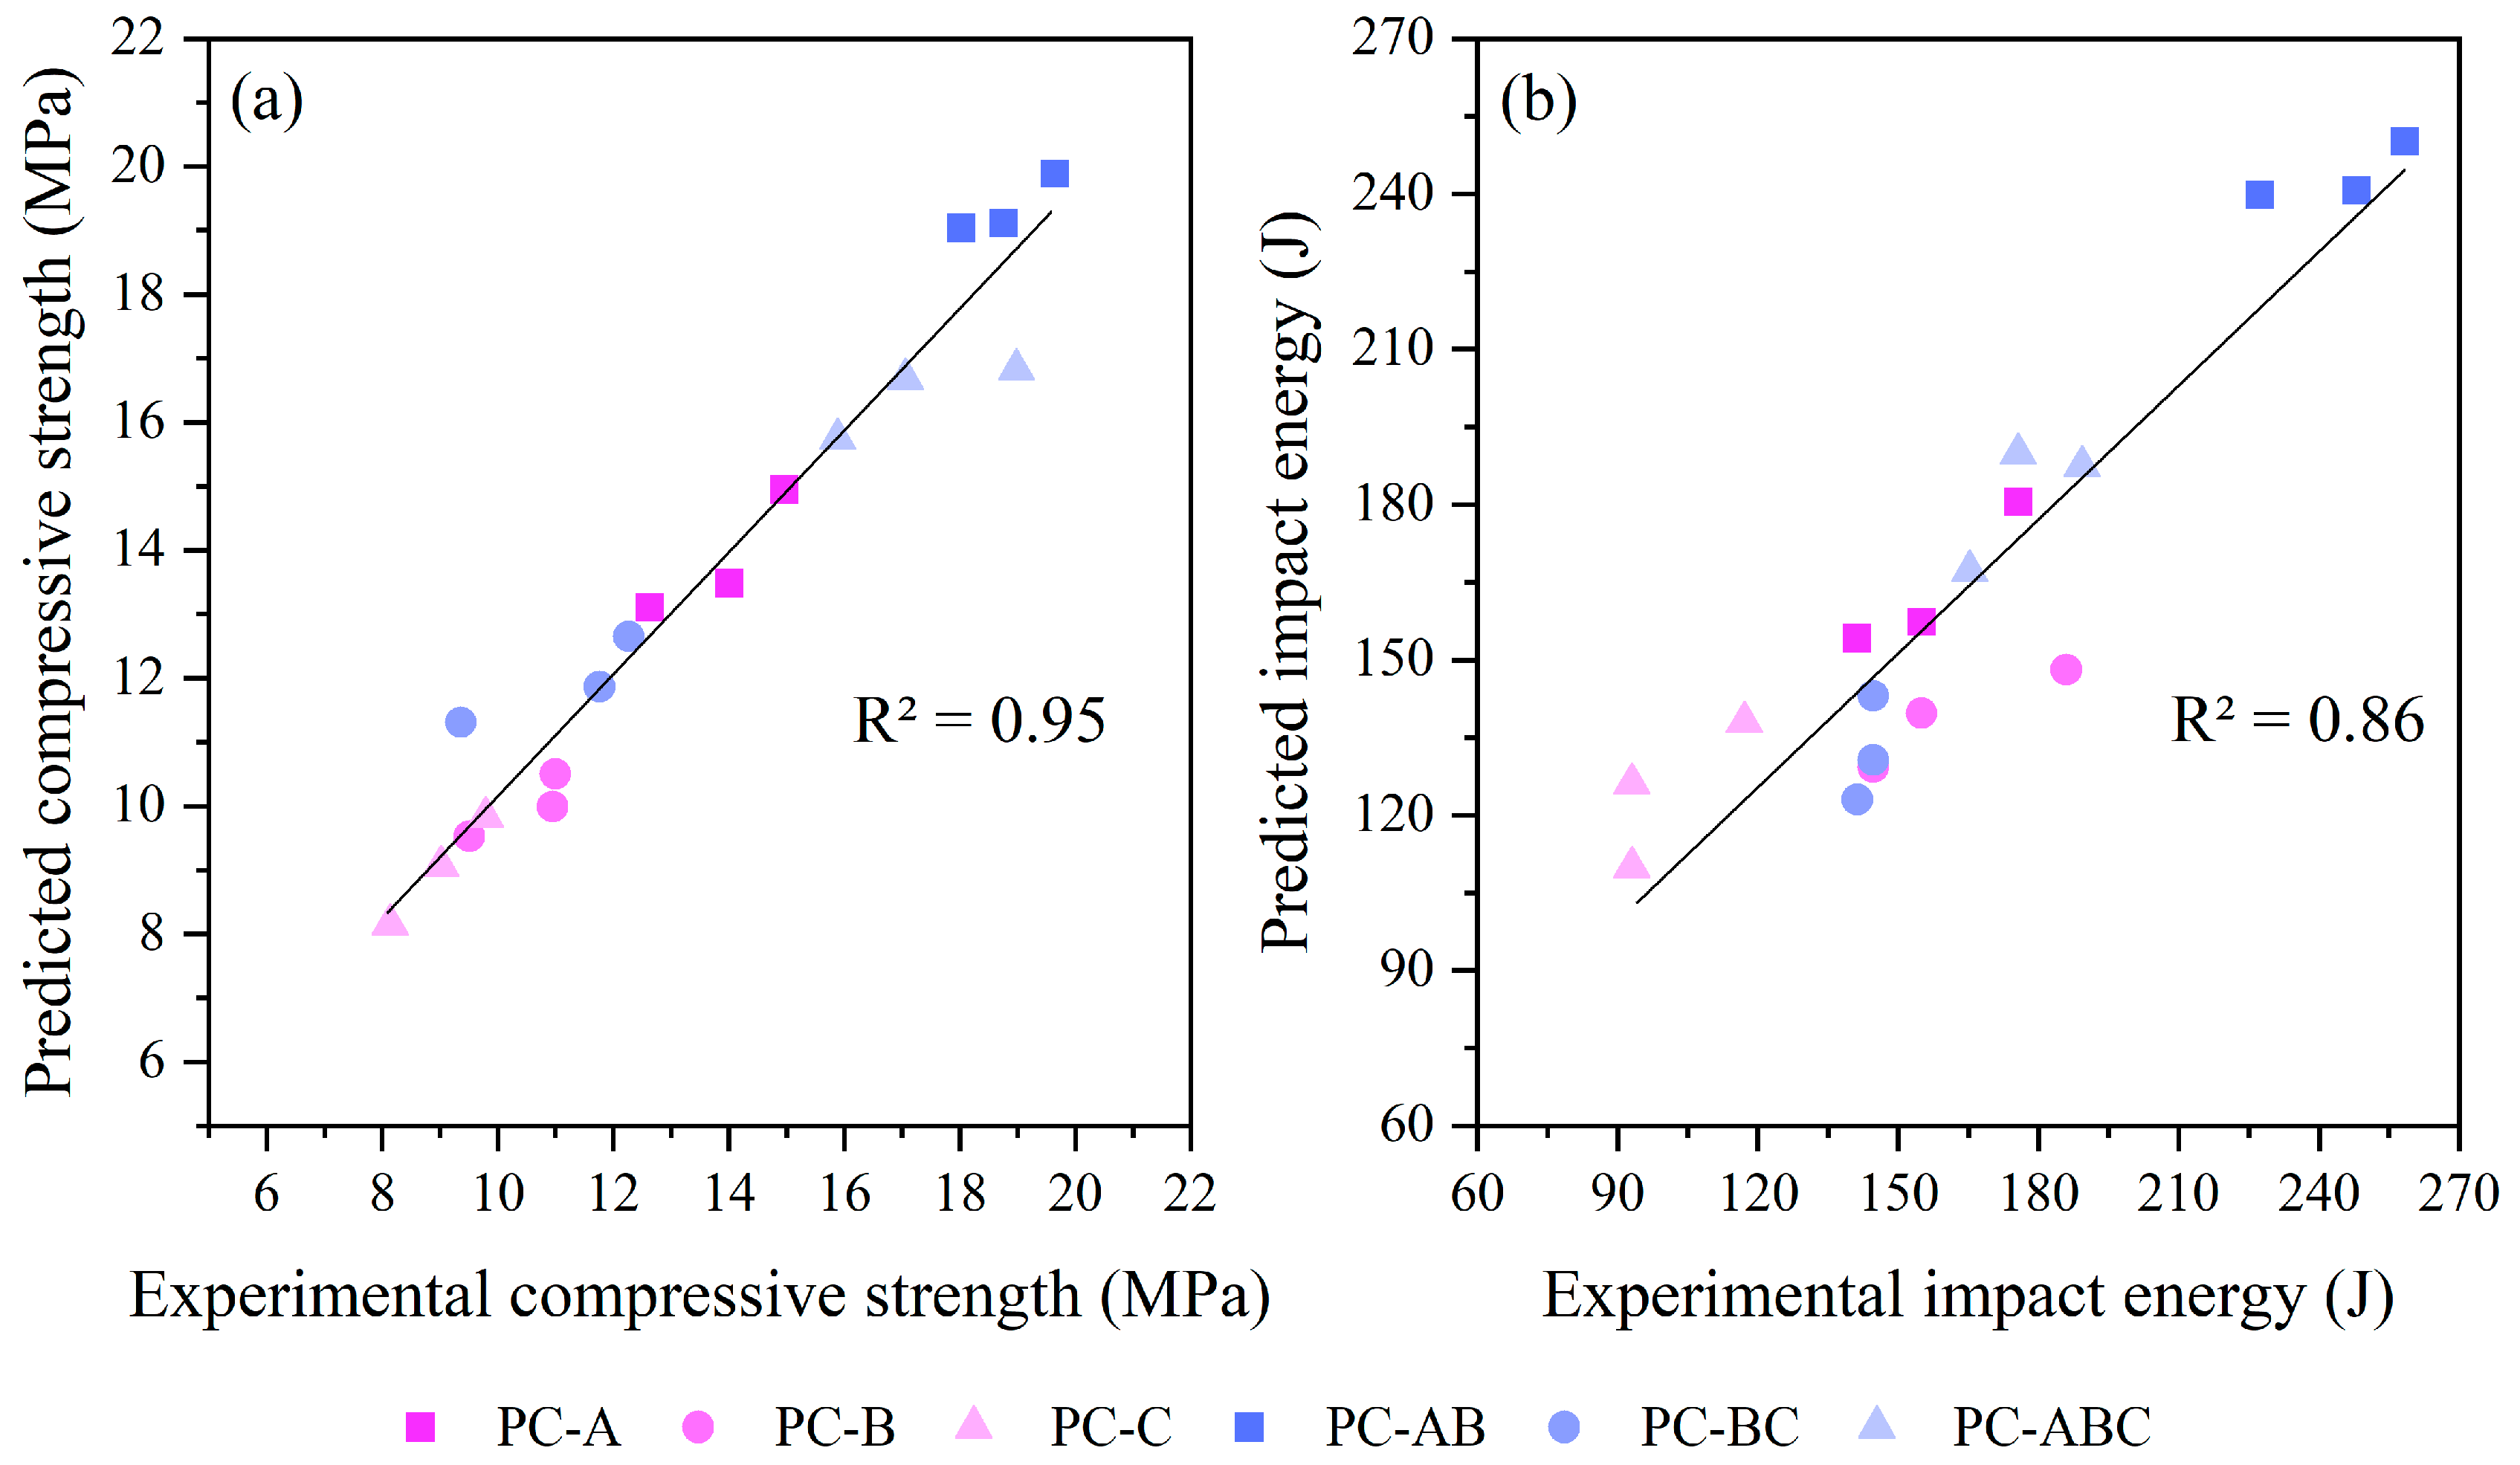
The predicted compressive strength and impact resistance values were compared to the obtained experimental data. The results are shown in Figure 13. Both models exhibited a strong linear correlation between the predicted and experimental values, with R2 = 0.95 for compressive strength and R2 = 0.86 for impact strength, which indicate a good fit.
The conducted tests and the statistical analysis confirmed that aggregate size significantly impacted PC samples’ mechanical properties. Optimizing the aggregate combination is, thus, an effective way to enhance PC’s mechanical properties. The proposed methodology provides a simple approach for combining aggregates, which reduces both time consumption and consumed resources. Therefore, its application can be an efficient and effective means to obtain desired mechanical PC properties.

4. Conclusions

By following the maximum density methodology, this study aimed to investigate how packing aggregates could improve PC’s properties by making it more efficient and sustainable. The experimental results led to the following conclusions:
-
Aggregate size directly impacts PC’s properties. Packing smaller aggregates makes concrete denser by reducing its porosity by up to 24.3%.
-
Aggregate size and porosity both affect the infiltration rate, with smaller aggregates leading to lower infiltration rates due to narrower seepage flow paths and more efficient pore filling when packed with larger aggregates. However, even the lowest infiltration rate (0.43 cm/s) meets the recommendations that appear in the literature.
-
Employing smaller aggregates tends to increase mechanical PC properties. Both compressive strength and impact resistance improve with smaller packed aggregates. The statistical analysis shows that density and aggregate size are the primary parameters that influence mechanical properties.
-
Using smaller aggregates increases the total number of pores, but reduces both the average pore diameter and the average pore area, as observed with the image analysis.
The proposed methodology can be beneficial for designing denser PC by efficiently combining aggregates. This can be useful in certain applications, such as pavement design, which requires improved mechanical properties, or in adsorptive processes for pollutant removal via slow drainage in PC. Moreover, this methodology simplifies the mix design process by reducing the need for trial-and-error methods to achieve efficient PC mixtures. As a result, fewer resources are consumed, which makes PC more sustainable and environment-friendly.

Author Contributions

Conceptualization—K.H.A., R.G.d.S., M.V.B., J.M. and J.L.A.; methodology—K.H.A., R.G.d.S., J.P. and M.M.T.; software—K.H.A., R.G.d.S., L.S. and M.M.T.; validation—K.H.A., R.G.d.S., L.S., M.V.B., J.M., J.P. and M.M.T.; formal analysis—K.H.A., R.G.d.S., L.S., J.P. and M.M.T.; investigation—K.H.A., R.G.d.S., L.S. and M.M.T.; resources—M.M.T. and J.L.A.; writing—original draft preparation—K.H.A., R.G.d.S., L.S., M.V.B., J.M., J.P. and M.M.T.; writing—review and editing—K.H.A., R.G.d.S., L.S., J.P., M.M.T. and J.L.A.; visualization—K.H.A., R.G.d.S., L.S., J.P., M.M.T. and J.L.A.; supervision, J.P., M.M.T. and J.L.A.; project administration—M.M.T. and J.L.A. All authors have read and agreed to the published version of the manuscript.

Funding

Coordenação de Aperfeiçoamento de Pessoal de Nível Superior—Brasil (CAPES—Finance Code 001 to CNPq—Conselho Nacional de Desenvolvimento Científico e Tecnológico—Brasil, and to European Union-Next generation for the grant “María Zambrano for attraction of international talent” of M.M. Tashima.

Data Availability Statement

Not applicable.

Acknowledgments

The authors would like to acknowledge Mineração Grandes Lagoas Ltd.a by supplying the basaltic aggregates. In the same way, authors would like to acknowledge Coordenação de Aperfeiçoamento de Pessoal de Nível Superior—Brasil (CAPES—Finance Code 001 and, to CNPq—Conselho Nacional de Desenvolvimento Científico e Tecnológico—Brasil. Finally, M.M. Tashima wishes to thank the Spanish Ministry of Universities and the Universitat Politècnica de València for grant “María Zambrano for attraction of international talent” funded by European Union-Next generation.

Conflicts of Interest

The authors declare no conflict of interest.

Notations

PCpervious concrete
SSDsaturated-surface-dry
ODoven-dry
mdmass of oven-dried samples (kg)
msmass of samples submerged in bath (kg)
ρwdensity of water at the water bath temperature (kg/m3)
Vdspecimen’s volume (m3)
kinfiltration rate (cm/s)
ttime required for the water percolation (s)
Vvolume of water poured (cm3)
Aspecimen’s cross-sectional area (cm2)
IEimpact energy (J)
hdrop height (m)
msteel ball’s mass (kg)
ggravity constant (9.81 m/s2)

References

  1. Gartland, L. Heat Islands: Understanding and Mitigating Heat in Urban Areas, 1st ed.; Routledge: London, UK, 2010; pp. 2–22. [Google Scholar]
  2. Hung, V.V.; Seo, S.Y.; Kim, H.W.; Lee, G.C. Permeability and Strength of Pervious Concrete According to Aggregate Size and Blocking Material. Sustainability 2021, 13, 426. [Google Scholar] [CrossRef]
  3. Sandoval, G.F.B.; Galobardes, I.; Campos, A.; Toralles, B.M. Assessing the Phenomenon of Clogging of Pervious Concrete (Pc): Experimental Test and Model Proposition. J. Build. Eng. 2020, 29, 101203. [Google Scholar] [CrossRef]
  4. NRMCA. Pervious concrete: Guideline. Concrete in Practice—What, Why, How?—CIP 38; NRMCA: Silver Spring, MD, USA, 2004. [Google Scholar]
  5. Ferguson, B.K. Porous Pavements—Integrative Studies in Water Management and Land Development, 1st ed.; France, R.L., Ed.; Taylor & Francis: Boca Raton, FL, USA, 2005; ISBN 0-8493-2670-2. [Google Scholar]
  6. Li, V.C. High-Performance and Multifunctional Cement-Based Composite Material. Engineering 2019, 5, 250–260. [Google Scholar] [CrossRef]
  7. Tennis, P.D.; Leming, M.L.; Akers, D.J. Pervious Concrete Pavements; Portland Cement Association: Skokie, IL, USA; National Ready Mixed Concrete Association: Silver Spring, MD, USA, 2004. [Google Scholar]
  8. Wang, J.; Meng, Q.; Zhang, L.; Zhang, Y.; He, B.J.; Zheng, S.; Santamouris, M. Impacts of the Water Absorption Capability on the Evaporative Cooling Effect of Pervious Paving Materials. Build. Environ. 2019, 151, 187–197. [Google Scholar] [CrossRef]
  9. Xie, X.; Zhang, T.; Wang, C.; Yang, Y.; Bogush, A.; Khayrulina, E.; Huang, Z.; Wei, J.; Yu, Q. Mixture Proportion Design of Pervious Concrete Based on the Relationships between Fundamental Properties and Skeleton Structures. Cem. Concr. Compos. 2020, 113, 103693. [Google Scholar] [CrossRef]
  10. American Concrete Institute. ACI 522R-10 Report on Pervious Concrete; American Concrete Institute: Farmington Hills, MI, USA, 2011. [Google Scholar]
  11. Chandrappa, A.K.; Biligiri, K.P. Effect of Pore Structure on Fatigue of Pervious Concrete. Road Mater. Pavement Des. 2018, 14, 1525–1547. [Google Scholar] [CrossRef]
  12. Pereira da Costa, F.B.; Haselbach, L.M.; da Silva Filho, L.C.P. Pervious Concrete for Desired Porosity: Influence of w/c Ratio and a Rheology-Modifying Admixture. Constr. Build. Mater. 2020, 268, 121084. [Google Scholar] [CrossRef]
  13. Yap, S.P.; Chen, P.Z.C.; Goh, Y.; Ibrahim, H.A.; Mo, K.H.; Yuen, C.W. Characterization of Pervious Concrete with Blended Natural Aggregate and Recycled Concrete Aggregates. J. Clean. Prod. 2018, 181, 155–165. [Google Scholar] [CrossRef]
  14. Debnath, B.; Sarkar, P.P. Permeability Prediction and Pore Structure Feature of Pervious Concrete Using Brick as Aggregate. Constr. Build. Mater. 2019, 213, 643–651. [Google Scholar] [CrossRef]
  15. Ćosić, K.; Korat, L.; Ducman, V.; Netinger, I. Influence of Aggregate Type and Size on Properties of Pervious Concrete. Constr. Build. Mater. 2015, 78, 69–76. [Google Scholar] [CrossRef]
  16. Shen, P.; Zheng, H.; Liu, S.; Lu, J.X.; Poon, C.S. Development of High-Strength Pervious Concrete Incorporated with High Percentages of Waste Glass. Cem. Concr. Compos. 2020, 114, 103790. [Google Scholar] [CrossRef]
  17. Lori, A.R.; Hassani, A.; Sedghi, R. Investigating the Mechanical and Hydraulic Characteristics of Pervious Concrete Containing Copper Slag as Coarse Aggregate. Constr. Build. Mater. 2019, 197, 130–142. [Google Scholar] [CrossRef]
  18. Deo, O.; Neithalath, N. Compressive Response of Pervious Concretes Proportioned for Desired Porosities. Constr. Build. Mater. 2011, 25, 4181–4189. [Google Scholar] [CrossRef]
  19. Yu, F.; Sun, D.; Wang, J.; Hu, M. Influence of Aggregate Size on Compressive Strength of Pervious Concrete. Constr. Build. Mater. 2019, 209, 463–475. [Google Scholar] [CrossRef]
  20. Liu, R.; Liu, H.; Sha, F.; Yang, H.; Zhang, Q.; Shi, S.; Zheng, Z. Investigation of the Porosity Distribution, Permeability, and Mechanical Performance of Pervious Concretes. Processes 2018, 6, 78. [Google Scholar] [CrossRef] [Green Version]
  21. Ferić, K.; Kumar, V.S.; Romić, A.; Gotovac, H. Effect of Aggregate Size and Compaction on the Strength and Hydraulic Properties of Pervious Concrete. Sustainability 2023, 15, 1146. [Google Scholar] [CrossRef]
  22. Yahia, A.; Kabagire, K.D. New Approach to Proportion Pervious Concrete. Constr. Build. Mater. 2014, 62, 38–46. [Google Scholar] [CrossRef]
  23. Meddah, M.S.; Al-Jabri, K.; Hago, A.W.; Al-Hinai, A.S. Effect of Granular Fraction Combinations on Pervious Concrete Performance. Mater. Today Proc. 2017, 4, 9700–9704. [Google Scholar] [CrossRef]
  24. Huang, J.; Luo, Z.; Khan, M.B.E. Impact of Aggregate Type and Size and Mineral Admixtures on the Properties of Pervious Concrete: An Experimental Investigation. Constr. Build. Mater. 2020, 265, 120759. [Google Scholar] [CrossRef]
  25. Wu, F.; Yu, Q.; Brouwers, H.J.H. Mechanical, Absorptive and Freeze–Thaw Properties of Pervious Concrete Applying a Bimodal Aggregate Packing Model. Constr. Build. Mater. 2022, 333, 127445. [Google Scholar] [CrossRef]
  26. Neithalath, N.; Sumanasooriya, M.S.; Deo, O. Characterizing Pore Volume, Sizes, and Connectivity in Pervious Concretes for Permeability Prediction. Mater. Charact. 2010, 61, 802–813. [Google Scholar] [CrossRef]
  27. O’Reilly, D.V. Método de Dosagem de Concreto de Elevado Desempenho, 1st ed.; PINI: São Paulo, Brazil, 1998. [Google Scholar]
  28. Associação Brasileira de Normas Técnicas. NBR 16697—Portland Cement—Requirements; Associação Brasileira de Normas Técnicas: Rio de Janeiro, Brazil, 2018. [Google Scholar]
  29. ASTM C150; Standard Specification for Portland Cement. ASTM International: West Conshohocken, PA, USA, 2022.
  30. ASTM C127; Standard Test Method for Density, Relative Density (Specific Gravity), and Absorption of Coarse Aggregate. ASTM International: West Conshohocken, PA, USA, 2015.
  31. ASTM C29/C29M-09; Standard Test Method for Test Method for Bulk Density (“Unit Weight”) and Voids in Aggregate. ASTM International: West Conshohocken, PA, USA, 2009.
  32. ISO 17785-2; Testing Methods for Pervious Concrete—Part 2: Density and Void Content. International Organization for Standardization: Vernier, Geneva, 2018.
  33. ISO/DIS 17785-1; International Organization for Standardization—Test Methods for Pervious Concrete—Part 1: Infiltration Rate. Chiswick: London, UK, 2014.
  34. NBR 5739; Associação Brasileira de Normas Técnicas—Concrete—Compression Test of Cylindrical Specimens. Associação Brasileira de Normas Técnicas: Rio de Janeiro, RJ, Brazil, 2018.
  35. Rossignolo, J.A. Concreto Leve de Alto Desempenho Modificado Com SB Para Pré-Fabricados Esbeltos—Dosagem, Produção, Propriedades e Microestrutura. Ph.D. Thesis, São Paulo University, São Paulo, Brazil, 2003. [Google Scholar]
  36. Abid, S.R.; Abdul Hussein, M.L.; Ali, S.H.; Kazem, A.F. Suggested Modified Testing Techniques to the ACI 544-R Repeated Drop-Weight Impact Test. Constr. Build. Mater. 2020, 244, 118321. [Google Scholar] [CrossRef]
  37. Rajakarunakaran, S.A.; Lourdu, A.R.; Muthusamy, S.; Panchal, H.; Jawad Alrubaie, A.; Musa Jaber, M.; Ali, M.H.; Tlili, I.; Maseleno, A.; Majdi, A.; et al. Prediction of Strength and Analysis in Self-Compacting Concrete Using Machine Learning Based Regression Techniques. Adv. Eng. Softw. 2022, 173, 103267. [Google Scholar] [CrossRef]
  38. Zheng, M.; Chen, S.; Wang, B. Mix Design Method for Permeable Base of Porous Concrete: I. J. Pav. Res. Tech. 2012, 5, 102–107. [Google Scholar]
  39. Silva, R.G.; Bortoletto, M.; Bigotto, S.A.M.; Akasaki, J.L.; Soriano, L. Effect of Wastes from Sugar Cane Industry on the Mechanical and Hydraulic Properties of Pervious Concrete. Road Mater. Pavement Des. 2022, 23, 1–18. [Google Scholar] [CrossRef]
  40. Shen, P.; Lu, J.X.; Zheng, H.; Liu, S.; Sun Poon, C. Conceptual Design and Performance Evaluation of High Strength Pervious Concrete. Constr. Build. Mater. 2021, 269, 121342. [Google Scholar] [CrossRef]
  41. NBR 16416l; Brasileira de Normas Técnicas Pavimentos Permeaveis de Concreto Requisitos e Procedimentos. Associação Brasileira de Normas Técnicas: Rio de Janeiro, RJ, Brazil, 2015.
  42. Kant Sahdeo, S.; Ransinchung, G.D.; Rahul, K.L.; Debbarma, S. Effect of Mix Proportion on the Structural and Functional Properties of Pervious Concrete Paving Mixtures. Constr. Build. Mater. 2020, 255, 119260. [Google Scholar] [CrossRef]
  43. Yu, F.; Sun, D.; Hu, M.; Wang, J. Study on the Pores Characteristics and Permeability Simulation of Pervious Concrete Based on 2D/3D CT Images. Constr. Build. Mater. 2019, 200, 687–702. [Google Scholar] [CrossRef]
  44. Ibrahim, H.A.; Goh, Y.; Ng, Z.A.; Yap, S.P.; Mo, K.H.; Yuen, C.W.; Abutaha, F. Hydraulic and Strength Characteristics of Pervious Concrete Containing a High Volume of Construction and Demolition Waste as Aggregates. Constr. Build. Mater. 2020, 253, 119251. [Google Scholar] [CrossRef]
  45. Mastali, M.; Dalvand, A. The Impact Resistance and Mechanical Properties of Self-Compacting Concrete Reinforced with Recycled CFRP Pieces. Compos. B. Eng. 2016, 92, 360–376. [Google Scholar] [CrossRef]
  46. Lu, J.X.; Yan, X.; He, P.; Poon, C.S. Sustainable Design of Pervious Concrete Using Waste Glass and Recycled Concrete Aggregate. J. Clean. Prod. 2019, 234, 1102–1112. [Google Scholar] [CrossRef]
  47. Sumanasooriya, M.S.; Neithalath, N. Pore Structure Features of Pervious Concretes Proportioned for Desired Porosities and Their Performance Prediction. Cem. Concr. Compos. 2011, 33, 778–787. [Google Scholar] [CrossRef]
  48. Kia, A.; Wong, H.S.; Cheeseman, C.R. Clogging in Permeable Concrete: A Review. J. Environ. Manag. 2017, 193, 221–233. [Google Scholar] [CrossRef] [PubMed]
Figure 1. Schematic diagram of the effect of packing aggregates in pervious concrete.
Sustainability 15 04939 g001
Figure 2. Schematic representation of the infiltration rate test.
Sustainability 15 04939 g002
Figure 3. Schematic apparatus for the drop-weight impact resistance test.
Sustainability 15 04939 g003
Figure 4. Schematic pore analysis of specimens using software ImageJ.
Sustainability 15 04939 g004
Figure 5. (a) Morphological aspect of the narrow-sized and combined aggregates; (b) Gradation curves of basaltic aggregates; (c) Unit weight for combined aggregates AB and BC at different replacement percentages.
Sustainability 15 04939 g005
Figure 6. (a) Porosity of PC mixtures; (b) density of PC mixtures.
Sustainability 15 04939 g006
Figure 7. Relation between PCs’ porosity and density.
Sustainability 15 04939 g007
Figure 8. Infiltration rate for PC mixtures.
Sustainability 15 04939 g008
Figure 9. (a) 28-day compressive strength; (b) 28-day impact energy for PC mixtures.
Sustainability 15 04939 g009
Figure 10. Scanned and binary (threshold) images of different PC sample surfaces and their respective total porosity.
Sustainability 15 04939 g010
Figure 11. Comparative analysis of porosity using digital image analyses (ImageJ) and ISO 17785-2.
Sustainability 15 04939 g011
Figure 12. Relation of compressive strength, impact energy and infiltration rate with density and porosity for pervious concrete.
Sustainability 15 04939 g012
Figure 13. Prediction results of the multiple regression model versus the experimental data of pervious concrete: (a) compressive strength; (b) impact energy.
Sustainability 15 04939 g013
Table 1. Summary of the influence of aggregate combinations on the properties of pervious concrete.
Author/YearAggregate SizeUse of AggregatesMain Findings
Yahia & Kabagire, 2014 [22]2.5–10 mm
5–14 mm
10–20 mm
Three mixtures with single-sized aggregates and three mixtures composed of 50/50% 2.5–10 mm with 5–14 mm; 75/25% 5–14 mm with 10–20 mm and 25/75% 5–14 mm with 10–20 mm.The combination of aggregates improved mechanical properties due to increased packing density.
Meddah et al., 2017 [23]20 mm
10 mm
Four combinations of 10 mm and 20 mm limestone aggregate mixtures: 50/50%, 25/75%, 75/25%, 60/40%.Granular combinations of aggregates are one of the main factors that affect strength development and porosity.
Huang et al., 2020 [24]5–10 mm
10–15 mm
Two mixtures with single-sized granite aggregates and one mixture made with 50% of each single-sized aggregate.The combination of aggregates resulted in up to 98% improved compressive strength and up to a 53% lower infiltration rate.
Hung et al., 2021 [2] 2–5 mm
5–10 mm
Three mixtures. Mix 1: 100% aggregate 5–10 mm; Mix 2: 80% (5–10 mm) + 15% (2–5 mm) + 5% sand; Mix 3: 50% aggregate (5–10 mm) + 45% aggregate (2–5 mm) + 5% sand.The combination of aggregates resulted in up to 67% improved compressive strength, and reductions of up to 48% and 94% in porosity and the infiltration rate, respectively.
Wu F., Yu. Q., Brouwers, H.J.H., 2022 [25]1–2 mm
2–5 mm
Control mix made with 2–5 mm basalt and four combinations by replacing the aggregate with 1–2 mm steel slag of 0% to 50% ratio replacement with an increment of 12.5%.The combination of aggregates resulted in up to 150.8% improved compressive strength, and reductions of up to 35.7% and 63.4% in porosity and the infiltration rate, respectively.
Table 2. Chemical Portland cement composition determined by X-ray fluorescence (wt.%).
SiO2Al2O3Fe2O3CaONa2OK2OSO3MgOOthersLOI
19.94.44.662.80.11.01.61.10.24.3
Table 3. Mix proportions of the prepared PC.
Mixture IDAggregate (kg/m3)Cement (kg/m3)Water (kg/m3)Water/CementCement/Aggregate
ABC
PC-A1581.25--316.2582.230.261:5
PC-B-1530.79-306.1679.60
PC-C--1523.96304.7979.25
PC-AB841.78841.78-336.7187.54
PC-BC-633.10949.65316.5582.30
PC-ABC333.73333.731001.20333.7386.77
Table 4. Physical properties of basaltic aggregates.
PropertiesABCABBCABCStandard
Water absorption (%)4.452.311.973.382.112.53ASTM C127 [30]
Specific gravity2.973.043.033.013.033.02ASTM C127 [30]
Specific gravity OD *2.622.842.862.732.852.81ASTM C127 [30]
Specific gravity SSD **2.742.912.922.832.922.88ASTM C127 [30]
Unit weight (g/cm3)1.751.681.691.861.761.84ASTM C29 [31]
% Voids40.9644.6344.1138.2241.7239.09ASTM C29 [31]
* OD—oven-dry; ** SSD—saturated-surface-dry.
Table 5. No. of pores, average pore diameter and average pore area for all the mixtures.
Mixture IDNumber of PoresAverage Pore Diameter (mm)Average Pore Area (mm2)
PC-A2632.527.39
PC-B893.4525.79
PC-C614.0840.22
PC-AB1443.0313.45
PC-BC614.0933.56
PC-ABC773.6126.56
Table 6. Summary of the multiple regression model results that considers the dependence of compressive strength and impact energy vs. density, porosity and aggregate size.
Coefficientsp-Value
Compressive StrengthImpact EnergyCompressive StrengthImpact Energy
ANOVA--0.0000.000
R20.950.86--
Intercept (β0)−118.831−4299.4400.0580.003
Density (a1)0.0712.0950.0140.001
Porosity (a2)0.04319.9810.9100.022
Aggregate size (a3)−0.987−38.6920.0560.001
Disclaimer/Publisher’s Note: The statements, opinions and data contained in all publications are solely those of the individual author(s) and contributor(s) and not of MDPI and/or the editor(s). MDPI and/or the editor(s) disclaim responsibility for any injury to people or property resulting from any ideas, methods, instructions or products referred to in the content.