
Analysis of Factors Affecting the Effectiveness of Oil Spill Clean-Up: A Bayesian Network Approach

 , ,
, ,  ,
,
Abstract
:1. Introduction
2. Literature Review
2.1. Study on Oil Spills from Ships in the Marine Environment
2.2. Data-Driven Bayesian Approach
3. Methods
3.1. Tree-Augmented Naïve Bayes (TAN)
3.2. TAN Structure Learning
3.3. TAN Parameter Learning
4. Analysis of Factors Affecting the Effectiveness of Oil Spill Clean-Up
4.1. Data
4.2. Factors Considered
- (1)
- Clean-up ratio (class variable) target node in the TAN model
- (2)
- Discharge amount
- (3)
- Substance type
- (4)
- Accident type
- (5)
- Location of the accident
- (6)
- Damage severity
- (7)
- Seasons
- (8)
- Vessel age
- (9)
- Gross tonnage
- (10)
- Vessel type
- (11)
- Hull material
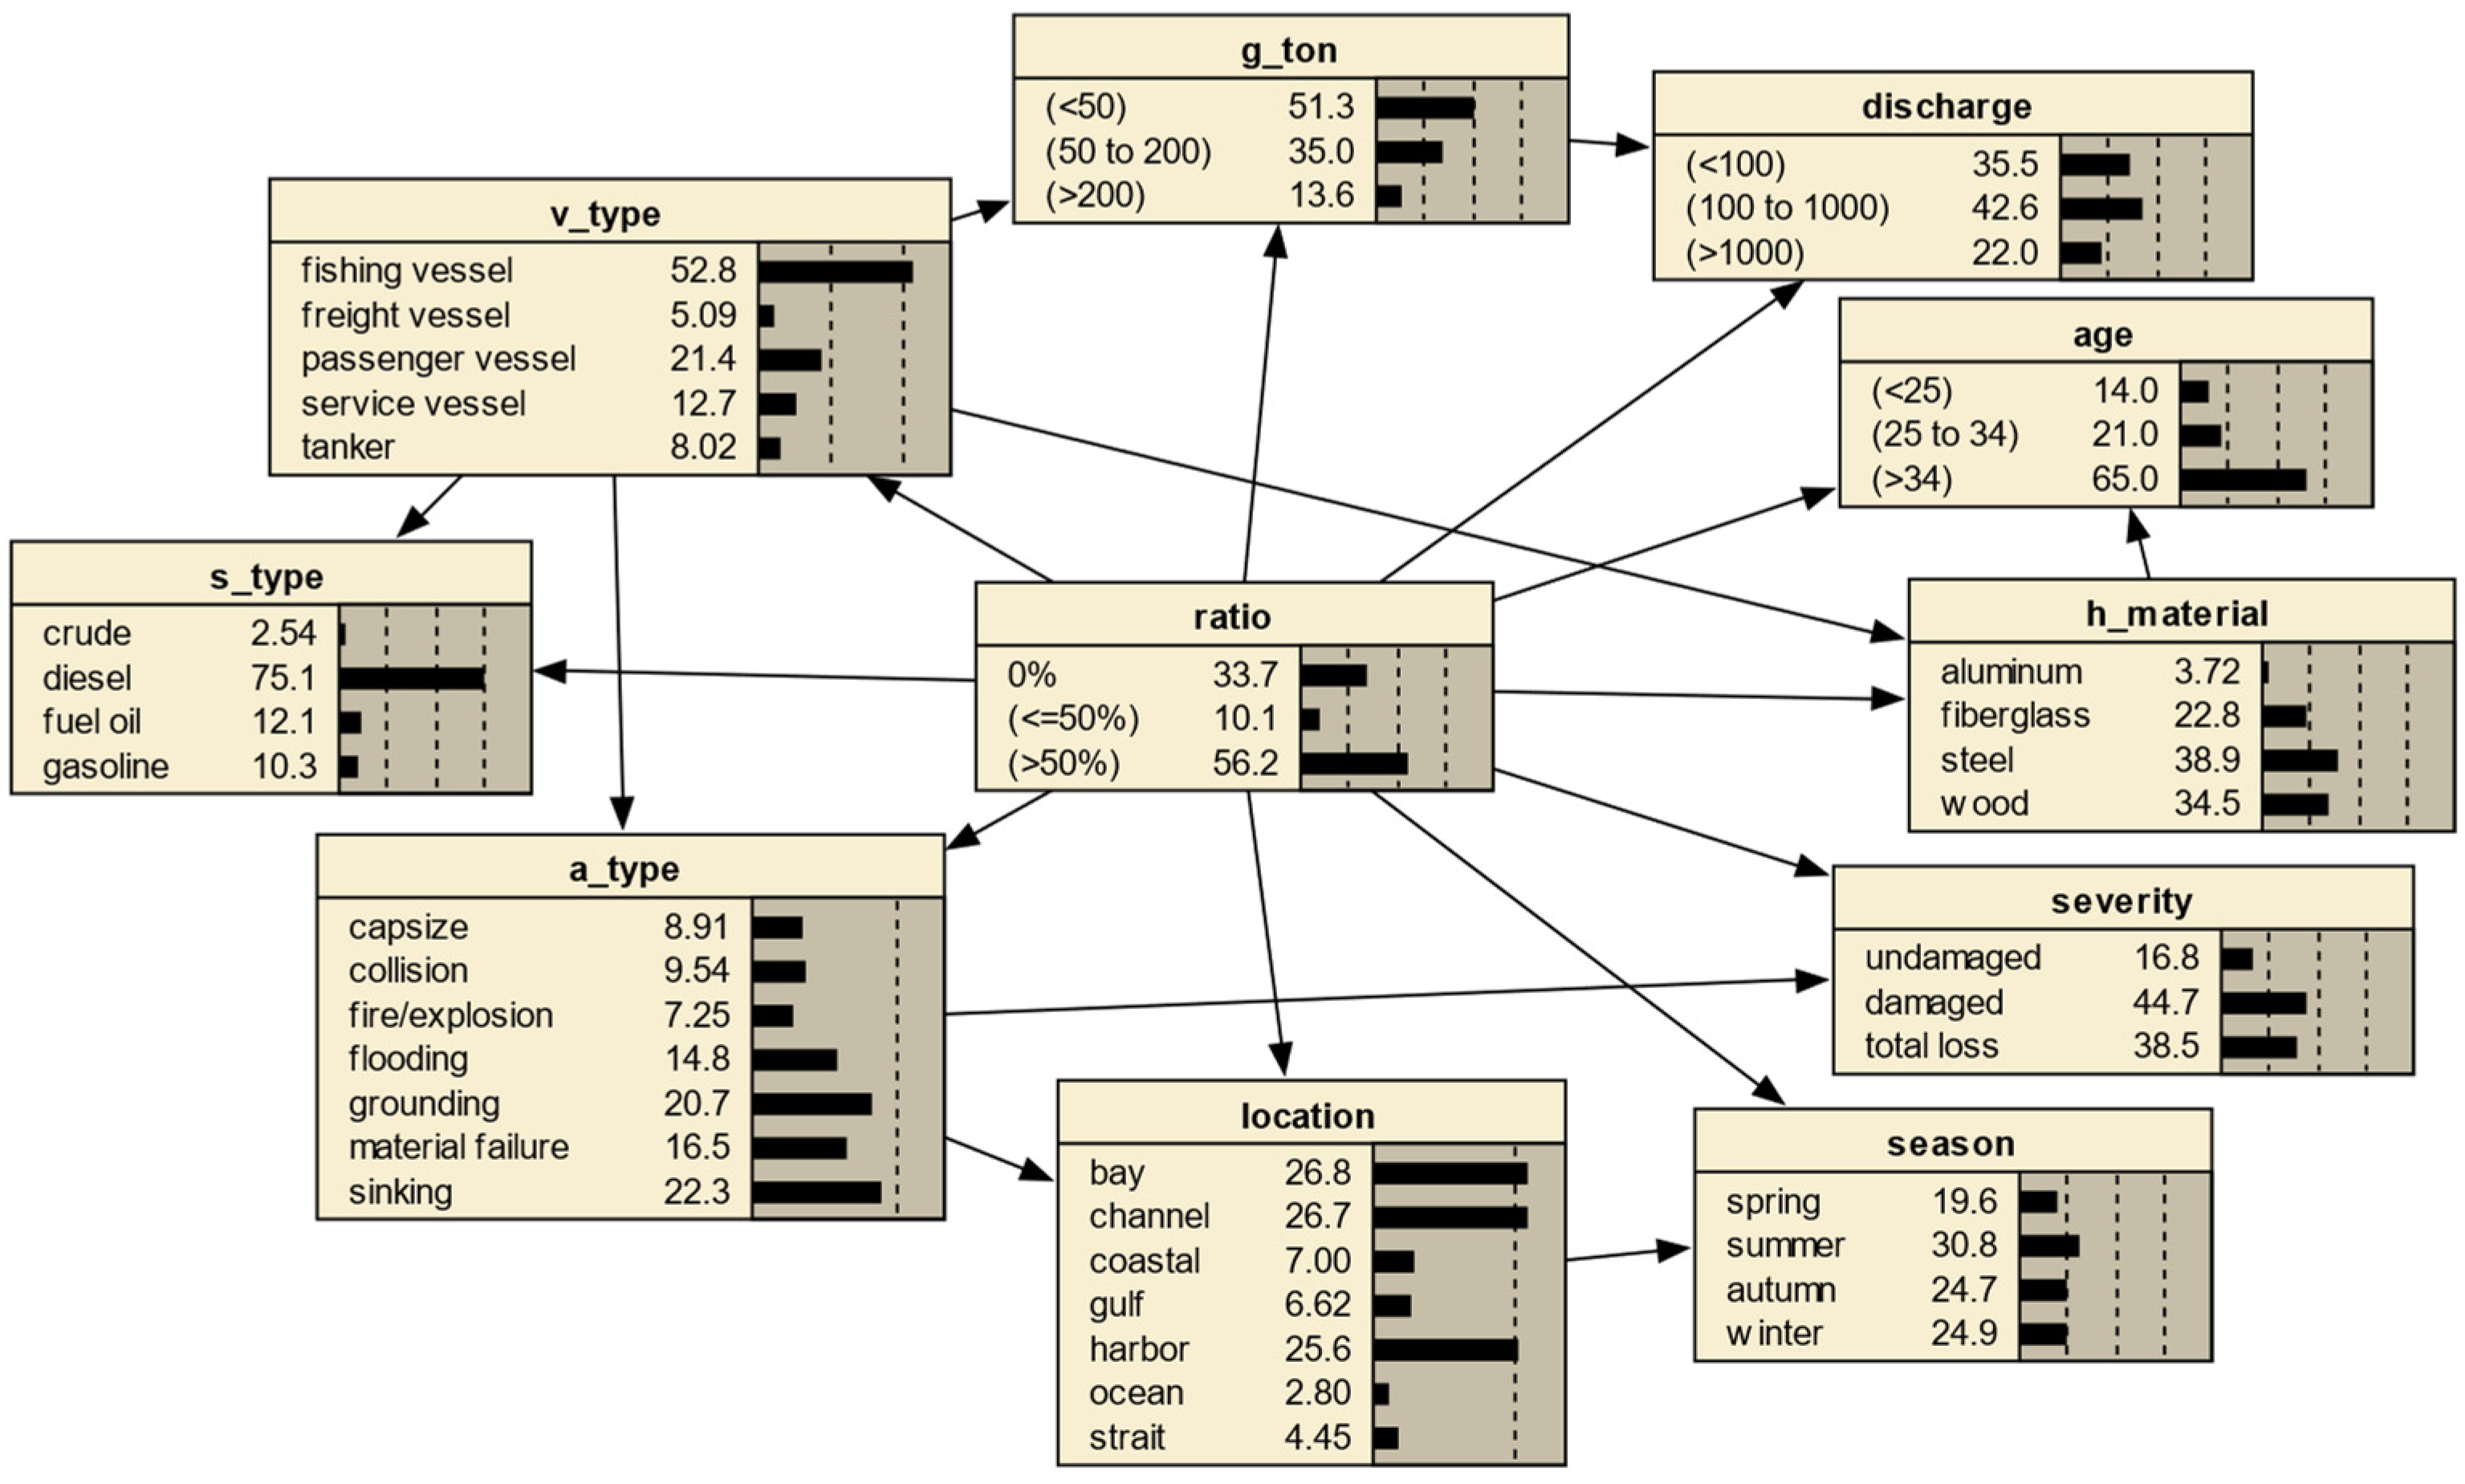
4.3. Construct TAN
- (1)
- Select ratio as the class variable and discharge, season, location, a_type, v_type, h_material, age, g_ton, severity, and s_type as attribute variables.
- (2)
- Determine the conditional mutual information of all attribute pairs and class variables to define their relationships.
- (3)
- Construct an undirected graph with attributes and conditional mutual information, as shown in Table 2.
- (4)
- Consider the edge weights ordered from largest to smallest, construct the spanning tree with the most significant weight, and then select the edge from the largest to the most negligible weight without forming a circle. For each selected edge, if this edge is added to form a circle, it will no longer be selected; on the contrary, edges with weights less than this edge will be selected from the more significant weight to the smaller one. Keep the selected edge, and delete the other edges. The weights of the selected edges are shown in bold in Table 2.
- (5)
- Select the attribute node with the most giant spanning tree as the target node, and set the direction of all arcs to other attributes outward to convert the undirected tree into a directed tree.
- (6)
- Construct the TAN model by adding class variables (i.e., ratio) to the tree and adding arcs of class variables to each attribute. The proposed initially TAN model is shown in Figure 1.
5. Results and Discussions
5.1. Model Evaluation
5.2. Marginal Probability Distribution of TAN Model 1
5.3. Sensitivity Analysis
5.3.1. Mutual Information
5.3.2. Effect of Attribute Variables on Class Variables
5.3.3. Scenario Test
6. Final Remarks
Author Contributions
Funding
Institutional Review Board Statement
Informed Consent Statement
Data Availability Statement
Acknowledgments
Conflicts of Interest
References
- Li, S.; Grifoll, M.; Estrada, M.; Zheng, P.J.; Feng, H.X. Optimization on Emergency Materials Dispatching Considering the Characteristics of Integrated Emergency Response for Large-Scale Marine Oil Spills. J. Mar. Sci. Eng. 2019, 7, 214. [Google Scholar] [CrossRef] [Green Version]
- Gong, J.; Pang, L. Application of marine oil spill model based on Monte Carlo method in Laoshan Bay. IOP Conf. Ser. Earth Environ. Sci. 2019, 371, 042003. [Google Scholar] [CrossRef]
- Villalonga, M.M.; Infantes, M.E.; Colls, M.G.; Ridge, M.M. Environmental Management System for the Analysis of Oil Spill Risk Using Probabilistic Simulations. Application at Tarragona Monobuoy. J. Mar. Sci. Eng. 2020, 8, 277. [Google Scholar] [CrossRef] [Green Version]
- Schulze, R.H. Probability of an oil spill on the St. Marys River. Int. Oil Spill Conf. Proc. 1983, 1983, 129–132. [Google Scholar] [CrossRef]
- Lee, M.; Jung, J.-Y. Risk assessment and national measure plan for oil and HNS spill accidents near Korea. Mar. Pollut. Bull. 2013, 73, 339–344. [Google Scholar] [CrossRef]
- Al Shami, A.; Harik, G.; Alameddine, I.; Bruschi, D.; Garcia, D.A.; El-Fadel, M. Risk assessment of oil spills along the Mediterranean coast: A sensitivity analysis of the choice of hazard quantification. Sci. Total Environ. 2017, 574, 234–245. [Google Scholar] [CrossRef]
- Khan, R.U.; Yin, J.B.; Mustafa, F.S.; Anning, N. Risk assessment for berthing of hazardous cargo vessels using Bayesian networks. Ocean Coast. Manag. 2021, 210, 105673. [Google Scholar] [CrossRef]
- Murti, C.K. A systems approach to the control of chemical disasters. Curr. Sci. 1986, 55, 1064–1066. [Google Scholar]
- Zhang, Z. The experience and inspiration of the successful establishment of the U.S. offshore oil spill emergency response mechanism. Pearl River Water Transp. 2003, 4, 22–24. [Google Scholar] [CrossRef]
- Walker, A.H.; Scholz, D.; McPeek, M.; French-McCay, D.; Rowe, J.; Bock, M.; Robinson, H.; Wenning, R. Comparative risk assessment of spill response options for a deepwater oil well blowout: Part III. Stakeholder engagement. Mar. Pollut. Bull. 2018, 133, 970–983. [Google Scholar] [CrossRef]
- Novack, S.D.; Siu, N.O.; Hill, S.G. The Use of Event Trees in Oil Spill Prevention Applications. In Proceedings of the International Oil Spill Conference, Fort Lauderdale, FL, USA, 1 April 1997; pp. 527–534. [Google Scholar]
- Tian, C.; Huang, Z. Assessment of Emergency Response Capability to Oil Spill at Sea. Navig. China 2011, 34, 98–103. [Google Scholar]
- Li, H.; Li, Y.; Yang, W.; Cheng, L.; Tan, J. Needleless melt-electrospinning of biodegradable poly (lactic acid) ultrafine fibers for the removal of oil from water. Polymers 2017, 9, 3. [Google Scholar] [CrossRef] [Green Version]
- Zafirakou, A.; Themeli, S.; Tsami, E.; Aretoulis, G. Multi-criteria analysis of different approaches to protect the marine and coastal environment from oil spills. J. Mar. Sci. Eng. 2018, 6, 125. [Google Scholar] [CrossRef] [Green Version]
- Dhaka, A.; Chattopadhyay, P. A review on physical remediation techniques for treatment of marine oil spills. J. Environ. Manag. 2021, 288, 112428. [Google Scholar] [CrossRef]
- Đorđević, M.; Šabalja, Đ.; Mohović, Đ.; Brčić, D. Optimisation Methodology for Skimmer Device Selection for Removal of the Marine Oil Pollution. J. Mar. Sci. Eng. 2022, 10, 925. [Google Scholar] [CrossRef]
- Zhang, T.X.; Zhang, D.W.; Ren, L.C.; Xie, W.N. Current Developing Situations of the Vessel Opportunity Skimming System in Domestic and Foreign Countries. Res. Waterborne Transp. 2008, 2, 10–14. [Google Scholar]
- Zhong, X.; Niu, H.; Wu, Y.; Hannah, C.; Li, S.; King, T. A modeling study on the oil spill of M/V Marathassa in Vancouver harbour. J. Mar. Sci. Eng. 2018, 6, 106. [Google Scholar] [CrossRef] [Green Version]
- El-Gayar, D.; Khodary, M.; Abdel-Aziz, M.; Khalil, M. Effect of disk skimmer material and oil viscosity on oil spill recovery. Water Air Soil Pollut. 2021, 232, 1–9. [Google Scholar] [CrossRef]
- Etkin, D.S.; Nedwed, T.J. Effectiveness of mechanical recovery for large offshore oil spills. Mar. Pollut. Bull. 2021, 163, 111848. [Google Scholar] [CrossRef]
- Li, G.R.; Weng, J.X.; Hou, Z.Q. Impact analysis of external factors on human errors using the ARBN method based on small-sample ship collision records. Ocean Eng. 2021, 236, 109533. [Google Scholar] [CrossRef]
- Fan, S.Q.; Blanco-Davis, E.; Yang, Z.L.; Zhang, J.F.; Yan, X.P. Incorporation of human factors into maritime accident analysis using a data-driven Bayesian network. Reliab. Eng. Syst. Saf. 2020, 203, 107070. [Google Scholar] [CrossRef]
- Wang, L.; Yang, Z. Bayesian network modelling and analysis of accident severity in waterborne transportation: A case study in China. Reliab. Eng. Syst. Saf. 2018, 180, 277–289. [Google Scholar] [CrossRef]
- Cakir, E.; Sevgili, C.; Fiskin, R. An analysis of severity of oil spill caused by vessel accidents. Transp. Res. Part D Transp. Environ. 2021, 90, 102662. [Google Scholar] [CrossRef]
- Kamal, B.; Çakır, E. Data-driven Bayes approach on marine accidents occurring in Istanbul strait. Appl. Ocean Res. 2022, 123, 103180. [Google Scholar] [CrossRef]
- Friedman, N.; Geiger, D.; Goldszmidt, M. Bayesian network classifiers. Mach. Learn. 1997, 29, 131–163. [Google Scholar] [CrossRef] [Green Version]
- Zhang, K. The Research on Tree-Augmented Naive Bayes’s Improvement and Its Parallelization. Master’s Thesis, Changsha University Science & Technology, Changsha, China, 2018. (In Chinese). Available online: https://kns.cnki.net/kcms2/article/abstract?v=LDpCwjv3gGpExRW4b3yINSlxLuALHzeYgVd6KytbQPMgeK7XjMM0DqQD4Un4ADCuPdFv2Mn5bhoPUf0CeYBsVCyelGiJZ_HTtehurDufpw0ojKmPAG7w==&uniplatform=NZKPT&language=CHS. (accessed on 11 August 2022).
- Jiang, M.Z.; Lu, J.; Yang, Z.L.; Li, J. Risk analysis of maritime accidents along the main route of the Maritime Silk Road: A Bayesian network approach. Marit. Policy Manag. 2020, 47, 815–832. [Google Scholar] [CrossRef]
- Chow, C.; Liu, C. Approximating discrete probability distributions with dependence trees. IEEE Trans. Inf. Theory 1968, 14, 462–467. [Google Scholar] [CrossRef] [Green Version]
- Zou, X.; Yue, W.L. A Bayesian Network Approach to Causation Analysis of Road Accidents Using Netica. J. Adv. Transp. 2017, 2017, 2525481. [Google Scholar] [CrossRef] [Green Version]
- Jiang, M.Z.; Lu, J. The analysis of maritime piracy occurred in Southeast Asia by using Bayesian network. Transp. Res. Part E Logist. Transp. Rev. 2020, 139, 101965. [Google Scholar] [CrossRef]
- Dobbins, J.P.; Abkowitz, M. Use of advanced information technologies for marine accident data analysis visualization and quality control. J. Transp. Saf. Secur. 2010, 2, 1–13. [Google Scholar] [CrossRef]
- Dorsey, L.T.C.; Wang, B.; Grabowski, M.; Merrick, J.; Harrald, J.R. Self healing databases for predictive risk analytics in safety-critical systems. J. Loss. Prevent. Proc. 2020, 63, 104014. [Google Scholar] [CrossRef]
- Ketkar, K.; Babu, A. An analysis of oil spills from vessel traffic accidents. Transp. Res. Part D Transp. Environ. 1997, 2, 35–41. [Google Scholar] [CrossRef]
- Talley, W.K.; Yip, T.L.; Jin, D. Determinants of vessel-accident bunker spills. Transp. Res. Part D Transp. Environ. 2012, 17, 605–609. [Google Scholar] [CrossRef]
- Yip, T.L.; Talley, W.K.; Jin, D. The effectiveness of double hulls in reducing vessel-accident oil spillage. Mar. Pollut. Bull. 2011, 62, 2427–2432. [Google Scholar] [CrossRef]
- Lu, L.; Goerlandt, F.; Banda, O.A.V.; Kujala, P.; Höglund, A.; Arneborg, L. A Bayesian Network risk model for assessing oil spill recovery effectiveness in the ice-covered Northern Baltic Sea. Mar. Pollut. Bull. 2019, 139, 440–458. [Google Scholar] [CrossRef]
- Montewka, J.; Weckström, M.; Kujala, P. A probabilistic model estimating oil spill clean-up costs—A case study for the Gulf of Finland. Mar. Pollut. Bull. 2013, 76, 61–71. [Google Scholar] [CrossRef]
- Cariou, P.; Mejia, M.Q.; Wolff, F.C. On the effectiveness of port state control inspections. Transp. Res. Part E Logist. Transp. Rev. 2008, 44, 491–503. [Google Scholar] [CrossRef]
- Yang, Z.S.; Yang, Z.L.; Yin, J.B. Realising advanced risk-based port state control inspection using data-driven Bayesian networks. Transp. Res. Part A Policy Pract. 2018, 110, 38–56. [Google Scholar] [CrossRef]
- Knapp, S.; Franses, P.H. A global view on port state control: Econometric analysis of the differences across port state control regimes. Marit. Policy Manag. 2007, 34, 453–482. [Google Scholar] [CrossRef]
- Wang, H.X.; Liu, Z.J.; Wang, X.J.; Graham, T.; Wang, J. An analysis of factors affecting the severity of marine accidents. Reliab. Eng. Syst. Saf. 2021, 210, 107513. [Google Scholar] [CrossRef]


| Variables | Node Name | Status |
|---|---|---|
| Clean-up ratio | c_ratio | S1: (0%); S2: (<=50%); S3: (>50%) |
| Discharge amount | discharge | S1: (<100); S2: (100 to 1000); S3: (>1000) |
| Substance type | s_type | S1: crude; S2: diesel; S3: fuel oil; S4: gasoline |
| Accident type | a_type | S1: capsize; S2: collision; S3: fire/explosion; S4: flooding; S5: grounding; S6: material failure; S7: sinking |
| Location of the accident | location | S1: bay; S2: channel; S3: coastal; S4: gulf; S5: harbor; S6: ocean; S7: strait |
| Damage severity | severity | S1: undamaged; S2: damaged; S3: total loss |
| Season | season | S1: spring; S2: summer; S3: autumn; S4: winter |
| Vessel age | age | S1: (<25); S2: (25 to 34); S3: (>34) |
| Gross tonnage | g_ton | S1: (<=50); S2: (50 to 200); S3: (>200) |
| Vessel type | v_type | S1: fishing vessel; S2: freight vessel; S3: passenger vessel; S4: service vessel; S5: tanker |
| Hull material | h_material | S1: aluminum; S2: fiberglass; S3: steel; S4: wood |
| v_type | a_type | Discharge | Location | s_type | Severity | Season | g_ton | h_material | Age | |
|---|---|---|---|---|---|---|---|---|---|---|
| v_type | 0 | 0.16 | 0.09 | 0.07 | 0.14 | 0.07 | 0.03 | 0.31 | 0.33 | 0.06 |
| a_type | 0 | 0.08 | 0.10 | 0.08 | 0.13 | 0.03 | 0.12 | 0.10 | 0.07 | |
| discharge | 0 | 0.07 | 0.08 | 0.06 | 0.01 | 0.15 | 0.12 | 0.01 | ||
| location | 0 | 0.03 | 0.04 | 0.04 | 0.05 | 0.05 | 0.05 | |||
| s_type | 0 | 0.03 | 0.01 | 0.08 | 0.05 | 0.04 | ||||
| severity | 0 | 0.01 | 0.07 | 0.04 | 0.04 | |||||
| season | 0 | 0.02 | 0.02 | 0.02 | ||||||
| g_ton | 0 | 0.24 | 0.04 | |||||||
| h_material | 0 | 0.11 | ||||||||
| age | 0 |
| Predicted Positive | Predicted Negative | |
|---|---|---|
| Real positive | ||
| Real negative |
| Model | Train/Test Rate | Accuracy | Ratio | Precision | Recall | F-Measure |
|---|---|---|---|---|---|---|
| Model 1 | 90/10 | 0.64 | 0% | 0.56 | 0.63 | 0.60 |
| (<=50%) | 0.50 | 0.11 | 0.18 | |||
| (>50%) | 0.69 | 0.73 | 0.58 | |||
| Model 2 | 85/15 | 0.58 | 0% | 0.48 | 0.45 | 0.47 |
| (<=50%) | 0.33 | 0.08 | 0.13 | |||
| (>50%) | 0.64 | 0.74 | 0.56 | |||
| Model 3 | 75/25 | 0.57 | 0% | 0.51 | 0.47 | 0.49 |
| (<=50%) | 0.25 | 0.09 | 0.13 | |||
| (>50%) | 0.62 | 0.72 | 0.55 | |||
| Model 4 | 70/30 | 0.58 | 0% | 0.53 | 0.47 | 0.50 |
| (<=50%) | 0.27 | 0.12 | 0.16 | |||
| (>50%) | 0.62 | 0.72 | 0.55 | |||
| Model 5 | 65/35 | 0.58 | 0% | 0.52 | 0.51 | 0.52 |
| (<=50%) | 0.20 | 0.10 | 0.13 | |||
| (>50%) | 0.64 | 0.70 | 0.56 |
| Metrics | Clean-Up Ratio | ||
|---|---|---|---|
| 0 | <=50% | >50% | |
| Precision | 0.56 | 0.5 | 0.69 |
| Recall | 0.63 | 0.11 | 0.73 |
| F-measure | 0.59 | 0.18 | 0.58 |
| Node | Mutual Info | Percent | Variance of Beliefs |
|---|---|---|---|
| ratio | 1.32899 | 100 | 0.3371677 |
| discharge | 0.05881 | 4.43 | 0.0138567 |
| severity | 0.02487 | 1.87 | 0.0066138 |
| location | 0.01517 | 1.14 | 0.0028081 |
| s_type | 0.01102 | 0.829 | 0.0022896 |
| a_type | 0.01008 | 0.758 | 0.0013471 |
| v_type | 0.00825 | 0.621 | 0.0008535 |
| season | 0.00800 | 0.602 | 0.0007558 |
| age | 0.00656 | 0.494 | 0.0002762 |
| h_material | 0.00539 | 0.406 | 0.0012722 |
| g_ton | 0.00279 | 0.21 | 0.0002774 |
Disclaimer/Publisher’s Note: The statements, opinions and data contained in all publications are solely those of the individual author(s) and contributor(s) and not of MDPI and/or the editor(s). MDPI and/or the editor(s) disclaim responsibility for any injury to people or property resulting from any ideas, methods, instructions or products referred to in the content. |
© 2023 by the authors. Licensee MDPI, Basel, Switzerland. This article is an open access article distributed under the terms and conditions of the Creative Commons Attribution (CC BY) license (https://creativecommons.org/licenses/by/4.0/).
Share and Cite
Zhong, L.; Wu, J.; Wen, Y.; Yang, B.; Grifoll, M.; Hu, Y.; Zheng, P. Analysis of Factors Affecting the Effectiveness of Oil Spill Clean-Up: A Bayesian Network Approach. Sustainability 2023, 15, 4965. https://doi.org/10.3390/su15064965
Zhong L, Wu J, Wen Y, Yang B, Grifoll M, Hu Y, Zheng P. Analysis of Factors Affecting the Effectiveness of Oil Spill Clean-Up: A Bayesian Network Approach. Sustainability. 2023; 15(6):4965. https://doi.org/10.3390/su15064965
Chicago/Turabian StyleZhong, Liangxia, Jiaxin Wu, Yiqing Wen, Bingjie Yang, Manel Grifoll, Yunping Hu, and Pengjun Zheng. 2023. "Analysis of Factors Affecting the Effectiveness of Oil Spill Clean-Up: A Bayesian Network Approach" Sustainability 15, no. 6: 4965. https://doi.org/10.3390/su15064965
APA StyleZhong, L., Wu, J., Wen, Y., Yang, B., Grifoll, M., Hu, Y., & Zheng, P. (2023). Analysis of Factors Affecting the Effectiveness of Oil Spill Clean-Up: A Bayesian Network Approach. Sustainability, 15(6), 4965. https://doi.org/10.3390/su15064965