Article

Priorities, Scale and Insights: Opportunities and Challenges for Community Involvement in SDG Implementation and Monitoring

1
School of Geography, University College Dublin, D04 V1W8 Dublin, Ireland
2
School of Architecture, Planning and Environmental Policy, University College Dublin, D04 V1W8 Dublin, Ireland
3
Dundrum 2030 Community Group, Airfield Estate, D14 EE77 Dublin, Ireland
*
Author to whom correspondence should be addressed.
Sustainability 2023, 15(6), 4971; https://doi.org/10.3390/su15064971
Submission received: 10 January 2023 / Revised: 6 March 2023 / Accepted: 6 March 2023 / Published: 10 March 2023
(This article belongs to the Section Sustainability in Geographic Science)

Abstract

:
Monitoring progress towards the achievement of the Sustainable Development Goals (SDGs) mainly relies on national voluntary review mechanisms, which often depend on regional spatial data and statistics. While it is critical that governments take ownership of SDG implementation and reporting, many communities are proactively driving changes towards sustainability through local action. This paper explores the potential implications of bridging national and local implementation and reporting through the lens of SDG indicators data. It presents a community-driven case study for sustainability monitoring in the Republic of Ireland, exploring how local priorities and associated data scalability and insights provide opportunities and challenges towards a comprehensive and accurate understanding of SDG progress in implementation and achievement. Systemic data availability and scale limitations weaken the evidence-base needed for informed community-driven sustainable development initiatives. Similarly, local efforts to track changes on relevant indicators are uncommon but necessary for filling in data gaps and contributing to a more accurate national reporting. The achievement of the SDGs requires invested commitment across national, regional, local, and community levels. The implementation of sustainability interventions and tracking any changes these may enact on relevant indicators is equally a joint effort, which calls for strategic data and knowledge exchange partnerships.

1. Introduction

The United Nations (UN) Sustainable Development Goals (SDGs) establish a set of specific targets to be achieved across 17 social, economic, environment, and governance pillars throughout the world, calling for shared efforts across global, regional, national, and local levels to place people and the planet at the centre of any decisions [1]. Procedures and initiatives for their implementation take multiple forms, from regional agreements and frameworks that foster education and good governance towards societal equity and more sustainable use of resources (e.g., [2,3]), through more specific national strategic policies and commitment for their achievement (refer, for example, to [4] for an overview of European National sustainable development strategies), to much of the sustainability initiatives being of localised nature. Each of the 17 SDGs includes a defined set of indicators to monitor progress towards their implementation. Within this context, data are fundamental to SDG achievement, acting as the means by which SDG stakeholders may be informed on sustainability progress or otherwise. Furthermore, adequate data allow policymakers to devise and implement accurate interventions to efficiently target specific problem areas [5].

1.1. SDG Indicator Monitoring and Data Challenges

Monitoring progress requires a large amount of data that are high in quality, broad in coverage, frequently available, and spatially disaggregated [6]. National and regional review mechanisms of a voluntary nature have been developed to measure changes on SDG indicator values and thus help monitor SDG achievement (https://sustainabledevelopment.un.org/vnrs/), although the impact of such reviews is questionable [7]. Nevertheless, reporting to date has largely relied on available small-scale spatial datasets (e.g., data recorded nationally, such as greenhouse emissions, with little specificity or local detail), mainly derived from official national statistics or international reporting commitments, with data availability and collection constraints remaining for many of the indicators [6,8,9,10,11] despite significant progress in recent years. This is partially due to the lack of data collection standards or regular data collection efforts for a significant number of the SDG indicators (Table 1). The UN Inter-agency and Expert Group on SDG Indicators has made significant progress in developing standardised methodologies for harmonizing UN Member States’ efforts for gathering data on indicators once designated as Tier III—there were 20 Tier III indicators in 2021 when the framework for the project discussed in this paper was developed.
To address data availability and/or collection issues, the UN allows Member States to derive locally based indicators or to use proxy data. However, only indicator data that align with the UN SDG indicators enable international comparability and a true assessment of a nation’s performance relative to its peers globally [7]. In addition, the spatial scale of data collection, among other things, is key when considering proxies as well as when devising monitoring efforts. Data scale presents significant challenges both in terms of accuracy of reporting and of validity of insights [13,14,15]. This is particularly important in the context of land-use planning. The very nature of land-use planning implies that while strategic decisions can be taken at the highest planning tiers with regards to fostering sustainability (e.g., strategic policies and plans for renewable energy, biodiversity protection, or active modes of transport), such decisions are materialised through specific projects and actions on the ground (e.g., wind farm projects, native tree planting, or safe cycling infrastructure). Therefore, the achievement of sustainability is ultimately an amalgamation of effective individual sustainable development interventions. In this regard, the local scale plays a significant role in the reporting of indicators.
The use of unofficial alternative sources of data is increasingly advocated to complement the official statistics used for SDG reporting and to overcome some of the data collection costs and difficulties [14,16,17]. These include big data (e.g., from satellite imagery, smart meters, sensors, phone applications, and social media), which offer new cost-effective and/or efficient ways of compiling indicators, improving their timeliness and generating more granular or disaggregated statistics (that is, capturing local changes) but which also present a myriad of challenges around quality and accessibility associated with uncertainties and veracity of data, potential biases, privacy, and confidentiality [11,18].
Another promising source of alternative data is that of community-driven monitoring initiatives, citizen science, and citizen observatories. They represent intentional, motivated, and, often, voluntary efforts by either community groups or individuals to engage in the process of data collection and management to generate new science-based knowledge. These approaches foster collection and sharing of individual and/or collective observations, often through online platforms. Such local data collection has the potential to support validation of conventional SDG monitoring data sources by providing complementary high-resolution data over large geographical areas (when aggregated) and time spans, thus increasing spatiotemporal accuracy [6,8,19]. Similar quality and veracity issues to those of big data, as noted above, have been raised for community-driven approaches to data collection [20]. Nevertheless, such approaches have been argued to not only present a potentially effective means for monitoring both the impact of local sustainability initiatives and their contribution towards the achievement of the SDGs [8,21,22,23], but also to boost education, partnership, and action for sustainability by raising awareness of global challenges and of the remedial measures that individuals can take to ameliorate specific societal and environmental issues [8,18,22]. The mechanisms by which community-driven data collection can feed into SDG monitoring are understudied, but several recent assessments have concluded that scalable opportunities exist, if methods are carefully designed and coordinated, and if the limitations of data produced are clearly understood [18,24].

1.2. Bridging National and Local Data for SDG Indicator Reporting

Combining national reporting statistics and local knowledge is a complex task that would require the development of theoretical and pragmatic systems to optimise the usability and value of such efforts. For a start, this would require a degree of translation of monitoring needs and efforts to highlight their relevance at the local level in order to achieve sustained community engagement and impact [8]. This implies, among other things, the sharing of national knowledge with local communities in a meaningful way. So-called “dashboards” have emerged as a means of communicating this complexity to non-expert audiences, and various examples now exist relating to progress towards SDGs (see, for example: https://www.sdgsdashboard.org/, and https://w3.unece.org/SDG/en/Contents). These vary widely in terms of geographical coverage, resolution, and intended audience, though they also differ considerably in data availability, quality of platform, and efficacy at communicating SDG progress [25]. National and regional dashboards to date have largely relied on graphs and “traffic light” visual representation of where the SDGs are at in terms of implementation and/or achievement of particular targets. Such graphical representations fail to specifically capture the “where-when-what” needed to facilitate full understanding and exploration of the SDGs [26]. Geographic Information Systems (GIS) overcome this by facilitating geographical visualisation, exploration, and comparability across multiple scales and, thus, present a remarkable means of facilitating SDG data management, integration, and comparability (See, for example: https://dashboards.sdgindex.org/map). Although still limited in number, these more advanced GIS-based dashboards rely on institutional support strategies to engage audiences and secure funding, while trade-offs are required in data quality, availability, and timing [25]. Furthermore, GIS applications require technical expertise not often held by communities.
The aim of this paper is to explore the premise of SDG indicator data sharing and integration through GIS, focusing on its potential to shed some light on opportunities and challenges going forward, particularly through an examination of whether the indicators can be suitably represented across scales and associated implications. It does so through a case study approach based on an academic–community partnership that focuses on sustainability in a specific geographical area in the Republic of Ireland (Ireland from here on). Using a GIS-based data dashboard as a framework, a number of selected SDG indicators are examined by looking at the repercussions that data availability and scale have on informing communities about future initiatives, interventions, and monitoring efforts. More specifically, it considers whether scaling down national data can provide insights that enhance local knowledge on sustainability while guiding community action, and whether local data-gathering efforts can be set up in a way that not only contribute to filling in existing data and knowledge gaps, but that can be scaled up and integrated into national voluntary review mechanisms.

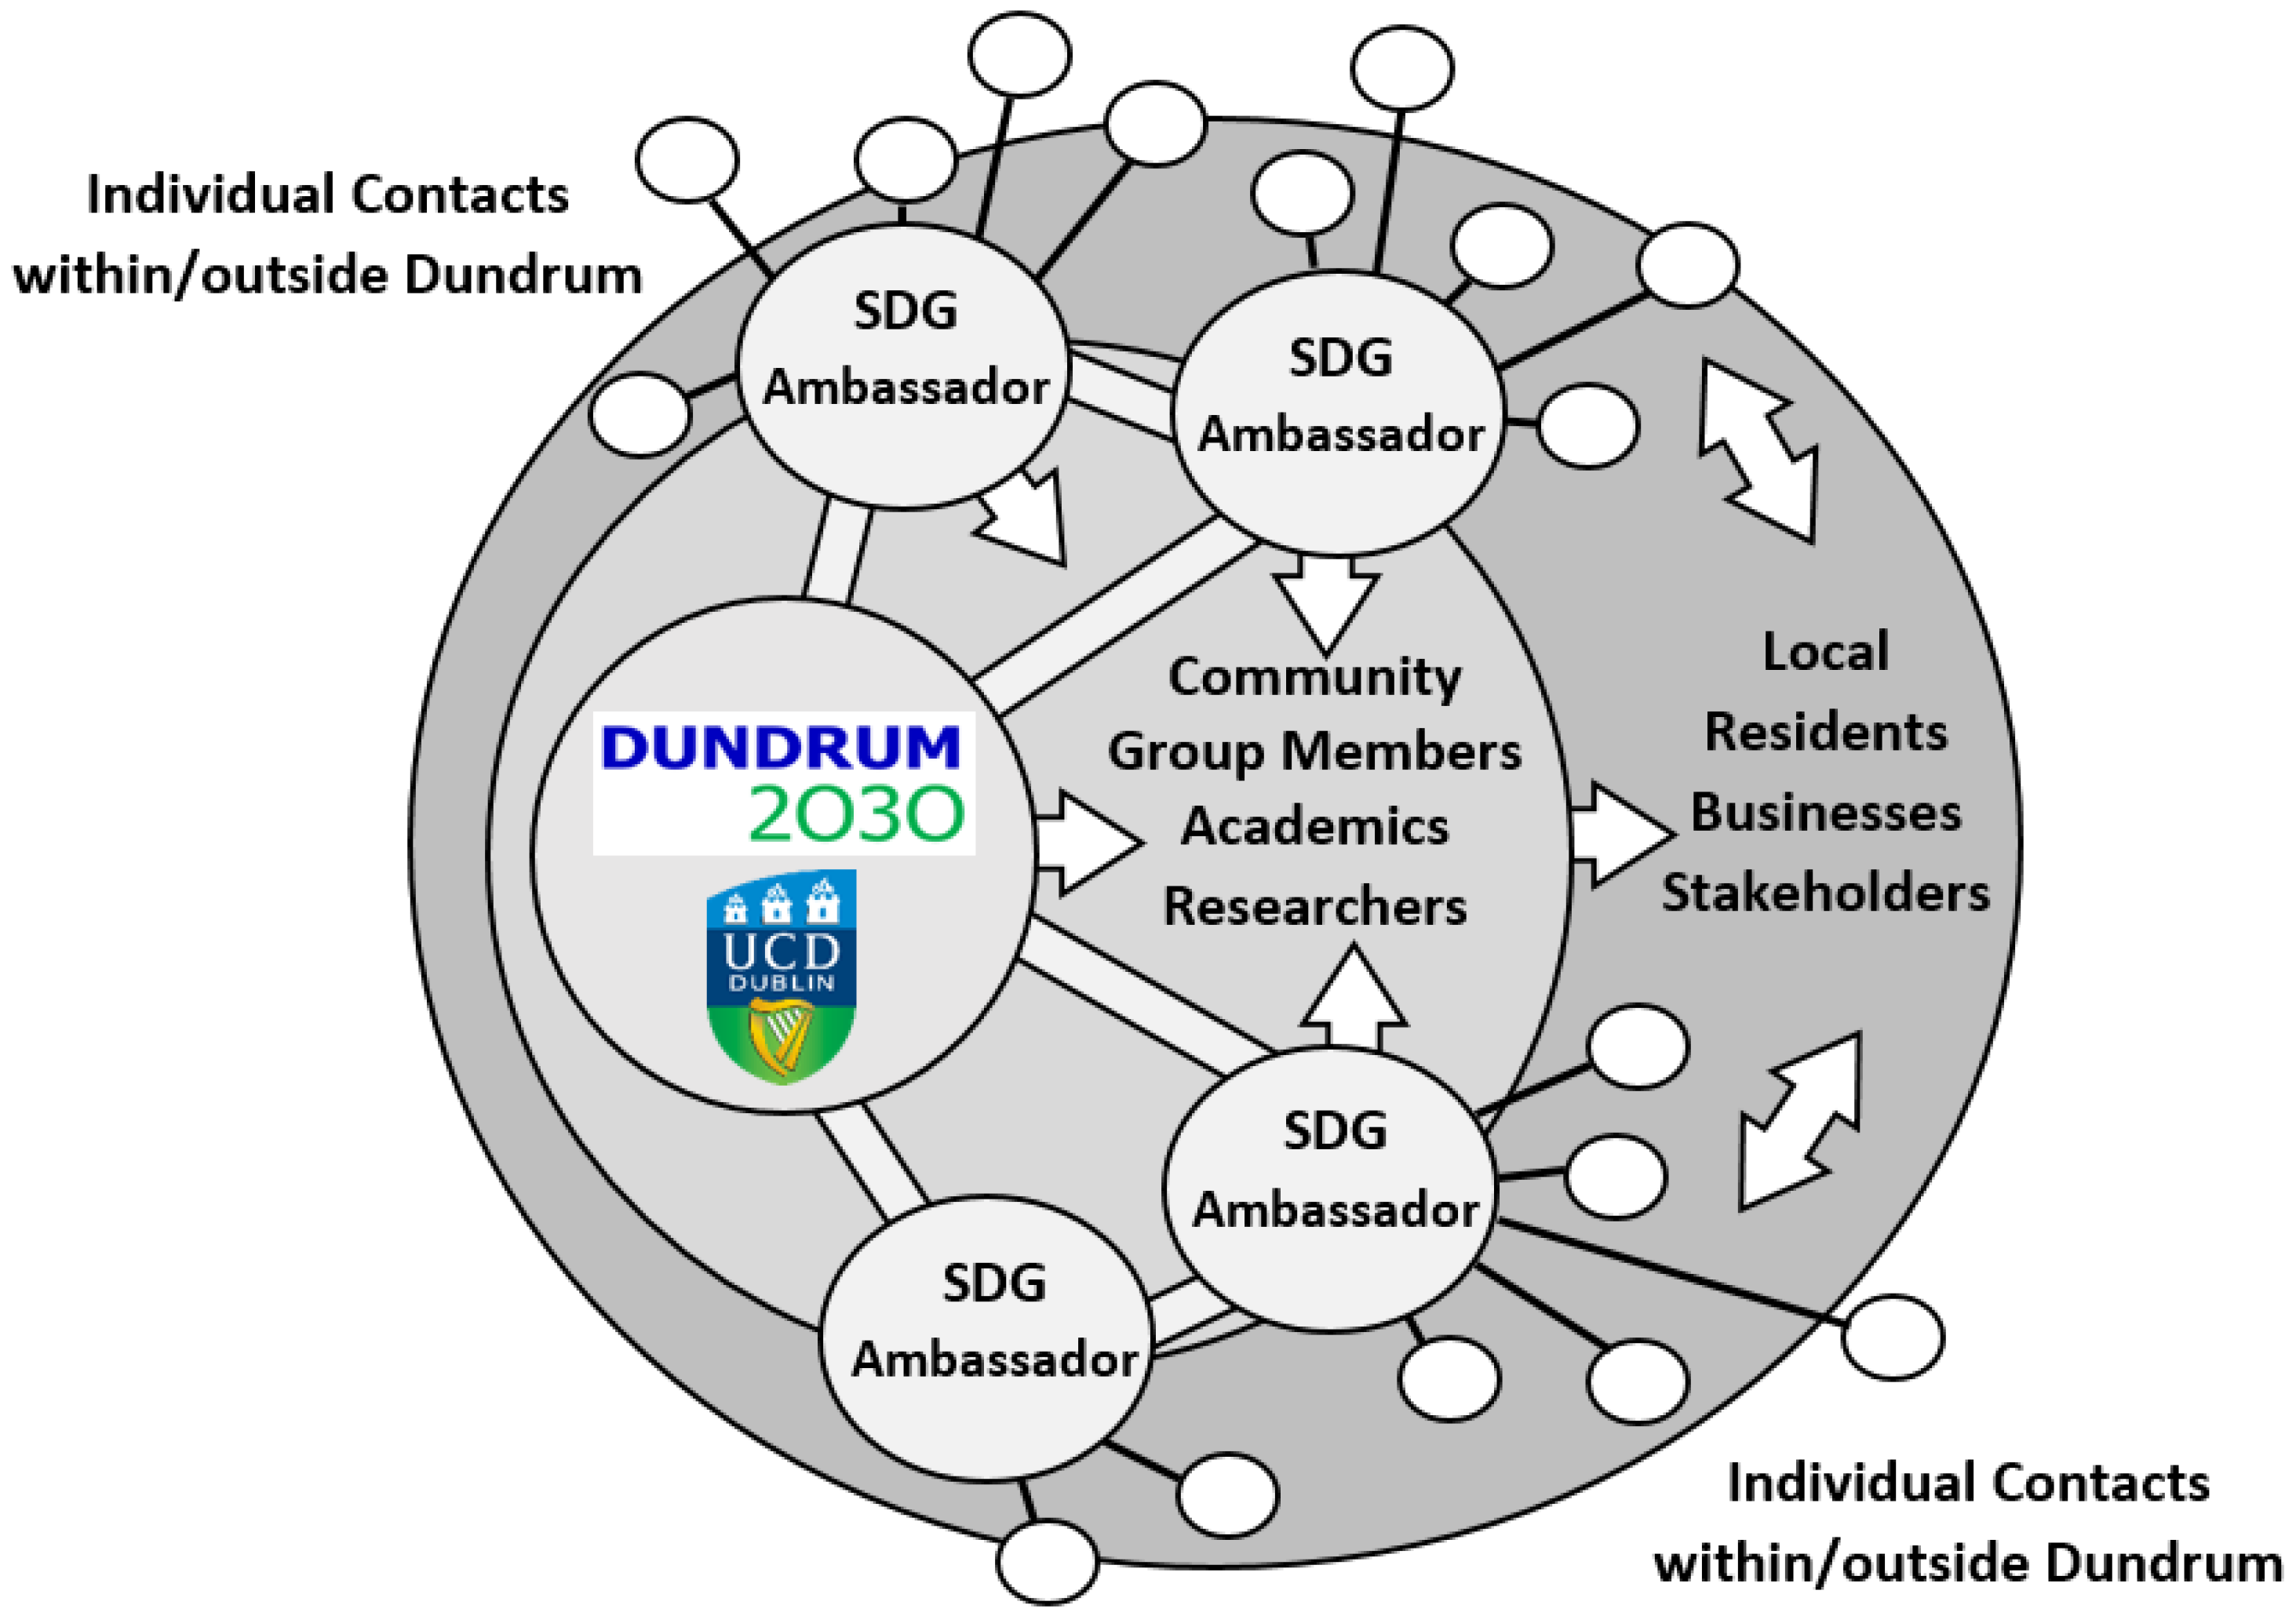
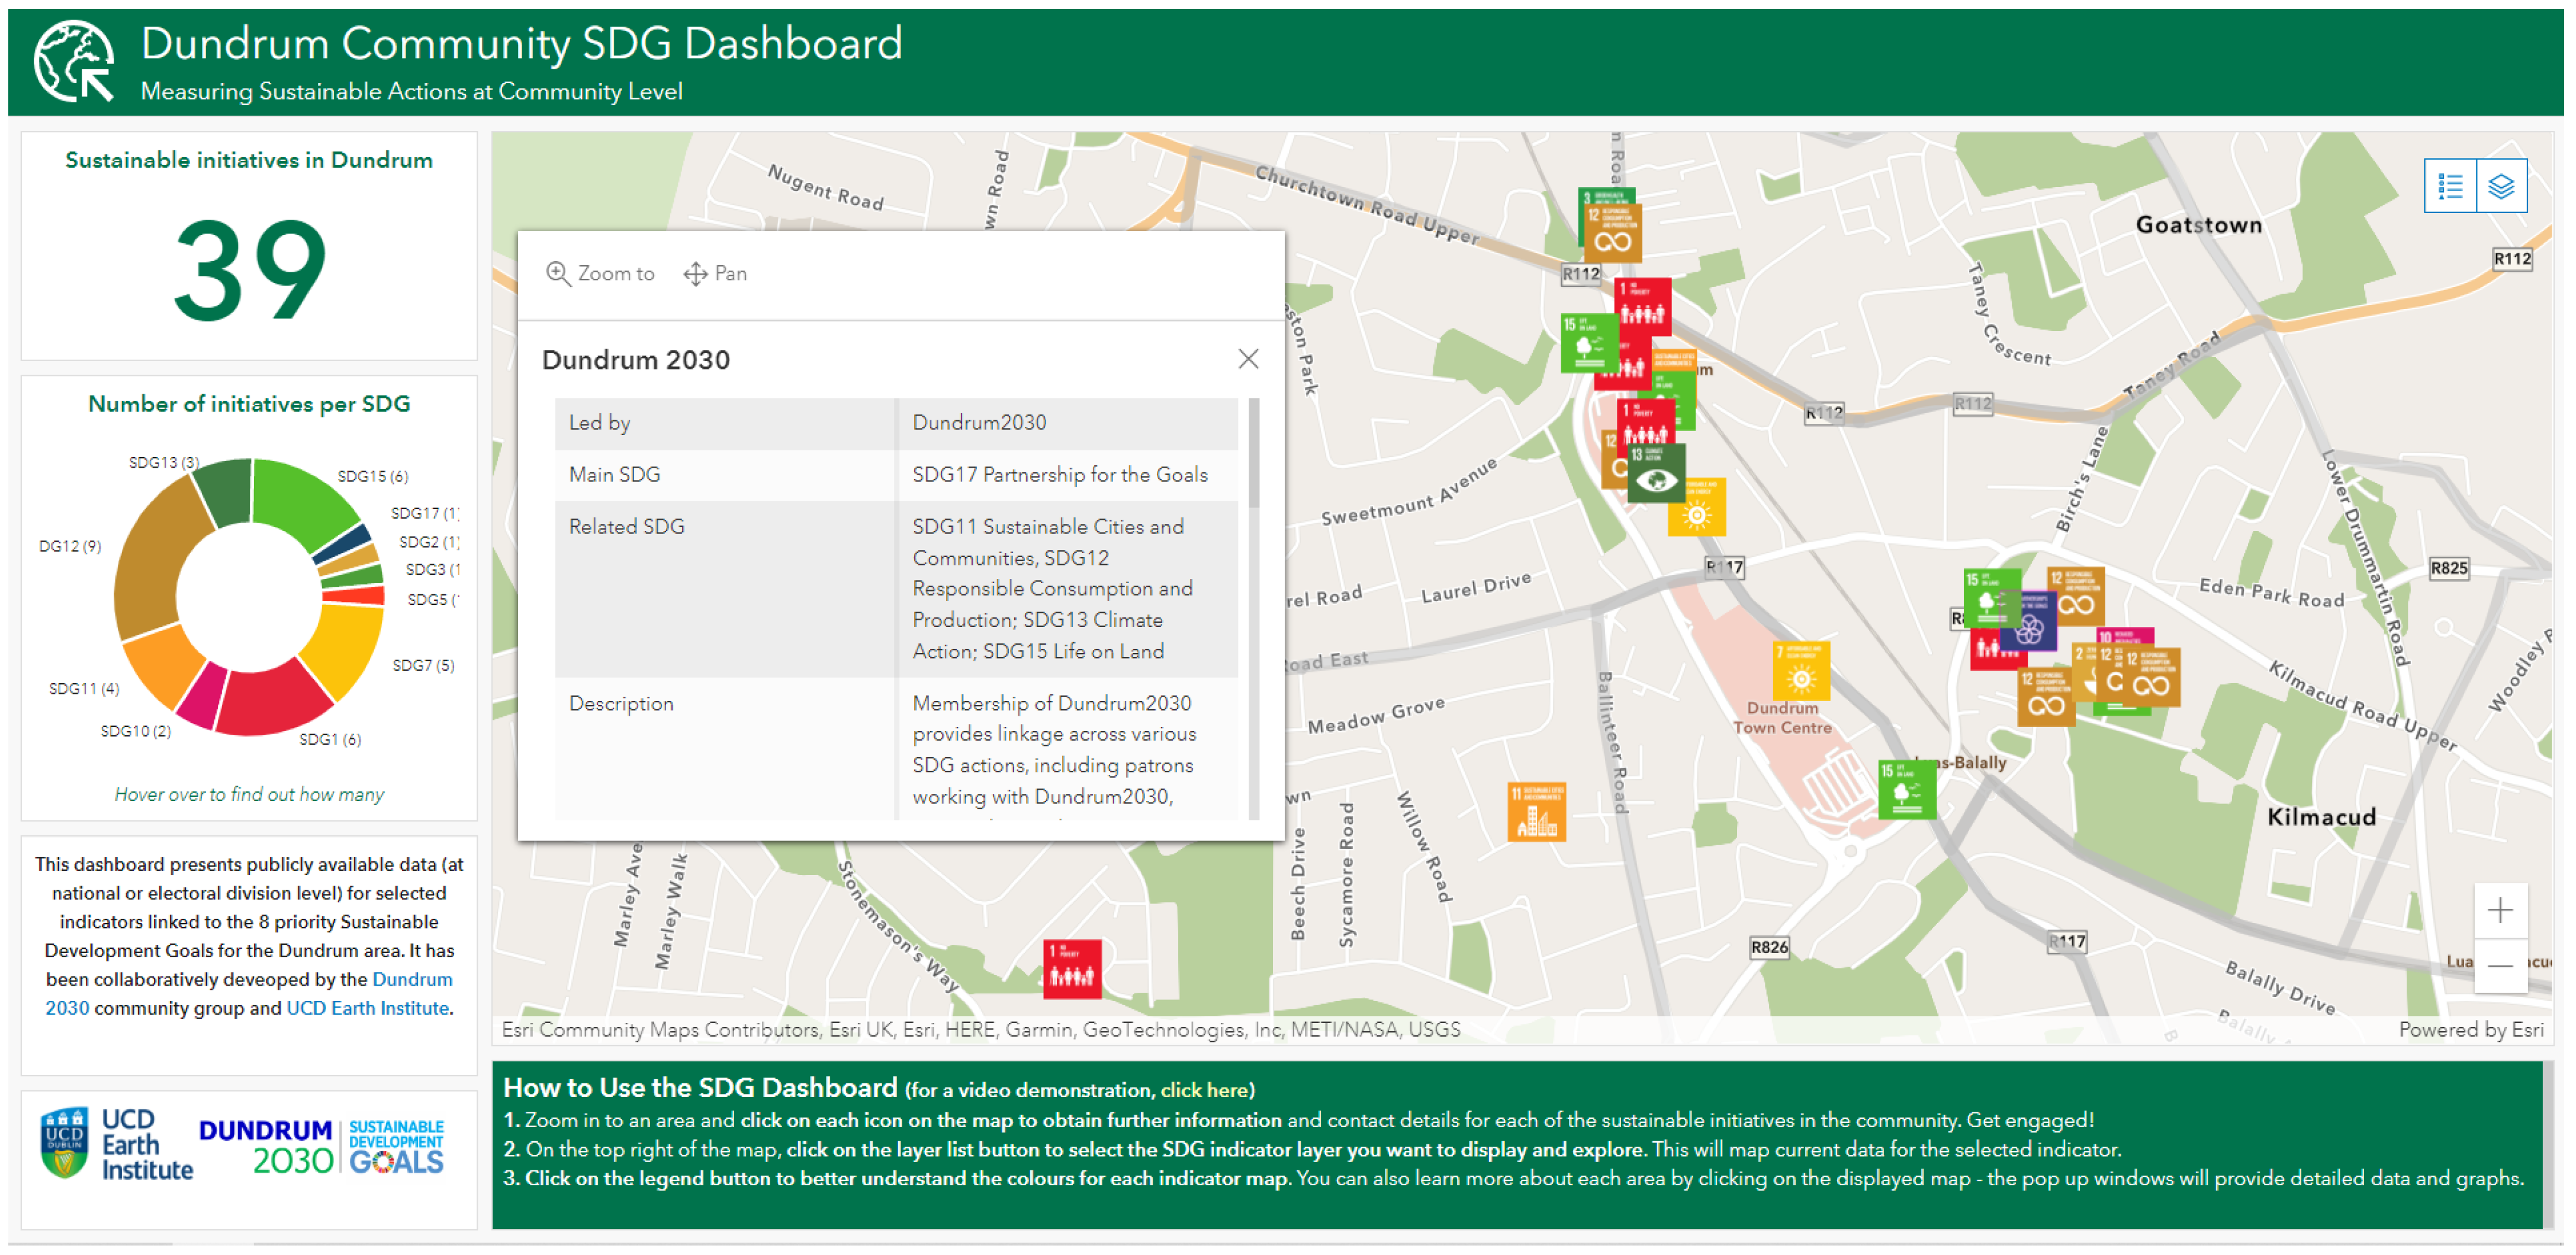
2. The Community SDG Dashboard Framework: A Partnership for the Goals

An academic–community partnership was established in 2019 between the Dundrum 2030 community group and University College Dublin (UCD) researchers, with the aim of monitoring progress towards the achievement of the SDGs within the Dundrum area, located within the administrative boundary of county Dublin, on the east coast of Ireland. Dundrum 2030 (https://dundrumtwentythirty.com/) plays an important role in engaging with local government, planning authorities, and commercial interests, driven by the aim of building “a vibrant community sharing a new set of global values governing our economic, social and environmental behaviour to the benefit of future generations and have a strong civic pride in our local contribution to these goals” [27]. To achieve this aim, the community group has sought to strengthen sectoral networks (Figure 1), establish shared sustainability targets, and develop an SDG reporting tool to monitor progress towards such targets.
Dundrum 2030 mirrors similar efforts in a limited number of towns across Ireland, such as the Dingle 2030 (https://dinglepeninsula2030.com/) initiative, and the Cloughjordan Eco Village (https://www.thevillage.ie/), both of which have endeavoured to stimulate community engagement towards achieving the SDGs by 2030. However, these initiatives have largely focused on fostering sustainability and do not encompass specific commitments or indeed efforts to monitor key indicators at a local level and thus more accurately quantify and understand progress on local SDG implementation and achievement. Further, the latter case has strong existing sustainability buy-in and only partially captures the socio-economic complexity of an existing conurbation such as Dundrum. As such, establishing a co-created method of measuring SDG progress in Dundrum presents a proactive attempt to address knowledge and data gaps and provides a demonstrator case applicable to a wide suite of communities across the country. Perhaps more importantly, it provides a pragmatic opportunity to explore how national datasets can inform local action, and how local data can contribute to national reporting if standardised to enable scaling.
With the above considerations in mind, this academic–community partnership resolved to co-define a UN-aligned indicator set that links to current local concerns and initiatives and, based on this, co-design a framework for monitoring change. This led to the co-creation of an indicator-led monitoring toolkit, in the form of a GIS-based interactive and user-friendly SDG dashboard for communities (see Supplementary Material). The dashboard is to provide a systematic and spatially specific means for data gathering, visualization, and analysis, with the overall aim of developing a means by which local data can facilitate, influence, and feed into national sustainability reporting mechanisms as currently undertaken by the Government of Ireland (https://irelandsdg.geohive.ie). The co-creation approach was driven by an underlying aspiration for social engagement in delivering and monitoring local sustainability activities, aligning with the Dundrum 2030 community group’s goals. The process of developing the dashboard and its future application contribute to awareness-raising and capacity-building within the community.
An underlying aim of this paper is to explore the functionality of a participatory approach to SDG monitoring, looking at potential limitations of existing top-down data structures and the ability of community involvement to foster buy-in and more robust co-created solutions to data collection, ownership, and longevity.

3. Methods

The selection of priority UN-aligned SDG indicators for monitoring local sustainability was undertaken in close consultation with representatives from community groups and residents in the Dundrum area. This was completed by using an iterative tiered public engagement process, comprising academic–community workshops (for full detail on the establishment of the partnership and public engagement methods, see [28]). Initially, the Dundrum 2030 community group, in collaboration with UCD researchers, undertook a materiality survey of priority SDGs at local level and a preliminary identification of existing initiatives and actions towards these. This was based on the group’s experience as residents, activists, and representatives. Subsequently, a community workshop was delivered online (in response to COVID-19 measures at the time), with 90 residents and community representatives in attendance. The workshop’s key aims were to reach consensus in the prioritisation of SDGs, and to contribute to raising awareness on existing local initiatives/activities that foster sustainability. The workshop outputs formed the basis for the preliminary selection of SDG indicators, which were further refined by the research team based on data availability (see results section for full detail) and ultimately incorporated into a GIS-based dashboard.
The pilot dashboard and the list of selected indicators were presented at a second online workshop, with 34 residents and community representatives in attendance. The objective of this workshop was twofold: (a) to discuss the selected indicators in order to determine their relevance for the local community; and (b) to further discussions around pressing issues in the community and the necessity of additional actions/initiatives in the future, as well as to canvas willingness/recruit volunteers for some of these initiatives. The project team undertook a baseline data-gathering exercise to map the final set of selected indicators, while exploring limitations and opportunities for data scalability.

4. Results

4.1. Selection of Priority SDGs and Indicators

The materiality survey undertaken by the core team (i.e., the Dundrum 2030 community group and UCD researchers) resulted in the prioritisation of SDGs 1, 7, 10, 12, and 17. These were expanded to include SDGs 11, 13, and 15, considered of significant importance by the attendees at the first workshop. At this workshop, a comprehensive inventory of sustainability initiatives and actions in the community was undertaken, and additional desirable initiatives were discussed. Subsequently, ongoing initiatives/actions were mapped against the SDGs using Padlet collaboration software, where participating individuals listed sustainability initiatives that they were aware of against the relevant SDG, confirming the relevance and prioritisation of SDGs 1, 7, 10, 11, 12, 13, 15, and 17 for the Dundrum community.
Using workshop feedback (e.g., environmental and social concerns and priorities) and the inventory of sustainability initiatives/actions in the community as the basis, 38 relevant Tier I and Tier II indicators were identified by the research team. This initial selection of indicators was ultimately reduced due to spatial data availability considerations. Availability and access to spatial data were determinant in their final selection, as this was a pre-requisite in order to map an indicator and monitor the effect of local efforts in a geographically explicit manner. As a result, it was not possible to include in the dashboard some of the indicators considered relevant by the community due to the current absence of data/information to populate these (e.g., SDG indicator 12.5.1 “National recycling rate, tons of material recycled”; or indicator 13.3.1 “Extent to which global citizenship education and education for sustainable development are mainstreamed in national education policies, curricula, teacher education and student assessment”). The relationship between some proxy indicators used at national level and UN-aligned indicators was not clearly demonstrated for some indicators, also affecting their inclusion. For example, data for 15.3.1 (“Proportion of land that is degraded over total land area”) exists as a metric at national level but is not provided in a format that can be easily aligned to the UN indicator, while the UN data portal did not include data for Ireland for this indicator at the time of writing. Ultimately, 15 UN-aligned SDG indicators were selected, from the 38 derived from the first workshop, for inclusion in the SDG dashboard based on available data sources (Table 2).
The sustainability initiatives/actions identified by participants at the first workshop were mapped and presented in a GIS-based interactive dashboard at the second workshop for review and feedback to further enhance both the information available and the dashboard’s interface (Figure 2).

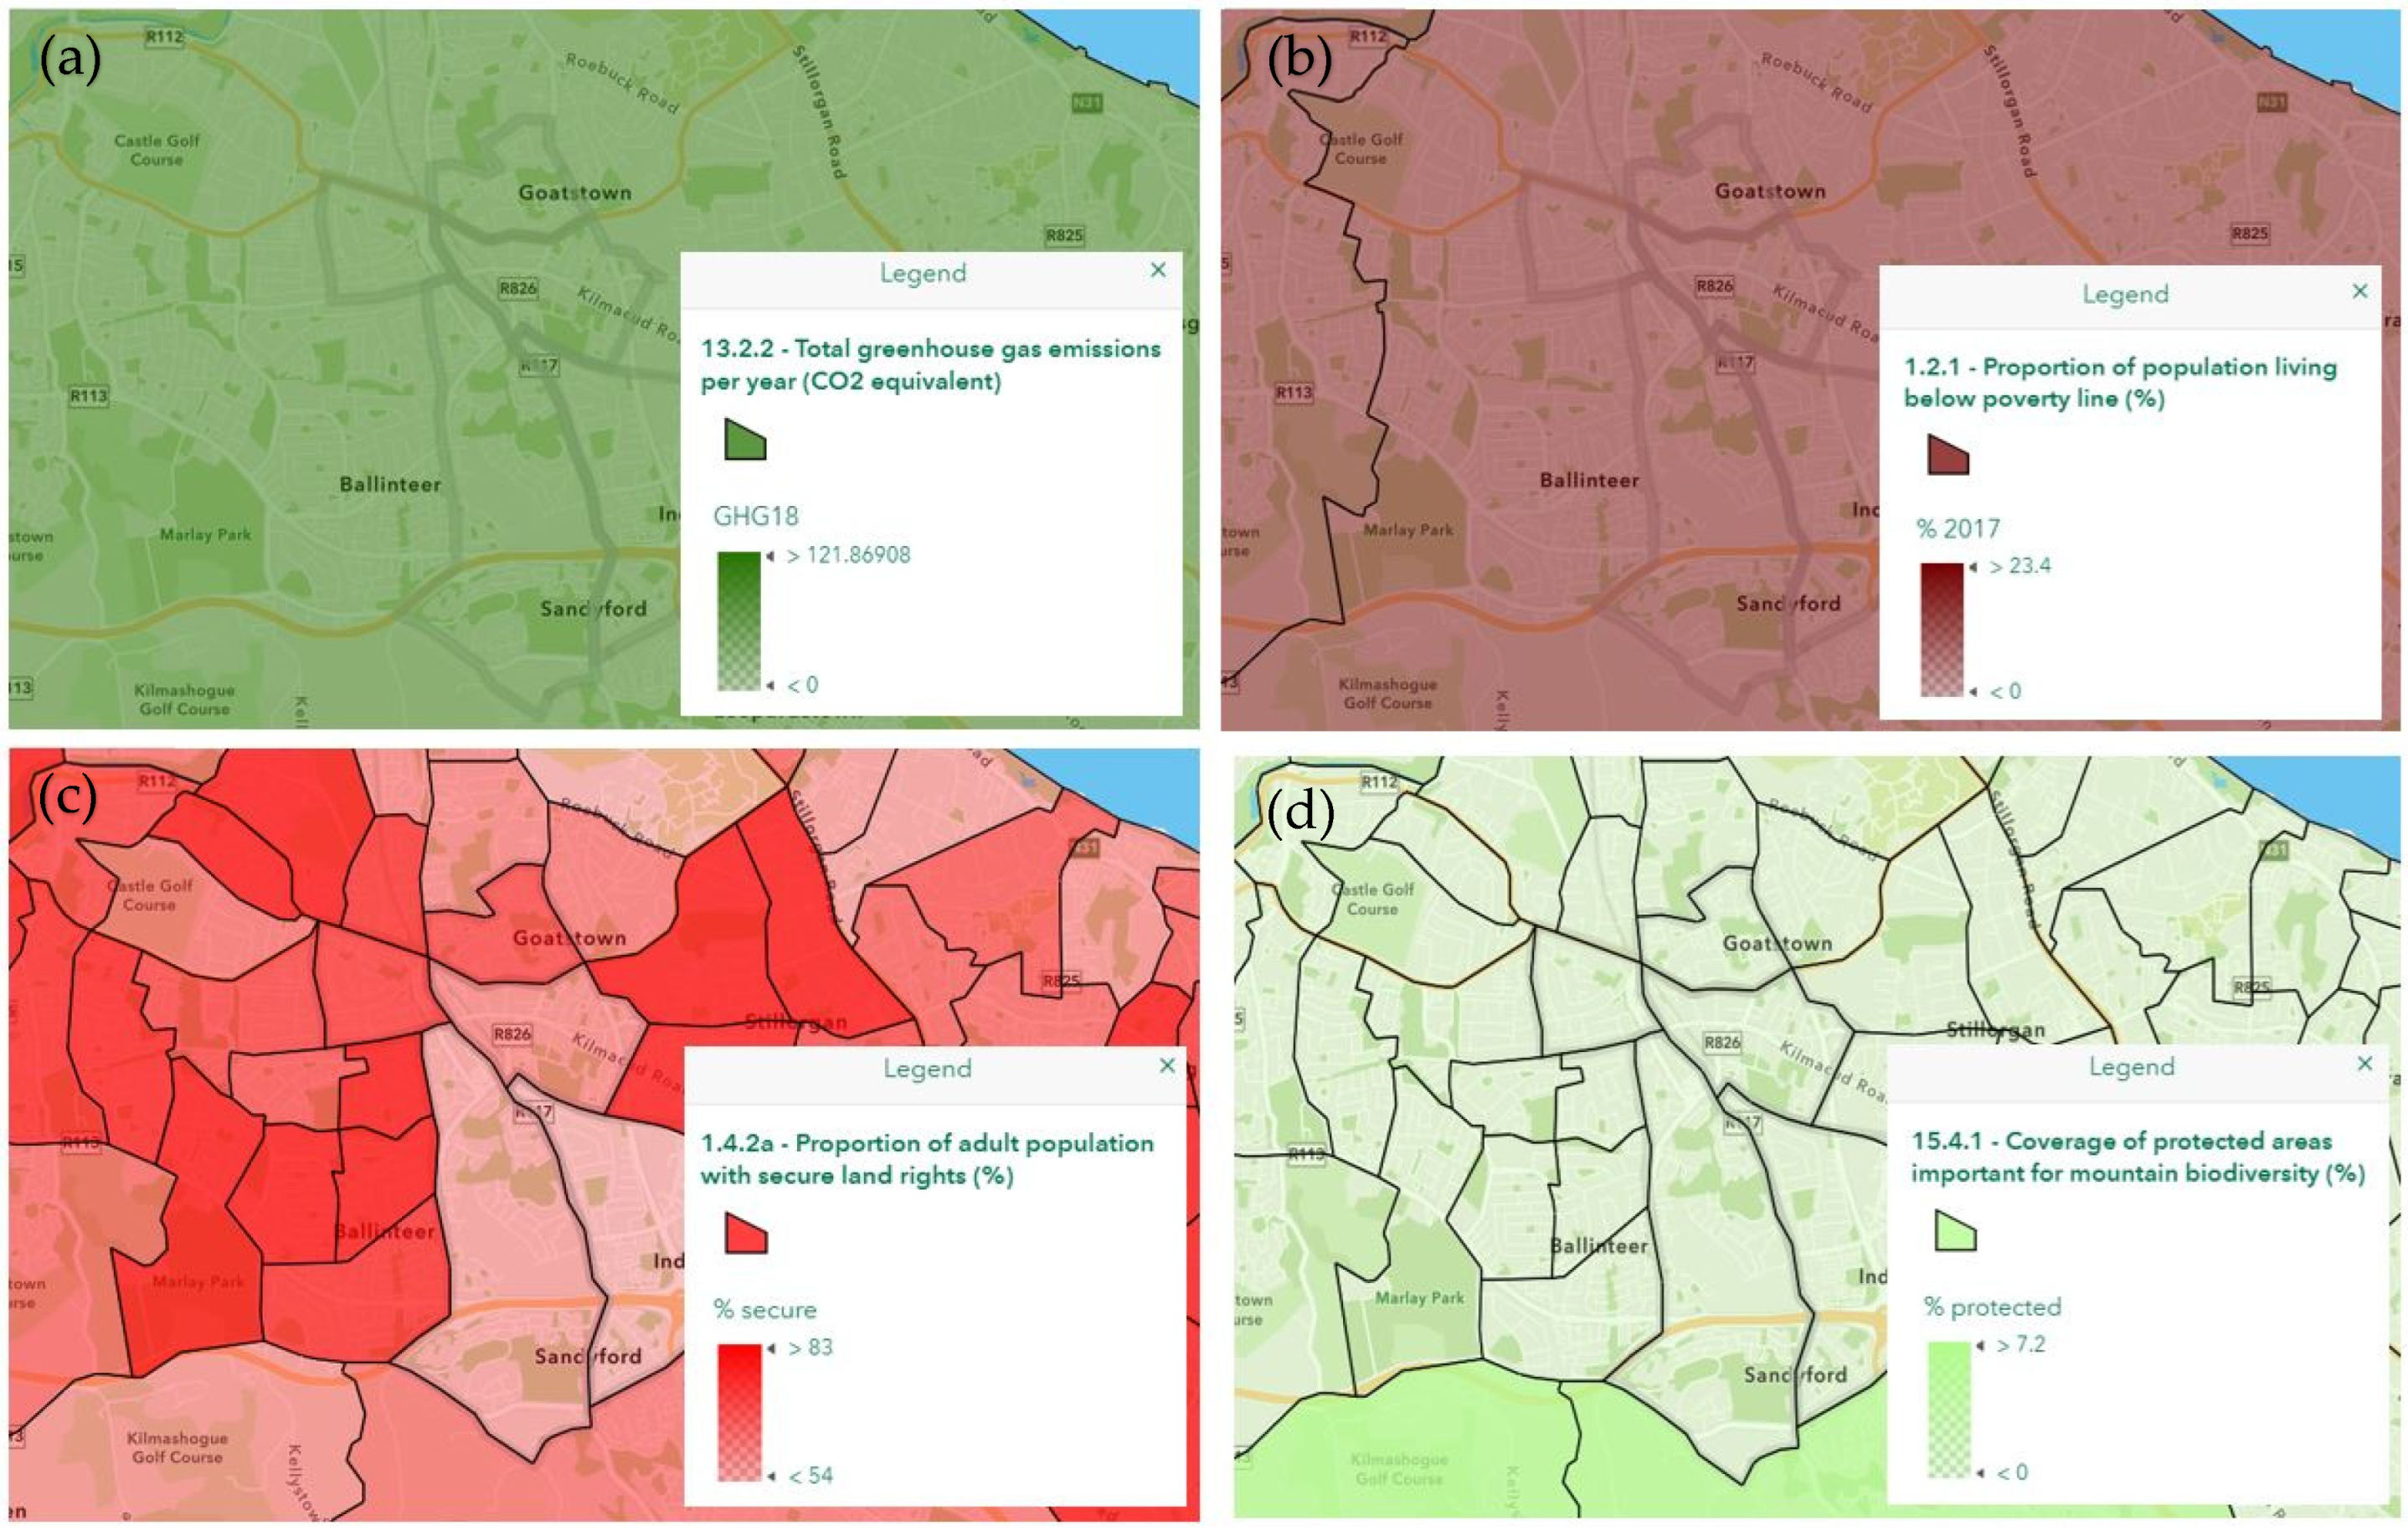
4.2. Mapping Selected SDG Indicators

National and international online data portals and repositories (e.g., data.gov.ie, geohive.ie, unstats.un.org) were searched for geographically explicit information (e.g., csv files with coordinates or geocodes, shapefiles, REST Services) relevant to the selected SDG indicators with the aim of understanding how the indicator performs across spatial scales. The search prioritised identifying datasets that covered the geographical extent of the study area, had the highest resolution, and were most up to date (determined through metadata searches); where this was not possible, the closest resolution or data collection year were selected. Similarly, UN-aligned indicator values were prioritised, but when such information was not available, proxy records were explored. This resulted in the compilation of spatial data sources for the selected indicators as detailed in Table 2. These were then incorporated into the dashboard in order to provide a geographically explicit baseline against which changes in indicator values could be examined and, in this way, inform the need for more concerted and targeted interventions towards sustainability, as well as identifying any knowledge and/or data gaps that could be addressed through local data-gathering efforts. Datasets for 8 of the 15 indicators were available at national scale (i.e., small-scale), two at regional scale, and five at local scale (i.e., large-scale). Most of the selected indicators are Tier I indicators, so data were available and regularly produced. Two of the national scale indicators were Tier II indicators, and so were the two regional and one of the local indicators, which partially affected the dashboard’s geographical and temporal scales. Differences in the geographical scale and scope of the selected indicator datasets can be seen in Figure 3. Issues around data scale and resolution for some of the indicators encumbered their detailed graphic representation and visualisation, ultimately affecting exploration of local variability and identification of existing issues, shaping community understanding and influencing data-gathering efforts, as further discussed below.
Through this community engagement and subsequent indicator mapping process, several important data scale challenges emerged:
  • Some desired indicators are currently only gathered and reported at national level (e.g., SDG indicator 13.2.2 “Total greenhouse gas emissions per year”; or indicator 17.1.1 “Total government revenue as a proportion of GDP, by source”), affecting local scale insights.
  • Four indicators are currently published at national level despite their association with percentage area or percentage population. For these indicators, finer resolution (i.e., local scale) maps were obtained by recalculating national data for “Small Areas” (the smallest census unit in Ireland, generally comprising between 80 and 120 dwellings) using area extent or population statistics as appropriate.
  • The Central Statistics Office (CSO) collects detailed census data relevant to some of the indicators (e.g., 1.4.2, 11.2.1, 17.6.1, and 17.8.1). The project team contacted the CSO in search of more granular detail that could better inform the Dundrum 2030 community group. However, due to General Data Protection Regulation (GDPR) restrictions, such data could not be made available at finer resolutions than those published publicly.
  • The CSO has a new environmental division created in 2015 to comply with Eurostat legal and voluntary reporting obligations. Some of the selected indicators could benefit from their new data collection initiatives such as annual business energy use surveys and biennial recycling and waste generation surveys. Yet, such data collection is currently generalised to administrative county and national levels, respectively, affecting data scale and thus failing to capture local contributions to waste generation and recycling or, indeed, commercial and household energy use.
  • Where a UN-aligned indicator includes several data reporting components, it is not always clear which component of the indicator the national data reporting relates to. For example, data for indicator 1.4.2 (“Proportion of total adult population with secure tenure rights to land, (a) with legally recognised documentation, and (b) who perceive their rights to land as secure, by sex and type of tenure”) do exist, but it is unclear whether the data reported are for component (a) or (b). Similarly, 12.b.1. (“Implementation of standard accounting tools to monitor the economic and environmental aspects of tourism sustainability”) is reported at national level by UN Statistics, but lists data for only two of these metrics (i.e., System of Environmental Economic Accounting tables present and number of tables).
  • Compromise was sometimes required between the age of data, compatibility of the data with UN-aligned indicators, and spatial resolution. For example, 11.2.1 (“Proportion of population that has convenient access to public transport, by sex, age and persons with disabilities”) data are provided up to 2016 and have been collected at the “Dublin City and Suburbs” resolution, an arbitrary spatial delineation which does not align with the geographical scale of any other dataset. A newer dataset at a compatible spatial resolution is hosted by the Sustainable Development Solutions Network (SDSN) as a national index. However, closer inspection reveals that this is in fact data on “satisfaction with public transport”. In this case, the older dataset was used, but was spatially clipped to compatible administrative areas (i.e., regional boundaries) for easier and comparable dashboard visualisation.
  • Some indicators, especially concerning land-use (e.g., 11.7.1 “Average share of the built-up area of cities that is open space for public use for all, by sex, age and persons with disabilities”), could be readily derived from spatial data held by public authorities but inconsistencies in data collection methods, scale, and timing affect their homogenisation.
Taken collectively, the above data scale limitations indicate the need for greater engagement at a local level, to ground-truth existing datasets with local authorities or other gatekeepers (e.g., inaccuracies were observed in some datasets, such as the listing of almost all Dublin Electoral Districts as having NULL values for forests, despite community knowledge indicating otherwise), provide reliable access to all public data sources, and mobilise other currently unusable indicators through collaboration (e.g., 11.7.1 on land-use).
Engagement with communities highlighted additional limitations in effectively identifying, coalescing, and representing data. This reinforces the fundamental importance of “champions” in this process, providing local drive and catalysing broader involvement with an otherwise top-down SDG reporting process. However, this also presents risk, in relying on a narrow support-base, without which motivation may cease. One means of fostering greater resilience is through training the local “SDG Ambassadors”. These persons, recruited on a voluntary basis from across civil society and business at the second community workshop, have since been given responsibility over specific SDGs and tasked with encouraging community awareness of their target SDG, identifying data sources for its indicators, and mobilising community capacity to gather local data and fill SDG indicator data gaps.

5. Discussion: Data Scale and Management Challenges Influencing Community Involvement

It has been widely argued that effective and efficient monitoring of the SDGs requires better utilization of new data sources and data techniques as traditional data producers and hosts, such as national statistic offices and research institutes, cannot fully provide the necessary data or knowledge [8,9,21,22]. Community-driven data collection or citizen science are increasingly advocated as effective contributions towards SDG implementation and monitoring (e.g., [8,20,21,22,23]). Not least, this is because they can also help overcome the excessive costs of populating such a vast array of indicators [14,20]. The Dundrum case study presented in this paper illustrates how voluntary community initiatives can provide a robust alternative for an improved knowledge basis and better understanding of sustainability challenges and priorities for furthering sustainable development and for prioritising data collection efforts. Despite the opportunities, challenges remain to ensure data and information are seamlessly exchanged, managed, and understood across SDG reporting and decision tiers, as discussed next.
Community-driven and citizen science indicator monitoring efforts to date have focused on a limited set of goals, in particular SDGs 3, 4, 6, 11, 13, and 15 (i.e., “Good health and well-being”, “Quality education”, “Clean water and sanitation”, “Sustainable cities and communities”, “Climate action”, and “Life on land”) [21,22]. The SDGs prioritised by residents in the Dundrum area (i.e., 1, 7, 10, 11, 12, 13, 15, and 17) partially align with these; yet, the community interests also put impetus on poverty, equality, energy, and governance considerations. Arguably, such concerted interest in some of the goals could foster and enable a rapid expansion of fine-detail data gathering, which could then be broadened to encompass the remainder of the goals, both nationally and globally. For this to occur, local governments will need to proactively support projects that promote public participation in measuring progress towards the SDGs. This can be achieved through financial mechanisms (e.g., for platform maintenance costs or to incentivise data collection), but also through the provision of infrastructures such as centralised repositories and in supporting SDG champions such as the “SDG Ambassador” approach of the current initiative. The Community SDG Dashboard was born out of a proactive enterprise between a community and academia. It was by-and-large a voluntary effort that spanned over an 18-month period, sustained by a small amount of funding to cover the costs of a researcher for three months in order to develop the online platform. The ongoing maintenance of the platform, to incorporate SDG indicator monitoring data collected voluntarily by the local community, would require ongoing financial support and expertise. The team behind this project is working to secure such funding and set up a structure for safeguarding the dashboard and for supporting associated community efforts towards sustainability.
The dashboard’s foundation is built on an SDG indicator baseline, to raise community awareness, identify areas of further action, and track changes over the coming years towards the 2030 targets. The creation of such baselines required sourcing datasets from multiple agencies at different spatiotemporal scales (Table 2). The spatial or geographical scalability of each of the SDG indicator datasets is particularly crucial in understanding local issues and in providing the basis for defining an effective monitoring mechanism and streamlining data collection efforts. Similarly, data scales help determine monitoring needs by highlighting which specific indicators lack sufficient detail to capture local changes. Further, ensuring that data collection at varying scales nationally is compatible with UN-align indicators is fundamental, in addition to providing greater clarity on which indicator component the data relates to. This is all, therefore, central to the determination of what citizen science can contribute and how to actively fill data gaps in official statistics and validate official data sources [29]. These issues (e.g., local understanding versus local monitoring efforts) are evidently interlinked but have differing implications.
The level of detail of existing data and information determine the level of comprehension, local relatability, and, arguably, appreciation of issues: as observed in this study, national-level data are of less interest to community residents than those which can be presented at “Small Area” scale. National datasets available for some of the selected indicators flag potential sustainability issues at a strategic level, acting as a warning sign that action is needed over broad areas. However, small-scale datasets mean that granular insights could be extracted as to where in the Dundrum community a key indicator was performing badly and thus inform future engagement and interventions. The fact that some of the indicators are gathered and reported only at national level (e.g., 13.2.2 “Total greenhouse gas emissions per year”) also hinders the availability of any additional insight and targeted actions in the future. To address these knowledge gaps, residents in the current study volunteered to gather local information on, for example, air quality pollutants by installing domestic air quality and traffic monitoring sensors at their homes. These data can then be used to enhance the understanding of air quality issues in the community and infer transport-related greenhouse gas emissions locally, thus providing an improved evidence-base. Such community-driven data provide information at finer spatial and temporal scales than the traditional sources of data used as inputs to the SDG indicators, as well as in a spatially disaggregated way [21]. Moreover, they can empower and educate citizens, raise public officials’ awareness of certain issues and, in this way, foster collaborative, accountable, and transparent governance [29]. This was observed in the Dundrum community, were participants at the second workshop raised questions around parts of the neighbourhood where additional cycling infrastructure was needed to enhance sustainable commuting.
When setting up SDG indicator data collection recommendations and measures at the local level, data protection issues were identified. GDPR requirements mean that household data cannot be released raw; any collated records must be generalised at a neighbourhood or “Small Area” level. Scaling up individual records is an uncomplicated task, but it risks coarsening insights for the community, as well as requiring ethical approval for data storage and management. Wider caution is also advised, as there are sensitive socio-political implications to fine-resolution reporting (aside from GDPR concerns), which may cause stigma, such as those deemed to indicate less sustainable practices (e.g., recycling rates, emissions, etc.).
It is crucial that such locally collected information is integrated into national volunteered review mechanisms to ensure sustained community engagement. Long-term involvement of communities in SDG data monitoring can only be achieved through a shared understanding of the usefulness and relevance of their contribution [8]. Moreover, the optimisation of proportionate yet consistent local knowledge, as identified and mobilised by “SDG Ambassadors”, and understanding of SDG challenges and urgencies for action calls for governments (at national and local levels) and statistics offices to develop best practices for the systematic collection and integration of data collected by multiple individuals and citizens, thus avoiding siloed platforms [18] or those overly reliant on incomplete data or inconsistent institutional support [25]. The establishment of a formal mechanism to verify data quality and certify unofficial statistical indicators as official, so that they can be more readily integrated, is also desirable [14,18,25]. This study has reinforced this, in identifying several indicators which are close to inclusion, but lack one or two easily addressed elements, such as the processing of existing spatial data to match a UN-aligned indicator (e.g., 15.3.1) or a reversion of national indicators to its original UN counterpart (e.g., 12.b.1). Further, several indicators currently presented at national scale have the propensity for finer resolution through collaboration with data holders. Bottom-up community involvement can motivate this collaboration, potentially mediating interaction between academic analysis and publicly held spatial statistics.
In conclusion, measures (in the form of data reporting standards) need to be put in place to ensure local data are interoperable and can be seamlessly integrated across geographical areas and tiers, thus ensuring they can be scaled down to provide local insights that provide an effective evidence-base to inform decisions for targeted action, including systematic monitoring to fill in data gaps, and scaled up and incorporated into national reviews and, ultimately, provide a more accurate picture of global progress. This is reliant upon strategic data and knowledge exchange partnerships between government, research, and community groups, sustained funding, and capacity building.

6. Concluding Remarks

The Community SDG dashboard, mapping current sustainability initiatives and 15 SDG indicators, presents a first yet important step in visualising local sustainability patterns and in engaging the community more effectively with monitoring. The indicators included in the dashboard can be expanded as data become available. It also represents a framework transferable to other geographical areas and communities focusing on similar efforts (e.g., in Ireland: Dingle 2030, Cloughjordan Eco Village). While the ultimate goal is to create a network of sustainable communities that locally monitor sustainability and feed into national SDG reporting, lack of funding has, at least temporarily, hampered this process. The benefits of such initiatives are clear, however, in identifying priorities which foster local engagement in sustainability interventions and in encouraging the mobilisation and standardisation of existing datasets for enhancing the evidence-base. There is a motivating opportunity to actively engage the community in bringing sustainability into action and, more importantly in the context of indicator data needs and the purpose of this paper, to use community-driven approaches to capture local changes and thus provide an account of local progress towards the achievement of the SDGs that is of higher resolution and is better grounded in reality.
Ultimately, the achievement of SDGs can only be fully captured and understood through the marrying and validation of official national data sources and locally collected data. The seamless scaling down and up of datasets requires multiple considerations, including strategic partnerships, investment, systematic data collection methods, and data protection ethics. A first step towards scalability is the exploration of existing data and issues. This paper has unveiled and discussed data availability and scale issues that are common in Irish practice, many of which are transferable to other geographical areas. Understanding these issues is essential to inform future SDG monitoring mechanisms. It is only through concerted local, regional, and national data-gathering efforts that communities, territories, and nations can truly understand any shifts towards a more sustainable future.

Supplementary Materials

The Community SDG Dashboard can be accessed at: https://ucdireland.maps.arcgis.com/apps/dashboards/8de77fd7713e4a1f80645df277b4a46a, accessed on 6 March 2023.

Author Contributions

Conceptualization, A.G.; Data curation, S.M.G.; Funding acquisition, A.G.; Investigation, A.G., S.M.G., E.M., G.K. and L.H.-M.; Methodology, A.G.; Project administration, A.G.; Visualization, S.M.G.; Writing—original draft, A.G.; Writing—review and editing, S.M.G., E.M. and L.H.-M. All authors have read and agreed to the published version of the manuscript.

Funding

This research was funded by the Earth Institute, University College Dublin, under the Strategic Priority Support Mechanism 2020 programme.

Institutional Review Board Statement

Full ethical review and approval were waived for this study (considered a human subjects low risk review) as it uses existing data which are publicly available, and workshop feedback was gathered anonymously on a non-sensitive topic.

Informed Consent Statement

Informed consent was obtained from all subjects who voluntarily participated in the workshops.

Data Availability Statement

The data presented in this study are openly available (see Table 2 for full detail).

Acknowledgments

The authors wish to thank all community representatives that participated in the workshops and collaborated in the project, contributing to the identification of sustainability interventions and priorities and the development of the dashboard.

Conflicts of Interest

The authors declare no conflict of interest. The funders had no role in the design of the study; in the collection, analyses, or interpretation of data; in the writing of the manuscript; or in the decision to publish the results.

References

  1. UN (United Nations). Transforming Our World: The 2030 Agenda for Sustainable Development, A/RES/70/1. 2015. Available online: https://digitallibrary.un.org/record/3923923?ln=en (accessed on 2 February 2023).
  2. EC (European Commission). The New European Consensus on Development ‘Our World, Our Dignity, Our Future’. 2018. Available online: https://op.europa.eu/en/publication-detail/-/publication/5a95e892-ec76-11e8-b690-01aa75ed71a1 (accessed on 2 February 2023).
  3. PIFS (Pacific Islands Forum Secretariat). Pacific Regional Education Framework (PacREF) 2018–2030: Moving Towards Education 2030. 2018. Available online: https://www.forumsec.org/wp-content/uploads/2018/10/Pacific-Regional-Education-Framework-PacREF-2018-2030.pdf (accessed on 2 February 2023).
  4. EU (European Commission). Europe’s Approach to Implementing the Sustainable Development Goals: Good Practices and the Way Forward. European Union, Policy Department, Directorate-General for External Policies. 2019. Available online: https://www.europarl.europa.eu/cmsdata/160320/SDG%20study_formatted.pdf (accessed on 2 February 2023).
  5. Sankoh, O. Why population-based data are crucial to achieving the sustainable development goals. Int. J. Epidemiol. 2017, 46, 4–7. [Google Scholar] [CrossRef] [PubMed] [Green Version]
  6. Fritz, S.; See, L.; Carlson, T.; Haklay, M.; Oliver, J.L.; Fraisl, D.; Mondardini, R.; Bocklehurst, M.; Shanley, L.A.; Schade, S.; et al. Citizen science and the United Nations sustainable development goals. Nat. Sustain. 2019, 2, 922–930. [Google Scholar] [CrossRef] [Green Version]
  7. Murphy, E.; Walsh, P.P.; Banerjee, A. Framework for Achieving the Environmental Sustainable Development Goals. Environmental Protection Agency—Research Report. 2021. Available online: https://www.epa.ie/publications/research/climate-change/Research_Report_397_eb.pdf (accessed on 6 March 2023).
  8. Ajates, R.; Hager, G.; Georgiadis, P.; Coulson, S.; Woods, M.; Hemment, D. Local action with global impact: The case of the GROW observatory and the Sustainable Development Goals. Sustainability 2020, 12, 10518. [Google Scholar] [CrossRef]
  9. Daguitan, F.; Mwangi, C.; Tan, M.G.; Clark, G.; Cooper, D.; Donovan, J.M.; Gutierrez, S.; Kruglikova, N.; Lehohla, P.; Seager, J.; et al. Future data and knowledge needs. In Global Environment Outlook—GEO-6: Healthy Planet, Healthy People; UN Environment: Nairobi, Kenya, 2019; Available online: https://wedocs.unep.org/handle/20.500.11822/27539 (accessed on 6 March 2023).
  10. Hopp, D.; Fu, E.; Peltola, A. Feasibility of nowcasting SDG indicators: A comprehensive survey. United Nations Conference on Trade and Development, UNCTAD Research Paper No. 82 UNCTAD/SER.RP/2022/2. 2022. Available online: https://unctad.org/webflyer/feasibility-nowcasting-sdg-indicators-comprehensive-survey (accessed on 6 March 2023).
  11. MacFeely, S. The big (data) bang: Opportunities and challenges for compiling SDG indicators. Glob. Policy 2019, 10, 121–133. [Google Scholar] [CrossRef] [Green Version]
  12. UN Statistical Division. 2022. Available online: https://unstats.un.org/sdgs/iaeg-sdgs/tier-classification/ (accessed on 6 March 2023).
  13. Fisher, A.; Fukuda-Parr, S. Introduction—Data, knowledge, politics and localizing the SDGs. J. Hum. Dev. Capab. 2019, 20, 375–385. [Google Scholar] [CrossRef] [Green Version]
  14. MacFeely, S.; Nastav, B. “You say you want a [data] revolution”: A proposal to use unofficial statistics for the SDG global indicator framework. Stat. J. IAOS 2019, 35, 309–327. [Google Scholar] [CrossRef] [Green Version]
  15. Satterthwaite, M.L.; Dhital, S. Measuring access to justice: Transformation and technicality in SDG 16.3. Glob. Policy 2019, 10, 96–109. [Google Scholar] [CrossRef] [Green Version]
  16. Saner, R.; You, L.; Nguyen, M. Monitoring the SDGs: Digital and social technologies to ensure citizen participation, inclusiveness and transparency. Dev. Policy Rev. 2019, 38, 483–500. [Google Scholar] [CrossRef]
  17. Winkler, I.T.; Satterthwaite, M.L. Leaving no one behind? Persistent inequalities in the SDGs. Int. J. Hum. Rights 2017, 21, 1073–1097. [Google Scholar] [CrossRef]
  18. Woods, S.M.; Daskolia, M.; Joly, A.; Bonnet, P.; Soacha, K.; Liñan, S.; Woods, T.; Piera, J.; Ceccaroni, L. How networks of citizen observatories can increase the quality and quantity of citizen-science-generated data used to monitor SDG indicators. Sustainability 2022, 14, 4078. [Google Scholar] [CrossRef]
  19. Theobald, E.J.; Ettinger, A.K.; Burgess, H.K.; DeBey, L.B.; Schmidt, N.R.; Froehlich, H.E.; Wagner, C.; Hille Ris Lambers, J.; Tewksbury, J.; Harsch, M.A.; et al. Global change and local solutions: Tapping the unrealized potential of citizen science for biodiversity research. Biol. Conserv. 2015, 181, 236–244. [Google Scholar] [CrossRef] [Green Version]
  20. McKinley, D.C.; Miller-Rushing, A.J.; Ballard, H.L.; Bonney, R.; Brown, H.; Cook-Patton, S.C.; Evans, D.M.; French, R.A.; Parrish, J.K.; Phillips, T.B.; et al. Citizen Science can improve conservation science, natural resource management, and environmental protection. Biol. Conserv. 2017, 208, 15–28. [Google Scholar] [CrossRef] [Green Version]
  21. Fraisl, D.; Campbell, J.; See, I.; Wehn, U.; Wardlaw, J.; Gold, M.; Moorthy, I.; Arias, R.; Piera, J.; Oliver, J.L.; et al. Mapping citizen science contributions to the UN Sustainable Development Goals. Sustain. Sci. 2020, 15, 1735–1751. [Google Scholar] [CrossRef]
  22. Moczek, N.; Voigt-Heucke, S.L.; Mortega, K.G.; Fabó Cartas, C.; Knobloch, J. A self-assessment of European citizen science projects on their contribution to the UN Sustainable Development Goals (SDGs). Sustainability 2021, 13, 1774. [Google Scholar] [CrossRef]
  23. Shulla, K.; Filho, W.L.; Sommer, J.H.; Lange Salvia, A.; Borgemeister, C. Channels of collaboration for citizen science and the sustainable development goals. J. Clean. Prod. 2020, 264, 121735. [Google Scholar] [CrossRef]
  24. Head, J.S.; Crockatt, M.E.; Didarali, Z.; Woodward, M.; Emmett, B.A. The role of citizen science in meeting SDG targets around soil health. Sustainability 2020, 12, 10254. [Google Scholar] [CrossRef]
  25. Boza, M.E. SDG Dashboards: The Role of Information Tools in the Implementation of the 2030 Agenda. Report Prepared for UNDP-SIGOB and UNDP Bangkok Hub. 2017. Available online: https://statswiki.unece.org/download/attachments/128451803/SDG%20Dashboards%20UNDP-SIGOB.pdf?version=1&modificationDate=1527759534624&api=v2 (accessed on 6 March 2023).
  26. Zhilin, L.; Gong, X.; Chen, J.; Mills, J.; Songnian, L.; Zhu, X.; Peng, T.; Hao, W. Functional requirements of systems for visualization of Sustainable Development Goal (SDG) indicators. J. Geovis. Spat. Anal. 2020, 4, 5. [Google Scholar] [CrossRef]
  27. Dundrum 2030. 2022. Available online: https://dundrumtwentythirty.com/ (accessed on 6 March 2023).
  28. González, A.; Mc Guinness, S.; Murphy, E.; Kelliher, G.; Hagin-Meade, L. Partnering locally to monitor changes towards the achievement of SDGs. In Partnerships for Sustainable Development; Murphy, E., Banerjee, A., Walsh, P.P., Eds.; Springer Nature: Cham, Switzerland, 2022. [Google Scholar]
  29. Ballerini, L.; Bergh, S.I. Using citizen science data to monitor the Sustainable Development Goals: A bottom-up analysis. Sustain. Sci. 2021, 16, 1945–1962. [Google Scholar] [CrossRef]
Figure 1. Structure of the community–academic partnership (the arrows aim to illustrate the interlinkages in communication across all individuals/groups involved in the partnership; the circles illustrate the expanding tiers of engagement through the establishment of the partnership (Adapted from [28]).
Sustainability 15 04971 g001
Figure 2. Screenshot of the Community SDG Dashboard showing current sustainable initiatives in Dundrum and a pop-up window with additional detail about one such initiative.
Sustainability 15 04971 g002
Figure 3. Sample maps of the Community SDG Dashboard illustrating current data for a selection of indicators mapped at national (a), regional (b), and small area levels—(c) based on a “small area” dataset; (d) dataset recalculated using area extent.
Sustainability 15 04971 g003
Table 1. UN SDG indicator tiers based on their level of methodological development and the availability of data at the global level. Source: [12] (June 2022).
Tier I: 136 indicators
In this tier, the SDG indicator is conceptually clear, has an internationally established methodology and standards, and data are regularly produced by countries (for at least 50% of countries) in every region where the indicator is relevant.
Tier II: 91 indicators
The SDG indicator is conceptually clear, has an internationally established methodology, and standards are available, but the data are not regularly produced by countries.
Tier III: 0 indicators
No internationally established methodology or standards are yet available for the indicator, but methodology/standards are being (or will be) developed or tested by the UN agency responsible for the specific indicator.
Table 2. Selected indicators (selection based on SDG priorities, perception of importance amongst the community given ongoing and future initiatives, and availability of data).
SDG IndicatorSDG TargetData SourceResolutionYear
1.2.1 “Proportion of population living below the national poverty line, by sex and age”
TIER I
1.2 By 2030, reduce at least by half the proportion of men, women, and children of all ages living in poverty in all its dimensions according to national definitionsSustainable Development Solutions Network (SDSN) (https://www.unsdsn.org/) + Central Statistics Office (CSO) (https://www.cso.ie/en/index.html)Regional2019
1.4.2 “Proportion of total adult population with secure tenure rights to land, (a) with legally recognised documentation, and (b) who perceive their rights to land as secure, by sex and type of tenure”
TIER II
1.4 By 2030, ensure that all men and women, in particular the poor and the vulnerable, have equal rights to economic resources, as well as access to basic services, ownership and control over land and other forms of property, inheritance, natural resources, appropriate new technology and financial services, including microfinanceOrdnance Survey—Geohive (https://www.geohive.ie/)Small Areas2016
1.a.2 “Proportion of total government spending on essential services (education, health and social protection)”
TIER II
1.a Ensure significant mobilisation of resources from a variety of sources, including through enhanced development cooperation, to provide adequate and predictable means for developing countries, in particular least developed countries, to implement programmes and policies to end poverty in all its dimensionsUnited Nations Statistics (UN Stats) (https://unstats.un.org/home/) + CSONational2020
7.2.1 “Renewable energy share in the total final energy consumption”
TIER I
7.2 By 2030, increase substantially the share of renewable energy in the global energy mixCSO + GeohiveNational2019
10.2.1 “Proportion of people living below 50 per cent of median income, by sex, age and persons with disabilities”
TIER II
10.2 By 2030, empower and promote the social, economic and political inclusion of all, irrespective of age, sex, disability, race, ethnicity, origin, religion, or economic or other statusUN Stats + SDSNNational2016
11.2.1 “Proportion of population that has convenient access to public transport, by sex, age and persons with disabilities”
TIER II
11.2 By 2030, provide access to safe, affordable, accessible, and sustainable transport systems for all, improving road safety, notably by expanding public transport, with special attention to the needs of those in vulnerable situations, women, children, persons with disabilities, and older personsCSO + SDSNRegional2016
12.2.2 “Domestic material consumption, domestic material consumption per capita, and domestic material consumption per GDP”
TIER I
12.2 By 2030, achieve the sustainable management and efficient use of natural resourcesUN StatsNational2017
12.3.1 “(a) Food loss index and (b) food waste index”
TIER II
12.3 By 2030, halve per capita global food waste at the retail and consumer levels and reduce food losses along production and supply chains, including post-harvest lossesGeohiveRegional (county)2012
12.b.1 “Implementation of standard accounting tools to monitor the economic and environmental aspects of tourism sustainability”
TIER I
12.b Develop and implement tools to monitor sustainable development impacts for sustainable tourism that creates jobs and promotes local culture and productsUN StatsNational2019
13.2.2 “Total greenhouse gas emissions per year”
TIER I
13.2 Integrate climate change measures into national policies, strategies, and planningUN StatsNational2018
15.1.2 “Proportion of important sites for terrestrial and freshwater biodiversity that are covered by protected areas, by ecosystem type”
TIER I
15.1 By 2020, ensure the conservation, restoration, and sustainable use of terrestrial and inland freshwater ecosystems and their services, in particular forests, wetlands, mountains and drylands, in line with obligations under international agreementsUN StatsNational (recalculated for the local level using area statistics)2019
15.4.1 “Coverage by protected areas of important sites for mountain biodiversity”
TIER I
15.4 By 2030, ensure the conservation of mountain ecosystems, including their biodiversity, in order to enhance their capacity to provide benefits that are essential for sustainable developmentUN StatsNational
(recalculated for the local level using area statistics)
2018
17.1.1 “Total government revenue as a proportion of GDP, by source”
TIER I
17.1 Strengthen domestic resource mobilization, including through international support to developing countries, to improve domestic capacity for tax and other revenue collectionUN StatsNational2019
17.6.1 “Fixed Internet broadband subscriptions per 100 inhabitants, by speed”
TIER I
17.6 Enhance North–South, South–South and triangular regional and international cooperation on and access to science, technology, and innovation and enhance knowledge-sharing on mutually agreed terms, including through improved coordination among existing mechanisms, in particular at the United Nations level, and through a global technology facilitation mechanismGeohiveNational
(recalculated for the local level using population statistics)
2016
17.8.1 “Proportion of individuals using the Internet”
TIER I
17.8 Fully operationalise the technology bank and science, technology, and innovation capacity-building mechanism for least developed countries by 2017 and enhance the use of enabling technology, in particular information and communications technologyGeohiveNational
(recalculated for the local level using population statistics)
2016
Disclaimer/Publisher’s Note: The statements, opinions and data contained in all publications are solely those of the individual author(s) and contributor(s) and not of MDPI and/or the editor(s). MDPI and/or the editor(s) disclaim responsibility for any injury to people or property resulting from any ideas, methods, instructions or products referred to in the content.

