Article

Standardization of Power-from-Shore Grid Connections for Offshore Oil & Gas Production

1
IST, University of Lisbon, 1049-001 Lisbon, Portugal
2
INESC-ID/IST, University of Lisbon, 1000-029 Lisbon, Portugal
3
INESC-Coimbra & EST Setúbal, Polytechnic Institute of Serúbal, 2910-761 Setúbal, Portugal
4
CTS-UNINOVA & EST Setúbal, Polytechnic Institute of Setúbal, 2910-761 Setúbal, Portugal
*
Author to whom correspondence should be addressed.
Sustainability 2023, 15(6), 5041; https://doi.org/10.3390/su15065041
Submission received: 10 February 2023 / Revised: 4 March 2023 / Accepted: 8 March 2023 / Published: 12 March 2023
(This article belongs to the Special Issue Sustainable Integration of Renewable Power Generation Systems)

Abstract

:
Offshore oil and gas (O&G) production is typically powered by local diesel engines or gas turbines. Power-from-shore (PFS) is an alternative that takes advantage of onshore renewable production and reduces greenhouse emissions but is limited to bespoke projects that are tailored to the characteristics of each site. This lack of repetition leads to an increase in the construction risk, delivery time, and lifecycle costs, therefore limiting their large-scale deployment. Furthermore, the absence of standardized designs is also notorious in mature applications such as offshore wind farms (OWF) despite their long-standing track record, with the negative consequences extensively covered in the literature. This research paper addresses offshore transmission standardization in two parts. First, by providing the scientific community with a review of the existing offshore O&G production and substations and secondly, by outlining a lean optioneering algorithm for the cost-optimized and technically feasible selection of the key design criteria. The exercise is centred on the main limiting component of the transmission systems—the cables. As such, it addresses their operational range and the cost to calculate the most effective configuration in terms of voltage and rated power. The end goal, based on the spread of connection proposals, is to cluster the candidates to a limited set of grid connection options, the achievement of which the model has been shown to be adequate.

1. Introduction

1.1. Hypothesis

Offshore facilities are responsible for about 30% of oil and gas (O&G) production output. On-board power generation is typically based on diesel or gas turbines, often with a combined rating of several hundred MW [1,2]. Such power sources have efficiency ratios as low as 30%, in contrast to inland power generation that generally has a higher efficiency [3,4].
Two of the most common alternatives for powering these sites use local renewable generation in the form of offshore wind farms (OWF) [3,5] or power from shore (PFS) systems, based on high voltage alternated current (HVAC) or high voltage direct current (HVDC) [6]. Our proposal is to approach the offshore transmission design in a standardized fashion with the goal of reducing the cost of entry for O&G applications, as well as to increase the reliability and efficiency of the power supply setup.
From a technical standpoint, PFS systems require, in most cases, the use of both offshore and onshore substations and a cable interconnection between them. Onshore transmission systems are traditionally designed according to the requirements of their respective national transmission system operator (TSO) and thus already benefit from a high degree of standardization.
In contrast, however, offshore high voltage substations (OHVS) are tailored to the characteristics of each project developer (developer build concept) or to the interconnection operator (TSO build concept), and as such they do not share the same benefits. This leads to low design repetition and therefore to an increase in the initial capital investment (CAPEX) and lifetime operational costs (OPEX) [7].

1.2. Research Plan

Overall, our research is intended to address the following questions:
  • To what degree can offshore infrastructure benefit from standardization?
  • What is the impact of standardization on the overall cost and reliability?
  • What is the potential and solutions for a larger scale deployment?
The master plan to address this gap is to define a set of standardized engineering conceptual modules—further referred to as voltage and power envelops—which can be used solely and also combined for the preliminary design of offshore substation solutions. The analysis is a two-fold combination of the technical and economic aspects of the problem. It will encompass a review of most of the existing offshore substation portfolio associated to PFS and OWF, the cable solutions available in the market, their technical limitations, and associated costs. The main contributions of this paper are therefore:
  • An estimation of the power requirements of offshore O&G sites based on the installed base;
  • A design of an optioneering model to select adequate AC or DC voltage level and cables;
  • The definition of a limited set of AC and DC power/voltage envelopes towards standardization.
On the transmission side, because the voltage and rating of AC systems are capped by the cable used, a conventional cable model based on distributed parameters, together with a set of the most important AC technical limitations, will be used to determine the operating range of the voltage/power HVAC envelopes. The cost of the solution will refine and further restrict the operating range, finally confirming the break-even point for the HVDC alternative. Regarding the power requirements for the O&G site candidates, those will be clustered within these envelopes to validate their accuracy. Ultimately, the power rating required and the distance to shore shall determine the technology and setup to be used.
It is expected that this will allow developers to select the most cost-effective configuration depending on the production rate and the distance to shore of each site, and therefore reduce the CAPEX and OPEX of the energy supply setup. OHVS suppliers may optimize the engineering, increase project replication, and reduce execution risk.

1.3. Paper Organization

The outline of this paper is as follows. Section 2 presents the literature review. Section 3 shows the results of our review of the existing O&G and OWF portfolio, both in terms of existing substations, as well as candidate sites for PFS which will provide the substance for the model. Section 4 details the methods, particularly the models of the transmission systems used in the optimization exercise as well as the final optioneering tool itself. The resulting standardized modules for AC and DC are calculated in Section 5 and the conclusions are captured in Section 6.

2. Literature Review

In general, contributions towards the standardization of PFS are limited, this is particularly so in terms of holistic approaches regarding the voltage level and power ratings to be used across multiple project sites.
The available literature is heavily concentrated on improving substation design, yet not on the standardization of the ratings used, and is focusing heavily on onshore transmission systems. At the same time, there is limited information available on the production-specific rating of offshore production sites. The latter must be estimated based on the existing PFS-connected sites, which, as seen before, may carry a project-specific bias.
Our review further outlined and covered the performance and limitations of HVAC and HVDC systems that were built mostly as a result of knowledge gained from OWF research, their correlation with offshore O&G production, and ultimately the PFS concepts and their on-going modularization efforts.
There are multiple reviews available regarding the use of both HVAC and HVDC for OWF, as well as, for several oil and gas production sites. The review presented in [7] explains the substantial variability of the design standards, national technical frameworks, and commercial limitations, and includes the actual cost allocation to the multiple stakeholders involved during development and operation. Additionally, though patterns are emerging, several types of solutions are still being deployed offshore, including conventional offshore substations (usually self-standing and serving as the collector point for the offshore arrays), integrated substations (combining HVAC and HVDC infrastructure in the same substation) and offshore transformer modules (OTM).
As mentioned in [1] offshore O&G production sites may range upwards of several hundred MW and share many characteristics with large-scale OWF, thus the interest and feasibility of paring them together. The significant power requirements and the long distance limit the application of HVAC due to the high charging current in the cables and the voltage required to make the voltage/power envelope feasible, as validated in [8].
Small-scale OWFs are usually rated between 100–400 MW, located up to approximately 50 km from the shoreline and are based on HVAC (frequently 115 or 230 kV). Large-scale OWFs (which may be rated upwards of 1000 MW) are commonly positioned around 50–100 km from shore and may thus require the use of HVDC for the grid connection (frequently ±320 kVDC) [9,10,11]. The extensive use of HVDC in OWFs is also validated in [12]. By following on the research detailed in [13] it can also be observed that OWF projects located close to shore are typically connected via HVAC and may not require an offshore substation. For longer distances, HVDC is required. Concerning HVAC, multiple lessons learned from the use of reactive power compensation regarding solution and ratings have also been considered [14].
The comparative economic review of these solutions is also solid, and examples are included in [15,16]. The first reference provides a comprehensive HVDC optioneering review for a recent OWF, inclusive of reference costs for the major components which are considered in the current study. The second reference provides an extensive review of OWF projects in Europe and addresses the costs of the stations, transmission cables, reactive power compensation and valuation of losses for the different solutions. As such, the novelty factor is the combination of the technical and economic feasibility of these with the offshore O&G production site candidates to thus decide the best grid connection to be used.
Regarding the comparison between HVAC and HVDC offshore transmission, several advantages point to the latter. Though a higher voltage is usually recommended to reduce the ohmic losses, in the case of HVAC, this also means an increased cable capacitance, which limits the maximum distance allowed (around 55–80 km). This is also validated in [17,18,19,20], in which HVDC is shown to be more economic for distances, particularly those based on modular multilevel converter (MMC) architecture.
Additionally, it has been observed in [21] that, though HVDC is usually challenged from the commercial standpoint, the limitations for HVAC are mostly technical and therefore significantly harder to mitigate. This has led to HVDC becoming less prominent than HVDC, as the deployment of these systems offshore is deemed impractical for distances above 80 km. This has consolidated HVDC as the go-to solution for long overhead transmission lines (OHL) (upwards of 800 km), long distance subsea cables or asynchronous grid interconnections.
The limitations of HVAC versus HVDC are further addressed in [22], which shows that, due to the higher capacitance of subsea HVAC cables, there is a risk of resonance between the offshore and onshore grids, which may distort the voltage and ultimately damage the system. Additionally, since AC grids on both ends are synchronized, any faults on each end will propagate to the other end. HVAC cables are also usually more expensive, added to the fact that a minimum of three are required.
Concerning cables, another disadvantage of HVAC is the Ferranti effect during low-load conditions or sudden power flow reduction, as well as the reactive power compensation required. These risks do not exist in the DC alternative, with the additional upside of the latter having a faster control of voltage, and of active and reactive power (in the AC side of the converters).
Although HVAC is still predominant, there is a growing use of HVDC for OWF due to the limitations of the latter, particularly the VSC-based solutions [23] and including several multi-terminal topologies [24,25]. Another relevant finding is that a significant portion of the existing offshore HVDC connections has a single-pole design (metallic return path via electrodes) [26].
Regarding the technology that is particularly used for OWFs, the application of voltage-sourced converter (VSC) HVDC is evident in the concomitant decrease in use of the conventional line-commutated converter (LCC). This is due to several factors, including the fact that HVDC-VSC allows for a grid “black-start” (no need for alternated current (AC) voltage to be present at both ends), that no reactive power support is needed (although filtering to a certain scale is still necessary), and that there is improved and faster control of the voltage and power flow in the DC part [27].
Another approach often mentioned [21] for offshore HVDC is the deployment of back-bones, which may interconnect several sites at the same time. In this case, a single offshore link would serve as a collector system for multiple HVDC or HVAC offshore sites, whether those are OWF or O&G. This is of particular interest since it facilitates the combination of OWF to power O&G sites.
There are already some examples of the deployment of HVDC for power-from-shore, particularly in the North Sea [3], these include the Troll A, Valhall and Johan Sverdrup fields/platforms, all of which are based on voltage-sourced converters HVDC (HVDC-VSC). Different topologies are also addressed in the same review along with an individual reliability assessment. The same is true for OWFs such as the Borwin 1 and 2 and the Dolwin 1 and 2.
The Troll A case study is detailed in [28] and was the first of its kind for this type of application, serving as a stepping-stone for the later development of a similar solution for the Valhall field. The differentiating factor is that this research also reviews the challenges faced, such as the higher personal safety standards, the harsh sea environment and the coordination required between the power grid and the plant control system.
The Valhall field case study presented in [29] and reviewed in [30] is also based on HVDC-VSC and shares the same design considerations as Troll, such as the modular and highly compact design installed directly on the offshore platform. After five years of operation, the system was deemed as having an “excellent performance”.
The Martin Linge field, on the other hand, is still a testimony, under very specific conditions, to the suitability of HVAC [31]. This system is the longest HVAC PFS in operation, with a cable step-out distance of 161km and a rated power of 55MW. However, the reactive power compensation required varies between 50–75 MVAr—higher than the active power demand—and is based on the combination of a 50 MVAr static-var compensation (SVC) and a shunt reactor, both installed offshore. The implementation of additional design measures were also required for protection system coordination and for offshore cable monitoring.
References on onshore [32] and offshore [27,33,34,35] transmission systems and substation optimization were also reviewed. While the references found are frequently focused on the optimization of the offshore collector system of OWFs, the latter three present multiple algorithm approaches for substation placement and grid layout optimization and a distinct approach based on energy production and operational losses, while providing methods to address the uncertainty of OWF output. These models feature probabilistic and deterministic approaches.
Additional references [36] confirm the lack of an optimized and standard approach to PFS projects while attempting to develop models and tools that would allow for a holistic approach to offshore grid connection selection and design. Alternatives, such as interconnections between platforms, were found to be less effective than a PFS or satellite OWF.
Other references [37] also acknowledge the lack of a standardized design concept, especially for HVDC, and call for attention on the platform size and system maintenance, while the costs are concentrated on civil engineering and installation. These references situate an overall break-even point between HVAC and HVDC at roughly 100 km from shore but do not elaborate on a possible optimization based in installed base or market potential.
The modular design has proved successful before, as outlined in [38]. Although the complexity of standardization is acknowledged, multiple modularization use-cases are presented, maximizing, in several instances, the advantages of compact gas-insulated switchgear (GIS) and digital substations. The modular concept used is a pre-engineered solution which can be deployed individually or in a combination of modules to provide a complete turn-key modular substation. Multiple strategies to build offshore models and optimization tools for substations have also been reviewed [39,40].
Finally, the design and therefore the rating of a PFS must consider the lifetime operating conditions to minimize not only losses but also over-sizing. Other measures are the minimization of offshore auxiliary areas, such as accommodation, which are replaced by emergency over-night stay areas, workshops and storage.
Finally, in some cases, due to the limitations of the cranes used for installing single-lift solutions, preference could be given to self-installing solutions. Lessons learned from recent HVDC projects have also been reviewed [41]. PFS solutions [42], as well as hybrid approaches (e.g., offshore heat generation combined with PFS) [4], were also confirmed to bring the most effective reduction of CO2 emissions.
CO2 taxation has been identified as a decisive factor in the evaluation of PFS [43] and affects the total life cycle assessment (LCA) cost. Due to the high variance in factors such as the offshore fuel cost and the said taxation across the world, our study only takes the CAPEX evaluation as a decision criterion. The impact of the onshore grid development [44], the offshore substation positioning and cable routing [45] are also noted, both impacting the overall design, particularly where a multi-platform scenario would be considered.
Another conclusion found in [46] is that having a clear interface means that modularization will not compromise competitiveness and builders can thus make use of the significant product portfolio available. From a life cycle perspective, the modular approach also takes advantage of the long service life of the main components of the substation, such as power transformers and the protection, control, and monitoring system. This means that not only is the overall reliability high, as the interfaces are standardized, but it is also significantly easier to replace a component (sub-module).

3. Research Material

The foundation of the optioneering model detailed further in this research is the existing offshore portfolio, which comprises two stages. First, by identifying the existing OHVS (both OWF and PFS) and respective cable systems, it is possible to understand the solutions usually deployed and the corresponding project characteristics. Secondly, the parts of the offshore O&G portfolio are to be classified as candidates and their power requirements estimated based on an indicative power-to-production ratio drawn from existing PFS in operation.

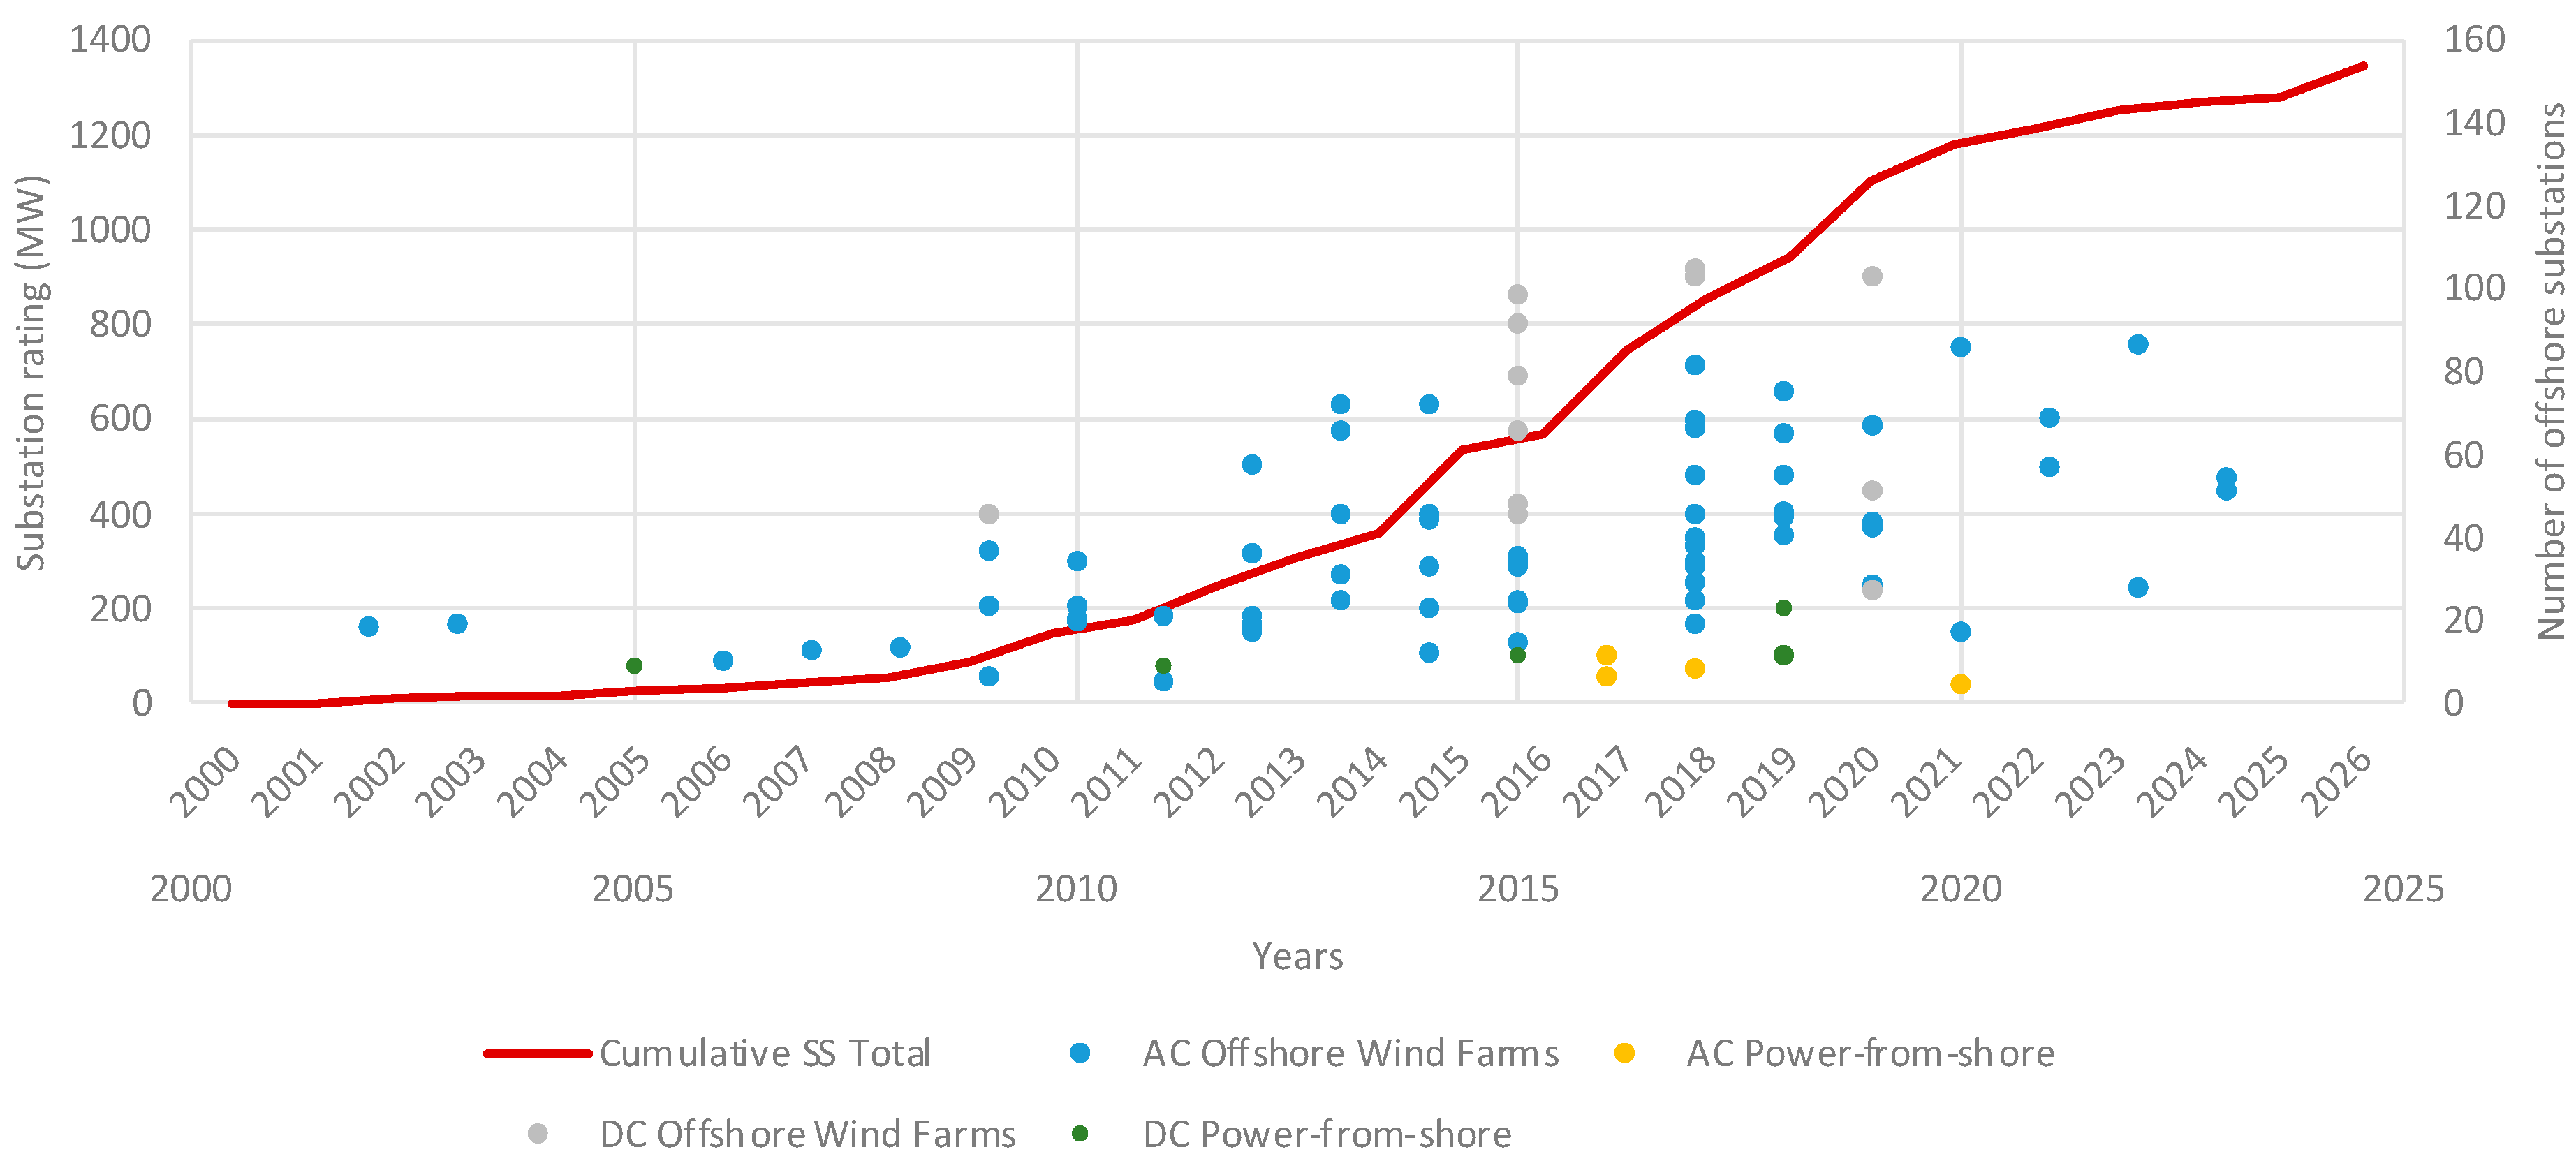
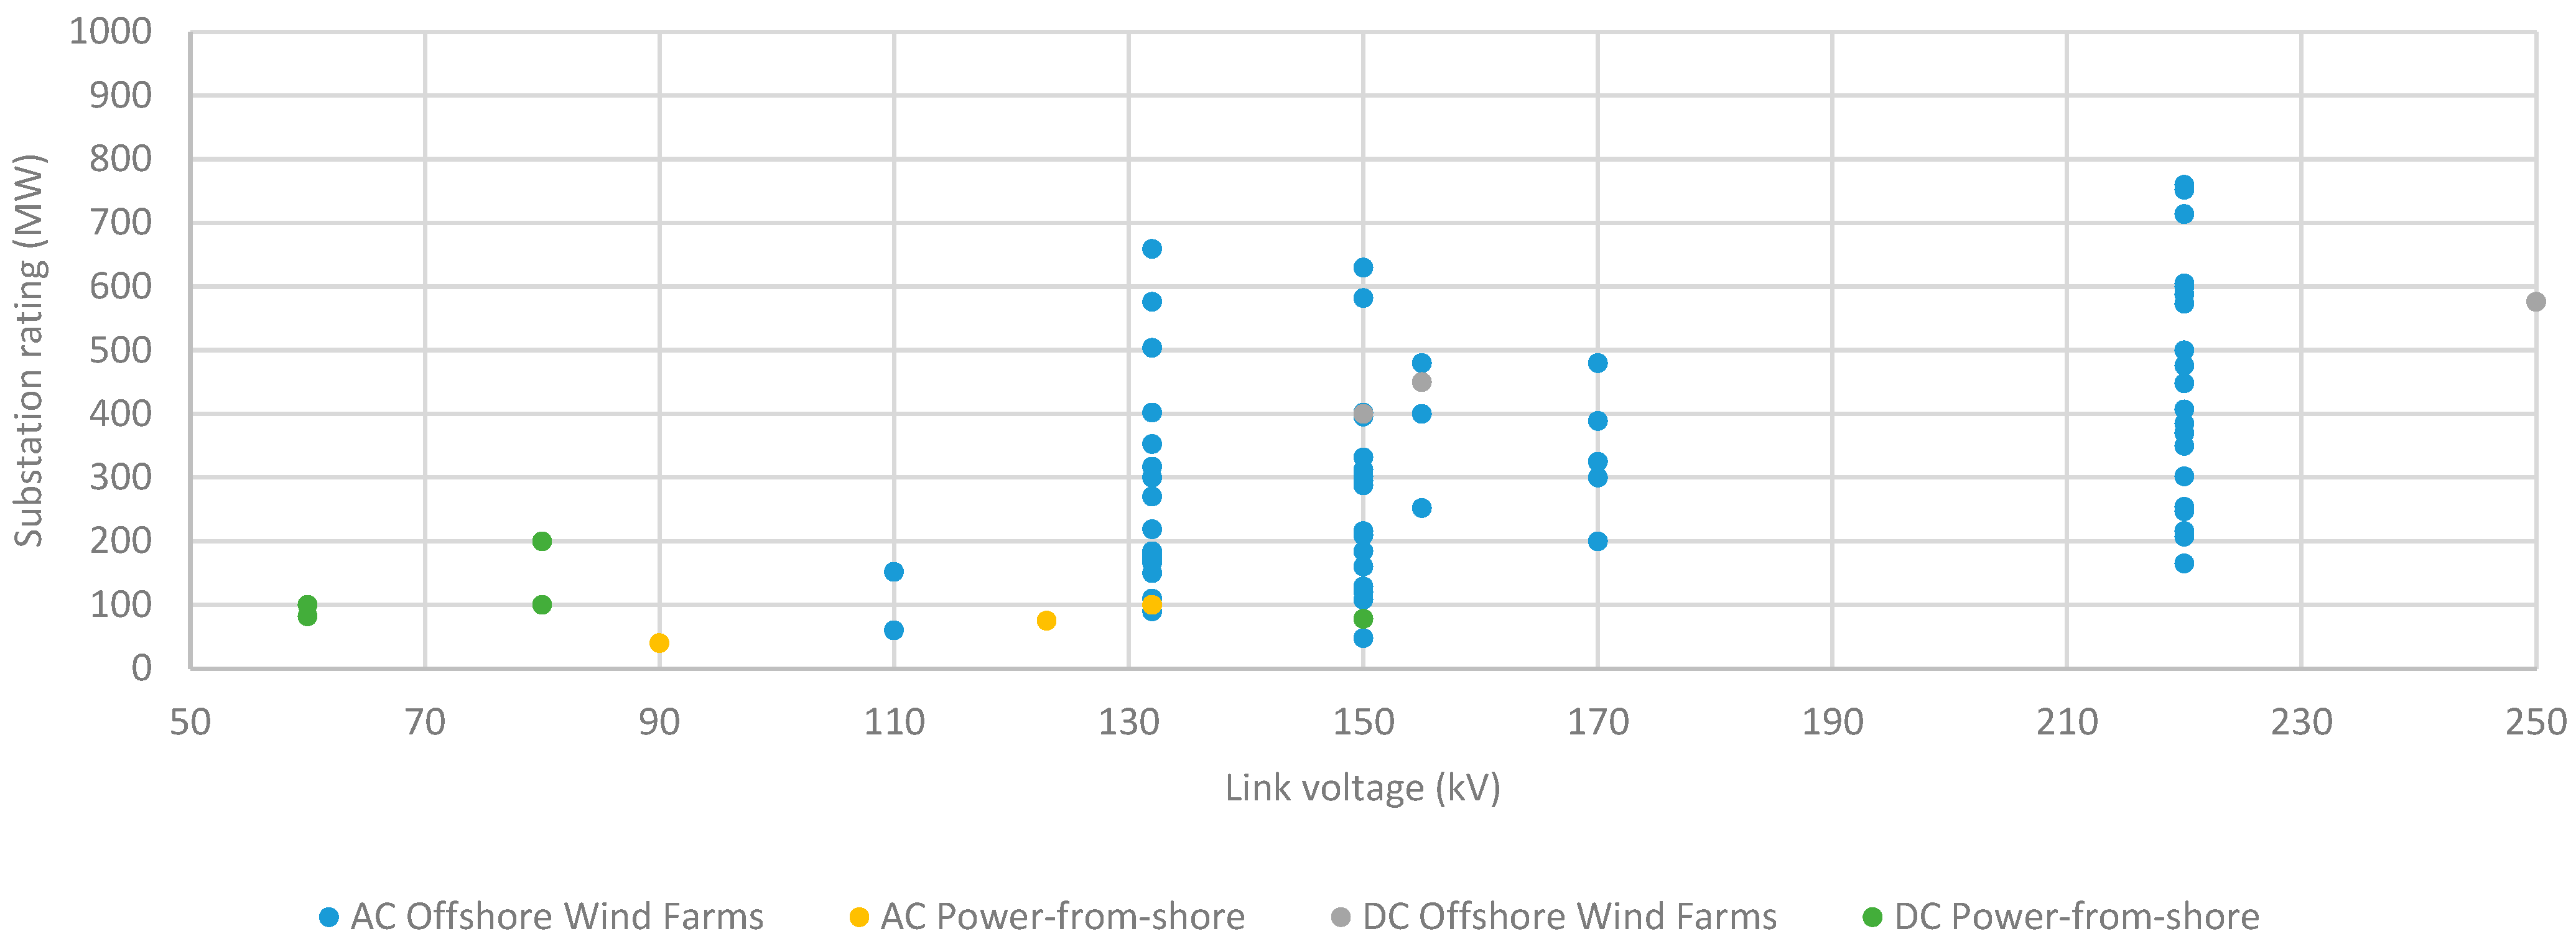
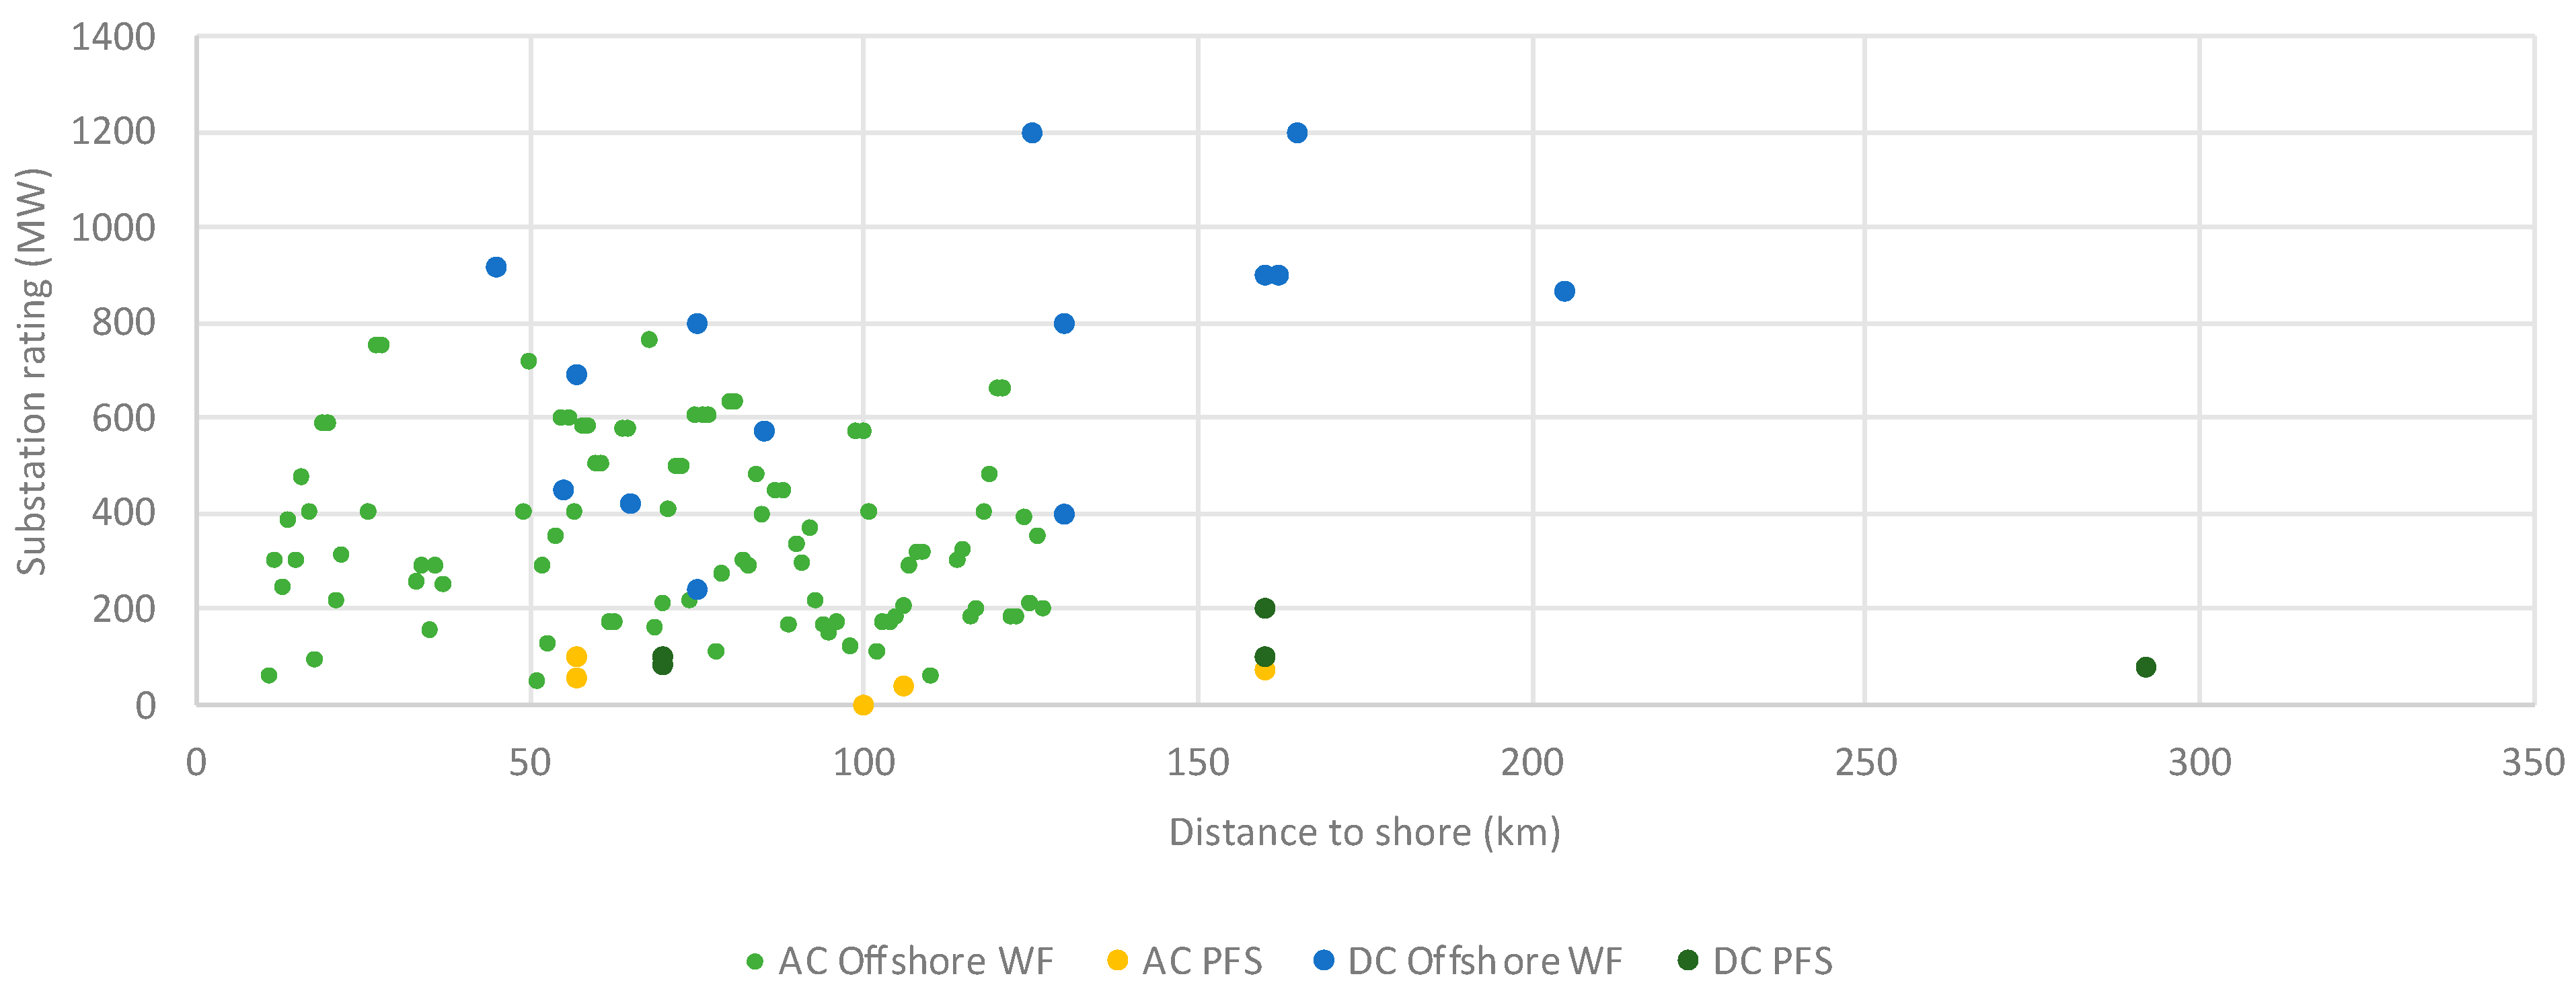
3.1. OHVS and PFS Installed Base

Research from 160 sites worldwide represented in Figure 1 shows that the OHVS data gathered has grown significantly since 2010 both in number of sites as well as in power rating, with additional projects ongoing for applications in both OWF and O&G [47]. The cumulative number of OHVS commissioned yearly (dark red line), plus their individual power ratings and year of commissioning, are also illustrated (dots). These are colour-coded based on their application.
The breakdown of these existing sites in voltage/power envelopes is represented in Figure 2. More than 80% of the sample data pertains to HVAC substations. Therein a concentration of about 84% on the 132, 150 and 220 kV levels was found, with total power rating ranges of up to 1500 MW. On the MV side, the 33 kV level is predominantly used, with lower voltages also being used in some cases.
HVDC connections on the other hand are positioned across almost all the voltage range up to 320 kVDC with an interesting concentration of the 60–80 kVDC range, whereas their power ratings go up to 200 MW. The number of DC PFS is limited and was already addressed to some extent in the literature review; The voltage mentioned for the DC sites is the one of the DC link.
Most of the PFS evaluated are rated at up to 100 MVA and half of those based in HVDC. Extremely large wind farms, which are supplied via HVDC, are connected at up to 300 kVDC and 900 MW. Figure 3. represents the same offshore substations based in their distance/rating tuples.

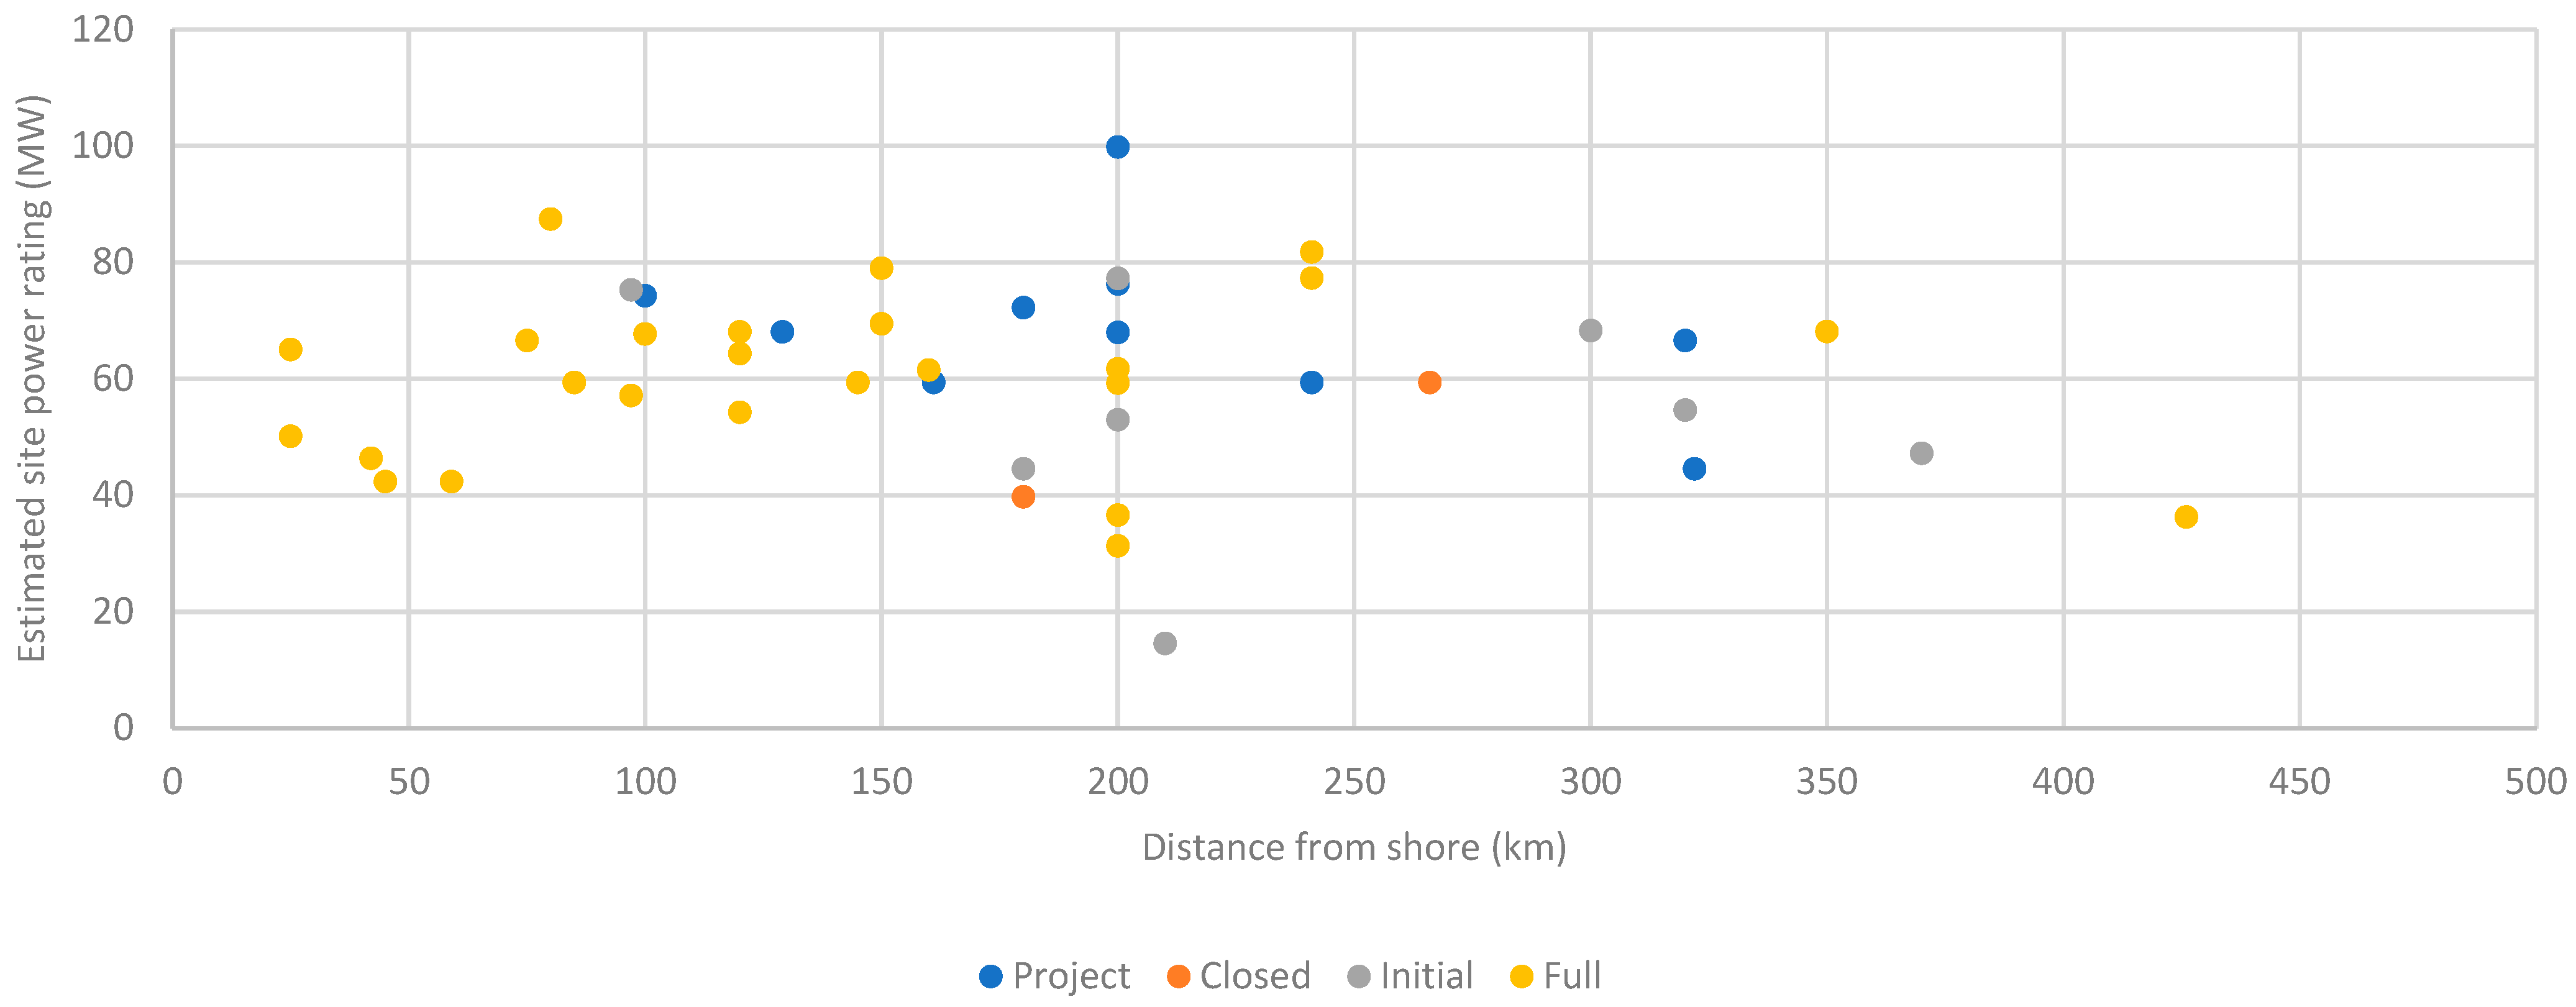
3.2. Evaluation of O&G Portfolio

The rated power and daily output of existing PFS-connected sites is shown in Figure 4. The ratio P B o E between the PFS rating and the daily output (in barrels of oil-equivalent, BoE) varies from 0.14 to 4.55 MW/kBoE (there are identifiable artifacts in the sample data, for example due to the expansion foreseen for the Johan Sverdrup and Nasr field location at the time the offshore link was erected). A logarithmic trendline over the power/oil production output tuples provided the approximate regression.
The power requirement P e can therefore be calculated based on the equivalent oil production level of each site p B o E by using the expression from said logarithmic trendline (1). This correlation allows us to calculate a set of coefficients later used to estimate the rated power of candidate sites (which are those currently based in onboard generation), as in Figure 5.
P e = 13.011   ln p B o E 59.649
The review extended to over 1000 locations, from which roughly 100 had sufficient data for evaluation at this stage, which was undertaken via web scraping of a combination of project press, governmental and corporate reports. The candidates are represented in Figure 5, inclusive of their distribution along the power and distance range and separated according to their status.
A minimum power rating evaluation threshold of 10 MW was established for very low production sites, whereas “Initial” stage sites have not reached their peak production, as the ones in the “Full” stage have. “Closed” sites are not valid candidates since they are being or have been decommissioned. Despite some outliers, there is a strong concentration (around 64%) on the ratings between 50–80 MW, whereas the remaining sites are mostly positioned from 30–50 MW and 80–100 MW. However, the distance ranges up to about 450 km. About 49% of the sites are in the “Project” stage, meaning that the PFS can be considered in the initial design optioneering.

4. Research Method

This section focuses on the grid access optioneering model as outlined in Figure 6.

4.1. Cable Portfolio

The operational boundaries of a transmission solution are mainly dependent on the cable system used. The review is based on a known cable manufacturer as in [48,49], due to their extensive standard range in both AC—10–275 kV (3-core cables) and 220–400 kV (3-core cables), up to 1000 and 1600 mm2 respectively—and DC—80, 150 and 300 kVDC, up to 3000 mm2.

4.2. Model Reference Data

The data on the model are composed of primary and secondary databases. These are the existing offshore substations (namely their voltage and rating), the offshore O&G candidates (with estimated rated power), and finally the HVAC and HVDC cables. Secondary databases, including the reference guidelines and regulations (Table 1), the initial conditions and failure triggers of the HVAC transmission (Table 2 and Table 3—in next section), as well as the cost elements for the HVAC and HVDC transmission from (Table 4 and Table 5—next section) were also incorporated.

4.3. HVAC Transmission Model

Due to their characteristics, cables cap the maximum power transmission as well as the maximum step-out distance allowed. The voltage/power envelopes are calculated based on the transmission line model reviewed in [50] whose equations are represented in (2) and simplified in (3). In this model, the line impedance coefficients ABCD incorporate the distance factor of each site.
[ U r I r ] = [ cosh Z L Y T Z L sinh Z L Y T   Z L Y T Y T sinh Z L Y T   Z L Y T   cosh Z L Y T ]   [ U e I e ]
[ U r I r ] = [ A B C   D ]   [ U e I e ]
Wherein the line impedance parameters are calculated as in (4) and (5):
Z L = ( R + j X L )   l
Y T = ( G + j B )   l  
The additional variables are calculated as detailed in (6)–(10):
P r = 3   U r   I r   cos φ
Q r = 3   U r   I r   sin φ
U 0 = A   U e
I 0 = C   U e
φ = φ U r φ U e

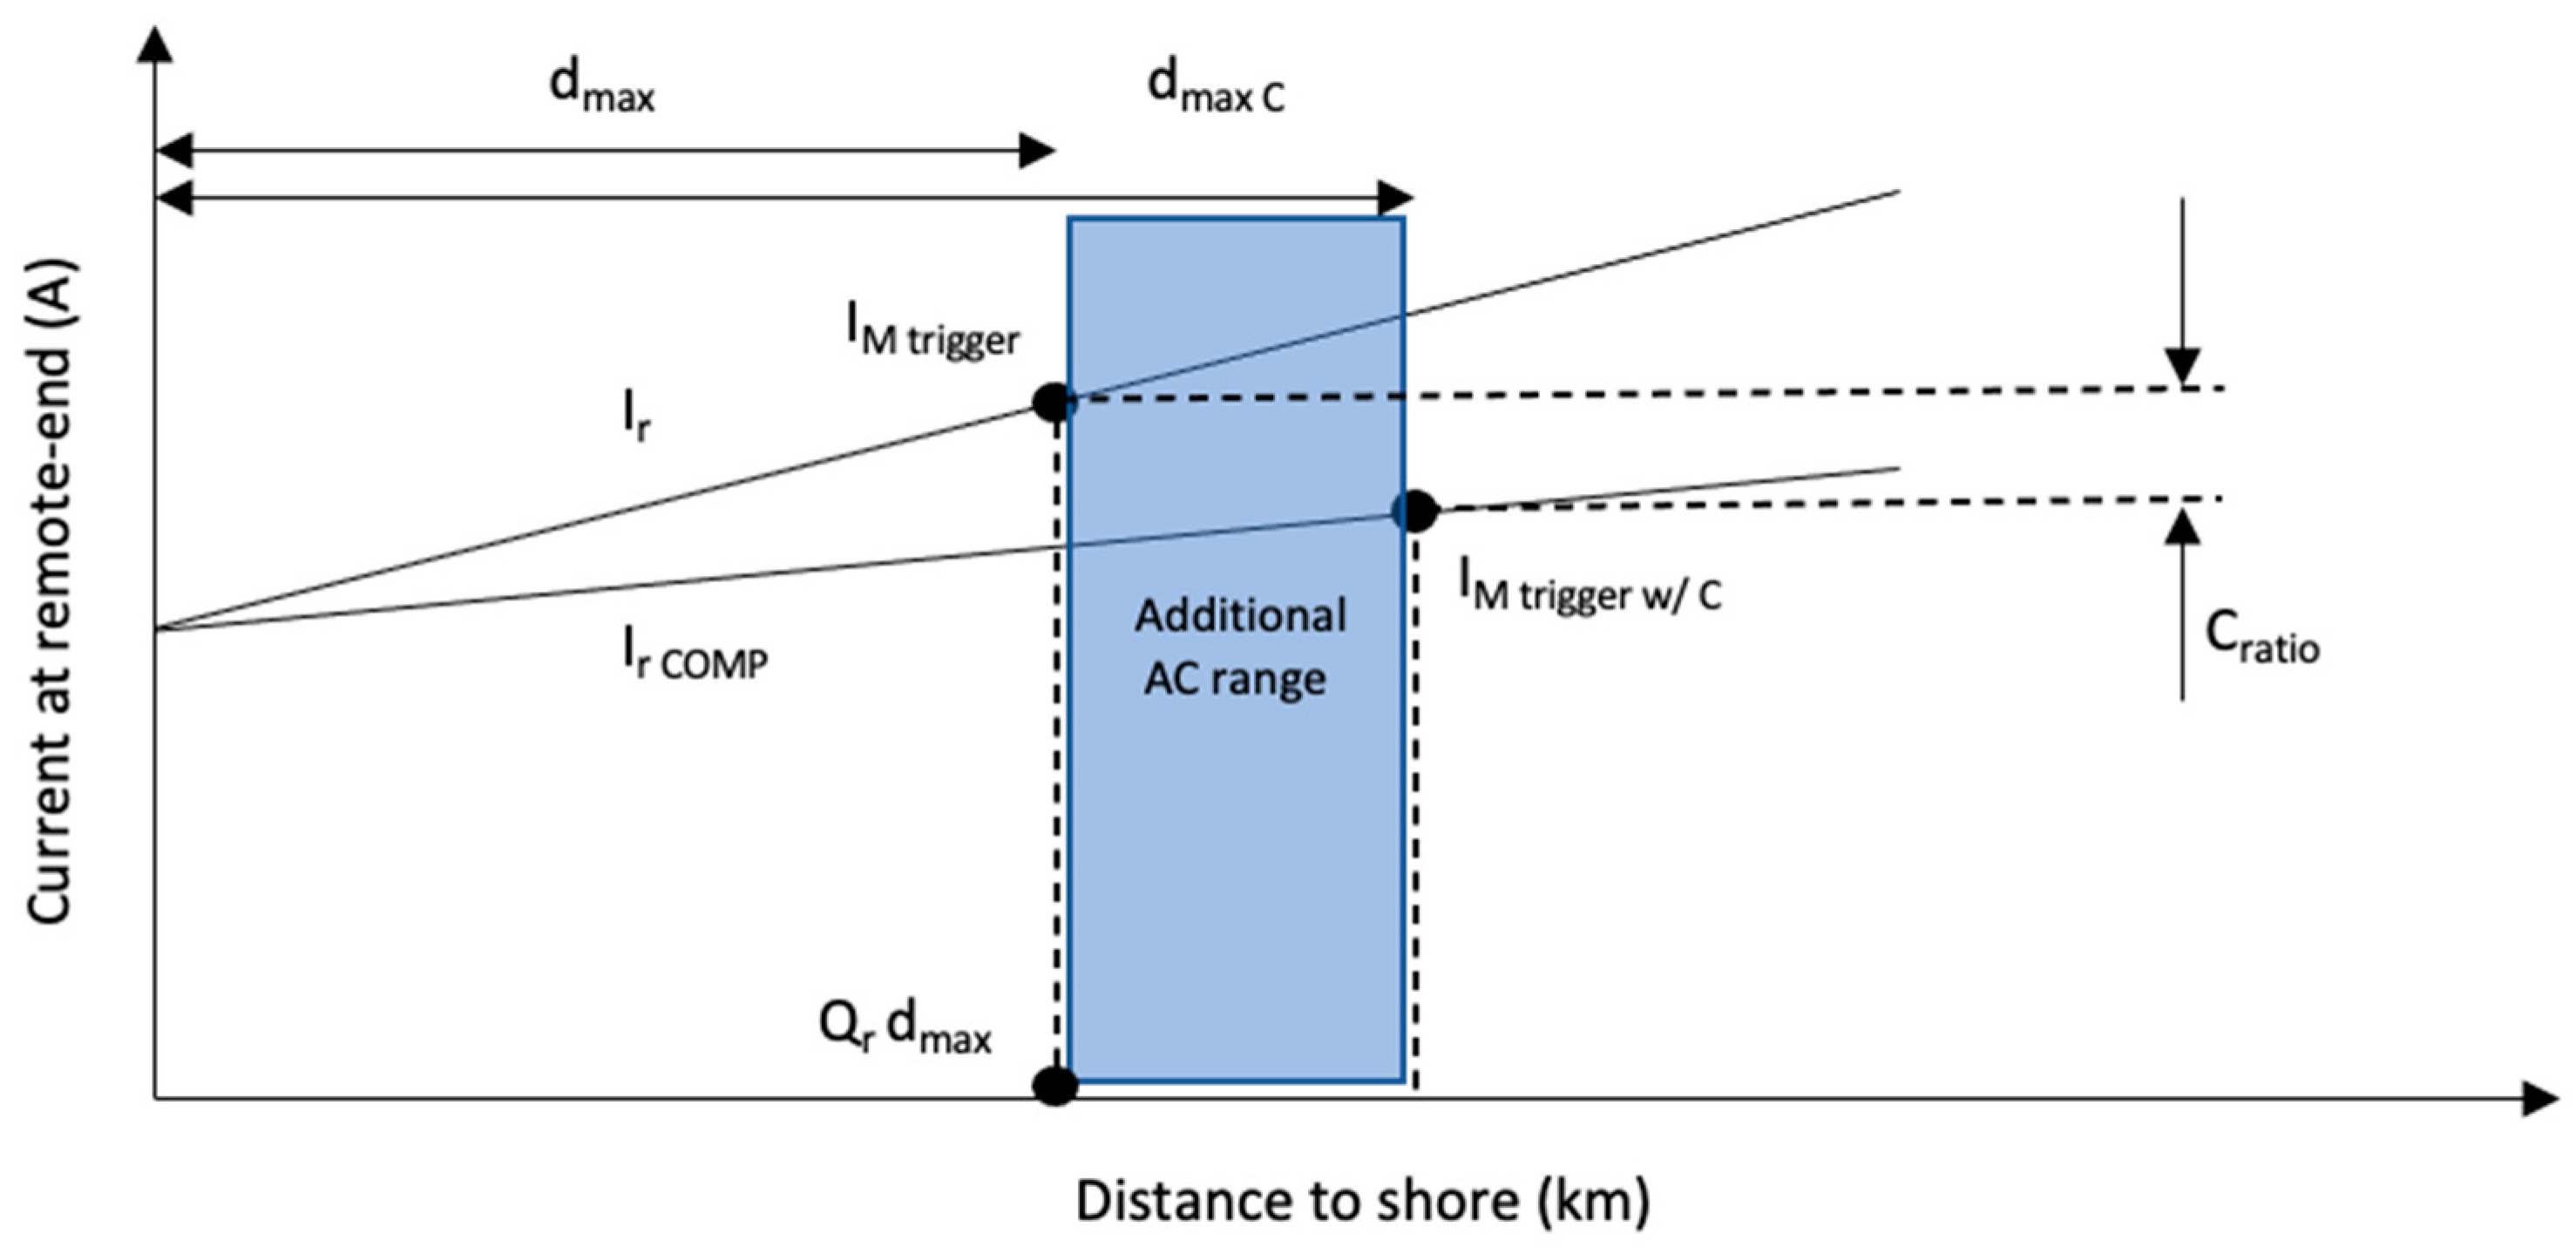
4.4. HVAC Transmission Initial Conditions and Triggers

The assumptions and pre-conditions of the model (Table 2 and Table 3), are supported in the references presented in Table 2.
Table 1. DNV-GL regulations and guidelines for offshore substations and cables.
Regulation or GuidelineDocument Description
DNVGL-ST-0145Offshore substations
DNVGL-RP-0046Qualification of HVDC technologies
DNVGL-RP-0423Manufacturing and commissioning of offshore substations
DNVGL-ST-0359Subsea power cables for wind power plants
DNVGL-RP-F401Electrical power cables in subsea applications
CIGRE Technical Brochure 483Guidelines for the design and construction of AC OSS for WPP
DNV-OS-J201Offshore substations for wind farms
Commission Regulation (EU) 2016/631 ENTSO-ENetwork code on requirements for generators
The source documents are those identified in the “Regulation or Guideline” column. The authors have incorporated the guidelines and standards from regulatory bodies such as DNV-GL (one of the most recognized testing and certification bodies in the offshore electrical industry), CIGRÉ and the European Commission, especially in the model construction and optioneering algorithm boundaries. Also projects where renewables are directly interconnected with O&G platforms were considered [51].
Table 2. Initial conditions for HVAC transmission model.
VariableUnitsInitial ValueCommentsReferences
Rated voltage%100
Cable de-rating%80Combined factor due to installation conditions
(e.g., temperature, depth, pressure, etc.)
[49,52]
Cable loading%80
Power factorN/A1.0Typical power factor at offshore
production facilities is 0.7
[53]
Table 3. List of failure-triggering conditions for HVAC transmission model.
TriggerUnitsTrigger ValueCommentsReferences
Max./Min.
Voltage
%90–105Voltage stability requirement for AC-connected offshore power park modules[54]
Cable rating%100Current shall not exceed the thermal limit inclusive of any de-rating factors[50]
No-load current%100Current shall not exceed the thermal limit inclusive of any de-rating factors[50,55]
No-load voltage%95–105Voltage stability requirement for AC-connected offshore power park modules[54,55]
Static stabilityº30The voltage angles between the remote ends shall not lead to loss of synchronization[50]
The key deciding triggers are the increase in voltage along land or subsea cables under no-load conditions (also referred as the Ferranti effect, due to the capacitive characteristics of such cables [55]) and the stability criteria, as the lack of proper reactive power support may lead to voltage collapse (remote end’s active power demand and power factor) [50]. The typical power factor of offshore platforms is 0.7 (inductive). It has, however, been identified that this offsets the capacitive characteristic of the cable, and since it depends on the operating conditions of the site, a power factor of 1.0 was used in the model.

4.5. HVDC Transmission Model

DC solutions do not have the same limitations, especially in terms of maximum distance, as found in HVAC [56] and for that reason they are the answer for the unaddressed market of the former—from a technical standpoint, the HVDC alternative can provide energy access to any candidates. The basic transmission equations of HVDC are included in (11) and (12).
I D C = U D C 2 U D C 1 R L
P D C 1 = P D C 2 + R L I D C 2 2
The voltage and current in the transmission system are calculated based on the equivalent DC circuit. The maximum distance of DC applications is only capped by the thermal limits of the power cables and voltage drop, which can in normal conditions be compensated by the remote end converters. The voltage/power envelopes can be directly drafted from the existing cable portfolio.

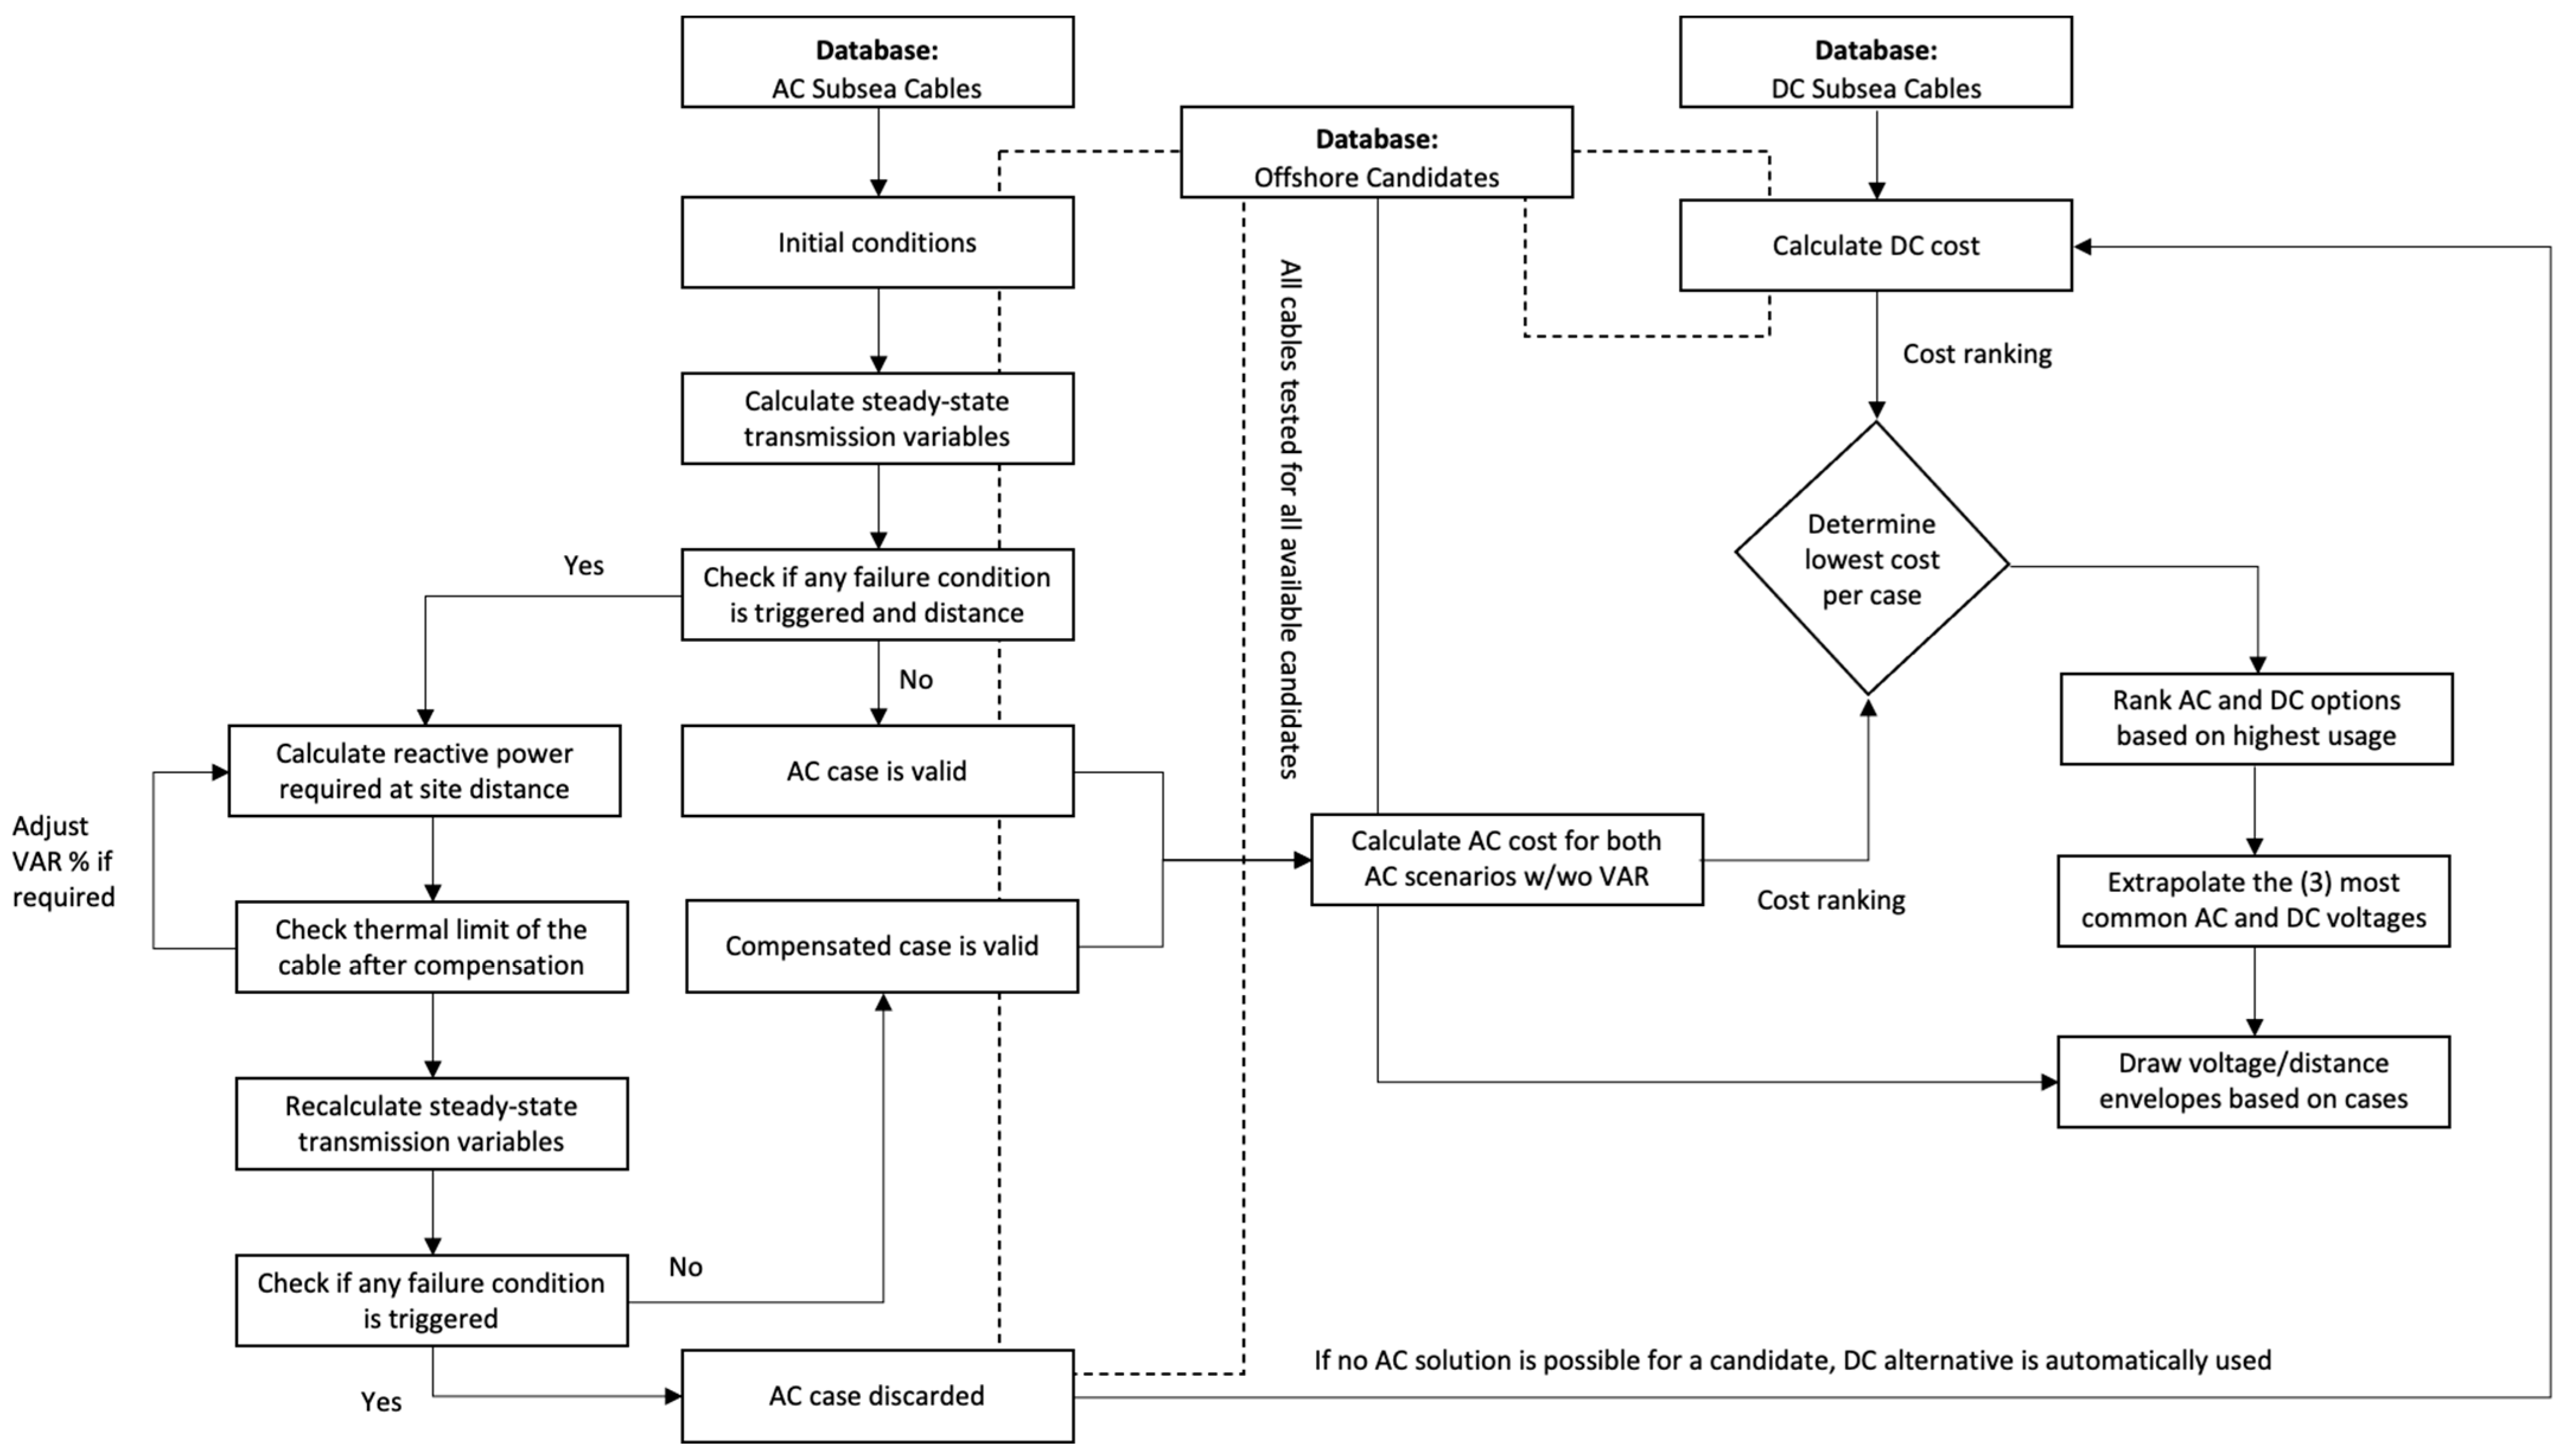
4.6. Optioneering Model

For each candidate, the algorithm will calculate the possibilities via AC and DC. Reactive power compensation is estimated (within the thermal limits of the cables) to extend the AC range. The maximum distance d m a x k for each cable is determined in (14) based on the minimum value of distances x t r i g g for each variable value y t r i g g that matches the trigger values in Table 3 as in (13).
x t r i g g = x 1 + ( y t r i g g y 1 )   ( x 2 x 1 ) ( y 2 y 1 )
d m a x k = min ( x t r i g g 1 , x t r i g g 2   x t r i g g n )
Figure 7 exemplifies how the maximum distance (16) is calculated based on each triggered distance (15):
The compensation typically required for HVAC subsea cables is of the inductive kind— Q V A R is calculated, based on the reactive power value at the distance of failure Q r d m a x as shown in Figure 8, to be located 100% onshore and incorporated in the model as in [57]. This calculation accounts for the admissible current of the cable, by calculating the ratio C r a t i o —that way, the maximum compensation current which can be injected in the cable without triggering the cable rating from Table 3, (15) and (16) is assessed:
C r a t i o = I M I r I M
Q V A R = C r a t i o   Q r d m a x
The equivalent shunt reactor is calculated and introduced by adjusting the admittance coefficient Y T as in Figure 9.
The AC solutions which cannot meet the required power rating and/or fail the minimum distance are discarded and the DC alternative is utilized instead. The results will then be clustered by the transmission technology used, voltage level and cable size, showing the respective count of sites that can be connected.

4.7. Cost Models for HVAC and HVDC

For both HVAC and HVDC costing, aside from the initial review, a large sample of data were addressed, combining the data from multiple sources combining both commercial projects and academic research [12,58,59,60,61,62]. The cost coefficient ranges presented in Table 4 and Table 5 will be used for the economic evaluation of the proposed modules.
Table 4. Cost coefficients for HVAC offshore transmission systems.
Land Cable (Supply and Installation)
[MUSD/MVA × km]
Submarine Cable (Supply and Installation)
[MUSD/MVA × km]
Onshore
Substation
(EPCI)
[MUSD/MW]
Offshore
Substation
(EPCI)
[MUSD/MW]
VAR Compensation (SVC-Type)
[MUSD/MVAr]
Development and Other Costs [%]
4.44.60.0540.1940.19.0
Table 5. Cost coefficients for HVDC offshore transmission systems.
Land Cable
(Supply & Installation)
[MUSD/MVA × km]
Submarine Cable
(Supply & Installation)
[MUSD/MVA × km]
Onshore Substation
(EPCI)
[MUSD/MW]
Offshore Substation
(EPCI)
[MUSD/MW]
Development and Other Costs [%]
2.93.10.1370.2779.0
For the feasibility evaluation, as it is captured in the optioneering algorithm, only the initial capital expenditure (CAPEX) is calculated and is used to rank the AC, the compensated AC and the DC proposals. For the CAPEX of each connection alternative c n , the subsystems detailed in Table 4 (for AC solutions, particularly the VAR cost for the compensated AC alternative) and Table 5 (for DC solutions) were included, and the total cost was estimated based on the applicable power-based cost coefficient c M V A , the distance-based coefficients c k m or a combination of the two c M V A k m to the site characteristics (distance, rating).
This is described in (17):
c n = ( P   c M V A + d   c k m + P   d   c M V A k m ) ( 1 + c % )

4.8. Objective Function

The optimal cost solution (OS, built in either AC, compensated AC or DC) is determined as in (18) as the least expensive technically feasible solution based on each connection configuration as explained in 3.4 and illustrated in Figure 10. Each site will have multiple grid connection proposals which are deemed feasible (ranges in Figure 10) hence the optimum solution for each offshore candidate is the solution of least cost (OS) across all possibilities. Once the candidates are suited with the most cost-effective AC or DC configuration, the model proceeds to find the best clusters.
O S =   min ( C A C , C A C   w /   V A R , C D C )
Figure 10 is representative of the model operation and not specific case data, hence the absence of units in the axis. The goal of the mentioned figure is to introduce the reader to the idea that the output of the three main technical solutions (AC, compensated AC and DC) are a range of each—there are several solutions which are technically feasible in either. The algorithm, within the overlap of these ranges, will select the most cost-effective solution.
The loss capitalization and operational costs would require a detailed evaluation that incorporates, for example, the uptime of each facility, the expected lifetime of the site, fuel, and CO2 taxation, which is outside the scope of this review. Additionally, both the cost of onshore energy production or the fuel at the offshore side, in addition to the country- or region-specific regulations, namely tariffs, taxes, fees, or bonds would not allow for a solid comparison across all candidates given their geographical distribution. For that reason, the decision that remain are based only on the CAPEX.

5. Results

5.1. Model Validation
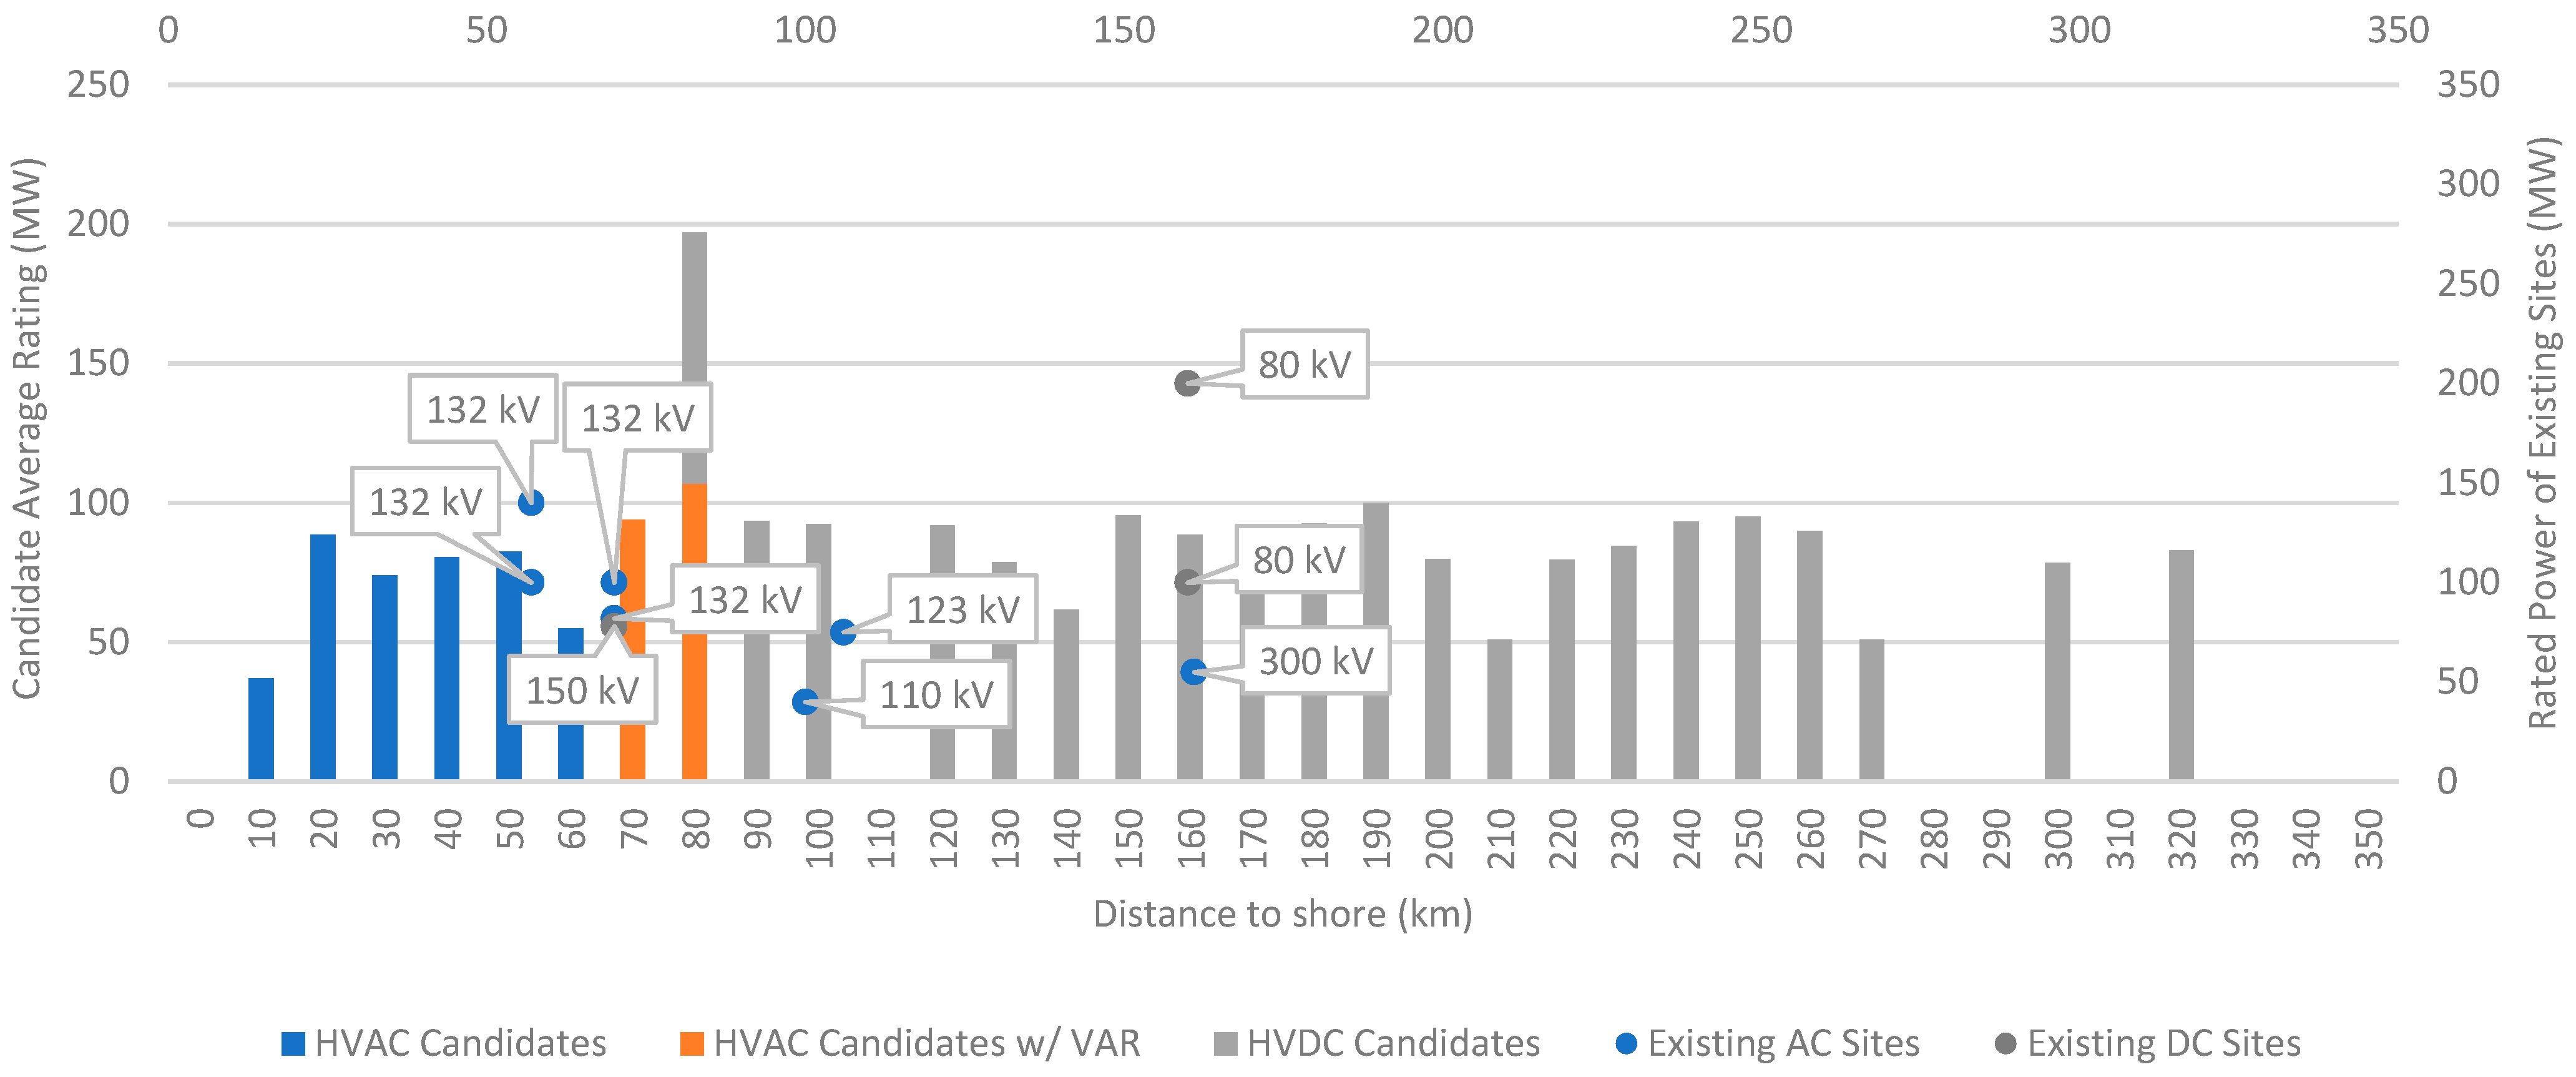
The model was validated based on the existing offshore connections, particularly the existing PFS. Figure 11 shows the distance and average power rating of the candidates (columns) as well as the existing PFS sites (dots), colour-coded based on the technology used. The maximum distance output matches the expectations set in Section 1 [63] to about 70–80 km.
The plot is a combination of bar/scatter. The left-hand axis represents the candidates’ ratings (bar plot, colour coded depending on the grid connection technology used), whereas the right-hand axis represents the scatter plot (rating of existing sites). There is a good overlap of the estimated connections over the existing sites, yet there are also several outliers (in existing connections) that are also identifiable where HVAC is used at long distances by means of a much higher voltage (e.g., 300 kV). Since the decision is made on cost (after technical clearance of the solution) these kinds of results are expected.

5.2. Model Results

Figure 12 shows the number of sites for each technology with reference to the voltage level and cable size used. Following 80 kVDC, the most common solution for AC is at 220 kV, followed by 132 and 66 kV. From a technical standpoint, about 25% of the candidates can be supplied using AC, however once cost is factored in, the usage of DC is close to 90%.
As illustrated in Figure 13, the low usage of HVAC is mainly due to the average site distance (80% are above 100 km) paired with a typically high rating (80–100 MW). This leads to the use of oversized cables to ensure that the distance and the voltage criteria are met so as to operate significantly below their natural load. Comparing with DC, that solution is not cost efficient.
The compensation required averaged 100% of the rated power at the remote end and, in some cases, totaled around 170%, both of which are hardly viable from a commercial standpoint, as already proven in Figure 14. For about 45% of the sites, it is feasible to connect in AC without reactive compensation, which is due to the cost of stations and cables being of a higher cost than the compensation, even at the expense of using highly oversized cables (630 to 1000 mm2). Finally, Figure 15 shows that the HVDC alternative is generally more cost-effective especially as the distance increases.
Figure 15 is intended to provide the reader with a view of the CAPEX evolution with the increase in the size of the grid interconnection. This sustains the claim that HVDC solutions tend to be more cost-effective for the ever-increasing size of OWF and O&G production sites.
This cost similarity between the AC and DC solutions in a range of 80–100 km supports the economical break-even threshold mentioned in the literature. Another observation drawn from the model is that there are cases (about 5%) where the distance is so large, above 300–400 km, that it may make more sense from a commercial standpoint to remain with the on-board power generation.

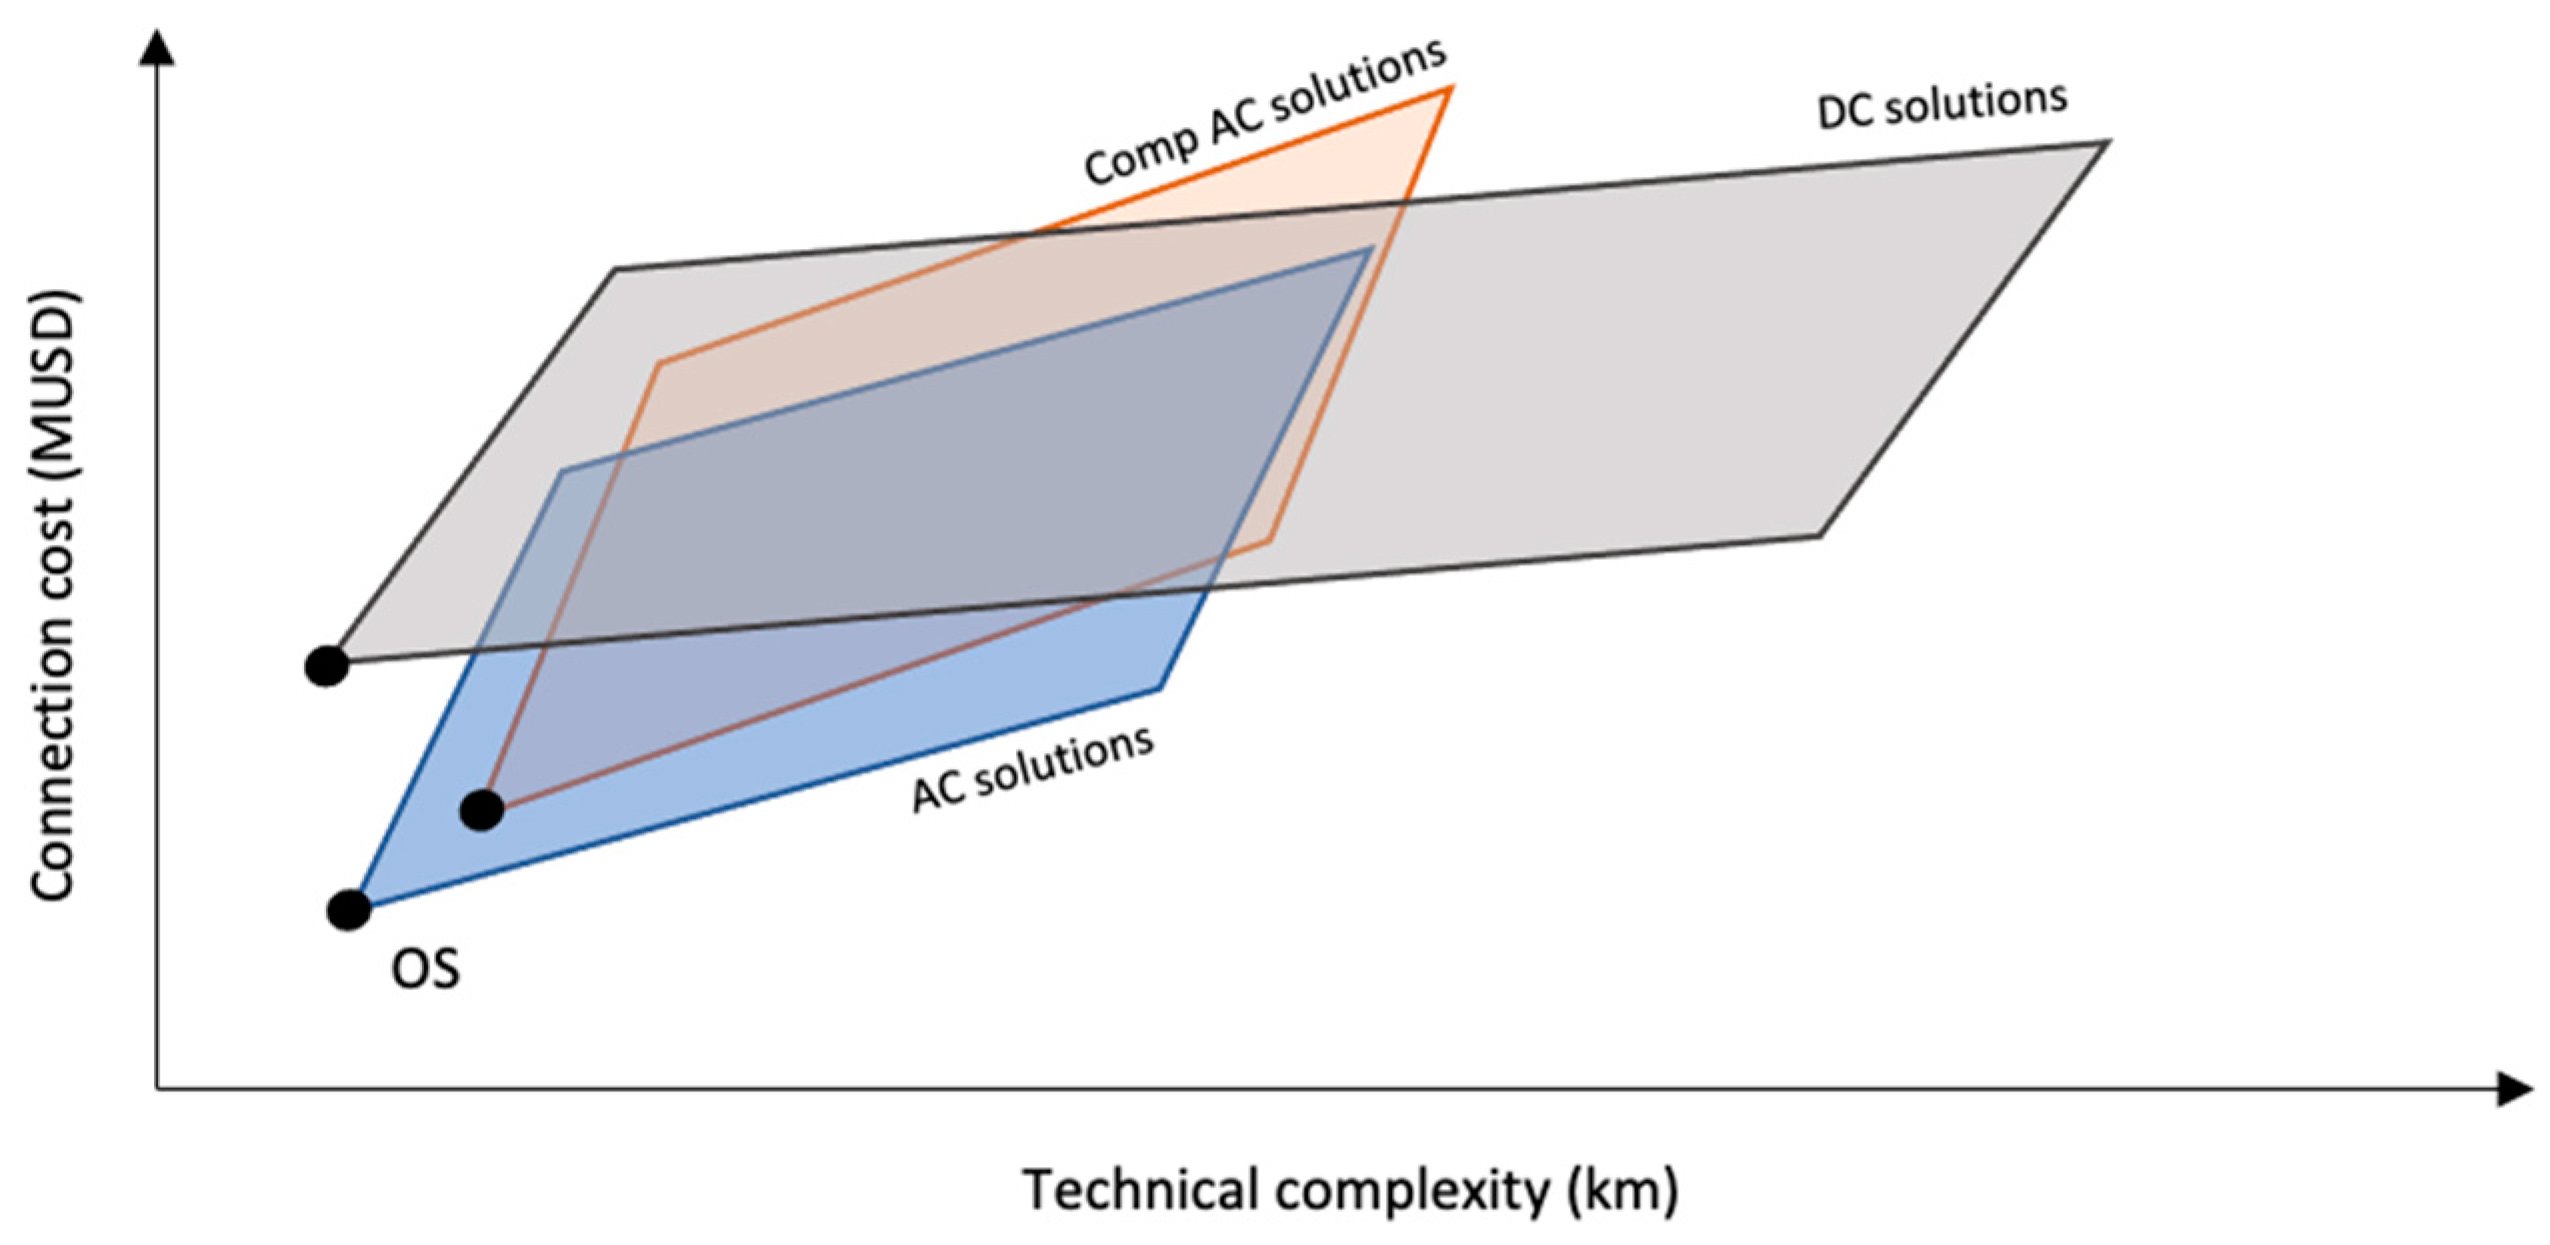
5.3. HVAC and HVDC Modules

The modules are made of voltage and active power rating envelopes. Based on the results presented in Figure 11, the most common AC voltages resulting from the model are 66, 132 and 220 kV. Regarding the DC envelopes, only the 80 kVDC envelope (although encompassing a wider range of cable sizes) was selected as the most adequate choice. The operational ranges of each envelope represented in Figure 16 (green, red, blue for AC and grey for DC) are drawn around the candidates (black dots):
The limited range of the application of AC is clear and it is notable that a lower voltage can be more cost-effective within a short power/distance range. This lower voltage is made at the expense of larger cables, which, given their lower insulation level, have a lower capacitive characteristic and can tap a slightly higher distance. Another conclusion is that, since the compensation is located onshore it requires a larger cable size to carry the reactive power current “bandwidth” to the offshore site, further driving up the cost of the AC alternative.

6. Conclusions

In this research paper, the suitability of multiple grid connection solutions was addressed from an O&G perspective. The installed bases for both sites, as well as offshore AC and DC substations, have been captured in the second section, and such a portfolio was used to estimate the power requirement and cost coefficients for our model. In the third section the HVAC and HVDC transmission models were reviewed, alongside their technical limitations, setting the framework for the optioneering model presented in the fourth section, which allowed us to draft conclusions on the set of most suitable and cost-effective PFS solutions.
On one hand, the model has rendered satisfactory results and confirmed that a standardization of the connection setup is here made possible by limiting the voltage levels to three steps and it is possible to identify which of the voltage levels is better suited depending on the power rating and distance of the candidate. Additionally, the same power/distance envelopes are consistent with existing grid connections therefore validating the algorithm. On the other hand, the investigation was heavily focused on the calculation of an efficient AC connection setup given their lower cost, yet the number of suitable AC cases is low.
One of the ways the efficiency of the model was measured was by comparing the cost of the bespoke connection configuration that best suited each individual candidate versus the ideal standardized envelope outputted by the model as shown in Figure 15. However, the use of the three standard AC voltages would mean that 25% of the AC cases or less than 3% of the overall pool would be adjusted to match an envelope, hence the impact is too narrow to digest. In a nutshell, the results show that the standardization of the AC connections renders a small advantage versus a regular approach, as the AC cases are so few in O&G production. Further investigation will be made towards addressing DC alternatives (both HVDC and MVDC) and the use of offshore renewables directly connected to their sites, in a similar fashion to the Hywind Tampen project [51].
The results are also quite important for OWF applications because the OHVS shares many of its characteristics, and those OWF applications will take stock of the findings of this model as well. As seen in Section 2 the power range in OWF is extremely wide, however the voltage options are less so. This means that the modular approach may also be successful since the rating is easier to standardize and escalate by means of power modules (e.g., larger power transformers or additional switchgear bays).

Author Contributions

Conceptualization, T.A.A., R.C., P.J.S. and A.J.P.; methodology, T.A.A. and R.C.; software, T.A.A.; validation, T.A.A., R.C., P.J.S. and A.J.P.; formal analysis, T.A.A.; investigation, T.A.A.; resources, R.C.; data curation, T.A.A.; writing—original draft preparation, T.A.A.; writing—review and editing, R.C.; visualization, R.C.; supervision, R.C., P.J.S. and A.J.P.; project administration, R.C., P.J.S. and A.J.P.; funding acquisition, R.C., P.J.S. and A.J.P. All authors have read and agreed to the published version of the manuscript.

Funding

This research was funded by national funds through FCT—Fundação para a Ciência e a Tecnologia, under the projects UIDB/50021/2020, UIDB/00066/2020 and UIDB/00308/2020.

Institutional Review Board Statement

Not applicable.

Informed Consent Statement

Not applicable.

Data Availability Statement

Data is unavailable due to privacy or ethical restrictions.

Conflicts of Interest

The authors declare no conflict of interest.

Abbreviations

AcronymFull Name
ABCDTransmission Line Model Parameters (Admittance Matrix)
ACAlternating Current
BoEBarrel of Oil-Equivalent
CAPEXCapital Expenditure
CIGRÉInternational Council on Large Electric Systems
CO2Carbon Dioxide
DCDirect Current
DNV-GL Det Norske Veritas—Germanischer Lloyd
ENTSO-EEuropean Network of Transmission System Operators
EPCIEngineering, Procurement, Construction and Installation
FCTFundação para a Ciência e a Tecnologia
GISGas-Insulated Switchgear
HVACHigh Voltage Alternated Current
HVDCHigh Voltage Direct Current
LCALife-Cycle Assessment
LCCLine-Commutated Converter
LCOELevelized Cost of Energy
MMCModular Multilevel Converter
MVMedium Voltage
MVDCMedium Voltage Direct Current
O&GOil and Gas
OFGEMGreat Britain’s Office of Gas and Electricity Markets
OHVSOffshore High Voltage Substation(s)
OPECOrganization of the Petroleum Exporting Countries
OPEXOperational Expenditure
OTMOffshore Transformer Module
OWFOffshore Wind Farm
PFSPower from Shore
PoWPoint-on-Wave
STATCOMStatic Synchronous VAR Compensation
SVCStatic Var Compensation
TSOTransmission System Operator
VArReactive Power
VSCVoltage-Sourced Converter

Nomenclature

VariableFull Variable Description (Units)
P r Active Power at reception (remote end or offshore) (MVA)
P D C Active Power Flow (MW)
Y V A R Admittance of reactive power compensation system (S)
C M V A Cost factor per unit of Active Power (Euro/MW)
C M V A k m Cost factor per unit of Active Power and Distance (Euro/MW.km)
C % Cost factor per unit of Cost (%/Total Cost)
C k m Cost factor per unit of Distance (Euro/km)
I e Current at emission (local end or onshore (A)
I r Current at reception (remote end or offshore) (A)
φ Difference between Voltage Angle at emission and reception (º)
x t r i g g Distance at the point of fault trigger (km)
x t r i g g n Distance at the point of fault trigger for each variable n under review (km)
p B o E Equivalent oil production of O&G offshore site (BoE)
x 1 , x 2 Interpolated values of distance (km)
y 1 , y 2 Interpolated values of variable (variable units)
G Line Conductance (S/km)
I D C Line Current (ADC)
X L Line Impedance (Ω/km)
B Line Susceptance (S/km)
U D C Line Voltage (kVDC)
Z L Longitudinal Impedance (Ω)
I M Maximum current for selected cable k per-phase (A)
d m a x k Maximum distance for that cable solution k is feasible (km)
I 0 No-Load Current (local end or onshore) (A)
U 0 No-Load Voltage (remote end or offshore) (kV)
OSOptimal solution (per candidate) (Euro)
P e Power requirement for O&G offshore site (MW)
C r a t i o Ratio between the reactive power compensation required and adjusted
Q r Reactive Power at reception (remote end or offshore) (MVAR)
Q r d m a x Reactive power compensation calculated (under boundary conditions) at d m a x k (MVAR)
Q V A R Reactive power compensation required for scenario (MVAR)
R L Resistance per-km (DC cable) (Ω/km)
R Resistance per-km (Ω/km)
C n Total cost of candidate (Euro)
C A C Total cost using AC solution (for candidate) (Euro)
C A C   w / V A R Total cost using AC solution including Reactive Compensation (for candidate) (Euro)
C D C Total cost using DC solution (for candidate) (Euro)
Y T Transverse Admittance (S)
y t r i g g Variable value at the point of fault trigger (variable units)
φ U e / φ U r Voltage Angle at emission (local end)/reception (remote end) (°)
U e Voltage at emission (local end or onshore) (kV)
U r Voltage at reception (remote end or offshore) (kV)

References

  1. Oliveira-Pinto, S.; Rosa-Santos, P.; Taveira-Pinto, F. Electricity supply to offshore oil and gas platforms from renewable ocean wave energy: Overview and case study analysis. Energy Convers. Manag. 2019, 186, 556–569. [Google Scholar] [CrossRef]
  2. Oliveira-Pinto, S.; Rosa-Santos, P.; Taveira-Pinto, F. Assessment of the potential of combining wave and solar energy resources to power supply worldwide offshore oil and gas platforms. Energy Convers. Manag. 2020, 223, 113299. [Google Scholar] [CrossRef]
  3. Marvik, J.I.; Øyslebø, E.V.; Korpås, M. Electrification of offshore petroleum installations with offshore wind integration. Renew. Energy 2013, 50, 558–564. [Google Scholar] [CrossRef]
  4. Riboldi, L.; Nord, L.O. Concepts for lifetime efficient supply of power and heat to offshore installations in the North Sea. Energy Convers. Manag. 2017, 148, 860–875. [Google Scholar] [CrossRef]
  5. Korpås, M.; Warland, L.; He, W.; Tande, J.O.G. A Case-Study on Offshore Wind Power Supply to Oil and Gas Rigs. Energy Procedia 2012, 24, 18–26. [Google Scholar] [CrossRef] [Green Version]
  6. Hamdan, H.A.; Kinsella, B. Using a VSC Based HVDC Application to Energize Offshore Platforms from Onshore—A Life-cycle Economic Appraisal. Energy Procedia 2017, 105, 3101–3111. [Google Scholar] [CrossRef]
  7. Hamadi, V.; Brosnan, U.; Loftus, I.; Montgomery, G. Offshore Substation Design: High-Level Overview of the Industry Best Practices. IEEE Power Energy Mag. 2019, 17, 67–74. [Google Scholar] [CrossRef]
  8. Antunes, T.A.; Santos, P.J.; Pires, A.J. HVAC transmission restrictions in large scale offshore wind farm applications. In Proceedings of the 2017 11th IEEE International Conference on Compatibility, Power Electronics and Power Engineering, CPE-POWERENG 2017, Cadiz, Spain, 4–6 April 2017; pp. 46–52. [Google Scholar] [CrossRef]
  9. Jansen, M.; Duffy, C.; Green, T.C.; Staffell, I. Island in the Sea: The prospects and impacts of an offshore wind power hub in the North Sea. Adv. Appl. Energy 2022, 6, 100090. [Google Scholar] [CrossRef]
  10. Ruddy, J.; Meere, R.; O’Donnell, T. Low Frequency AC transmission for offshore wind power: A review. Renew. Sustain. Energy Rev. 2016, 56, 75–86. [Google Scholar] [CrossRef]
  11. Soares-Ramos, E.P.; Assis, L.D.O.; Sarrias-Mena, R.; Fernández-Ramírez, L.M. Current status and future trends of offshore wind power in Europe. Energy 2020, 202, 117787. [Google Scholar] [CrossRef]
  12. Härtel, P.; Vrana, T.K.; Hennig, T.; von Bonin, M.; Wiggelinkhuizen, E.J.; Nieuwenhout, F.D. Review of investment model cost parameters for VSC HVDC transmission infrastructure. Electr. Power Syst. Res. 2017, 151, 419–431. [Google Scholar] [CrossRef] [Green Version]
  13. Houghton, T.; Bell, K.R.W.; Doquet, M. Offshore transmission for wind: Comparing the economic benefits of different offshore network configurations. Renew. Energy 2016, 94, 268–279. [Google Scholar] [CrossRef] [Green Version]
  14. Salari, M.E.; Coleman, J.; Toal, D. Analysis of direct interconnection technique for offshore airborne wind energy systems under normal and fault conditions. Renew. Energy 2018, 131, 284–296. [Google Scholar] [CrossRef]
  15. Nieradzinska, K.; MacIver, C.; Gill, S.; Agnew, G.; Anaya-Lara, O.; Bell, K. Optioneering analysis for connecting Dogger Bank offshore wind farms to the GB electricity network. Renew. Energy 2016, 91, 120–129. [Google Scholar] [CrossRef] [Green Version]
  16. Elliott, D.; Bell, K.R.W.; Finney, S.J.; Adapa, R.; Brozio, C.; Yu, J.; Hussain, K. A Comparison of AC and HVDC Options for the Connection of Offshore Wind Generation in Great Britain. IEEE Trans. Power Deliv. 2015, 31, 798–809. [Google Scholar] [CrossRef] [Green Version]
  17. Roses, A.P.; Francois, B. Practical determination of HVAC—HVDC Hybridization ratio for Offshore Transmission network Architectures through technico-economic considerations. IFAC-PapersOnLine 2016, 49, 425–432. [Google Scholar] [CrossRef]
  18. Ackermann, T. Transmission Systems for Offshore Wind Farms. In Wind Power in Power Systems; John Wiley & Sons: Hoboken, NJ, USA, 2005; pp. 479–503. [Google Scholar] [CrossRef]
  19. Zhang, Y.; Ravishankar, J.; Fletcher, J.; Li, R.; Han, M. Review of modular multilevel converter based multi-terminal HVDC systems for offshore wind power transmission. Renew. Sustain. Energy Rev. 2016, 61, 572–586. [Google Scholar] [CrossRef]
  20. Alassi, A.; Bañales, S.; Ellabban, O.; Adam, G.; MacIver, C. HVDC Transmission: Technology Review, Market Trends and Future Outlook. Renew. Sustain. Energy Rev. 2019, 112, 530–554. [Google Scholar] [CrossRef]
  21. Pierri, E.; Binder, O.; Hemdan, N.G.; Kurrat, M. Challenges and opportunities for a European HVDC grid. Renew. Sustain. Energy Rev. 2017, 70, 427–456. [Google Scholar] [CrossRef]
  22. Carrizosa, M.J.; Navas, F.D.; Damm, G.; Lamnabhi-Lagarrigue, F. Optimal power flow in multi-terminal HVDC grids with offshore wind farms and storage devices. Int. J. Electr. Power Energy Syst. 2015, 65, 291–298. [Google Scholar] [CrossRef]
  23. Korompili, A.; Wu, Q.; Zhao, H. Review of VSC HVDC connection for offshore wind power integration. Renew. Sustain. Energy Rev. 2016, 59, 1405–1414. [Google Scholar] [CrossRef] [Green Version]
  24. Gomis-Bellmunt, O.; Liang, J.; Ekanayake, J.; King, R.; Jenkins, N. Topologies of multiterminal HVDC-VSC transmission for large offshore wind farms. Electr. Power Syst. Res. 2011, 81, 271–281. [Google Scholar] [CrossRef]
  25. Liang, J.; Gomis-Bellmunt, O.; Ekanayake, J.; Jenkins, N.; An, W. A multi-terminal HVDC transmission system for offshore wind farms with induction generators. Int. J. Electr. Power Energy Syst. 2012, 43, 54–62. [Google Scholar] [CrossRef]
  26. Sutton, S.J.; Lewin, P.L.; Swingler, S.G. Review of global HVDC subsea cable projects and the application of sea electrodes. Int. J. Electr. Power Energy Syst. 2017, 87, 121–135. [Google Scholar] [CrossRef]
  27. Negra, N.B.; Todorovic, J.; Ackermann, T. Loss evaluation of HVAC and HVDC transmission solutions for large offshore wind farms. Electr. Power Syst. Res. 2006, 76, 916–927. [Google Scholar] [CrossRef]
  28. de Alegría, I.M.; Martín, J.L.; Kortabarria, I.; Andreu, J.; Ereño, P.I. Transmission alternatives for offshore electrical power. Renew. Sustain. Energy Rev. 2009, 13, 1027–1038. [Google Scholar] [CrossRef]
  29. Westman, B.; Gilje, S.; Hyttinen, M. Valhall Re-Development Project, Power From Shore. İn PCIC Europe Petroleum and Chemical Industry Conference Europe—Electrical and Instrumentation Applications. 2010. Available online: https://ieeexplore.ieee.org/document/5525737 (accessed on 28 November 2020).
  30. Myklebust, H.; Eriksson, K.; Westman, B.; Persson, G. Valhall power from shore after five years of operation. In Proceedings of the 2017 Petroleum and Chemical Industry Conference Europe (PCIC Europe), Vienna, Austria, 16–18 May 2017; pp. 1–4. [Google Scholar] [CrossRef]
  31. Thibaut, E.; Leforgeais, B. Selection of Power From Shore for an Offshore Oil and Gas Development. IEEE Trans. Ind. Appl. 2014, 51, 1333–1340. [Google Scholar] [CrossRef]
  32. El-Fouly, T.; Zeineldin, H.; El-Saadany, E.; Salama, M. A new optimization model for distribution substation siting, sizing, and timing. Int. J. Electr. Power Energy Syst. 2007, 30, 308–315. [Google Scholar] [CrossRef]
  33. González, J.S.; Payán, M.B.; Santos, J.R. Optimum design of transmissions systems for offshore wind farms including decision making under risk. Renew. Energy 2013, 59, 115–127. [Google Scholar] [CrossRef]
  34. Wang, L.; Wu, J.; Wang, T.; Han, R. An optimization method based on random fork tree coding for the electrical networks of offshore wind farms. Renew. Energy 2019, 147, 1340–1351. [Google Scholar] [CrossRef]
  35. Antunes, T.A.; Castro, R.; Santos, P.J.; Pires, A.J.; Foehr, M. Optimized Electrification of Subsea Oil & Gas Infrastructures Based in Genetic Algorithm. In Technological Innovation for Industry and Service Systems; Springer: Cham, Swizterland, 2019; pp. 214–223. [Google Scholar] [CrossRef]
  36. Santibanez-Borda, E.; Korre, A.; Nie, Z.; Durucan, S. A multi-objective optimisation model to reduce greenhouse gas emissions and costs in offshore natural gas upstream chains. J. Clean. Prod. 2021, 297, 126625. [Google Scholar] [CrossRef]
  37. Müller, H.; Torbaghan, S.S.; Gibescu, M.; Roggenkamp, M.; van der Meijden, M. The need for a common standard for voltage levels of HVDC VSC technology. Energy Policy 2013, 63, 244–251. [Google Scholar] [CrossRef]
  38. D’Souza, M.; Dhara, R.S.; Bouyer, R.C. Modularization of High Voltage Gas Insulated Substations. IEEE Trans. Ind. Appl. 2020, 56, 4662–4669. [Google Scholar] [CrossRef]
  39. Svendsen, H.G. Planning Tool for Clustering and Optimised Grid Connection of Offshore Wind Farms. Energy Procedia 2013, 35, 297–306. [Google Scholar] [CrossRef] [Green Version]
  40. Qin, C.; Li, B.; Shi, B.; Qin, T.; Xiao, J.; Xin, Y. Location of substation in similar candidates using comprehensive evaluation method base on DHGF. Measurement 2019, 146, 152–158. [Google Scholar] [CrossRef]
  41. Li, Y.; Liu, H.; Fan, X.; Tian, X. Engineering practices for the integration of large-scale renewable energy VSC-HVDC systems. Glob. Energy Interconnect. 2020, 3, 149–157. [Google Scholar] [CrossRef]
  42. McKenna, R.; D’Andrea, M.; González, M.G. Analysing long-term opportunities for offshore energy system integration in the Danish North Sea. Adv. Appl. Energy 2021, 4, 100067. [Google Scholar] [CrossRef]
  43. Zhang, A.; Zhang, H.; Qadrdan, M.; Li, X.; Li, Q. Energy Hub based Electricity Generation System Design for an Offshore Platform Considering CO 2 -Mitigation. Energy Procedia 2017, 142, 3597–3602. [Google Scholar] [CrossRef]
  44. Liu, Y.; Fu, Y.; Huang, L.-L.; Ren, Z.-X.; Jia, F. Optimization of offshore grid planning considering onshore network expansions. Renew. Energy 2021, 181, 91–104. [Google Scholar] [CrossRef]
  45. Jin, R.; Hou, P.; Yang, G.; Qi, Y.; Chen, C.; Chen, Z. Cable routing optimization for offshore wind power plants via wind scenarios considering power loss cost model. Appl. Energy 2019, 254, 113719. [Google Scholar] [CrossRef]
  46. Andersson, U.; Jubert, D.C.; Evers, T. Developing and Installing Substations for Oil and Gas Facilities in Very Cold and Remote Locations. IEEE Trans. Ind. Appl. 2011, 47, 1184–1192. [Google Scholar] [CrossRef]
  47. Offshore, C. Offshore Substation Database. Available online: https://www.4coffshore.com/transmission/substations.aspx (accessed on 6 October 2020).
  48. ABB. XLPE Land Cable Systems—User’s Guide. 2010. Available online: https://library.e.abb.com/public/ab02245fb5b5ec41c12575c4004a76d0/XLPE%20Land%20Cable%20Systems%202GM5007GB%20rev%205.pdf (accessed on 25 October 2010).
  49. ABB. XLPE Submarine Cable Systems—Attachment to XLPE Land Cable Systems—User’s Guide. 2010. Available online: https://new.abb.com/docs/default-source/ewea-doc/xlpe-submarine-cable-systems-2gm5007.pdf (accessed on 6 October 2020).
  50. Sucena Paiva, J.P. Redes de Energia Eléctrica: Uma Análise Sistémica; IST Press: Lisbon, Portugal, 2007. [Google Scholar]
  51. Equinor. Hywind Tampen: The World’s First Renewable Power for Offshore Oil and Gas. Available online: https://www.equinor.com/en/what-we-do/hywind-tampen.html (accessed on 15 January 2021).
  52. ABB. HVDC Light Cables; ABB: Zürich, Switzerland, 2006. [Google Scholar]
  53. Sutherland, P.E. Safe Operating Limits. IEEE Ind. Appl. Mag. 2011, 17, 14–19. [Google Scholar] [CrossRef]
  54. ENTSOE. Commission Regulation (EU) 2016/631 of 14 April 2016. Establishing a Network Code on Requirements for Grid Connection of Generators. 2016. Available online: https://www.entsoe.eu/network_codes/rfg/ (accessed on 15 January 2021).
  55. Conseil İnternational des Grands Réseaux Électriques. Guidelines for the Design and Construction of AC Offshore Substations for Wind Power Plants; Working Group B3.26; Cigré: Paris, France, 2011. [Google Scholar]
  56. Liu, R. Progress of long-distance DC electrical power transmission. In Proceedings of the 2017 1st International Conference on Electrical Materials and Power Equipment (ICEMPE), Xi’an, China, 14–17 May 2017; pp. 93–96. [Google Scholar] [CrossRef]
  57. Heier, S. Grid Integration of Wind Energy: Onshore and Offshore Conversion Systems. 2014. Available online: https://www.wiley.com/en-au/Grid+Integration+of+Wind+Energy%3A+Onshore+and+Offshore+Conversion+Systems%2C+3rd+Edition-p-9781119962946 (accessed on 15 January 2021).
  58. OFGEM. Offshore Transmission Cost Assessment Workshop: Development Proposals. 2013. Available online: https://www.ofgem.gov.uk/sites/default/files/docs/2013/12/13_dec_workshopslides.pdf (accessed on 15 January 2021).
  59. Offshore Renewable Energy Catapult. Guide to an Offshore Wind Farm: Wind Farm Costs. Available online: https://guidetoanoffshorewindfarm.com/wind-farm-costs (accessed on 15 January 2021).
  60. Nepsha, F.; Voronin, V.; Belyaevsky, R.; Efremenko, V.; Varnavskiy, K. Application of FACTS Devices in Power Supply Systems of Coal Mines. E3S Web Conf. 2020, 174, 03026. [Google Scholar] [CrossRef]
  61. Mæland, A.; Chokhawala, R.S. Powering Oil & Gas Offshore Operations from Mainland Electrical Grid. Available online: https://www.osti.gov/etdeweb/servlets/purl/21390200 (accessed on 15 January 2021).
  62. Connecting Offshore Wind Farms: A Comparison of Offshore Electricity Grid Development Models in Northwest Europe; Navigant Netherlands B.V.: Utrecht, The Netherlands, 2019.
  63. Van Hertem, D.; Leterme, W.; Chaffey, G.; Abedrabbo, M.; Wang, M.; Zerihun, F.; Barnes, M. Substations for Future HVdc Grids: Equipment and Configurations for Connection of HVdc Network Elements. IEEE Power Energy Mag. 2019, 17, 56–66. [Google Scholar] [CrossRef] [Green Version]
Figure 1. Quantity and power rating of offshore connections built between 2000–2025 (expected). Source: authors’ own investigation based on several sources.
Sustainability 15 05041 g001
Figure 2. HVAC and HVDC OHVS portfolio based on their power/voltage rating. Source: authors’ own investigation based on several sources.
Sustainability 15 05041 g002
Figure 3. HVAC and HVDC OHVS portfolio based on their power rating/distance.
Sustainability 15 05041 g003
Figure 4. Regression of the production/power rating ratio.
Sustainability 15 05041 g004
Figure 5. Offshore candidates based in their power rating and distance.
Sustainability 15 05041 g005
Figure 6. Standardization model simplified flowchart.
Sustainability 15 05041 g006
Figure 7. Example of trigger and failure distance calculation.
Sustainability 15 05041 g007
Figure 8. Calculation of VAR regulation.
Sustainability 15 05041 g008
Figure 9. Equivalent model for compensated HVAC transmission line with compensation.
Sustainability 15 05041 g009
Figure 10. Example of the grid connection ranges proposed by the optioneering model.
Sustainability 15 05041 g010
Figure 11. Technical range of HVAC and HVDC applications.
Sustainability 15 05041 g011
Figure 12. Optioneering selection results for the O&G candidates (candidates per voltage level).
Sustainability 15 05041 g012
Figure 13. Optioneering selection results for the O&G candidates (rating vs distance to shore).
Sustainability 15 05041 g013
Figure 14. Average VAR compensation required in HVAC candidates.
Sustainability 15 05041 g014
Figure 15. Average CAPEX/km per type of connection.
Sustainability 15 05041 g015
Figure 16. Voltage–Power rating envelopes for standardized modules.
Sustainability 15 05041 g016
Disclaimer/Publisher’s Note: The statements, opinions and data contained in all publications are solely those of the individual author(s) and contributor(s) and not of MDPI and/or the editor(s). MDPI and/or the editor(s) disclaim responsibility for any injury to people or property resulting from any ideas, methods, instructions or products referred to in the content.

