Article

To Share or Not to Share—Expected Transportation Mode Changes Given Different Types of Fully Automated Vehicles

Department of Human-Cyber-Physical Systems, Chemnitz University of Technology, 09107 Chemnitz, Germany
*
Author to whom correspondence should be addressed.
Sustainability 2023, 15(6), 5056; https://doi.org/10.3390/su15065056
Submission received: 30 January 2023 / Revised: 28 February 2023 / Accepted: 9 March 2023 / Published: 13 March 2023

Abstract

:
When it comes to climate change, automated vehicles (AV) are often presented as a key factor to reducing emissions related with the transport sector. While studies promise emissions savings of up to 80%, it is often overlooked how AVs will be introduced and which transportation mode changes will arise from their implementation. Therefore, this online survey examined usage intentions regarding private and shared AV types, and underlying attitudes and mobility needs of 136 current users of different main modes of transport. Two main results counteract the general assumption of ecological sustainability benefits of AVs: First, current car drivers prefer private over shared AV types, even though notable sustainability gains can only be expected from shared AVs. Second, current users of more sustainable modes of transport (walking, bike, public transport) would replace theses modes by AVs for substantial shares of their trips, which represents a behavioural rebound effect, since AVs cannot be more sustainable than walking or biking. Group-specific mobility needs and knowledge gaps regarding the sustainability of different AV types are identified as reasons for these results and as starting points for deriving necessary measures accompanying the introduction of AVs into society through motivating ecologically sustainable transportation mode changes.

1. Introduction

With climate change, humanity is currently facing a global problem that requires new ways of acting and thinking. While the warming of the earth due to the increase of greenhouse gases in the atmosphere was still classified as an exclusively natural phenomenon in the 1950s [1], it has since been internationally recognised that man-made emissions are responsible for climate change [2]. Between 1940 and 2020, the steadily rising global CO2 emissions have increased sevenfold [3]. For this reason, the Paris Climate Agreement was concluded in 2015 between 197 Parties who, recognising man-made climate change, committed to limiting the global temperature increase to 1.5 °C or 2 °C above pre-industrial levels. Article 4 of the agreement mentions reaching the peak of global greenhouse gas emissions as soon as possible as a means of implementing this goal [2].
The implementation of concrete measures to reduce emissions is up to the individual states. The Climate Protection Plan of the Federal Republic of Germany was adopted in November 2016 and identifies the areas of energy, buildings, industry, agriculture, and transport as fields of action [4]. The latter plays a special role, as emissions from this sector have developed particularly unfavourably compared to the other sectors. Although the efficiency of vehicles for transporting people and goods has steadily increased since 1990, these improvements have been offset by an increase in traffic volume and energy consumption of the transport sector, which has tripled since 1960 [4].
Accounting for more than 75% of the German passenger transport performance, cars and motorised two-wheelers are the top mode of transport [4]. Accordingly, the Climate Plan mentions, among other things, greater digitalisation of the transport system and strengthening of local public transport, cycling, and walking as necessary measures for change. However, according to surveys by [5], only about a third of surveyed persons in Germany are willing to give up using a car for climate protection reasons, and less than 30% use public transport for longer journeys.
Automated and connected driving, which is “intended to enable modern, clean, barrier-free and affordable mobility in cities and in the countryside” [6] (p. 1), plays a key role in closing this gap. However, promising estimates of the emissions savings potential of fully automated vehicles are calculated under certain assumptions. A critical question in this context is not only if, but how fully automated driving will be used in society and what consequences its introduction will have on general mobility behaviour. While a large number of scientific contributions can be found on questions of the technical feasibility of fully automated driving, Ref. [7] criticise in their meta-analysis the lack of research on questions regarding the integration of fully automated vehicles into society and the associated sustainability effects. In [8], the authors also see the examination of behavioural change following the introduction of fully automated vehicles as an important task for the social sciences. This paper will help to fill the existing gap by investigating potential users’ intended mode choices when introducing different modes of fully automated vehicles, and the mobility needs behind these choices. The results will support a better understanding of expected mobility patterns in a transport system including different types of fully automated vehicles, which is an important prerequisite for realistic estimations of their emissions savings potential.

1.1. Fully Automated Vehicles (AVs)

In general, six levels of automated driving with increasing degrees of automation are distinguished [9]: Level 0 comprises the completely manual operation of a car by a human being. At the next levels, the driving task is successively taken over by automated driving systems until completely driverless driving is achieved at Level 5. At this level, the driving task is completely performed by the fully automated vehicle without the need for passenger intervention or supervision [9]. In the following, the term “automated vehicle” (AV) will be used to refer to this level.
Human factors research could already identify major challenges for the general societal acceptance and adoption of AVs [10]. Most of them are connected to peoples’ missing trust in AVs [11,12], which is often connected to the inherent fundamental role shift from active drivers to passive passengers and the associated loss of control [13]. These challenges are currently addressed through user-centred design principles for AVs, especially their driving styles, e.g., [14,15]; internal, e.g., [16,17]; and external Human-Machine Interfaces, e.g., [18,19]; which aim at promoting transportation mode changes towards AVs in general.
Next to factors influencing the general adoption of AVs, a realistic estimation of their environmental impact requires the differentiated consideration of different AV forms. In [20], the authors distinguish between two basic business models for AVs: Owning versus sharing. Owning refers to individuals owning an AV for their private use (private automated vehicle, PAV). Sharing refers to individuals sharing an AV, which is not their own, by getting served either consecutively (shared automated vehicle, SAV) or simultaneously with other individuals (ride-shared automated vehicle, RSAV). While PAVs are not very different from conventional cars in terms of usage, SAVs, and especially RSAVs, are disruptive forms of transportation that have the potential to fundamentally change our mobility system [21]. The procedure for using PAVs is the same as for conventional private cars, except for the omission of the driving task. When using SAVs, passengers are picked up by an automated vehicle at a time and location of their choice and are transported to a destination of their choice. During the ride, no unfamiliar passengers are present in the vehicle. Once the journey is over, other customers are served in the same way. This form of usage coincides with the current use of conventional taxis. RSAVs jointly transport unfamiliar passengers by bundling trips with similar origins and destinations into one vehicle. These vehicles may operate on rather fixed (for large vehicles) or rather flexible (for small vehicles) schedules and routes, depending on capacity [22]. Fixed RSAV types are most comparable to current public transport in terms of usage options. The disruptive potential of shared AVs applies particularly to flexible RSAV types, which have no clear equivalent among the current main modes of transport and could solve common usage barriers of conventional public transport (e.g., last mile problem, inflexible time planning).

1.2. Ecological Sustainability of AVs

On the technical side, AVs offer the potential for more environmentally sustainable and lower-emission mobility. With the complete automation of traffic, existing infrastructures could provide space for up to three times more vehicles due to better synchronisation [8], reducing the need to build new roads and therefore restricting additional land take. Based on eco driving strategies, AVs could consume up to 20% less energy and save corresponding emissions [23,24,25]. If AVs were additionally electrified, emissions could be reduced by 60% to 80% [23,24,26]. Due to the expected prevention of accidents, which in itself could save 20% of energy consumption [25], AVs would require less safety equipment, which—due to lower weight (light-weighting)—would lead to further savings in energy and emissions [23,24]. This would also enable the construction of vehicles sized suitably for their intended usage (right-sizing), which would reduce the need for consumed materials and increase the efficiency of existing infrastructure. Conversely, it must be mentioned that AVs require additional electronics and measuring instruments, which in turn increase vehicle weight and material consumption [24].
However, the most important factor in calculations of potential savings is the societal shift from the current status quo of motorised private transport to shared forms of mobility [8,23,24,25,27,28]. Shared usage models would enable adjustments of the vehicle size to the purpose of each journey, which would allow the right-sizing aspect to be fully realised and energy consumption to be reduced by up to 45% [24,25]. Increasing the number of passengers in vehicles and reducing idling time would reduce space consumption by moving and parking vehicles [28,29]. Furthermore, fewer vehicles would be required to transport the same number of people, leading to a lower overall stock of vehicles and a lower production of new vehicles [23,28,29]. Ref. [29] estimate that up to 12 privately owned cars could be replaced by one SAV. Freed-up space could be used differently, such as for housing, public spaces, or parks [24,28,30].
However, these potential advantages can only come to fruition if they are not relativized by overall increases in traffic volumes and the resulting consequences [29,31]. This condition is counteracted by the facilitated access to mobility that AVs offer, especially for population groups with currently restricted access, such as elderly and underage persons or persons with impairments such as blindness. Due to such gratifying opportunities, it is expected that motorized vehicles will be used for more frequent, longer, and additional trips than today, leading to an overall increase in traffic [8,21,23,25,30,31,32]. Increased acceptance of longer travel times may lead to more settlement around cities and result in greater land take [8,23,30,31,33,34]. Indeed, in a study by [32], 40% of respondents said they would potentially make more frequent or longer trips in a future with AVs. A widespread establishment of exclusively PAVs [35] could even lead to an increase in CO2 emissions compared to today’s levels [8,30].
Considering the savings potentials presented, an environmental sustainability ranking of the three AV types and the current main modes of passenger transport can be established (see Table 1). Like conventional private cars, the usage of PAVs requires the production of one vehicle per user or user group (e.g., household). In Germany, there is an average of 1.1 passenger cars per household [36]. Thereby, private cars have the highest resource consumption (raw materials, production costs) as well as the lowest efficiency in transporting passengers, and can therefore be considered the least ecologically sustainable mode. Compared to the current status, a larger number of vehicles in operation as well as increased land consumption may result from the establishment of PAVs. Such rebound effects can only be partially offset by the lower emissions and energy demand due to the automation of the driving task. For this reason, PAVs can be assumed to represent the least sustainable of all AV types and to be presumably as equally (non-) sustainable as conventional private cars. Resource consumption in production and usage also occurs with conventional taxis. Here, however, sharing reduces the resources per person using the service. Such sharing effects are scalable, so that they can have a greater impact with an increasing degree of sharing. In the case of conventional taxis, the transport also includes empty runs to pick up passengers, which reduces the potential resource savings of their sharing aspect. SAVs can be compared to current taxis but may be classified as more sustainable due to lower emissions and the aspect of right-sizing. Ridesharing addresses the inefficiency in all the forms of transport mentioned before; therefore RSAVs can be considered similar to public transport in terms of efficiency due to shared use during the journey. Multiple passengers can be transported at the same time, significantly reducing the number of vehicles required compared to private cars and ride-sourcing vehicles such as taxis or SAVs.
A particularly interesting observable factor to consider in this context is the current mode choice, as it determines the environmental impact of mode changes due to driving automation. Therefore, the basis for estimations of the ecological potential of automated vehicles is the prevailing status quo of passenger transport. This focus is justified insofar as private cars are the most frequently used mode of transport in Germany, accounting for 57% of all journeys made and 75% of passenger kilometres travelled [36]. However, this focus carries the risk of classifying the use of AVs as ecologically sustainable in every case. Indeed, current users of private cars changing to AV types could have major sustainability effects. However, persons who are currently mainly walking, cycling, or using public transport, changing to AVs, especially the private type, is associated with reduced sustainability and thus represents a classic rebound effect. Although car drivers exhibit a particularly great interest in AVs [37], they usually represent the group with the lowest intention to use them [21,38,39,40]. In contrast, public transport users are more open to use PAVs than car drivers [21]. Individuals who currently combine multiple modes of transport show a higher tendency to switch to SAVs or RSAVs [40,41]. Alarmingly, previous studies indicate that the majority of existing car users would remain loyal to their (conventional or automated) private car [42], and point out unintended mode changes from more sustainable modes such as walking, cycling and public transport to AVs [39,42].
While current mode choice can be used as a predictor for future mode choice, there are influencing factors on mode choice itself that can have additional informative value when examining intentions to use AVs. Up to now, there is a broad theoretical base on factors which can be helpful in predicting future mode choices in general as well as AV usage intentions. Identified predictors include demographic factors such as age, educational level, income, household size/type and place of residence [21,27,37,38,39,41,43,44,45,46,47,48,49,50,51,52,53]; behavioural factors such as perceived usefulness, ownership of vehicles or previous experience with different modes of transport [38,39,41,43,44,47,53,54]; or attitudes, such as environmental concern, tech-savviness, or attitude towards collaborative consumption [33,43,44,55]. While the first two groups of factors are already examined by a broad range of studies on general and type-specific AV usage intentions, few studies have examined intentions to use different AV types with a focus on factors not directly observable, such as the attitudes and needs behind these intentions; and not all of these studies examined the sustainability-related effects connected with these choices [20]. Especially with the influence of new technologies and demographic change on our lifestyle, it may no longer be sufficient to look only at socio-demographic characteristics and characteristics of the transport modes themselves (such as associated costs and travel duration) when examining the intention to use new mobility options [56,57]. Changes in the way we live and move–such as choosing more freely where to live or minimizing burdens for different mobility options through apps and online services–allow users to choose mobility options more appropriate for their needs and attitudes instead of being limited by external constraints. This paper contributes to filling this gap by focussing on the relationship between attitudes and future mode choices, and highlighting possible sustainability-related consequences.
In most studies, a positive attitude towards a mode of transport is the most important predictor for peoples’ intention to use it [33,39,48]. An additional look at mobility needs can further explain these attitudes. In this context, sustainability, safety, and comfort have been identified as central preferences in transportation mode choices [52]. Further studies imply the addition of time and cost effectiveness to this selection [41,49,58,59,60]. Understanding to which degree potential future AV users expect these novel transportation modes to meet their mobility needs will therefore contribute to estimating the behavioural consequences of introducing different AV types to the market, and ultimately to tailoring AVs to existing mobility needs in ways which support ecologically sustainable transportation mode choices.

1.3. Research Goals and Questions

Future driving automation is generally associated with a significantly more ecologically sustainable passenger transport, and is therefore considered a technological driving force in fighting climate change. As outlined in the previous chapters, such positive sustainability effects cannot be generally assumed, as they depend on potential users’ general willingness to use AVs, their choice of specific AV types, and the attitudes and mobility needs behind these choices. For an ecologically sustainable implementation of AVs, it is therefore not only important to create the broadest possible acceptance among the population, but also to encourage sustainable mode changes. Future users of AVs should ideally be current owners and users of private cars, from whose mode changes the greatest ecological benefit can arise. In addition, greater attention must be paid to implementing shared types of AVs. This paper aims to contribute to these goals by examining expected mode changes under the availability of different AV types (PAV: private AV, SAV: shared AV, RSAV: ride-shared AV), identifying influencing factors and formulating starting points for the ecologically sustainable implementation of AVs in society. Therefore, the following research questions were examined in an online survey:
RQ1: Which attitudes do potential future users state towards different types of automated vehicles (PAV, SAV, RSAV), depending on their current main mode of transport?
RQ2: Provided the availability of different types of fully automated vehicles (PAV, SAV, RSAV), which changes in transport mode choice can be expected by potential future users?
RQ3: Which degree of fulfilment of their mobility needs do potential future users expect from different types of fully automated vehicles (PAV, SAV, RSAV), depending on their current main mode of transport?

2. Materials and Methods

2.1. Study Design

All research questions were examined through an online survey via the LimeSurvey platform. For the examination of expected future mode choices and mode changes (RQ2), we assessed currently used modes of transport as well as modes of transport expected to be used, under the assumption that one of each of the three different types of AVs (PAV, SAV, RSAV) was available. The environmental friendliness of these expected mode changes was evaluated based on the transport mode sustainability rating established in Section 1.2 (see Table 1). As potential influencing factors, we additionally collected information on attitudes towards the three AV types (RQ1), as well as on the importance of five main mobility needs (environmental friendliness, safety, comfort, cost effectiveness, time effectiveness) and their expected fulfilment through the AV types (RQ3).

2.2. Participants

Participating in the survey required a minimum age of 18 years to ensure that all participants could principally have access to all main mobility modes (including driving a car). In addition, the language of the survey limited the sample to German speakers. Apart from these aspects, no exclusion criteria were defined. Participants were recruited through participant mailing lists of the university and a local traffic change network, as well as the university website and an interactive web platform involving citizens in the improvement of the local transport infrastructure. These acquisition channels were selected in an attempt to reach a diverse group of persons in terms of their current main mode of mobility (i.e., not only car drivers, who represent the majority of the German population [36]), which would increase the chances of actually detecting undesired mode changes (i.e., from a more sustainable to a less sustainable transport mode).
The final sample consisted of 136 persons with an age range from 18 to 59 years (M = 26.1, SD = 7.7); 76.5% of them classified themselves as female; 23.5% as male. The educational level of the sample was high, with the majority (89.7%) of the participants having a high school diploma or a university degree. Almost all (93.4%) participants stated to hold a valid driver’s license, on average for 8.7 years (SD = 7.9); 35.3% of all respondents owned a car for themselves and 24.3% shared a car with another person in the same household; 15.4% of all respondents had a car available either only sporadically or not at all. The proportion of people who share a car with more than one person or with persons from other households was comparatively low at 10.3%. Two of the respondents (1.5%) stated that they were required to move by car due to physical limitations. Regarding their experience with driving automation, almost all (96.3%) respondents had prior knowledge about driver assistance systems (SAE Level 1), while 58.8% stated to have already experienced such systems. While almost all respondents (95.6%) had also heard of automated vehicles (SAE Level 5) before, only 8.8% had already experienced such vehicles.
Table 2 demographically contrasts this sample with the respondents of the large-scale survey “Mobility in Germany” [36], who are representative of the German population. In comparison to this representative group, the sample of the present survey includes younger persons, more persons with higher education, more students and more female persons. Such derivations were expected, as Ref. [36] aimed at a representative description of the mobility behaviour in Germany; while we, in support of our specific research questions, purposefully acquired a diverse group of persons in terms of their current main mode of mobility, which also reflects in their demographics. However, based on these sample specifics, it needs to be considered that the following results originate from respondents who, on average, are more likely to favour ecologically sustainable modes of transport (see Section 3.1 for more details) and might be more open-minded than the German population towards AVs in general [47,48] as well as towards new mobility services such as carsharing and ridesharing [43]. An extensive discussion of the limitations associated with this survey sample is presented in Section 4.2.

2.3. Questionnaires

The online survey included questions on demographic information (age, gender, level of education), mobility aspects (possession of a car and driver’s license), and prior experiences with driving automation for the sample description as well as items on the dependent variables. Wherever there were suitable established scales available, they were applied to the assessment of the dependent variables. For variables without established instruments available yet, scales from previous studies on the topic were adapted into the German language. Where necessary, the scales were supplemented with own additional items. Unless stated otherwise, all items were measured on a five-step agreement scale ranging from 1 (strongly disagree) to 5 (strongly agree). The origin and wording of each item are presented in Appendix A.
To assess specific attitudes towards the three types of automated vehicles (PAV, SAV, RSAV), four items capturing attitudes towards fully automated minibuses [39] were adapted according to the respective type and supplemented by one additional item. The attitudes aim at the participants’ general opinion on each AV type, their anticipation about its role in the future transport system, its fit into their everyday life and to their mobility needs, as well as their anticipated level of joy when using it.
All questions on current (RQ1–3) and intended future mode choice (RQ2) were operationalised through number of trips made. Therefore, the participants first stated the approximate number of trips they make in a typical week. They were then asked to distribute these trips among the following seven modes of transport according to their typical current mode choices: private car, public transport, walking, bicycle/e-bike, shared car, motorbike, taxi. To estimate their expected future mode choice given the assumption that one of each of the three AV types was available, the participants were asked to redistribute their typical week trips among the eight presented mode options (including the seven current main modes of transport and the respective AV type). This question was asked separately for each of the three types, in the sense of three possible future scenarios.
For the examination of the needs behind these mode choices (RQ3), we presented five service attributes of transportation modes to the participants. The selection of these attributes was based on [52], who named sustainability, safety, and comfort as central preferences in transportation mode choices. Time and cost effectiveness were added to this selection to account for external factors with well-established effects on transportation mode choices [41,49,58,59,60]. The participants were first asked to indicate the importance of each of the five attributes when choosing a mode of transport. They then evaluated each of the three AV types in terms of the five service attributes (i.e., how sustainable, safe, comfortable, time and cost effective they expect each AV type to be).

2.4. Procedure

The online survey was initiated by a written explanation of the procedure, including information on data privacy. After signing an informed consent, participants could proceed to the questions.
The first block of questions contained statements regarding demographic information, mobility behaviour and needs, as well as driving automation in general. For the latter, participants were provided a written system information (see Appendix B). They were then asked about their previous experience with driver assistance systems (SAE Level 1) and fully automated driving (SAE Level 5), as well as about their general attitudes towards fully automated driving.
After this block, participants were asked about their current mode choice. For the following assessment of their expected future mode choice given the three different automated driving scenarios (PAV, SAV or SAV available), a written explanation of the three AV types was provided (see Appendix B). Afterwards, participants indicated their expected mode choice for each scenario, their attitudes towards each AV type, and their expectations regarding each AV type’s service attributes.
To avoid social desirability in response behaviour, any sustainability-related reference was left out of the study’s description, and sustainability-related questions were presented as far back in the questionnaire as possible. Completing the online survey took about 35 min. Upon study completion, participants could sign in for a draw of 10 × 20 euros as a monetary compensation or, if enrolled at the university, collect credit points.

2.5. Data Preparation and Analysis

Data preparation and analysis were executed using the statistic tools IBM SPSS Statistics Version 29.0 [61] and the R Language and Environment for Statistical Computing [62] in combination with the RStudio development environment [63]. Scale values were calculated by averaging all items per scale.
Regarding transportation mode choices, each mode’s percentage share of trips made per week was calculated, and the mode with the highest percentage was identified as the main mode of transport per participant and scenario. For the future scenarios, the share of each mode was taken as an indicator of the intention to use the respective mode. As in previous studies, it was observed that some participants, regardless of their attitudes or external factors, show no interest in using any type of AV at all [33]. Therefore, we computed principal willingness to use the different AV types with a dichotomous variable. In each scenario, we assigned a value of 0 for persons who would replace none of their former journeys with the respective AV type. Participants who would replace at least one journey with the respective AV type were assigned a value of 1. A fourth variable was added to reflect general willingness to use any of the three AV types: participants who wouldn’t replace any journey in any scenario with the respective AV type were assigned a value of 0, and participants who would replace at least one journey in any scenario with the respective AV type were assigned a value of 1.
To estimate the ecological sustainability of the expected transport mode changes due to driving automation, a value reflecting sustainability was assigned to each current and future main mean of transport based on the sustainability ranking of transport modes established in Section 1.2. Low values were assigned to comparably less sustainable modes of transport, and high values to comparably more sustainable modes of transport, resulting in a ranking scale ranging from 1 (least sustainable) to 6 (most sustainable) (see Table 1). Equal trip shares for several modes of transport were handled according to the “lower beats higher” guideline, so that it was always assigned the value for the ecologically least sustainable mode of transport.
For inferential statistical analyses of the dependent variables (attitudes, mode choices, mobility needs), analyses of variances (ANOVAs) were executed with the respective dependent variables as repeated measures within-subjects factors. For the analyses of attitudes and mobility needs, current main mode of transport was added as a between-subjects factor. Whenever the assumption of sphericity was violated, Greenhouse-Geisser-corrected results are reported. Multiple post hoc test results were Bonferroni-corrected to prevent alpha cumulation errors.

3. Results

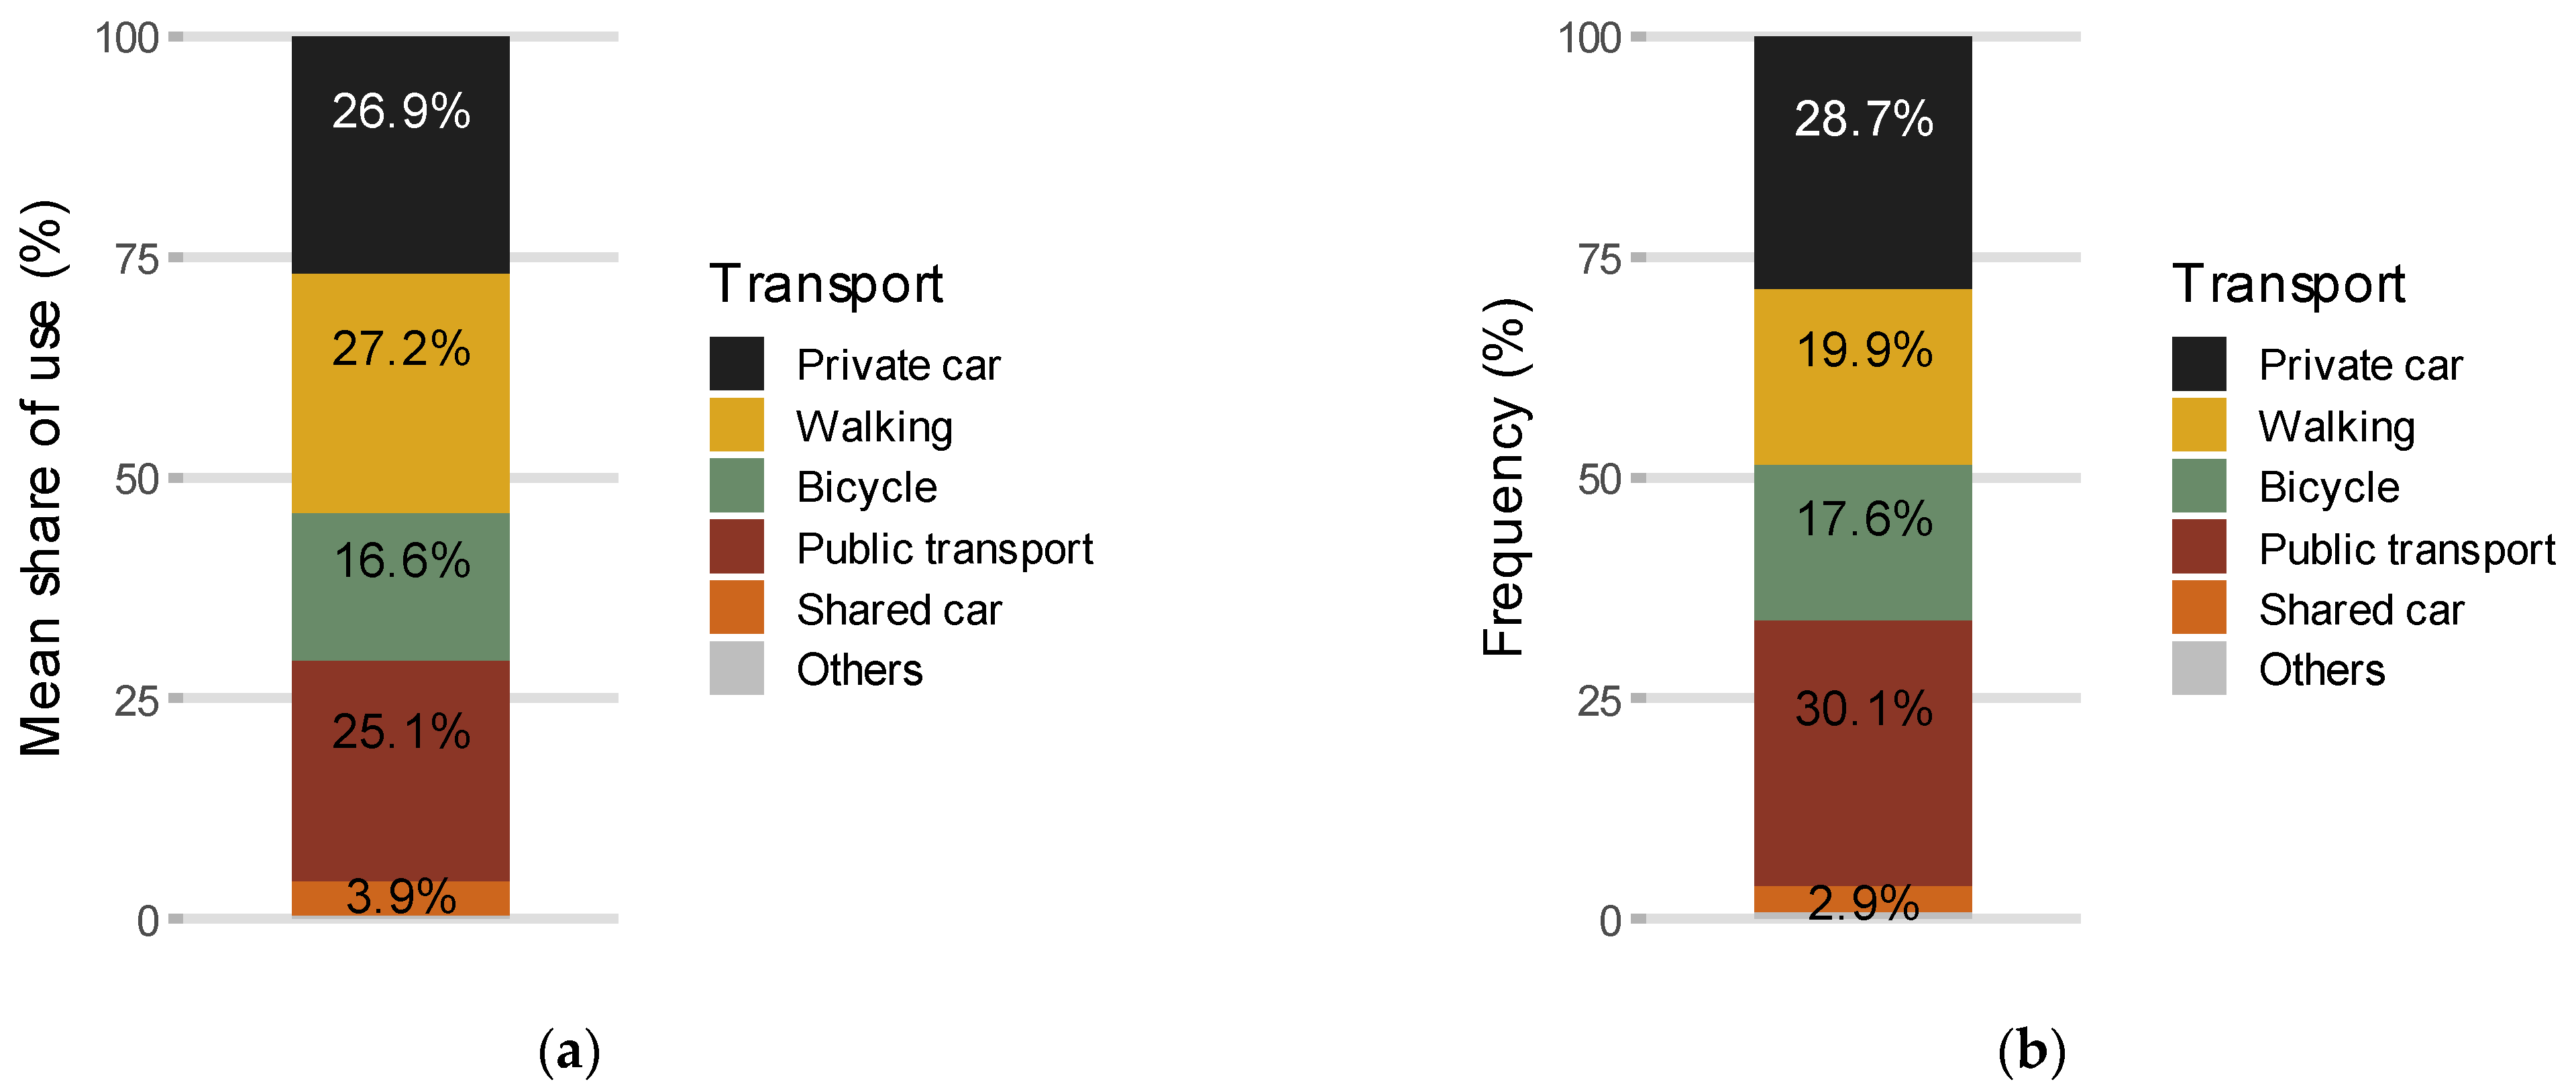
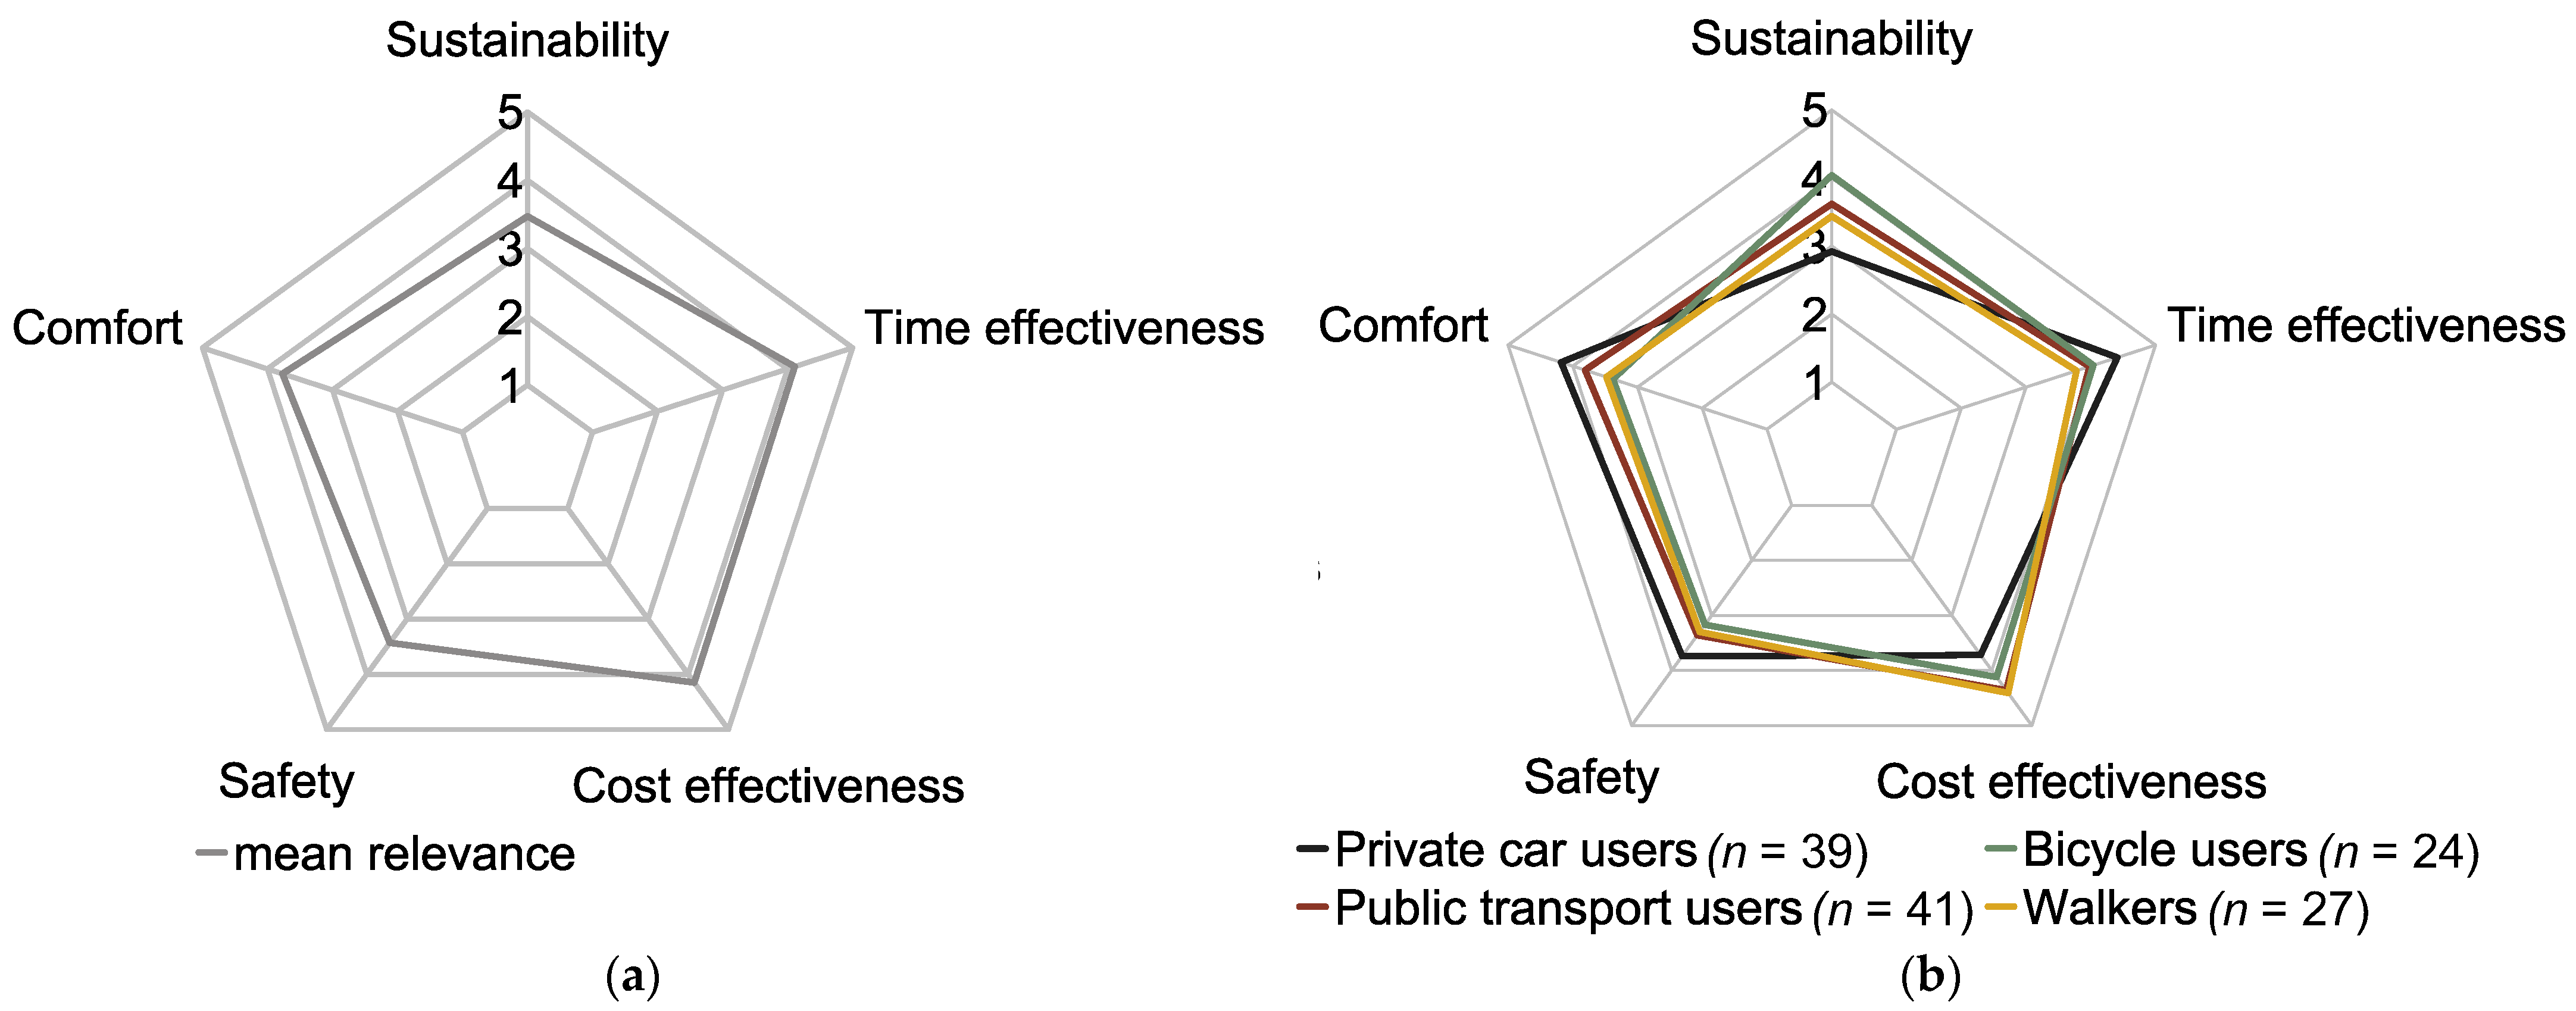
3.1. Status Quo: Current Transportation Mode Choice and Mobility Needs

As a basis for answering the research questions, we first analysed the respondents’ current mode choices in a typical week and their individual importance of the five service attributes of transportation modes.
The participants stated to undertake 21.2 trips per week (SD = 10.3) on average, with individual numbers ranging from 2 to 60 trips. Figure 1a displays the distribution of these trips over the different modes of transport. A good quarter the participants’ weekly trips are made by car, public transport, or foot, respectively. Bicycles are used for another 16.5% of trips. The remaining few trips are made by shared vehicles (carsharing or taxis) and other modes of transport (motorbikes).
It should be noted that these averaged values consistently show a very high variance. For this reason, we also identified each respondent’s main mode of transport (see Figure 1b). The comparison of both metrics reveals mostly similarities, but one major difference: although walking accounts for the largest averaged proportion of trips made, it accounts for a smaller proportion of the main modes of transport per participant, especially in favour of public transport. It can be concluded from this pattern that walking is often combined with the usage of other modes of transport.
Table 3 compares the mobility behaviour of the survey sample and the “Mobility in Germany” sample [36]. As intended in the acquisition process, the participants of this survey exhibit a more diverse mobility behaviour by using more sustainable modes of transport, especially public transport, but also cycling and walking, more often than the German average. This goes at the expense of the private car, which is in turn used for a considerably lower number of trips as by the German average.
It should be noted that the survey sample includes only very few participants who currently use shared vehicles or other modes than those covered by the five presented categories as their main mode of transport (shared car: n = 4, others: n = 1). Data on these participants can thus only be interpreted to a very limited extent. Therefore, we excluded these five persons from inferential statistical analyses in which the respondents are grouped by their main mode of transport. Conclusions from these results thus apply to persons who currently participate in traffic mainly per private car, public transport, bicycle or foot. Table 4 presents the sizes as well as the demographics of the subsamples formed by the different main modes of transport. While the four main subsamples are not exactly equal in size, they are consistent with the total sample and with each other in terms of their demographics. Thus, in every subsample, the participants are mainly students and female, with their mean age ranging from 22 to 29 years.
For the assessment of mobility needs, the participants indicated the relevance of five services attributes when choosing a mode of transport on a scale from 1 (low relevance) to 5 (high relevance), with values around 3 reflecting an indifferent opinion. All attributes received an average value of at least 3, which means that none of the presented options is considered irrelevant for mode choice (see Figure 2a). An ANOVA revealed significant differences between the five surveyed attributes in terms of their perceived importance, F(3.53, 413.74) = 17.08, p < 0.001, ηp2 = 0.12. Averaged across all participants, cost and time effectiveness are significantly more important than the other attributes. Environmental friendliness and safety were rated as least important, with comfort coming in between. However, the ANOVA also revealed a significant interaction effect between the relevance of service attributes and the current main mode of transport, F(10.60, 413.74) = 5.69, p < 0.001, ηp2 = 0.12, indicating that persons with different mode choices have significantly different mobility needs. Therefore, Figure 2b displays the perceived relevance of the service attributes separated by current main mode of transport. While people who primarily walk, cycle, or use public transport evaluated all attributes as relatively similarly important, persons who primarily use private cars exhibited more pronounced preferences: while cost effectiveness and, especially, environmental friendliness were evaluated as less relevant by car drivers than by the other groups, comfort, time effectiveness, and safety were rated as more important by them. A comparison of the three more similar groups shows that environmental friendliness is most important to bicycle users, while public transport users place more value on comfort. Among the five surveyed attributes, time effectiveness is the most important criterion for car users, while the other groups place the highest value on cost effectiveness.

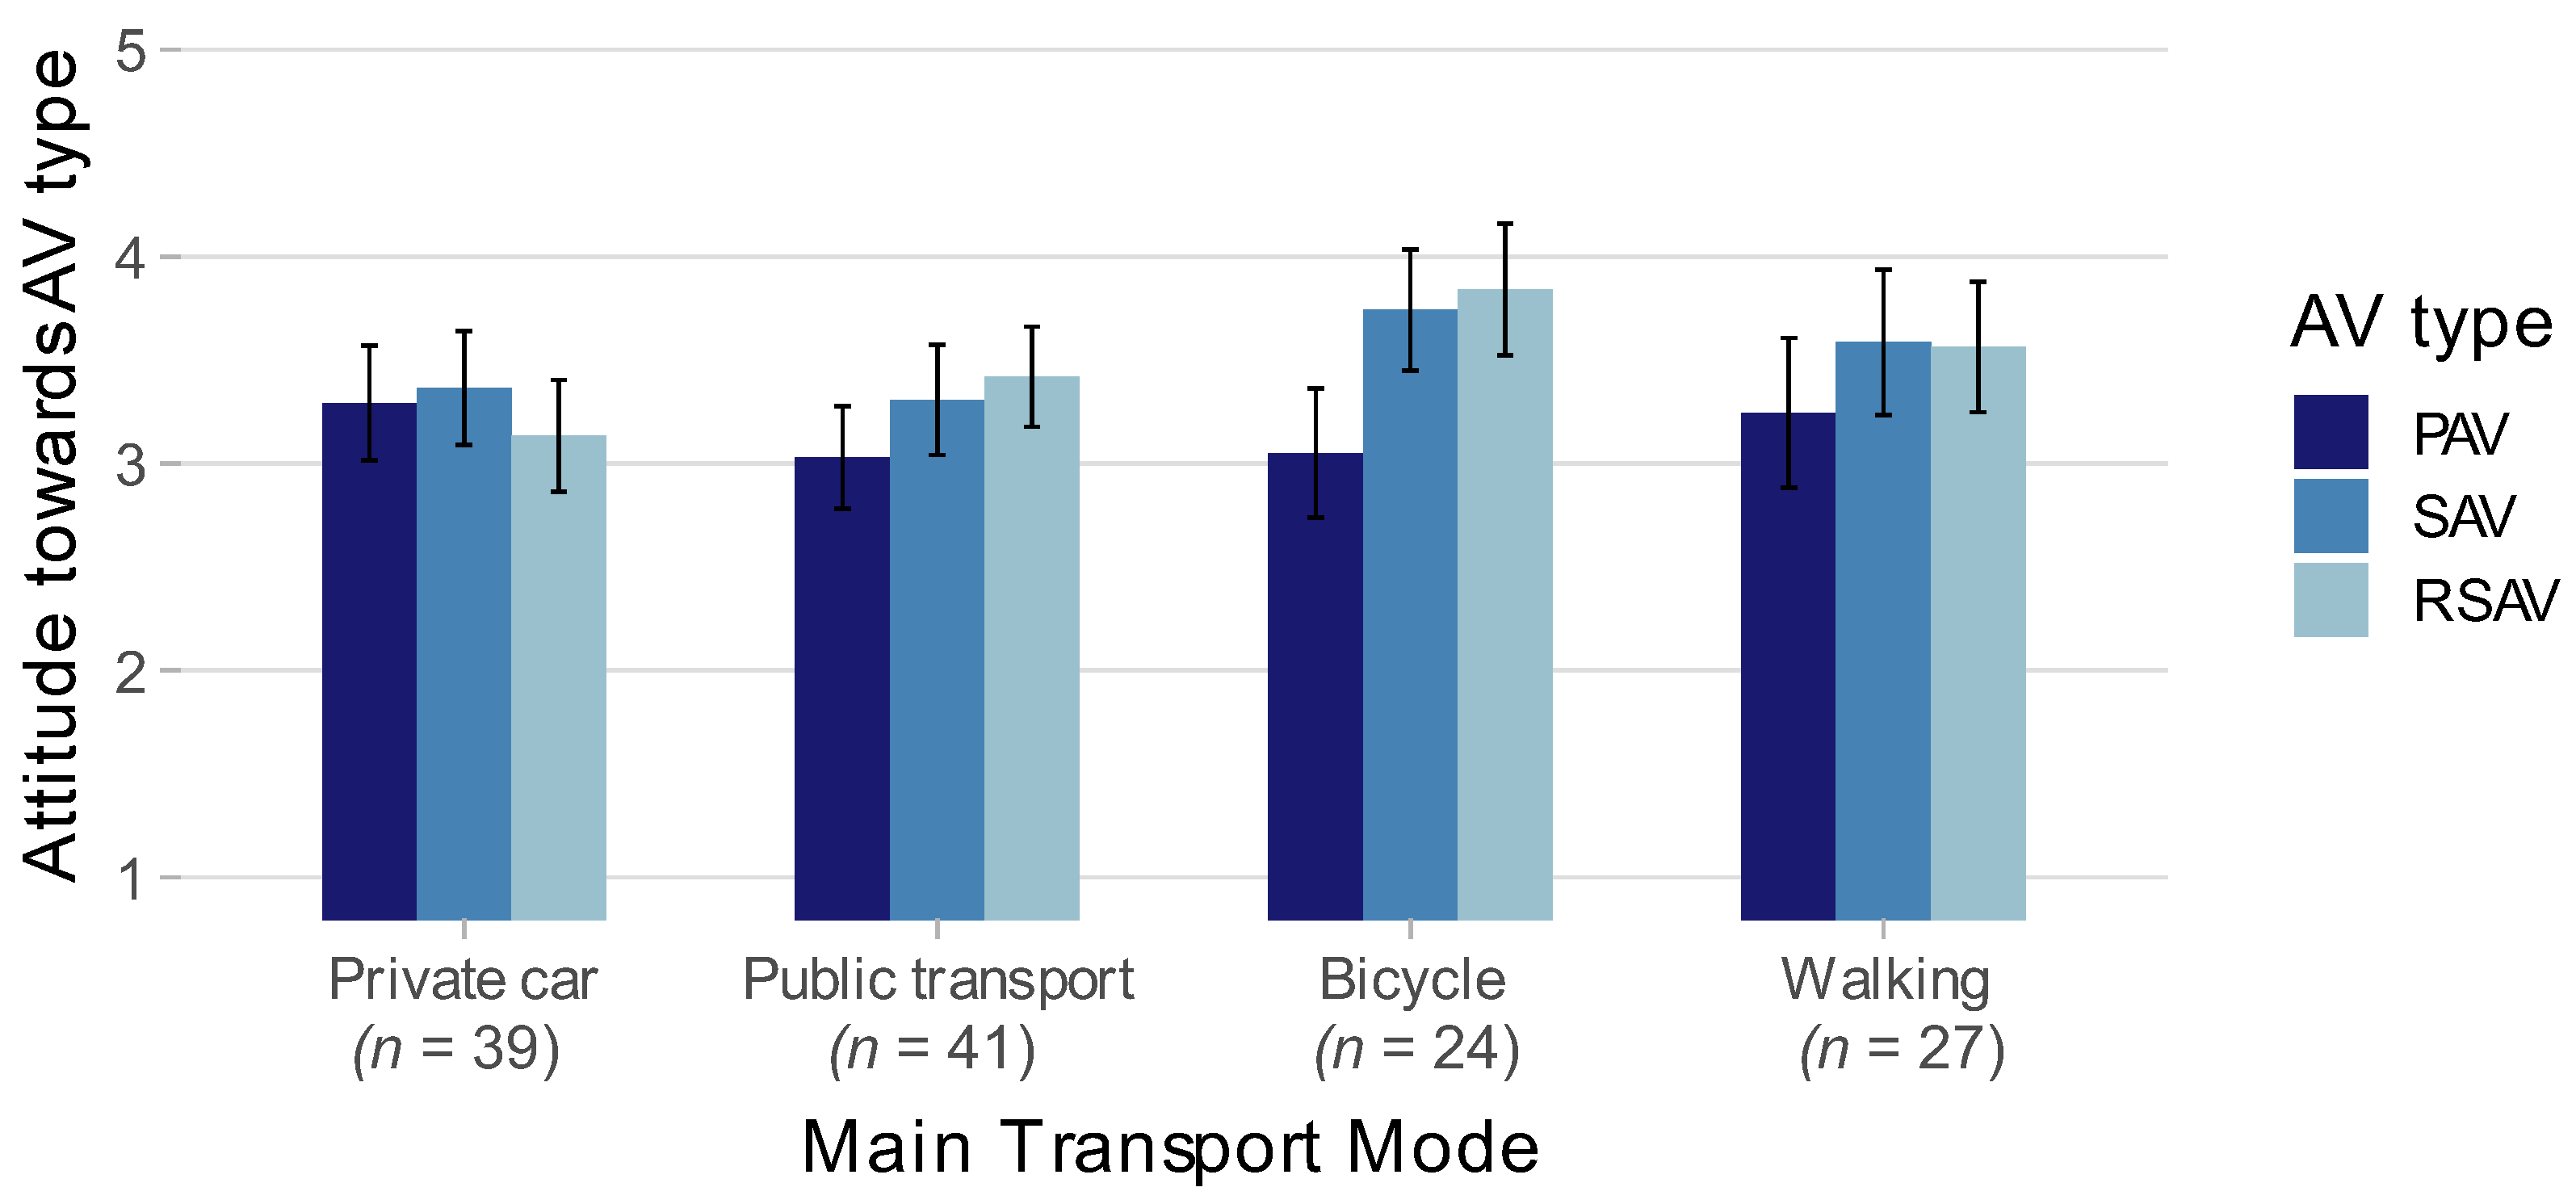
3.2. Attitudes towards Automated Vehicles (RQ1)

It is assumed that potential future users’ attitudes towards (different types of) AVs form the basis for expected mode changes, as the intention to use a novel technology requires a generally positive attitude towards it. Averaged attitudes towards all three AV types are distributed in a slightly positive range of values, indicating a general openness towards fully automated driving, with some room for improvement (see Figure 3). According to an ANOVA, the respondents reported significantly differing attitudes towards the three surveyed AV types; F(1.74, 202.52) = 16.61, p < 0.001, ηp2 = 0.12. On average, participants reported a significantly more positive attitude towards the two shared AV types (SAV, RSAV) than towards PAVs.
However, a significant interaction effect between the participants’ attitudes and current main modes of transport, F(5.21, 202.52) = 4.40, p < 0.001, ηp2 = 0.10, allows for more differentiated insights. Accordingly, higher attitudes for shared AV forms can only be observed for participants who currently mainly move by public transport, bicycle, or walking. In contrast, current car drivers report comparable attitudes towards PAVs and SAVs, but less positive attitudes towards RSAVs, which represent the highest degree of sharing among the three examined AV types. Among all user groups, cyclists report the most positive attitudes towards shared AV types.

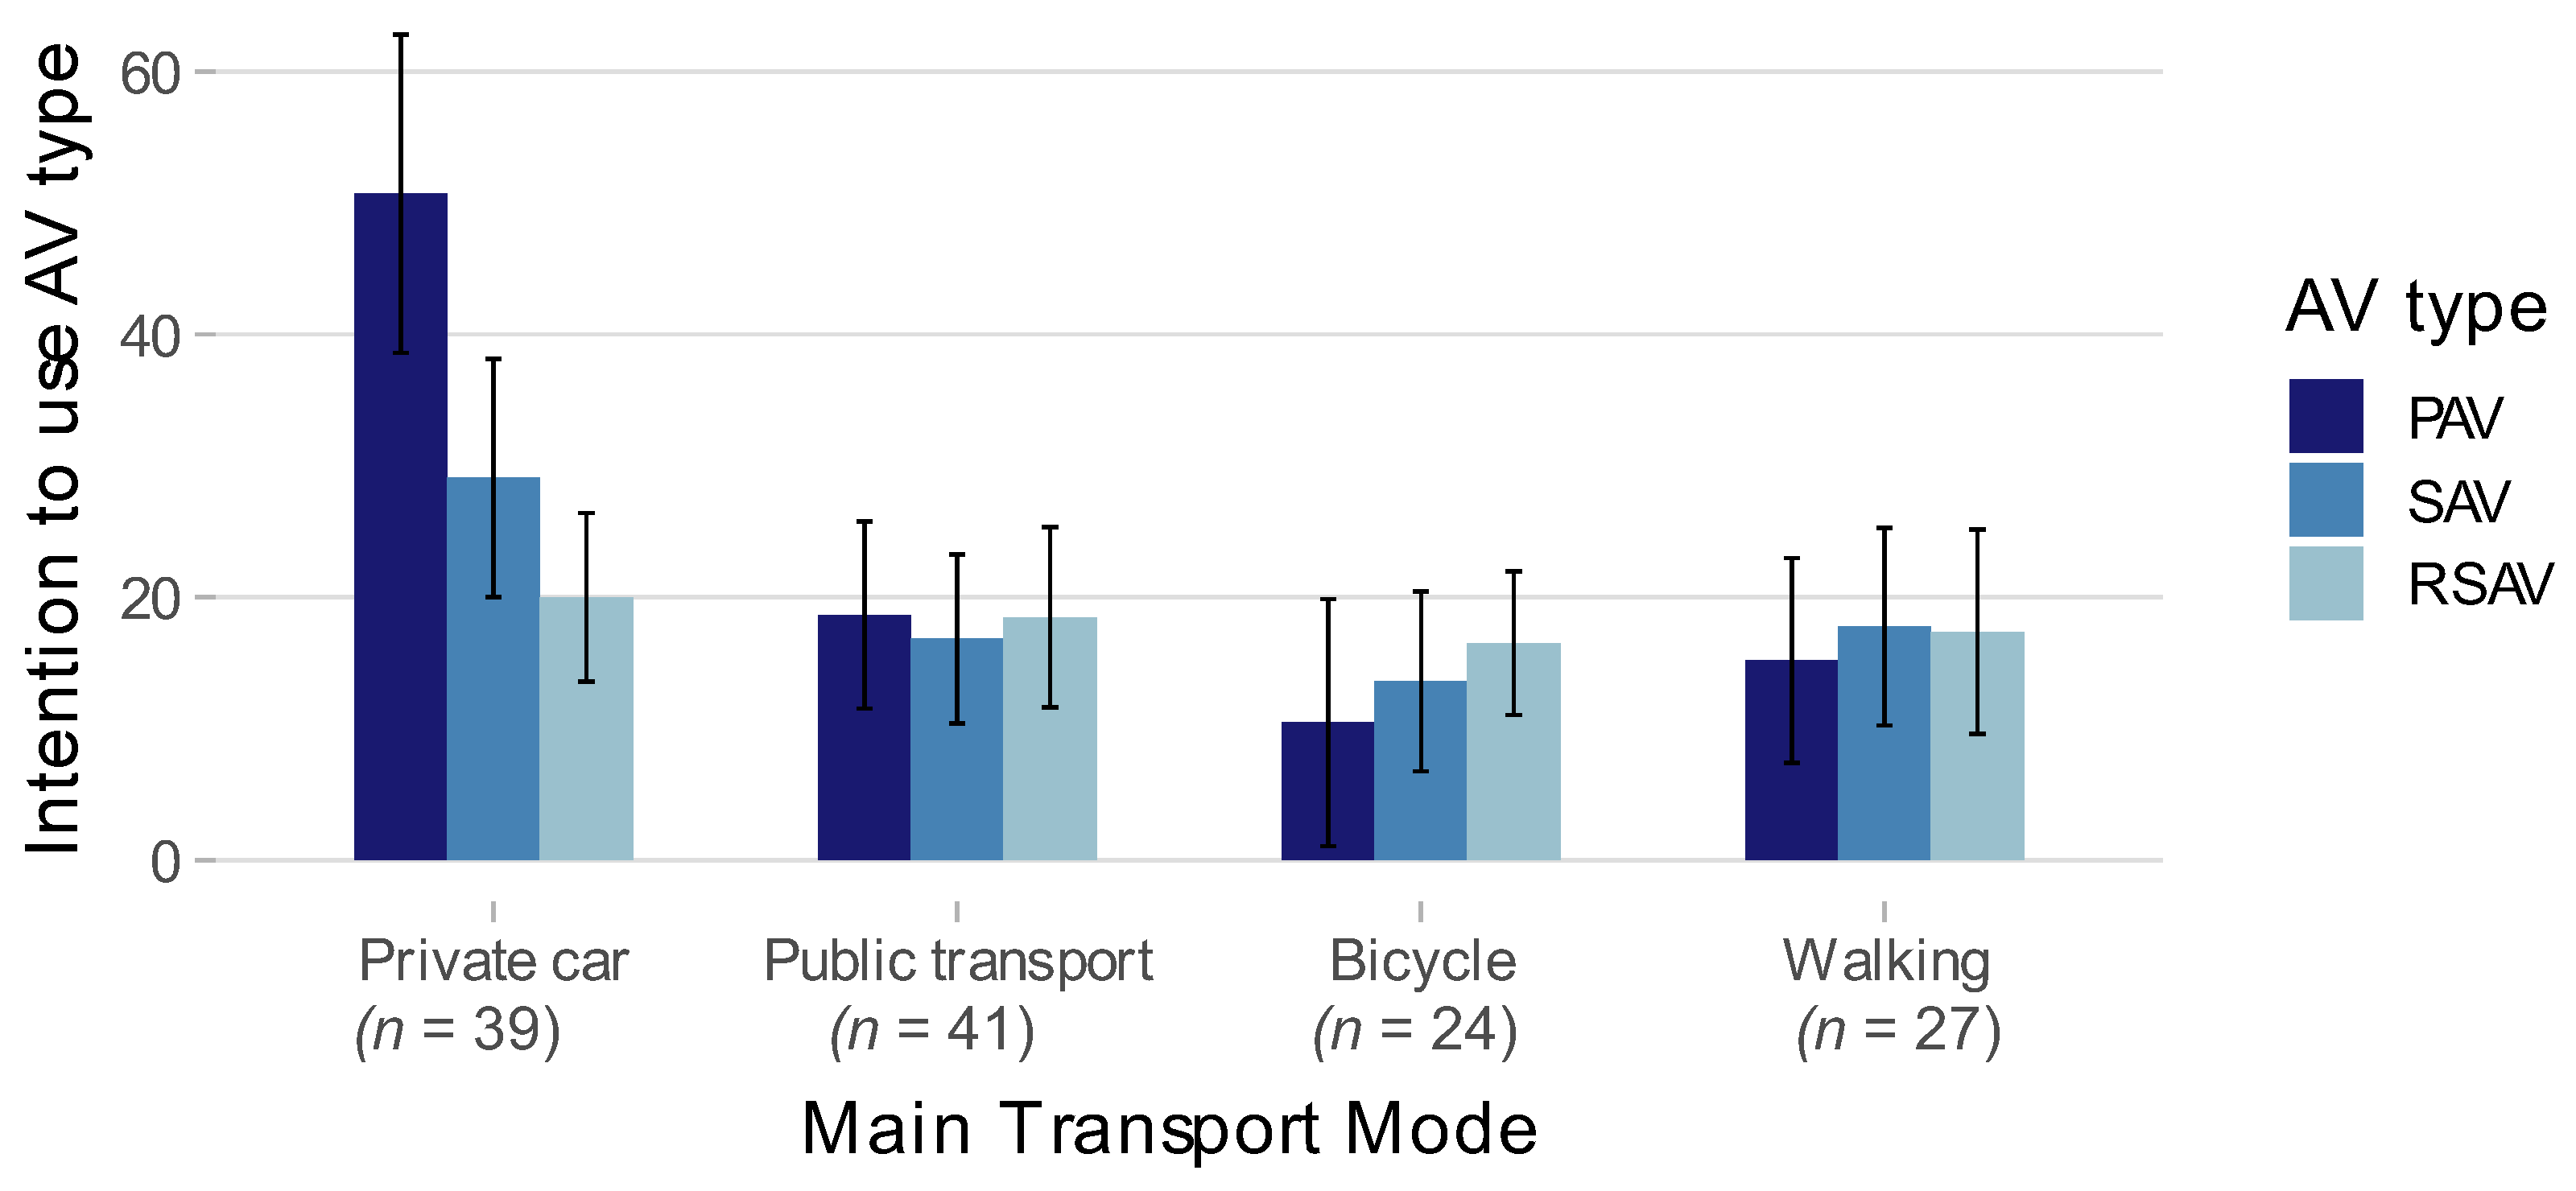
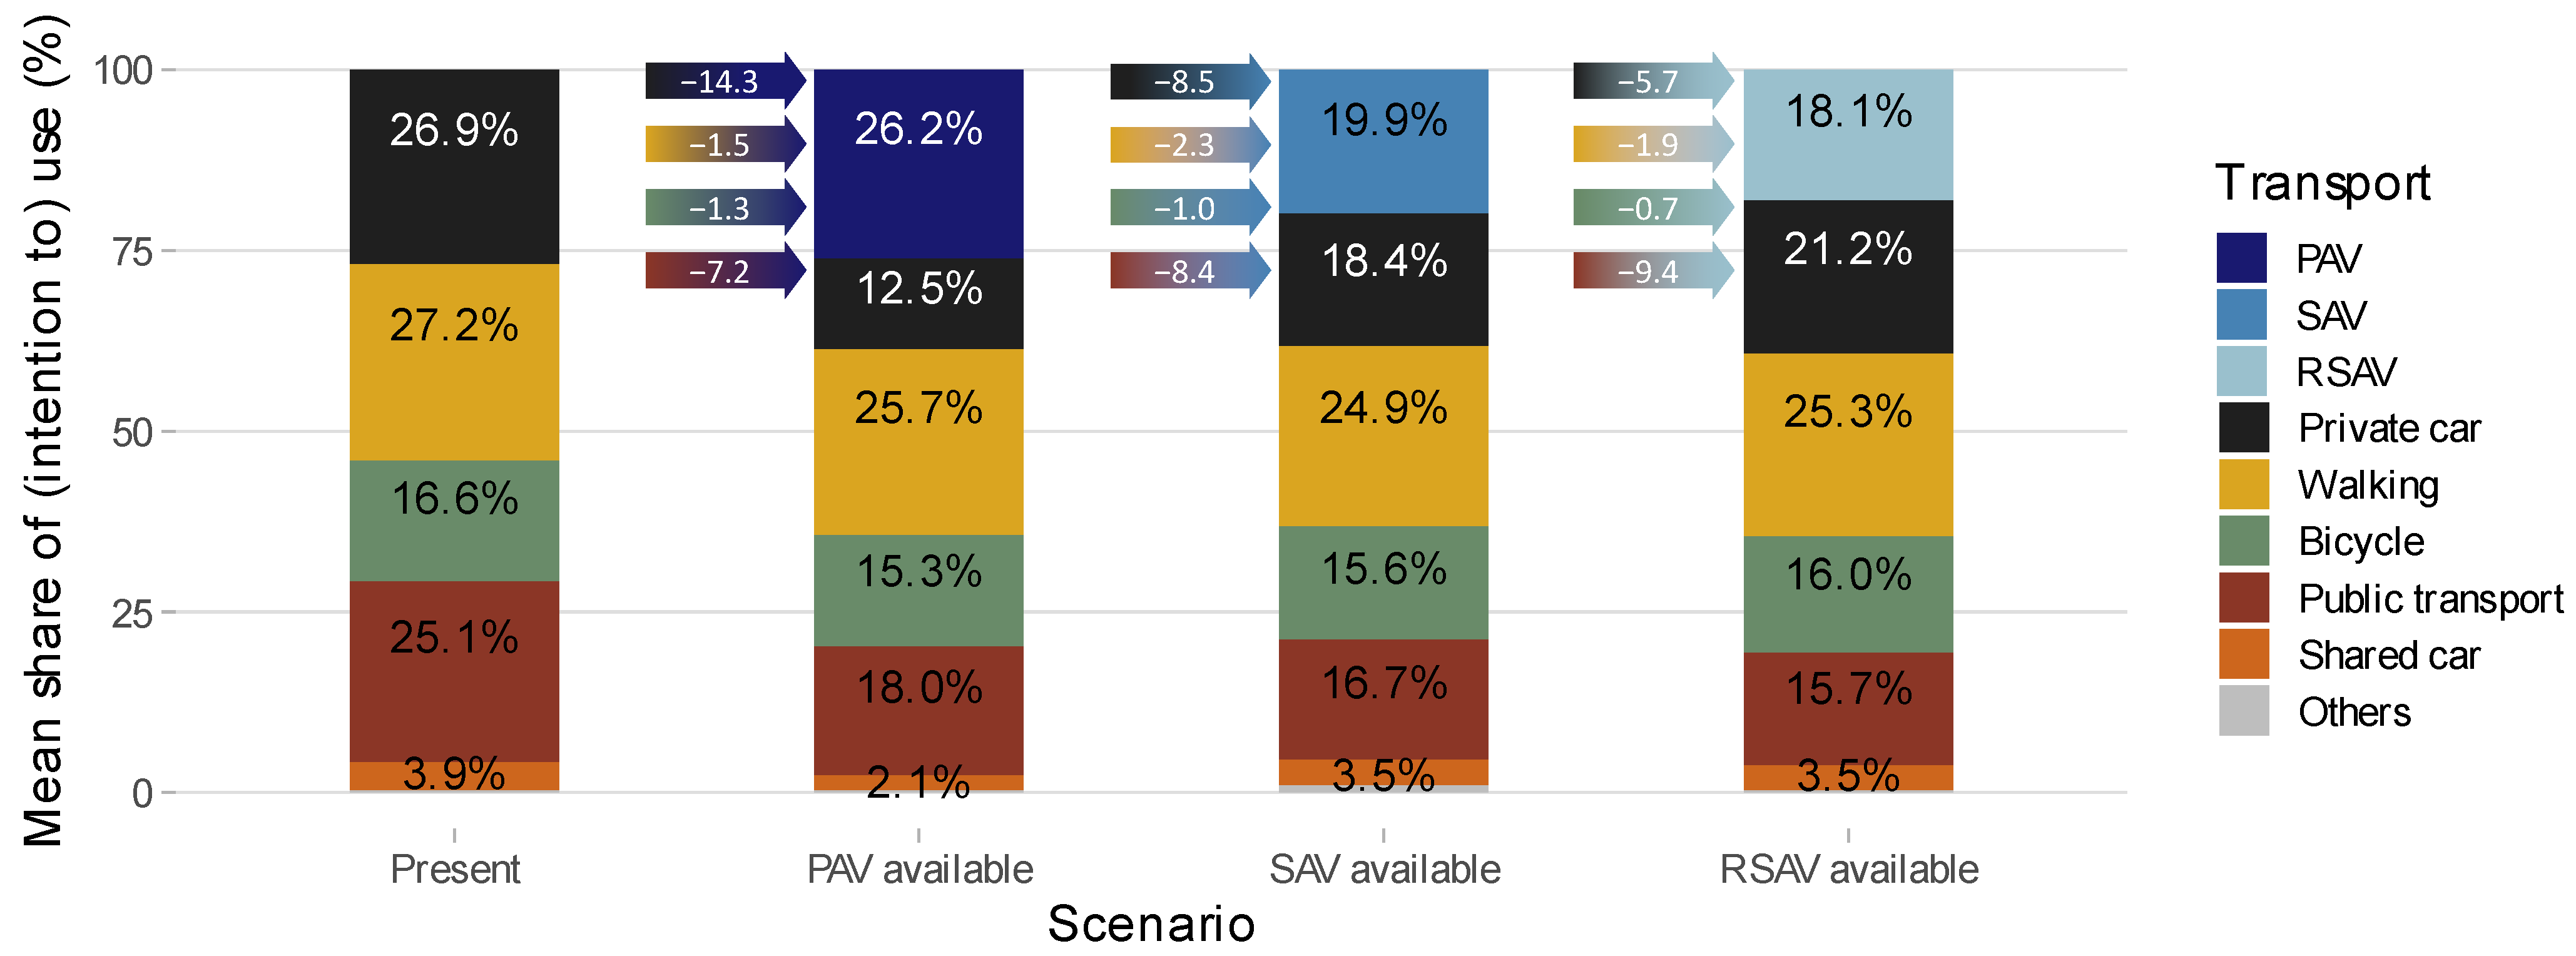
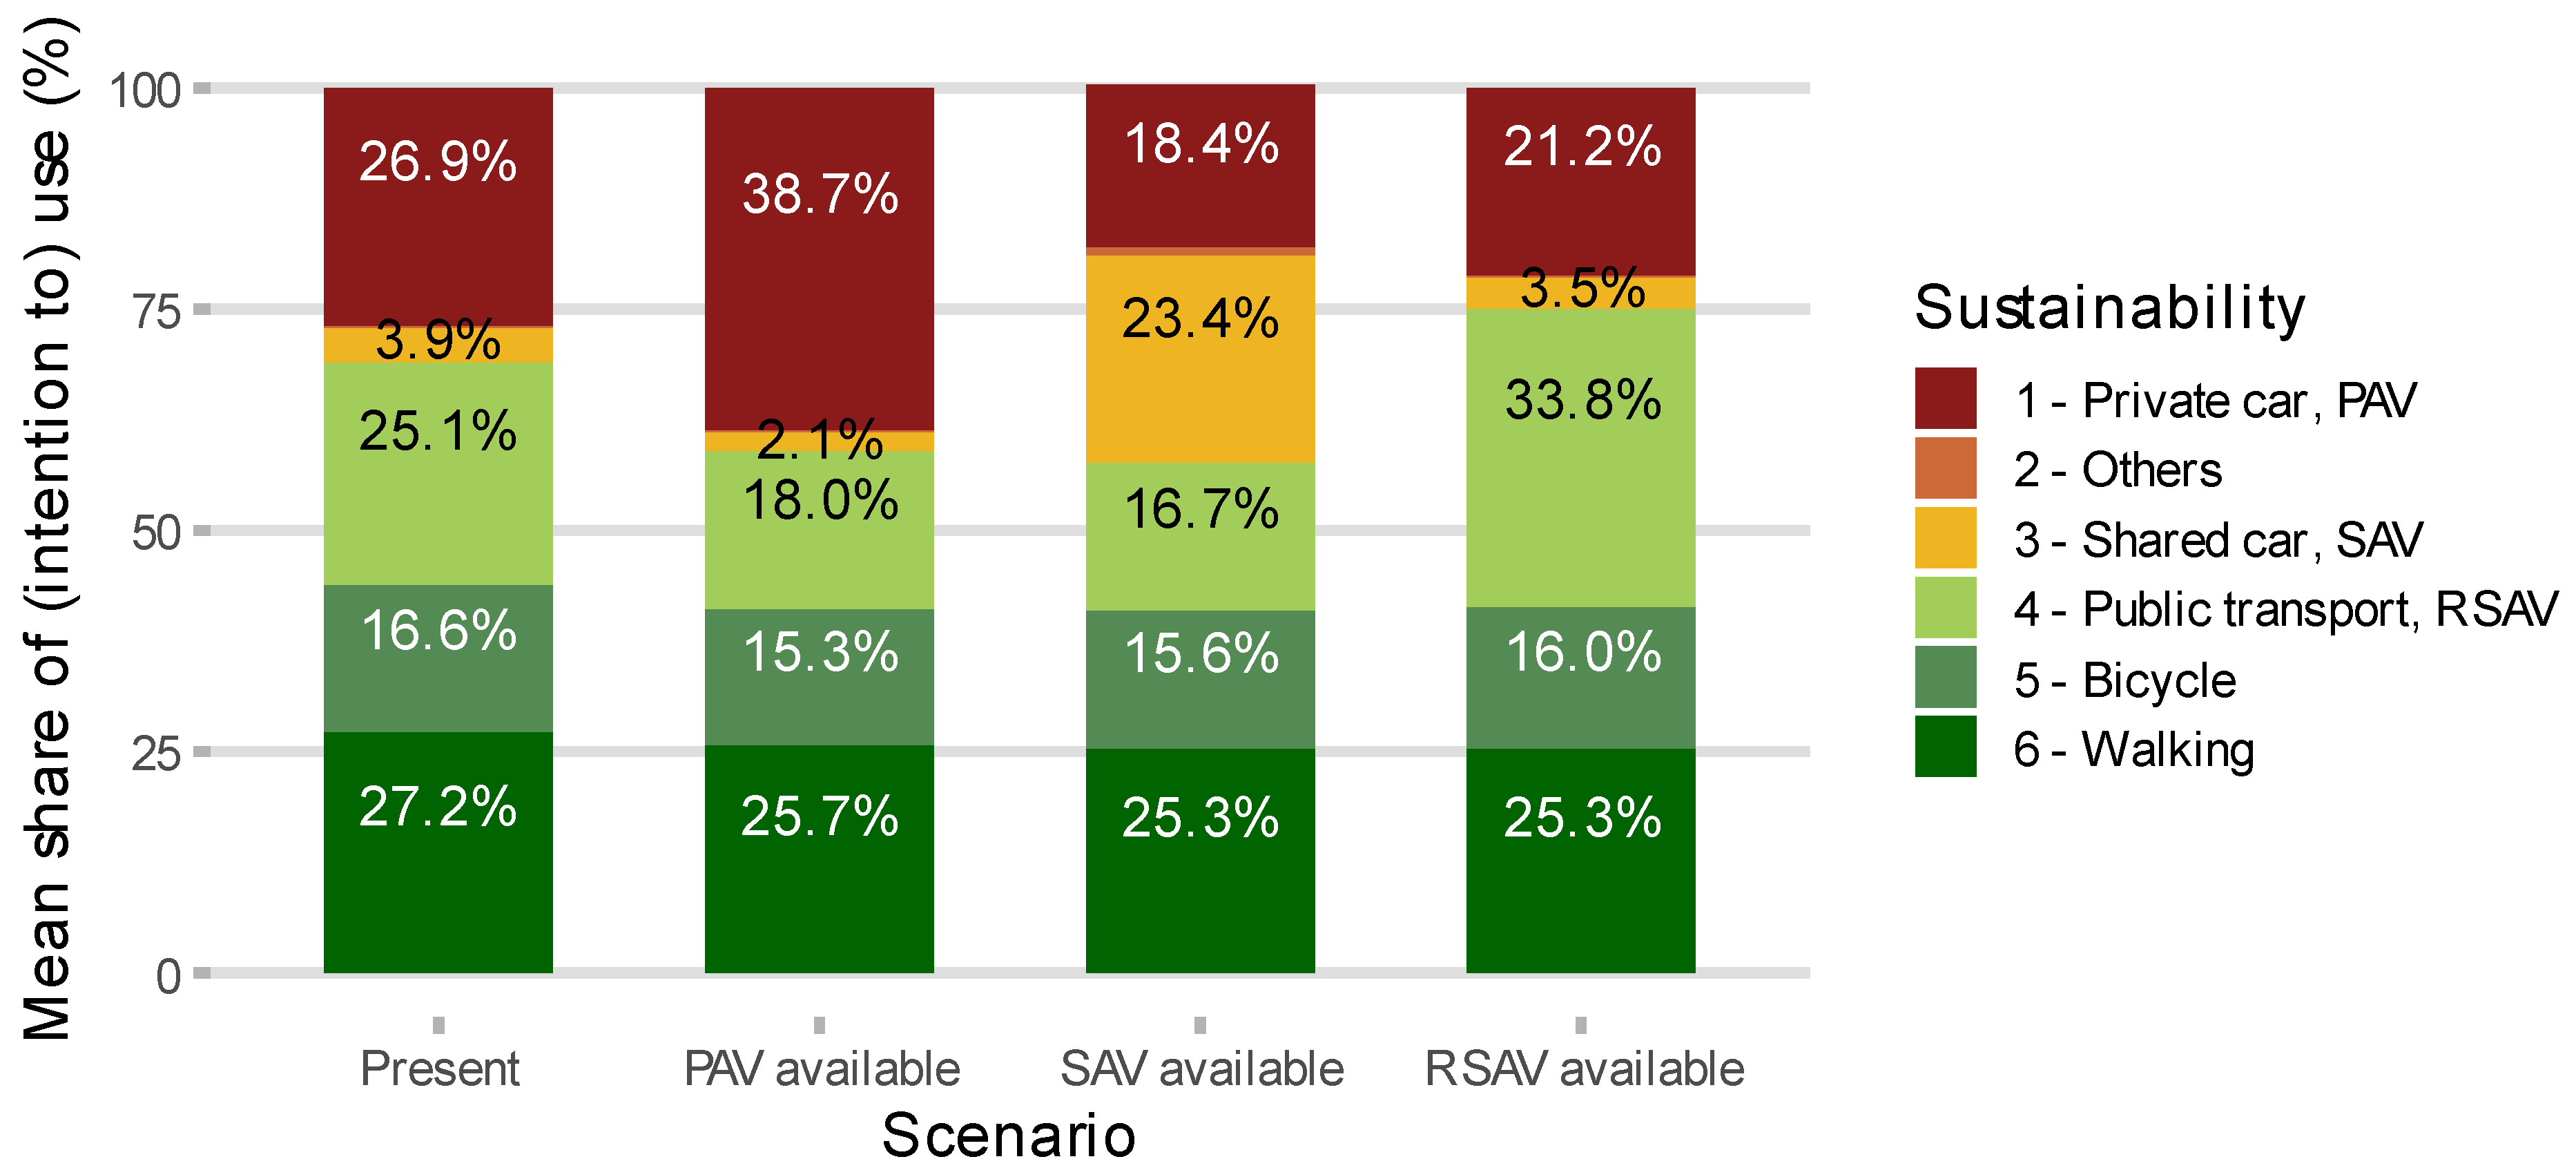
3.3. Expected Future Mode Choice (RQ2)

With generally positive attitudes towards AVs, the majority of the respondents of this survey fulfil an important precondition for their future usage, especially for shared types. To estimate whether these positive attitudes can be expected to reflect in actual system usage, we analysed the participants’ willingness as well as intentions to use fully automated vehicles, which were assessed through their mode choices under the assumption that one of each of the three types (PAV, SAV, RSAV) was available.
The willingness to use different AV types differs greatly between the respondents of this survey. As in [33], some participants (19.9% of the total sample) indicated no intention to use any of the three AV types in the future, which can be interpreted as a general lack of willingness to use fully automated driving. Correspondingly to their stated attitudes, the other participants’ willingness to use the different AV types slightly increases with a higher degree of sharing (PAV: 61.0%, SAV: 63.2%, RSAV: 65.4%).
Despite the participants’ higher general willingness to use shared AV types, concrete usage intentions in terms of the expected proportion of trips carried out with them significantly decreases with an increasing degree of sharing, on average; F(1.75, 222.69) = 3.75, p = 0.030, ηp2 = 0.03. However, as can be seen in Figure 4, a significant interaction effect between usage intention and current main modes of transport, F(5.26, 222.69) = 8.70, p < 0.001, ηp2 = 0.18, reveals that this effect can only be expected from current car drivers. In contrast, public transport users and pedestrians expect a comparable proportion of trips to be carried out by AVs in each AV scenario, and cyclists even report a slightly increased proportion of trips for shared than for private AV types.
For the analysis of expected mode changes, Figure 5 compares the complete samples’ averaged current distribution of trips over the different modes of transport with the expected distribution, under the assumption that one of each of the three AV types was available. On average, the participants would cover 26.2% of their trips with PAVs, which represents a distinctively higher proportion of trips compared to SAVs (19.9%) as well as RSAVs (18.1%).
Assuming that intentional changes in trip proportions in the future scenarios mainly take place in the direction of automated vehicles, and that changes between the other modes of transport are negligibly rare, the trip proportions assigned to the three AV types can be traced back to the modes of transport currently used instead. The 26.2% of trips that would be made with PAVs were previously made with the following modes: 14.3% private car, 7.2% public transport, 1.5% walking, 1.3% bicycle, 1.9% shared car. That means that about half of the trips intended to be made by PAVs are currently made by private car, whose proportion of trips would be reduced to 12.5%. The second largest proportion of trips intended to be made by PAVs results from trips currently executed by public transport, whose proportion of trips would also reduce to 18.0%.
For the 19.9% of trips that the participants would make with SAVs, the following modes of transport are currently used: 8.5% private car, 8.4% public transport, 2.3% walking, 1.0% bicycle, 0.4% shared car. As for PAVS, the largest, even though in comparison significantly smaller, proportion of intended trips results from trips previously made by private cars. In this scenario, the proportion of public transport trips decreases even further than in the PAV scenario, resulting in a proportion of 16.7%. In contrast, the proportion of car trips increases to 18.4% compared to the PAV scenario.
The 18.1% of the trips that the participants would make with RSAVs is made up of the following current mode choices: 9.4% public transport, 5.7% private car, 1.9% walking, 0.7% bicycle, 0.4% shared car. With 21.2%, the share of car trips is almost twice as high as in the PAV scenario. The share of public transport trips continues to decrease slightly to 15.7%. Cyclists change their trip shares only minimally in all scenarios.
The ecological implications of these mode changes become clearer when the (presumably) used modes of transport are considered in terms of their sustainability. Therefore, Figure 6 categorises the chosen modes of transport in each scenario accordingly to the sustainability ranking established in Section 1.2 (see also Table 1). Higher numbers in the ranking (depicted in darker greener shades) indicate a higher ecological sustainability of the chosen mode. This visualisation shows that only in the RSAV scenario the distribution of transportation modes shifts in a more sustainable direction. Meanwhile, in the SAV, and especially in the PAV scenario, a larger proportion of the trips can be expected to be executed by less sustainable modes of transport than today.

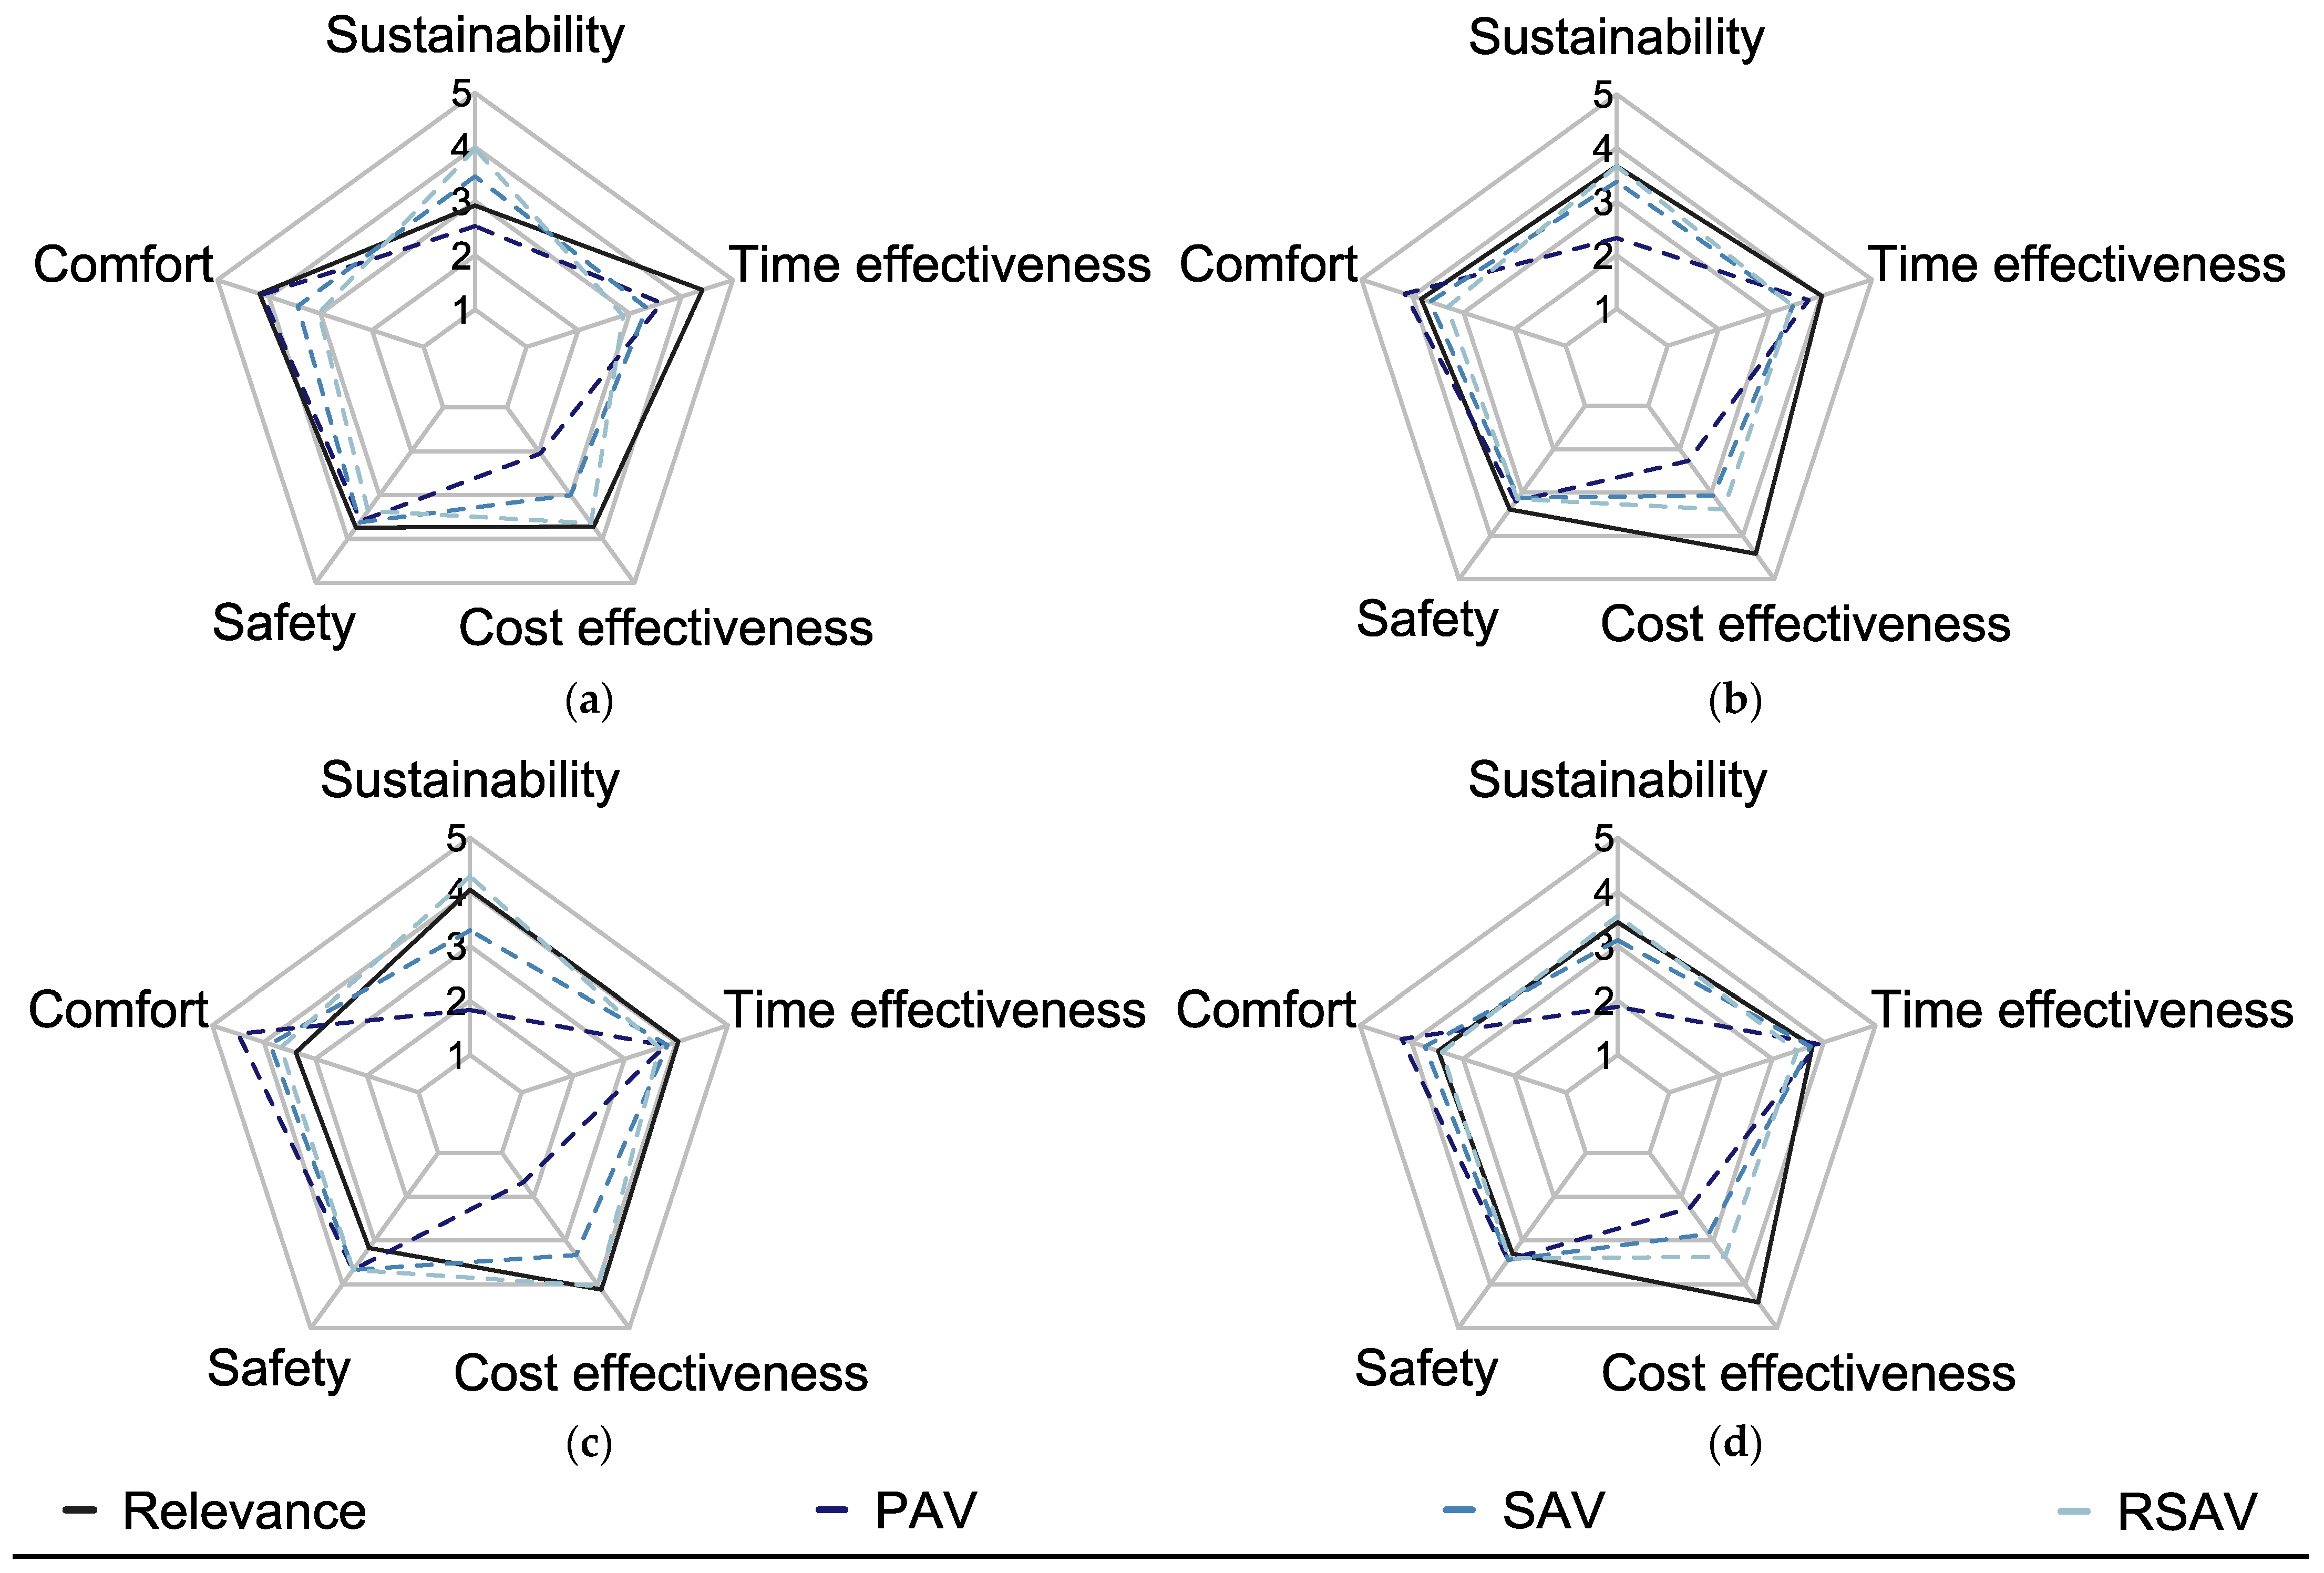
3.4. Fulfillment of Mobility Needs through Driving Automation (RQ3)

As a possible factor influencing the intended usage of different AV types and, therefore, a partial explanation for the expected future mode choices, we analysed the participants’ expectation of how AVs would fulfil their mobility needs.
Figure 7 depicts the different (i.e., separated by their current main mode of transport) participants’ averaged assessment of the three AV types in terms of the five surveyed service attributes (i.e., how sustainable, safe, comfortable, time and cost effective they expect each AV type to be). ANOVA results on the statistical significance of differences between participant groups as well as AV types can be found in Table 5.
Across all participants, presumed safety is rated comparably high (slightly above average) for all AV types. For all AV types, participants assume a comparably high time effectiveness as well (slightly above average), even though expected time effectiveness decreases with increasing degree of sharing (F(1.70, 216.22) = 11.62, p < 0.001, ηp2 = 0.09). When it comes to the remaining three attributes, participants’ expectations differ more clearly. PAVs are assessed as a rather expensive mode of transport, while SAVs and RSAVs are each expected to be significantly cheaper (F(1.83, 231.98) = 187.56, p < 0.001, ηp2 = 0.60). This is especially important as participants are placing the highest importance on cost and time effectiveness regarding the examined mobility needs. Comfort ratings exhibit a similar pattern of significantly lower ratings with increasing degree of vehicle sharing, even though the three types are expected to be more similar (F(1.84, 233.93) = 53.92, p < 0.001, ηp2 = 0.30). On average, the participants recognise the sustainability-related differences between the different automated vehicle types, which are rated as significantly more ecologically sustainable with increasing degree of vehicle sharing (F(1.80, 228.33) = 222.97, p < 0.001, ηp2 = 0.64). As with cost effectiveness, the expectations of the two shared types are closer to each other, while PAVs are considerably lower rated.
However, the participants’ assumptions on most of the service attributes of AVs not only differ significantly between the different AV types, but also between persons with different main modes of transport, as can be seen in Figure 7 and Table 2. The perceived differences in sustainability are most pronounced for cyclists, while all other groups do not perceive notable differences between the two shared types. The sustainability assessment of PAVS differs notably between the groups, with the highest ratings from car drivers and lowest ratings from cyclists and pedestrians. Cyclists also exhibit the most pronounced differences in their perception of the AV types’ cost effectiveness, which they assess as considerably low for PAVs and considerably high for RSAVs. Comparable to the sustainability ratings, all other groups do not show significant differentiations between the two shared AV types in terms of expected costs, while all groups expect these AV types to be more cost effective than PAVs. The higher the time efficiency of all AV types is rated, the more sustainable the participants’ current main mode of transport is, which corresponds to lower current time effectiveness and, therefore, higher time gains due to AVs.

4. Discussion

The aim of this online survey was to contribute to estimating the ecological effects of introducing fully automated vehicles (AVs) to society. Therefore, potential future users’ expected transportation mode changes under the availability of three different AV types with different ecological benefits (PAV: private AV, SAV: shared AV, RSAV: ride-shared AV) were identified. As there is already a broad foundation of research done on socio-economic factors such as residential location, income or car ownership [64,65,66], or influencing transportation mode choices, this study was focused on peoples’ attitudes and needs as explanatory factors. The results can be used as starting points to derive strategies for an ecologically sustainable implementation of driving automation, which is expected to play a key role in fighting climate change by significantly reducing the emissions of the transport sector.

4.1. Summary and Interpretation of Results

In terms of current transportation mode choices, the participants of the survey represent a rather balanced than representative sample. Thus, the proportion of weekly trips by public transport, cycling, and walking is higher than in the population, according to the results of [36]. The sample thus already exhibits a more environmentally-friendly mobility behaviour than the German average. Nevertheless, expected mode changes due to the introduction of AVs (RQ2) suggest the same pattern as previous studies [21]: in all three AV scenarios, mode changes towards AVs are primarily at the expense of public transport. On the contrary, private cars, the replacement of which by AVs would represent the ecologically most beneficial mode change, are most likely to be substituted in the PAV scenario, which represents the least ecologically sustainable AV type. The modal shift that can be expected due to the introduction of AVs will therefore be at the expense of the expected ecological benefits of driving automation even in this specific survey sample. The main patterns contributing to this expected rebound effect are mode changes from comparably sustainable modes of transportation (walking, cycling, public transport) to AVs, including mainly PAVs, as well as the unwillingness of current car users to switch to shared AV types (SAV, RSAV).
Interestingly, the results include some notable differences between the two groups with the most sustainable main modes of transport, walking and cycling. Persons who indicated walking as their most used mode of transport seem to be more in line with public transport users than with cyclists in terms of their attitudes and expectations towards AVs. The similarities between these two groups can probably be traced back to the finding that walking is often combined with other modes of transport, especially public transport. These results suggest that on average, walking is chosen as a main mode of transport for different reasons than is cycling. Especially in combination with public transport, walking may be more comfortable than cycling, whereas cycling might often be consciously chosen as a particularly sustainable mode of transport. This result is especially interesting since walking and cycling are often considered as a homogeneous group of non-motorised private transport modes. However, this grouping could mask differing influences on transportation mode choices and could thereby hinder the derivation of adequate strategies for a sustainable introduction of AVs. Future studies should therefore differentiate the motivational structures of bicycle users and walkers.
When considering the intention to use the different AV types against the background of underlying attitudes (RQ1), an interesting contrast emerges for the averaged sample: the higher the degree of sharing, the more positive the attitude towards the respective AV type, but the lower the intention to use it. Attitudes towards the different AV types can help to predict corresponding usage intentions, but are seemingly not able to compensate for other counteracting influencing factors (such as time constraints, habituality, or missing self-efficacy) [67]. This finding is similar to the well-known intention-behaviour-gap which especially, but not only, occurs when examining ecologically sustainable behaviour. The intention-behaviour-gap describes the problem that, despite being described as a strong predictor for action in theories of behaviour, intentions can only explain around 20% of variance in action [68], and changed intentions do not always lead to changed behaviours [69]. A similar pattern of positive attitudes not always translating into concrete usage intentions due to counteracting factors might provide a part explanation for this result pattern. Another part of an explanation is provided by a more differentiated analysis of different groups of potential users: when examining attitude and intention separately for users of different modes of transport, it becomes clear that the respondents’ attitudes and intentions follow different patterns according to their current main mode of transport. While higher attitudes for shared AV types are mainly exhibited by users of public transport, cyclists, or people who walk, lower usage intention for those types is mainly stated by users of private cars. Therefore, expressed attitudes and intentions are about in line with each other for all participants except current car users. As private car users should especially be the ones changing to shared AV types, it is important to find a way to bridge this gap between attitude and intention. Therefore, the specific factors counteracting the alignment of attitudes, usage intentions and actual usage regarding different AV types, especially for the subsample of current car drivers, should be the subjects of future studies.
Differences in the AV type assessments of users of different modes of transport reveal knowledge as an additional factor influencing future mode choices: even though it is essentially clear to the participants that there are ecologically sustainability-relevant differences between private and shared AV types, car drivers consider PAVs to be clearly more environmentally sustainable than users of other modes of transport. With this assessment, car drivers could be mistakenly led to using PAVs with the idea of doing something supposedly environmentally friendly. This result illustrates the importance of educational measures to sensitise future users to the potential sustainability impacts of different AV types and to strengthen the usage of shared AVs. An important component of this measure should be to not postulate AVs as a measure of fighting climate change, regardless of specific usage models.
This difference in knowledge could also be an explanation for the differences in attitude and usage intention between the four groups. While people who currently use more sustainable modes of transport are also more informed about the sustainability of these modes, they may also know more about different AV types in general. Car users, on the contrary, may not be interested in the specifications of different AV types, as they prefer private transport modes. Therefore, it could have been harder for these participants to imagine the different types of AVs. To further examine their usage intentions, it might be helpful to conduct studies with specific information on price models, journey time, and other journey-related factors of the different AV types.
The participants’ assessment of the three AV types in terms of the five surveyed service attributes and the resulting expected fulfilment of their mobility needs (RQ3) helps with understanding the motivations behind different AV choices. While the shared AV types are expected to be cheaper than PAVs, as well as more sustainable, they are also perceived to be less time-efficient and less comfortable. Even though participants place a relatively high value on the sustainability of their mode of transport, the other needs are valued slightly more and, therefore, probably outweigh the need for a sustainable mode of transport. The needs for a time- and cost-effective mode of transport are almost identical; nevertheless, participants prefer the private AV type over the shared ones, which clearly differ in their expectations of time and cost efficiency. A possible explanation could be found in the relative importance of the different service attributes. The results of this survey indicate that, in general, the needs for comfort and time effectiveness weigh more than the needs for a low-cost and sustainable mode of transport.
However, it is again important to differentiate between users of different main modes of transport. Users of private cars, especially, place greater value on comfort and time effectiveness, and lesser value on sustainability. The users of more sustainable modes of transport place just slightly lower value on time effectiveness, but considerably higher value on sustainability, and higher value on cost effectiveness. When interpreting the differences between these groups, it should be noted that the subsamples differ slightly in age, gender shares, and prevalent occupation. Most notably, the private car users represent a slightly older group, with the least proportion of students, while the public transport users represent a slightly younger group, with the largest number of students. In comparison to full-time employees, students might, on average, exhibit a more positive attitude towards shared AV types as well as less interest in time effectiveness, as they might be less challenged by time constraints or by the need for transporting children or groceries for a family. Nevertheless, it is important to design shared AV types in a way that they best meet private car users’ requirements for comfort and time effectiveness. Additionally, attractive pricing models should be implemented for shared AV types to counteract mode changes from users of more sustainable forms of transport to PAVs. Furthermore, the specific motivational patterns of car drivers also provide another reason for their comparable lack of knowledge on the sustainability differences between the AV types: their lack of the subjective relevance of ecological sustainability as a service attribute might lead to less information seeking behaviour on this topic. These results indicate the importance of additional measures demonstrating the relevance of sustainability-relevant mode choices to the public.

4.2. Limitations and Future Research

The presented results must be interpreted considering some methodological and thematic limitations, which should be addressed in future research to receive a more detailed picture of the ecological sustainability of AVs from a behavioural perspective.
As the most important methodological limitation, it must be noted that the survey sample is quite small and not representative of the population. Participants are mainly female, comparably young, and well-educated. Most importantly, their averaged current transportation mode choices are more environmentally friendly than the averaged choices of the population. Based on the current findings, it can be expected that a larger sample would amplify the presented effects contradicting the ecological sustainability of AVs. For example, a larger sample would cover more population groups, such as elderly or disabled persons, who would gain a large benefit from the introduction of AVs [37] and who might therefore express even stronger positive opinions and usage intentions than the analysed participants. A more representative, i.e., more evenly distributed sample in terms of gender would add to this effect, as previous studies identified a higher openness and stronger usage intention regarding AVs in male than in female participants [37,38,39,47,49]. Additionally, a more representative sample would include fewer people who currently choose more sustainable forms of transport for ecological reasons, and more people moving mainly by car, which might lead to an even stronger preference for private over shared AV types.
However, the specific composition of the sample also provides some advantages regarding the goals of the survey: population groups with a high level of education and high income are most likely to be able to afford AVs. Therefore, the present sample corresponds well to early AV users and can be used to predict early processes when introducing AVs into society. In addition, the roughly equal distribution of main modes of transport (private car, public transport, cycling, walking) among the participants creates a baseline that is more sensitive to detecting environmentally unsustainable mode changes. In a more representative sample with predominantly car users, the possibility of detecting such changes would hardly exist, since possible mode changes could only be in the direction of consistent or higher ecological sustainability. However, considering the limitations of the sample, there is a need for follow-up studies with larger and more representative samples in order to increase the statistical power and generalizability of the presented results. Such larger sample sizes would also allow for more elaborate analysis methods, such as Structural Equation Modelling, with which it would be possible to examine the relationship among the independent variables themselves as well as their relationship with mode choice behaviour directly.
Another methodological limitation might concern the participants’ mental representations of the evaluated AV types, which were probably influenced by previous AV and transportation mode experiences as well as the AV type descriptions presented in the survey. Thus, the participants’ general lack of AV experience, and the lack of concrete specifications of the different AV types in terms of journey durations and costs, could have complicated adequate assessments of the AV types during the survey. While experiences with different current modes of transport might have facilitated estimations of different AV types’ time effectiveness for some participants, estimations of the cost effectiveness might have been more difficult, since there are currently no comparable services and technologies available, and even current modes of transport present a huge price range. This issue might have contributed to the presented result patterns, such as the increasing positive attitudes but decreasing usage intentions towards AVs with a higher degree of sharing. As revealed by the subsample comparisons, this effect was mainly driven by the specific attitudes and usage intentions of car drivers, whose previous transportation mode experiences might deviate from those of the other subsamples. Tailored recommendations regarding sustainable and attractive AV business models will therefore require further studies examining single service attributes through specific scenarios, defined by journey duration, cost, and, perhaps, additional specifications.
On the thematic side, this survey can only represent a small selection of factors influencing future transportation mode choices. It adds upon an already existing empirical foundation of variables which can be helpful in predicting future mode choices in general, as well as AV usage intentions. These variables include demographic factors such as age, educational level, income, household size/type and place of residence [21,27,37,38,39,41,43,43,44,45,47,48,49,50,51,52,53]; behavioural factors such as perceived usefulness, ownership of vehicles or previous experience with different modes of transport [38,39,41,43,44,47,53,54]; and some attitudes such as environmental concern, tech-savviness or attitude towards collaborative consumption [33,43,44,55]. Even though these variables were not part of the survey, they also have to be considered when developing strategies for an ecologically sustainable introduction of AVs.
Next to these general mobility preferences and their influencing factors, additional AV-related issues might contribute to our understanding of peoples’ preferences regarding different AV types. As trust in AVs increases with system experience [70], it might be easier for new users to build trust in PAVs based on repeated system experience with the same vehicle than trust in shared forms that will likely present users with different vehicles for each ride. In addition, with shared AV forms, trust becomes not only relevant in relation to an automated system, but also to other people [49]. Consequently, interpersonal distrust might represent a new usage barrier, especially for RSAVs. These considerations need to be further examined in future studies to determine the necessity of AV type-specific interventions increasing users’ trust, which is an important condition for the acceptance and adoption of automated systems [71,72], such as AVs [73,74].
Further, subgroup-specific strategies for motivating sustainable transportation mode choices in a transport system including AVs would benefit from considering additional individual characteristics beyond the scope of this study, such as age. This study was focused on persons aged 18 to 60 years, ensuring that all participants could potentially use all examined modes of transport (including cars). This focus could be expanded in two ways by future studies: First, dividing this relatively large age span into subgroups could help identify age-specific mobility needs and transportation mode changes that might be aggregated by the presented results. However, this approach would require a larger sample or omitting other independent variables to prevent undersized subsamples. Second, surveying age groups outside of this range, such as elderly persons, will provide important additional insights about the ecological sustainability of AVs. Such groups might differ greatly from this survey sample in terms of their mobility needs and current access to mobility; hence, differing transportation mode changes in the AV scenarios would be conceivable. Especially for older persons, additional motorized trips due to the possibilities provided by AVs could be expected, which would amplify the ecological rebound effect indicated by the presented results.

4.3. Practical Implications

The findings of the present study allow for some general recommendations for the design and the introduction of AVs into society.
It is important to acknowledge that, for an ecologically sustainable implementation of AVs, society should not aspire to the broad usage of any AV type. Even the most sustainable automated driving technology cannot meet the ecological sustainability of walking or going by bicycle. The expectable rebound effect from a society which only uses AVs should be prevented by promoting shared AV types, especially in the population of private car users (as the least sustainable form of transport). As comfort and time effectiveness play an important role for this population, it is important to design shared AVs that fulfil these needs as well as possible. This could be achieved, for example, by designing schedules as flexibly as possible, minimizing the effort required to use shared AVs by easy booking systems, creating feelings of privacy even when sharing rides, and by providing further advantages that normally come with private cars (e.g., storage of personal belongings in the car or in designated locations). Manufacturers could address such requirements by expanding their business models to Mobility as a Service offers such as apps for booking vehicles (as a user), devices for supervising vehicle status, or applications for the management of vehicle fleets [75].
As not all of the disadvantages of shared AV types, as compared to private AVs, can be eliminated, another important point is motivating users to choose them despite the possible disadvantages. This could be achieved, for example, through clear cost advantages compared to private Avs, or through other benefits when choosing shared types (e.g., benefit miles, tax reductions). However, this process will be a balancing act between making shared types of AV more attractive for current car users and preserving more sustainable modes such as walking or cycling as attractive alternatives.
This process of motivating potential users to use shared AV types should be supported by a corresponding development of knowledge regarding the sustainability effects of different transport modes and different AV types in society. Momentarily, cars with advanced driver assistance systems as predecessors of AVs are sold as vehicles for private use. At the same time, AVs are marketed as more sustainable forms of transport than those used today. These two factors could lead people to the false assumption that AVs are ecologically sustainable no matter how they are used. It is therefore important to educate potential future users about the sustainability-related disadvantages of private AVs. Additionally, it may be even more important to provide transport systems that work differently on a larger scale than the one we currently have. When private cars stop being symbolised as Status Quo in current and in future technologies, future users can start thinking about new forms of mobility and start to build new habits for themselves without relying mainly on private cars.
In sum, the results of this survey point out that AVs are not automatically a measure of creating ecologically sustainable transport systems. To prevent the behaviour-based rebound effects indicated in the presented results, the development and market introduction of AVs must be consciously designed for supporting environmentally-friendly transportation mode choices that also meet the needs of future road users. Most importantly, a shift from private to shared modes of transport is required for a significant reduction of resource consumption and transport sector emissions, which can be significantly supported by the advantages provided by AVs.

Author Contributions

Conceptualization, L.H. and F.H.; methodology, L.H. and F.H.; validation, F.H. and F.B.; formal analysis, L.H. and F.H.; investigation, L.H. and F.H.; resources, L.H., F.H. and F.B.; data curation, L.H.; writing—original draft preparation, L.H. and F.H.; writing—review and editing, F.B.; visualization, L.H.; supervision, F.H. and F.B.; project administration, F.H. and F.B.; funding acquisition, F.H. and F.B. All authors have read and agreed to the published version of the manuscript.

Funding

This research and the APC was funded by the German Federal Ministry of Education and Research (Bundesministerium für Bildung und Forschung), grant number 16SV8297.

Institutional Review Board Statement

The study was conducted in accordance with the Declaration of Helsinki. Ethical review and approval was not required for the non-interventional study on human participants in accordance with the local legislation and institutional requirements. All subjects provided their written informed consent to participate in this study and were guaranteed full data protection.

Informed Consent Statement

Informed consent was obtained from all subjects involved in the study.

Data Availability Statement

The data presented in this study are available on request from the corresponding author. The data are not publicly available due to local data privacy guidelines guaranteed to the subjects in the informed consent statement.

Acknowledgments

The authors would like to thank Madlen Günther and Vincent Joura for their generous support with the acquisition of participants.

Conflicts of Interest

The authors declare no conflict of interest. The funders had no role in the design of the study; in the collection, analyses, or interpretation of data; in the writing of the manuscript; or in the decision to publish the results.

Appendix A

Table A1. Origin and wording of measured items. Items were originally presented in German language.
VariableItemOrigin
Attitudes towards the three types of automated vehicles (PAV, SAV, RSAV)The introduction of private/shared/ride-shared fully automated vehicles is a good idea.Kostorz et al. (2019) [39]
Private/Shared/Ride-shared fully automated vehicles will play an important part of the transport system.Kostorz et al. (2019) [39]
Private/Shared/Ride-shared fully automated vehicles would make my everyday life easier.Kostorz et al. (2019) [39]
Driving a private/shared/ride-shared fully automated vehicle would be fun for me.Kostorz et al. (2019) [39]
Using a private/shared/ride-shared fully automated vehicle would satisfy my mobility needs.Own
Current and intended future mode choicePlease think of a typical week outside of pandemic-related restrictions (e.g., home office). What is the total number of trips you make in such a week?
Please indicate how many of the above routes you cover by which mode of transport.
Own
Imagine if private/shared/ride-shared fully automated vehicles were fully operational. How do you think your transport mode choice would change if there was also the possibility to use private/shared/ride-shared fully automated vehicles safely? Please indicate how many of your trips in a typical week you imagine you would make and by which mode of transport.Own
Mobility needsThe environmental friendliness of a mode of transport influences my transport mode choice.Cattaneo et al. (2018) [52]
The comfort of a mode of transport influences my transport mode choice.Cattaneo et al. (2018) [52]
The safety of a mode of transport influences my transport mode choice.Cattaneo et al. (2018) [52]
The costs associated with a mode of transport influence my transport mode choice.Own
The travel time associated with a mode of transport influences my transport mode choice.Own
Evaluation of the three types of automated vehicles in terms of their service attributes.Private fully automated vehicles are an environmentally friendly way of getting around.Own, following the items for mobility needs based on Cattaneo (2018) [52]
Private fully automated vehicles are a comfortable way of getting around.
Private fully automated vehicles are a safe way of getting around.
Private fully automated vehicles are a cheap way of getting around.
Private fully automated vehicles are a fast way of getting around.

Appendix B

Table A2. Information for the participants about the three types of automated vehicles. Items were originally presented in German language.
Type of Automated VehicleInformation
Automated driving in generalAutomated driving is understood to mean a vehicle that can either partially or fully take over driving tasks. When the driving task is taken over completely, so-called fully automated driving, a driver is no longer necessary.
Driver assistance systems are the preliminary stage to automated driving. They are already installed in many vehicles and take over selected completed parts of the driving task. Driver assistance systems are, for example, ASB & ESP, hill start assistants, distance control, (emergency) brake assistants, lane departure warning systems, turn-off assistants, drowsiness detection and similar systems.
Private automated
vehicle
(PAV)
Fully automated vehicles privately owned and available to the members of that private household (equivalent to conventional passenger cars)—i.e., you own a fully automated vehicle yourself that is available to you (and the members of your household) at all times.
Shared automated
vehicle
(SAV)
Fully automated vehicles owned by a municipality, community or company that can be booked e.g., via an app or by phone. They serve different passengers one after the other (equivalent to a taxi). There are no fixed stops, instead passengers are transported from door to door.—i.e., you book a fully automated vehicle as needed to pick you up from your starting point and take you to your desired destination. You are transported alone in the vehicle (plus any people you wish to take with you, if applicable).
Ride-shared
automated vehicle
(RSAV)
Fully automated vehicles owned by a community, municipality or company that can be booked e.g., via an app or by phone. They serve different passengers simultaneously by transporting passengers with similar origins & destinations together in one car (equivalent to a minibus). There are no fixed stops, instead strategic waypoints are selected where passengers can board. Care is taken to minimize the diversions and at the same time not to set the waypoints too far away from the starting point of the boarding passenger.—i.e., you book a fully automated vehicle that picks you up from a place close to your starting point (you can get there on foot or by bike, for example) and takes you to your desired destination. You are transported in the vehicle together with others (strangers) whose destinations are within a similar radius to yours.

References

  1. Brooks, C.E.P. Geological and Historical Aspects of Climatic Change. In Compendium of Meteorology, 1st ed.; Malone, T.F., Ed.; American Meteorological Society: Boston, MA, USA, 1951; pp. 1004–1018. ISBN 978-1-940033-70-9. [Google Scholar]
  2. United Nations Paris Agreement; United Nations Treaty Collection. 2015. Available online: https://www.un.org/en/node/84376 (accessed on 26 November 2022).
  3. Statista. Global Climate Change; Statista: Hamburg, Germany, 2021; Available online: https://www.statista.com/study/10974/climate-change--statista-dossier/ (accessed on 26 November 2022).
  4. BMU. Klimaschutzplan 2050. Klimaschutzpolitische Grundsätze und Ziele der Bundesregierung, 2nd ed.; BMU: Berling, Germany, 2016. [Google Scholar]
  5. Statista. Klimawandel; Statista: Hamburg, Germany, 2020; Available online: https://de.statista.com/statistik/studie/id/41248/dokument/klimawandel/ (accessed on 26 November 2022).
  6. BMDV. Förderrichtlinie “Ein Zukunftsfähiges, Nachhaltiges Mobilitätssystem Durch Automatisiertes Fahren Und Vernetzung”; BMDV: Berlin, Germany, 2019.
  7. Mora, L.; Wu, X.; Panori, A. Mind the Gap: Developments in Autonomous Driving Research and the Sustainability Challenge. J. Clean. Prod. 2020, 275, 124087. [Google Scholar] [CrossRef]
  8. Williams, E.; Das, V.; Fisher, A. Assessing the Sustainability Implications of Autonomous Vehicles: Recommendations for Research Community Practice. Sustainability 2020, 12, 1902. [Google Scholar] [CrossRef] [Green Version]
  9. SAE International. Surface Vehicle Recommended Practice: (R) Taxonomy and Definitions for Terms Related to Driving Automation Systems for On-Road Motor Vehicles, 1st ed.; SAE: Warrendale, PA, USA; Zürich, Switzerland, 2021; Available online: https://www.sae.org/standards/content/j3016_202104/ (accessed on 26 November 2022).
  10. Kyriakidis, M.; de Winter, J.C.F.; Stanton, N.; Bellet, T.; van Arem, B.; Brookhuis, K.; Martens, M.H.; Bengler, K.; Andersson, J.; Merat, N.; et al. A Human Factors Perspective on Automated Driving. Theor. Issues Ergon. Sci. 2019, 20, 223–249. [Google Scholar] [CrossRef]
  11. Hartwich, F.; Schmidt, C.; Gräfing, D.; Krems, J.F. In the Passenger Seat: Differences in the Perception of Human vs. Automated Vehicle Control and Resulting HMI Demands of Users. In HCI in Mobility, Transport, and Automotive Systems. Automated Driving and In-Vehicle Experience Design; Krömker, H., Ed.; Lecture Notes in Computer Science; Springer International Publishing: Cham, Switzerland, 2020; Volume 12212, pp. 31–45. ISBN 978-3-030-50522-6. [Google Scholar]
  12. Strauch, C.; Mühl, K.; Patro, K.; Grabmaier, C.; Reithinger, S.; Baumann, M.; Huckauf, A. Real Autonomous Driving from a Passenger’s Perspective: Two Experimental Investigations Using Gaze Behaviour and Trust Ratings in Field and Simulator. Transp. Res. Part F Traffic Psychol. Behav. 2019, 66, 15–28. [Google Scholar] [CrossRef]
  13. Elbanhawi, M.; Simic, M.; Jazar, R. In the Passenger Seat: Investigating Ride Comfort Measures in Autonomous Cars. IEEE Intell. Transp. Syst. Mag. 2015, 7, 4–17. [Google Scholar] [CrossRef]
  14. Hartwich, F.; Beggiato, M.; Krems, J.F. Driving Comfort, Enjoyment and Acceptance of Automated Driving—Effects of Drivers’ Age and Driving Style Familiarity. Ergonomics 2018, 61, 1017–1032. [Google Scholar] [CrossRef]
  15. Beggiato, M.; Hartwich, F.; Roßner, P.; Dettmann, A.; Enhuber, S.; Pech, T.; Gesmann-Nuissl, D.; Mößner, K.; Bullinger, A.C.; Krems, J. KomfoPilot—Comfortable Automated Driving. In Smart Automotive Mobility; Meixner, G., Ed.; Human–Computer Interaction Series; Springer International Publishing: Cham, Switzerland, 2020; pp. 71–154. ISBN 978-3-030-45130-1. [Google Scholar]
  16. Hartwich, F.; Hollander, C.; Johannmeyer, D.; Krems, J.F. Improving Passenger Experience and Trust in Automated Vehicles through User-Adaptive HMIs: “The More the Better” Does Not Apply to Everyone. Front. Hum. Dyn. 2021, 3, 669030. [Google Scholar] [CrossRef]
  17. Wintersberger, P.; Frison, A.-K.; Riener, A.; Sawitzky, T. von Fostering User Acceptance and Trust in Fully Automated Vehicles: Evaluating the Potential of Augmented Reality. Presence Teleoper. Virtual Environ. 2018, 27, 46–62. [Google Scholar] [CrossRef]
  18. Hensch, A.-C.; Kreißig, I.; Beggiato, M.; Krems, J.F. The Effect of EHMI Malfunctions on Younger and Elderly Pedestrians’ Trust and Acceptance of Automated Vehicle Communication Signals. Front. Psychol. 2022, 13, 866475. [Google Scholar] [CrossRef]
  19. Hensch, A.-C.; Neumann, I.; Beggiato, M.; Halama, J.; Krems, J.F. Effects of a Light-Based Communication Approach as an External HMI for Automated Vehicles—A Wizard-of-Oz Study. ToTS 2020, 10, 18–32. [Google Scholar] [CrossRef] [Green Version]
  20. Harb, M.; Stathopoulos, A.; Shiftan, Y.; Walker, J.L. What Do We (Not) Know about Our Future with Automated Vehicles? Transp. Res. Part C Emerg. Technol. 2021, 123, 102948. [Google Scholar] [CrossRef]
  21. Pakusch, C. Technology Assessment of Autonomous Driving—Are Shared Autonomous Vehicles Ecologically and Socially Sustainable? Ph.D. Dissertation, Universität Siegen, Siegen, Germany, 2020. [Google Scholar]
  22. Stocker, A.; Shaheen, S. Shared Automated Vehicles: Review of Business Models; International Transport Forum Discussion Paper; Organisation for Economic Co-Operation and Development (OECD): Paris, France, 2017; Volume 9. [Google Scholar]
  23. Igliński, H.; Babiak, M. Analysis of the Potential of Autonomous Vehicles in Reducing the Emissions of Greenhouse Gases in Road Transport. Procedia Eng. 2017, 192, 353–358. [Google Scholar] [CrossRef]
  24. Taiebat, M.; Brown, A.L.; Safford, H.R.; Qu, S.; Xu, M. A Review on Energy, Environmental, and Sustainability Implications of Connected and Automated Vehicles. Environ. Sci. Technol. 2018, 52, 11449–11465. [Google Scholar] [CrossRef]
  25. Wadud, Z.; MacKenzie, D.; Leiby, P. Help or Hindrance? The Travel, Energy and Carbon Impacts of Highly Automated Vehicles. Transp. Res. Part A Policy Pract. 2016, 86, 1–18. [Google Scholar] [CrossRef] [Green Version]
  26. Fox-Penner, P.; Gorman, W.; Hatch, J. Long-Term U.S Transportation Electricity Use Considering the Effect of Autonomous-Vehicles: Estimates & Policy Observations. Energy Policy 2018, 122, 203–213. [Google Scholar] [CrossRef]
  27. Fulton, L.; Kothawala, A.; Compostella, J. Estimating the Costs of New Mobility Travel Options: Monetary and Non-Monetary Factors; The National Academies of Sciences, Engineering, and Medicine: Washington, DC, USA, 2021. [Google Scholar] [CrossRef]
  28. Vleugel, J.M.; Bal, F. More Space and Improved Living Conditions in Cities with Autonomous Vehicles. Int. J. Des. Nat. Ecodyn. 2018, 12, 505–515. [Google Scholar] [CrossRef]
  29. Fagnant, D.J.; Kockelman, K.M. The Travel and Environmental Implications of Shared Autonomous Vehicles, Using Agent-Based Model Scenarios. Transp. Res. Part C Emerg. Technol. 2014, 40, 1–13. [Google Scholar] [CrossRef]
  30. Porter, L.; Stone, J.; Legacy, C.; Curtis, C.; Harris, J.; Fishman, E.; Kent, J.; Marsden, G.; Reardon, L.; Stilgoe, J. The Autonomous Vehicle Revolution: Implications for Planning/The Driverless City?/Autonomous Vehicles—A Planner’s Response/Autonomous Vehicles: Opportunities, Challenges and the Need for Government Action/Three Signs Autonomous Vehicles Will Not Lead to Less Car Ownership and Less Car Use in Car Dependent Cities—A Case Study of Sydney, Australia/Planning for Autonomous Vehicles? Questions of Purpose, Place and Pace/Ensuring Good Governance: The Role of Planners in the Development of Autonomous Vehicles/Putting Technology in Its Place. Plan. Theory Pract. 2018, 19, 753–778. [Google Scholar] [CrossRef]
  31. Gruel, W.; Stanford, J.M. Assessing the Long-Term Effects of Autonomous Vehicles: A Speculative Approach. Transp. Res. Procedia 2016, 13, 18–29. [Google Scholar] [CrossRef] [Green Version]
  32. Kim, S.H.; Mokhtarian, P.L.; Circella, G. How, and for Whom, Will Activity Patterns Be Modified by Self-Driving Cars? Expectations from the State of Georgia. Transp. Res. Part F Traffic Psychol. Behav. 2020, 70, 68–80. [Google Scholar] [CrossRef]
  33. Haboucha, C.J.; Ishaq, R.; Shiftan, Y. User Preferences Regarding Autonomous Vehicles. Transp. Res. Part C Emerg. Technol. 2017, 78, 37–49. [Google Scholar] [CrossRef]
  34. Martin, G. An Ecosocial Frame for Autonomous Vehicles. Capital. Nat. Social. 2019, 30, 55–70. [Google Scholar] [CrossRef]
  35. Pakusch, C.; Stevens, G.; Boden, A.; Bossauer, P. Unintended Effects of Autonomous Driving: A Study on Mobility Preferences in the Future. Sustainability 2018, 10, 2404. [Google Scholar] [CrossRef] [Green Version]
  36. Nobis, C.; Kuhnimhof, T. Mobilität in Deutschland—MiD Ergebnisbericht. Studie von Infas, DLR, IVT Und Infas 360 Im Auftrag Des Bundesministers Für Verkehr Und Digitale Infrastruktur (FE-Nr. 70.904/15); MiD: Bonn Germany, 2019; Available online: http://www.mobilitaet-in-deutschland.de/publikationen2017.html (accessed on 26 November 2022).
  37. AUDI AG. The Pulse of Autonomous Driving; AUDI AG: Ingolstadt, Germany, 2019; Available online: https://www.audi-mediacenter.com/de/publikationen/weitere/the-pulse-of-autonomous-driving-langversion-842 (accessed on 26 November 2022).
  38. König, M.; Neumayr, L. Users’ Resistance towards Radical Innovations: The Case of the Self-Driving Car. Transp. Res. Part F Traffic Psychol. Behav. 2017, 44, 42–52. [Google Scholar] [CrossRef]
  39. Kostorz, N.; Hilgert, T.; Kagerbauer, M. Automatisierte Kleinbusse Im Öffentlichen Personennahverkehr—Akzeptanz Und Nutzungsintentionen in Deutschland. JMV 2019, 2, 23–32. [Google Scholar] [CrossRef]
  40. Winter, K.; Cats, O.; Martens, K.; van Arem, B. Identifying User Classes for Shared and Automated Mobility Services. Eur. Transp. Res. Rev. 2020, 12, 36. [Google Scholar] [CrossRef]
  41. Krueger, R.; Rashidi, T.H.; Rose, J.M. Preferences for Shared Autonomous Vehicles. Transp. Res. Part C Emerg. Technol. 2016, 69, 343–355. [Google Scholar] [CrossRef]
  42. Pakusch, C.; Stevens, G.; Bossauer, P. Shared Autonomous Vehicles: Potentials for a Sustainable Mobility and Risks of Unintended Effects. EPiC Ser. Comput. 2018, 52, 258–269. [Google Scholar]
  43. Dias, F.F.; Lavieri, P.S.; Garikapati, V.M.; Astroza, S.; Pendyala, R.M.; Bhat, C.R. A Behavioral Choice Model of the Use of Car-Sharing and Ride-Sourcing Services. Transportation 2017, 44, 1307–1323. [Google Scholar] [CrossRef]
  44. Chee, P.N.E.; Susilo, Y.O.; Wong, Y.D. Determinants of Intention-to-Use First-/Last-Mile Automated Bus Service. Transp. Res. Part A Policy Pract. 2020, 139, 350–375. [Google Scholar] [CrossRef]
  45. Shabanpour, R.; Golshani, N.; Shamshiripour, A.; Mohammadian, A. Eliciting Preferences for Adoption of Fully Automated Vehicles Using Best-Worst Analysis. Transp. Res. Part C Emerg. Technol. 2018, 93, 463–478. [Google Scholar] [CrossRef]
  46. Lavieri, P.S.; Garikapati, V.M.; Bhat, C.R.; Pendyala, R.M.; Astroza, S.; Dias, F.F. Modeling Individual Preferences for Ownership and Sharing of Autonomous Vehicle Technologies. Transp. Res. Rec. 2017, 2665, 1–10. [Google Scholar] [CrossRef] [Green Version]
  47. Bernhard, C.; Oberfeld, D.; Hoffmann, C.; Weismüller, D.; Hecht, H. User Acceptance of Automated Public Transport. Transp. Res. Part F Traffic Psychol. Behav. 2020, 70, 109–123. [Google Scholar] [CrossRef]
  48. Kaye, S.-A.; Lewis, I.; Buckley, L.; Gauld, C.; Rakotonirainy, A. To Share or Not to Share: A Theoretically Guided Investigation of Factors Predicting Intentions to Use Fully Automated Shared Passenger Shuttles. Transp. Res. Part F Traffic Psychol. Behav. 2020, 75, 203–213. [Google Scholar] [CrossRef]
  49. Lavieri, P.S.; Bhat, C.R. Modeling Individuals’ Willingness to Share Trips with Strangers in an Autonomous Vehicle Future. Transp. Res. Part A Policy Pract. 2019, 124, 242–261. [Google Scholar] [CrossRef]
  50. Barbour, N.; Menon, N.; Zhang, Y.; Mannering, F. Shared Automated Vehicles: A Statistical Analysis of Consumer Use Likelihoods and Concerns. Transp. Policy 2019, 80, 86–93. [Google Scholar] [CrossRef]
  51. Behren, S.; Minster, C.; Magdolen, M.; Chlond, B.; Hunecke, M.; Vortisch, P. Bringing Travel Behavior and Attitudes Together: An Integrated Survey Approach for Clustering Urban Mobility Types. In Proceedings of the TRB 97th Annual Meeting Compendium of Papers, Washington, WA, USA, 7–11 January 2018; Volume 22. [Google Scholar]
  52. Cattaneo, M.; Malighetti, P.; Morlotti, C.; Paleari, S. Students’ Mobility Attitudes and Sustainable Transport Mode Choice. IJSHE 2018, 19, 942–962. [Google Scholar] [CrossRef]
  53. Acheampong, R.A.; Cugurullo, F. Capturing the Behavioural Determinants behind the Adoption of Autonomous Vehicles: Conceptual Frameworks and Measurement Models to Predict Public Transport, Sharing and Ownership Trends of Self-Driving Cars. Transp. Res. Part F Traffic Psychol. Behav. 2019, 62, 349–375. [Google Scholar] [CrossRef] [Green Version]
  54. Bamberg, S.; Ajzen, I.; Schmidt, P. Choice of Travel Mode in the Theory of Planned Behavior: The Roles of Past Behavior, Habit, and Reasoned Action. Basic Appl. Soc. Psychol. 2003, 25, 175–187. [Google Scholar] [CrossRef]
  55. Billows, G.; McNeill, L. Consumer Attitude and Behavioral Intention toward Collaborative Consumption of Shared Services. Sustainability 2018, 10, 4468. [Google Scholar] [CrossRef] [Green Version]
  56. Kuppam, A.R.; Pendyala, R.M.; Rahman, S. Analysis of the Role of Traveler Attitudes and Perceptions in Explaining Mode-Choice Behavior. Transp. Res. Rec. 1999, 1676, 68–76. [Google Scholar] [CrossRef]
  57. Rahimi, A.; Azimi, G.; Jin, X. Examining Human Attitudes toward Shared Mobility Options and Autonomous Vehicles. Transp. Res. Part F Traffic Psychol. Behav. 2020, 72, 133–154. [Google Scholar] [CrossRef]
  58. Bai, T.; Li, X.; Sun, Z. Effects of Cost Adjustment on Travel Mode Choice: Analysis and Comparison of Different Logit Models. Transp. Res. Procedia 2017, 25, 2649–2659. [Google Scholar] [CrossRef]
  59. Ha, J.; Lee, S.; Ko, J. Unraveling the Impact of Travel Time, Cost, and Transit Burdens on Commute Mode Choice for Different Income and Age Groups. Transp. Res. Part A Policy Pract. 2020, 141, 147–166. [Google Scholar] [CrossRef]
  60. Ye, M.; Zeng, S.; Yang, G.; Chen, Y. Identification of Contributing Factors on Travel Mode Choice among Different Resident Types with Bike-sharing as an Alternative. IET Intell. Transp. Syst. 2020, 14, 639–646. [Google Scholar] [CrossRef]
  61. IBM Corp. IBM SPSS Statistics for Windows, Version 29.0; IBM Corp.: Armonk, NY, USA, 2022. [Google Scholar]
  62. R Core Team. R: A Language and Environment for Statistical Computing; R Foundation for Statistical Computing: Vienna, Austria, 2021; Available online: https://www.R-project.org/ (accessed on 11 October 2022).
  63. RStudio Team. RStudio: Integrated Development for R; RStudio (Now Posit): Boston, MA, USA, 2021; Available online: http://www.rstudio.com/ (accessed on 11 October 2022).
  64. Ye, J.; Chen, J.; Bai, H.; Yue, Y. Analyzing Transfer Commuting Attitudes Using a Market Segmentation Approach. Sustainability 2018, 10, 2194. [Google Scholar] [CrossRef] [Green Version]
  65. Andrei, L.; Luca, O.; Gaman, F. Insights from User Preferences on Automated Vehicles: Influence of Socio-Demographic Factors on Value of Time in Romania Case. Sustainability 2022, 14, 10828. [Google Scholar] [CrossRef]
  66. Oxley, J.; Logan, D.B.; Coxon, S.; Koppel, S. Understanding Current and Future Transport Needs of Older Australian Drivers to Guide Development of Sustainable and Smart Initiatives to Support Safe Mobility of Older Adults. Sustainability 2022, 14, 5906. [Google Scholar] [CrossRef]
  67. Klöckner, C.A. A Comprehensive Model of the Psychology of Environmental Behaviour—A Meta-Analysis. Glob. Environ. Chang. 2013, 23, 1028–1038. [Google Scholar] [CrossRef] [Green Version]
  68. Armitage, C.J.; Conner, M. Efficacy of the Theory of Planned Behaviour: A Meta-Analytic Review. Br. J. Soc. Psychol. 2001, 40, 471–499. [Google Scholar] [CrossRef] [Green Version]
  69. Sheeran, P.; Webb, T.L. The Intention-Behavior Gap: The Intention-Behavior Gap. Soc. Personal. Psychol. Compass 2016, 10, 503–518. [Google Scholar] [CrossRef]
  70. Hartwich, F.; Witzlack, C.; Beggiato, M.; Krems, J.F. The First Impression Counts—A Combined Driving Simulator and Test Track Study on the Development of Trust and Acceptance of Highly Automated Driving. Transp. Res. Part F Traffic Psychol. Behav. 2019, 65, 522–535. [Google Scholar] [CrossRef]
  71. Parasuraman, R.; Riley, V. Humans and Automation: Use, Misuse, Disuse, Abuse. Hum. Factors 1997, 39, 230–253. [Google Scholar] [CrossRef]
  72. Lee, J.D.; See, K.A. Trust in Automation: Designing for Appropriate Reliance. Hum. Factors J. Hum. Factors Ergon. Soc. 2004, 46, 50–80. [Google Scholar] [CrossRef] [PubMed] [Green Version]
  73. Choi, J.K.; Ji, Y.G. Investigating the Importance of Trust on Adopting an Autonomous Vehicle. Int. J. Hum.-Comput. Interact. 2015, 31, 692–702. [Google Scholar] [CrossRef]
  74. Xu, Z.; Zhang, K.; Min, H.; Wang, Z.; Zhao, X.; Liu, P. What Drives People to Accept Automated Vehicles? Findings from a Field Experiment. Transp. Res. Part C Emerg. Technol. 2018, 95, 320–334. [Google Scholar] [CrossRef]
  75. Cacilo, A.; Haag, M. Beschäftigungswirkungen der Fahrzeugdigitalisierung. Wirkungen der Digitalisierung und Fahrzeugautomatisierung auf Wertschöpfung und Beschäftigung; Hans-Böckler-Stiftung: Düsseldorf, Germany, 2018. [Google Scholar]
Figure 1. Current mode choice: (a) Proportion of weekly trips made per mode of transport, averaged across all participants; (b) Proportion of participants using the respective mode as their main mode of transport (n = 136). Others: ≤1% in all conditions.
Sustainability 15 05056 g001
Figure 2. Mobility needs, i.e., relevance of different service attributes on transportation mode choice: (a) averaged across all participants (n = 136); (b) separated by current main modes of transport (n = 131).
Sustainability 15 05056 g002
Figure 3. Attitude towards the different AV types separated by current main modes of transport (error bars = 95% confidence interval; n = 131).
Sustainability 15 05056 g003
Figure 4. Intention to use the different AV types in percentage of expected trips made with the respective AV type separated by current main modes of transport (error bars = 95% confidence interval; n = 131).
Sustainability 15 05056 g004
Figure 5. Current vs. expected transportation mode choices: proportion of weekly trips made per mode of transport in four different scenarios, averaged across all participants (n = 136). Arrows indicate mode changes towards automated types between the current situation (present) and each future AV scenario. Others: ≤1% in all conditions.
Sustainability 15 05056 g005
Figure 6. Ecological sustainability of current vs. expected transportation mode choices: proportion of weekly trips made per mode of transport in four different scenarios, averaged across all participants and rated in terms of ecological impact (n = 136). Others: ≤1% in all conditions.
Sustainability 15 05056 g006
Figure 7. Expected fulfilment of mobility needs through different types of fully automated vehicles: relevance of mobility needs and expected level of service attributes, separated by current main modes of transport: (a) private car (n = 39); (b) public transport (n = 41); (c) bicycle (n = 24), (d) walking (n = 27); (n = 131).
Sustainability 15 05056 g007
Table 1. Ecological sustainability ranking of different modes of transport (higher numbers represent comparably higher sustainability).
Mode of TransportEcological SustainabilityCorresponding AV Type
Walking6
Bicycle/E-Bike5
Public transport/
Ride-sharing
4Ride-shared automated vehicle (RSAV)
Car-sharing3Shared automated vehicle (SAV)
Taxi2
Private car1Private automated vehicle (PAV)
Table 2. Demographic comparison of the survey sample with the “Mobility in Germany” respondents [36].
Sample AttributeSurvey Sample
(n = 136)
”Mobility in Germany” Sample
(n = 316.361)
Mean age in years26.143.6
Gender (share of females)76.5%50.7%
Prevalent education degreeHigh school (52.9%)Secondary school (25.0%)
Prevalent occupationStudent (69.9%)Full-time employee (33.1%)
Share of participants holding driver’s license93.4%Only car: 86.6%
Table 3. Mobility behavioural comparison of the survey sample with the “Mobility in Germany” respondents [36].
Sample AttributeSurvey Sample
(n = 136)
“Mobility in Germany” Sample (n = 316.361)
Mean trips per week/person21.221.7
Modal split: trips by car26.9%57%
Modal split: trips by public transport25.1%10%
Modal split: trips by bicycle16.6%11%
Modal split: trips by walking27.2%22%
Table 4. Demographics of the subsamples formed by different main modes of transport.
Main Mode of TransportnMean Age (SD)Gender:
Share of Females
Prevalent
Occupation
Walking2725.4 (5.3)81.5%Student (81.5%)
Bicycle/E-Bike2428.7 (7.8)70.8%Student (50.0%)
Public transport/Ride-sharing4122.3 (3.8)80.5%Student (95.1%)
Private car3929.3 (10.1)71.8%Student (46.2%)
Car-sharing425.5 (6.1)75.0%Student (75.0%)
Others119.0 (n.a.)100.0%Student (100.0%)
All13626.176.5%Student (69.9%)
Table 5. ANOVA results on the effects of fully automated vehicle mode (AV mode) and current main mode of transport (T mode) on the expected fulfilment of mobility needs by AVs.
NeedEffectdfFpηp2
environmental
friendliness
AV mode(1.80, 228.33)222.97<0.001 ***0.64
T mode(3, 127)1.980.1200.05
AV mode × T mode(5.39, 228.33)4.37<0.001 ***0.10
time effectivenessAV mode(1.70, 216.22)11.62<0.001 ***0.09
T mode(3, 127)2.860.04 *0.06
AV mode × T mode(5.11, 216.22)1.640.1480.04
cost effectivenessAV mode(1.83, 231.98)187.56<0.001 ***0.60
T mode(3, 127)0.250.8620.01
AV mode × T mode(5.48, 231.98)6.56<0.001 ***0.13
safetyAV mode(1.64, 207.98)1.140.3130.01
T mode(3, 127)2.190.0940.05
AV mode × T mode(4.91, 207.98)0.900.4840.02
comfortAV mode(1.84, 233.93)53.92<0.001 ***0.30
T mode(3, 127)2.140.0990.05
AV mode × T mode(5.53, 233.93)0.510.7840.01
* p < 0.05, *** p < 0.001.
Disclaimer/Publisher’s Note: The statements, opinions and data contained in all publications are solely those of the individual author(s) and contributor(s) and not of MDPI and/or the editor(s). MDPI and/or the editor(s) disclaim responsibility for any injury to people or property resulting from any ideas, methods, instructions or products referred to in the content.

